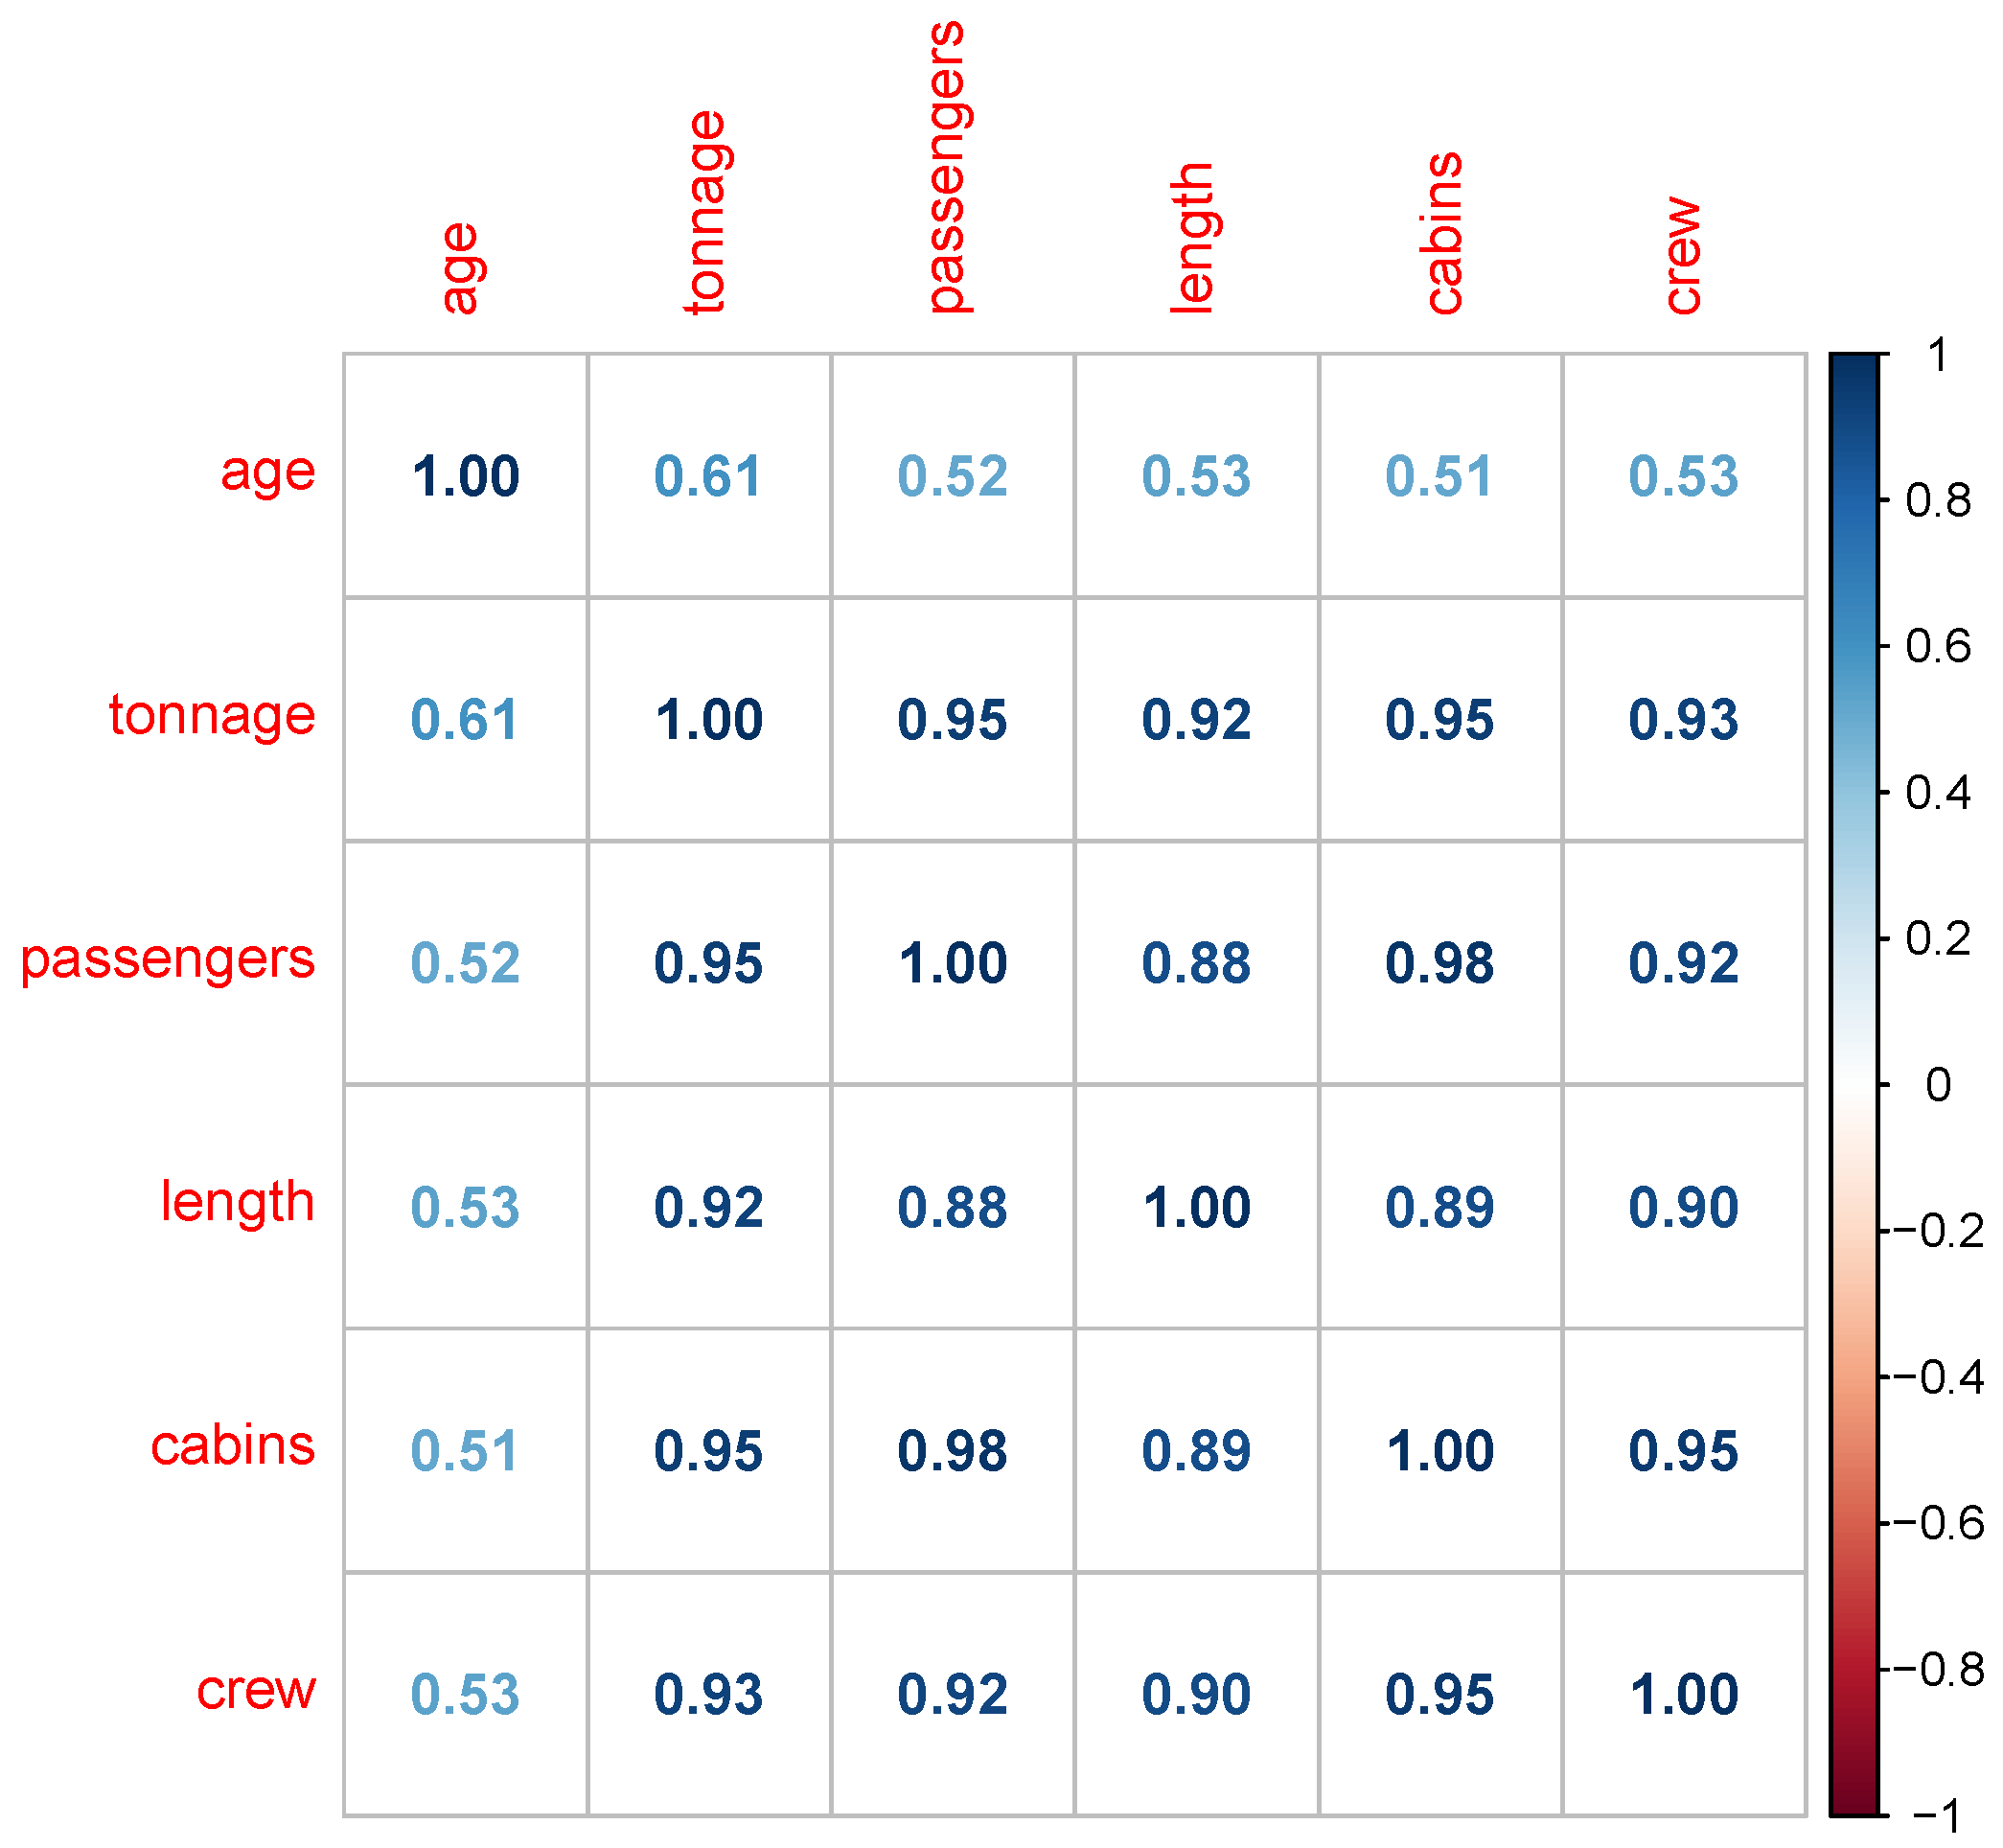
Figure 1.
Correlation plot for cruise ship info data.
Figure 1.
Correlation plot for cruise ship info data.
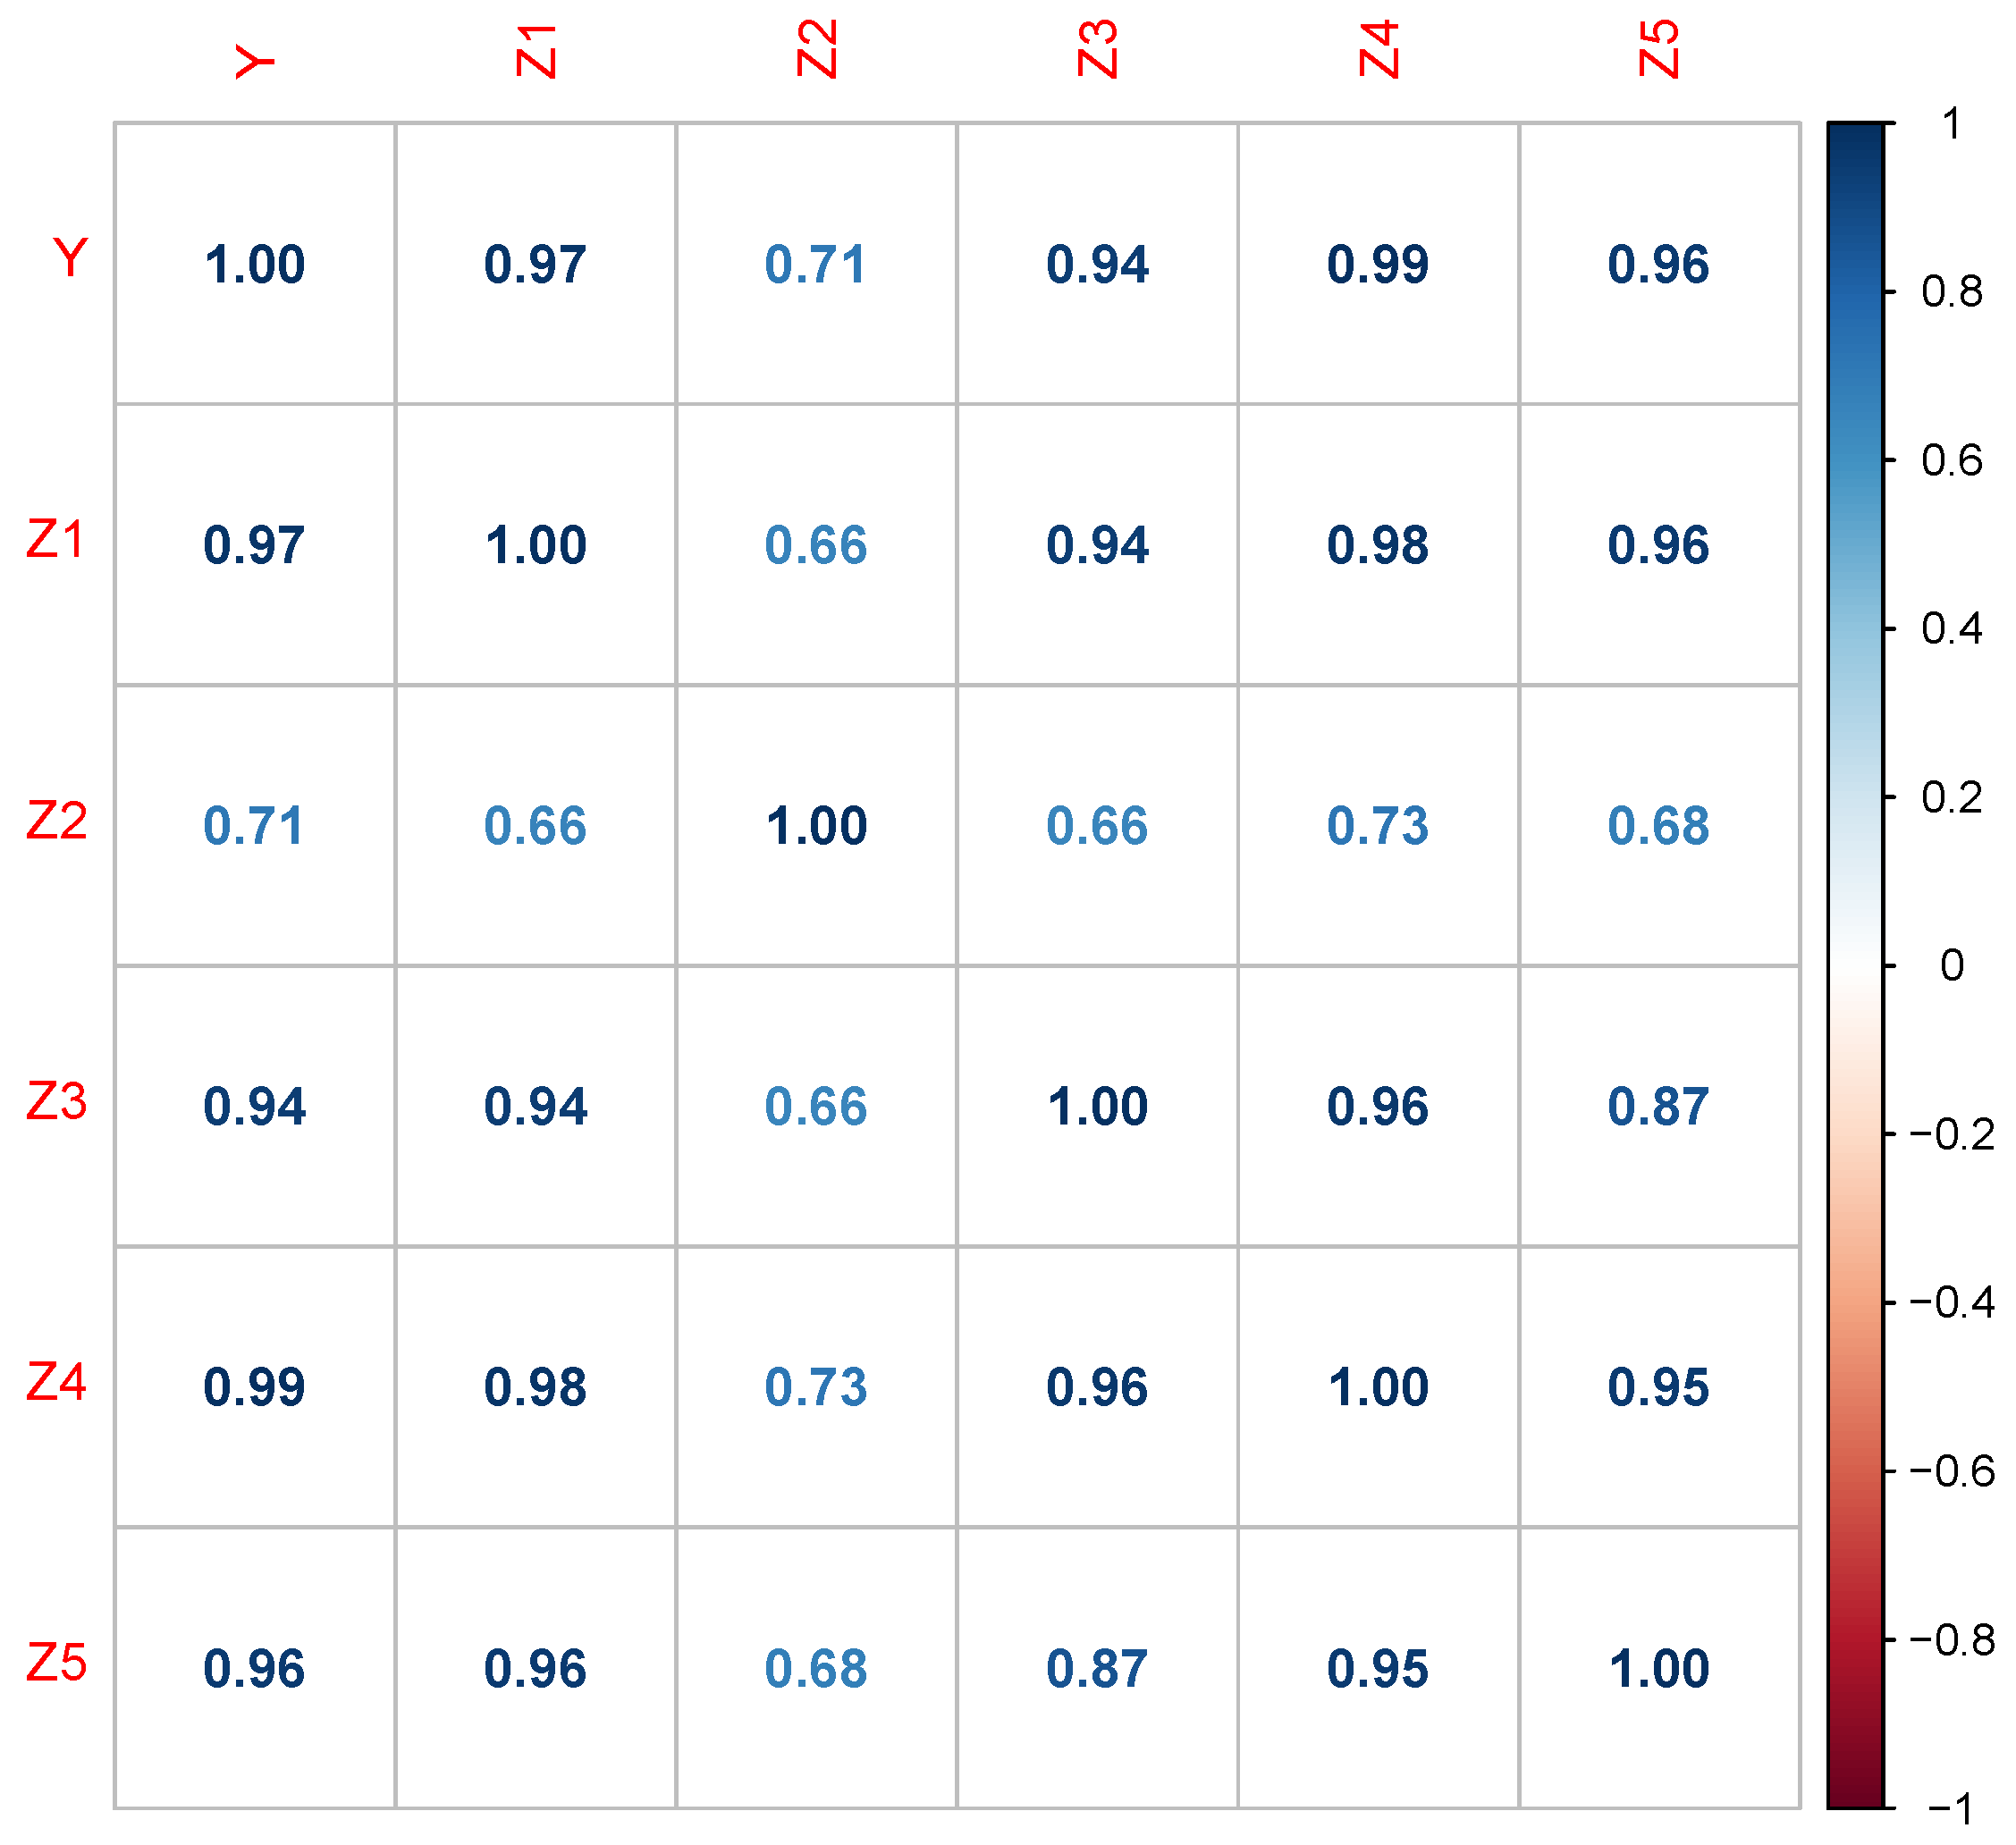
Figure 2.
Correlation plot for economic survey data of Pakistan.
Figure 2.
Correlation plot for economic survey data of Pakistan.
Table 1.
Estimated MSEs considering = 0.90, p = 4, and n = 25, 50, and 100 (superscript represents ranks).
Table 1.
Estimated MSEs considering = 0.90, p = 4, and n = 25, 50, and 100 (superscript represents ranks).
| | | | | | | = 0.90 | | | | | |
|---|
| | n | OLS | HK | KGM | KMS | MKED | KSM | MK | NIS1 | NIS2 | NIS3 |
|---|
| N(0,1) | | | | | | | | | | | |
| | 25 |
|
|
|
|
|
|
|
|
|
|
| | 50 |
|
|
|
|
|
|
|
|
|
|
| | 100 |
|
|
|
|
|
|
|
|
|
|
| N(0,5) | | | | | | | | | | | |
| | 25 |
|
|
|
|
|
|
|
|
|
|
| | 50 |
|
|
|
|
|
|
|
|
|
|
| | 100 |
|
|
|
|
|
|
|
|
|
|
| N(0,10) | | | | | | | | | | | |
| | 25 |
|
|
|
|
|
|
|
|
|
|
| | 50 |
|
|
|
|
|
|
|
|
|
|
| | 100 |
|
|
|
|
|
|
|
|
|
|
| N(0,16) | | | | | | | | | | | |
| | 25 |
|
|
|
|
|
|
|
|
|
|
| | 50 |
|
|
|
|
|
|
|
|
|
|
| | 100 |
|
|
|
|
|
|
|
|
|
|
| | ∑ Ranks |
|
|
|
|
|
|
|
|
|
|
Table 2.
Estimated MSEs considering = 0.95, p = 4, and n = 25, 50, and 100 (superscript represents ranks).
Table 2.
Estimated MSEs considering = 0.95, p = 4, and n = 25, 50, and 100 (superscript represents ranks).
| | | | | | | = 0.95 | | | | | |
|---|
| | n | OLS | HK | KGM | KMS | MKED | KSM | MK | NIS1 | NIS2 | NIS3 |
|---|
| N(0,1) | | | | | | | | | | | |
| | 25 |
|
|
|
|
|
|
|
|
|
|
| | 50 |
|
|
|
|
|
|
|
|
|
|
| | 100 |
|
|
|
|
|
|
|
|
|
|
| N(0,5) | | | | | | | | | | | |
| | 25 |
|
|
|
|
|
|
|
|
|
|
| | 50 |
|
|
|
|
|
|
|
|
|
|
| | 100 |
|
|
|
|
|
|
|
|
|
|
| N(0,10) | | | | | | | | | | | |
| | 25 |
|
|
|
|
|
|
|
|
|
|
| | 50 |
|
|
|
|
|
|
|
|
|
|
| | 100 |
|
|
|
|
|
|
|
|
|
|
| N(0,16) | | | | | | | | | | | |
| | 25 |
|
|
|
|
|
|
|
|
|
|
| | 50 |
|
|
|
|
|
|
|
|
|
|
| | 100 |
|
|
|
|
|
|
|
|
|
|
| | ∑ Ranks |
|
|
|
|
|
|
|
|
|
|
Table 3.
Estimated MSEs considering = 0.99, p = 4, and n = 25, 50, and 100 (superscript represents ranks).
Table 3.
Estimated MSEs considering = 0.99, p = 4, and n = 25, 50, and 100 (superscript represents ranks).
| | | | | | | = 0.99 | | | | | |
|---|
| | n | OLS | HK | KGM | KMS | MKED | KSM | MK | NIS1 | NIS2 | NIS3 |
|---|
| N(0,1) | | | | | | | | | | | |
| | 25 |
|
|
|
|
|
|
|
|
|
|
| | 50 |
|
|
|
|
|
|
|
|
|
|
| | 100 |
|
|
|
|
|
|
|
|
|
|
| N(0,5) | | | | | | | | | | | |
| | 25 |
|
|
|
|
|
|
|
|
|
|
| | 50 |
|
|
|
|
|
|
|
|
|
|
| | 100 | 10,112.07 |
|
|
|
|
|
|
|
|
|
| N(0,10) | | | | | | | | | | | |
| | 25 | 10,436.42 |
|
|
|
|
|
|
|
|
|
| | 50 |
|
|
|
|
|
|
|
|
|
|
| | 100 | 11,664.01 |
|
|
|
|
|
|
|
|
|
| N(0,16) | | | | | | | | | | | |
| | 25 | 16,087.81 |
|
|
|
|
|
|
|
|
|
| | 50 |
|
|
|
|
|
|
|
|
|
|
| | 100 | 13,716.58 |
|
|
|
|
|
|
|
|
|
| | ∑ Ranks |
|
|
|
|
|
|
|
|
|
|
Table 4.
Estimated MSEs considering = 0.90, p = 8, and n = 25, 50, and 100 (superscript represents ranks).
Table 4.
Estimated MSEs considering = 0.90, p = 8, and n = 25, 50, and 100 (superscript represents ranks).
| | | | | | | = 0.90 | | | | | |
|---|
| | n | OLS | HK | KGM | KMS | MKED | KSM | MK | NIS1 | NIS2 | NIS3 |
|---|
| N(0,1) | | | | | | | | | | | |
| | 25 |
|
|
|
|
|
|
|
|
|
|
| | 50 |
|
|
|
|
|
|
|
|
|
|
| | 100 |
|
|
|
|
|
|
|
|
|
|
| N(0,5) | | | | | | | | | | | |
| | 25 |
|
|
|
|
|
|
|
|
|
|
| | 50 |
|
|
|
|
|
|
|
|
|
|
| | 100 |
|
|
|
|
|
|
|
|
|
|
| N(0,10) | | | | | | | | | | | |
| | 25 |
|
|
|
|
|
|
|
|
|
|
| | 50 |
|
|
|
|
|
|
|
|
|
|
| | 100 |
|
|
|
|
|
|
|
|
|
|
| N(0,16) | | | | | | | | | | | |
| | 25 |
|
|
|
|
|
|
|
|
|
|
| | 50 |
|
|
|
|
|
|
|
|
|
|
| | 100 |
|
|
|
|
|
|
|
|
|
|
| | ∑ Ranks |
|
|
|
|
|
|
|
|
|
|
Table 5.
Estimated MSEs considering = 0.95, p = 8, and n = 25, 50, and 100 (superscript represents ranks).
Table 5.
Estimated MSEs considering = 0.95, p = 8, and n = 25, 50, and 100 (superscript represents ranks).
| | | | | | = 0.95 | | | | | | |
|---|
| | n | OLS | HK | KGM | KMS | MKED | KSM | MK | NIS1 | NIS2 | NIS3 |
| N(0,1) | | | | | | | | | | | |
| | 25 |
|
|
|
|
|
|
|
|
|
|
| | 50 |
|
|
|
|
|
|
|
|
|
|
| | 100 |
|
|
|
|
|
|
|
|
|
|
| N(0,5) | | | | | | | | | | | |
| | 25 |
|
|
|
|
|
|
|
|
|
|
| | 50 |
|
|
|
|
|
|
|
|
|
|
| | 100 |
|
|
|
|
|
|
|
|
|
|
| N(0,10) | | | | | | | | | | | |
| | 25 |
|
|
|
|
|
|
|
|
|
|
| | 50 |
|
|
|
|
|
|
|
|
|
|
| | 100 |
|
|
|
|
|
|
|
|
|
|
| N(0,16) | | | | | | | | | | | |
| | 25 |
|
|
|
|
|
|
|
|
|
|
| | 50 |
|
|
|
|
|
|
|
|
|
|
| | 100 |
|
|
|
|
|
|
|
|
|
|
| | ∑ Ranks |
|
|
|
|
|
|
|
|
|
|
Table 6.
Estimated MSEs considering = 0.99, p= 8, and n = 25, 50, and 100 (superscript represents ranks).
Table 6.
Estimated MSEs considering = 0.99, p= 8, and n = 25, 50, and 100 (superscript represents ranks).
| | | | | | | = 0.99 | | | | | |
|---|
| | n | OLS | HK | KGM | KMS | MKED | KSM | MK | NIS1 | NIS2 | NIS3 |
|---|
| N(0,1) | | | | | | | | | | | |
| | 25 | 13,128.31 |
|
|
|
|
|
|
|
|
|
| | 50 | 13,611.98 |
|
|
|
|
|
|
|
|
|
| | 100 | 24,962.42 | 14,414.39 |
|
|
|
|
|
|
|
|
| N(0,5) | | | | | | | | | | | |
| | 25 | 19,774.45 | 10,976.48 |
| 14,377.8 |
|
|
|
|
|
|
| | 50 | 16,950.46 |
|
|
|
|
|
|
|
|
|
| | 100 | 28,062.59 | 16,217.33 |
| 11,482.41 |
|
|
|
|
|
|
| N(0,10) | | | | | | | | | | | |
| | 25 | 30,374.84 | 16,852.27 |
| 23,092.54 |
|
|
|
|
|
|
| | 50 | 21,809.75 | 12,570.87 |
| 10,739.59 |
|
|
|
|
|
|
| | 100 | 32,264.2 | 18,663.74 |
| 13,711.82 |
|
|
|
|
|
|
| N(0,16) | | | | | | | | | | | |
| | 25 | 46,457.93 | 25,766.1 |
| 36,727.14 |
|
|
|
|
|
|
| | 50 |
| 16,510.67 |
| 14,984.46 |
|
|
|
|
|
|
| | 100 | 37,784.84 | 21,882.92 |
| 16,740.82 |
|
|
|
|
|
|
| | ∑ Ranks |
|
|
|
|
|
|
|
|
|
|
Table 7.
Estimated MSEs considering = 0.90, p = 16, and n = 25, 50, and 100 (superscript represents ranks).
Table 7.
Estimated MSEs considering = 0.90, p = 16, and n = 25, 50, and 100 (superscript represents ranks).
| | | | | | | = 0.90 | | | | | |
|---|
| | n | OLS | HK | KGM | KMS | MKED | KSM | MK | NIS1 | NIS2 | NIS3 |
|---|
| N(0,1) | | | | | | | | | | | |
| | 25 | 28,647.34 | 16,510.67 |
| 14,984.46 |
|
|
|
|
|
|
| | 50 |
|
|
|
|
|
|
|
|
|
|
| | 100 |
|
|
|
|
|
|
|
|
|
|
| N(0,5) | | | | | | | | | | | |
| | 25 |
|
|
|
|
|
|
|
|
|
|
| | 50 |
|
|
|
|
|
|
|
|
|
|
| | 100 |
|
|
|
|
|
|
|
|
|
|
| N(0,10) | | | | | | | | | | | |
| | 25 |
|
|
|
|
|
|
|
|
|
|
| | 50 |
|
|
|
|
|
|
|
|
|
|
| | 100 |
|
|
|
|
|
|
|
|
|
|
| N(0,16) | | | | | | | | | | | |
| | 25 |
|
|
|
|
|
|
|
|
|
|
| | 50 |
|
|
|
|
|
|
|
|
|
|
| | 100 |
|
|
|
|
|
|
|
|
|
|
| | ∑ Ranks |
|
|
|
|
|
|
|
|
|
|
Table 8.
Estimated MSEs considering = 0.95, p = 16, and n = 25, 50, and 100 (superscript represents ranks).
Table 8.
Estimated MSEs considering = 0.95, p = 16, and n = 25, 50, and 100 (superscript represents ranks).
| | | | | | | = 0.95 | | | | | |
|---|
| | n | OLS | HK | KGM | KMS | MKED | KSM | MK | NIS1 | NIS2 | NIS3 |
|---|
| N(0,1) | | | | | | | | | | | |
| | 25 |
|
|
|
|
|
|
|
|
|
|
| | 50 |
|
|
|
|
|
|
|
|
|
|
| | 100 |
|
|
|
|
|
|
|
|
|
|
| N(0,5) | | | | | | | | | | | |
| | 25 | 14,585.18 |
|
|
|
|
|
|
|
|
|
| | 50 |
|
|
|
|
|
|
|
|
|
|
| | 100 | 10,296.24 |
|
|
|
|
|
|
|
|
|
| N(0,10) | | | | | | | | | | | |
| | 25 | 22,616.9 | 13,038.07 |
| 13,136.27 |
|
|
|
|
|
|
| | 50 |
|
|
|
|
|
|
|
|
|
|
| | 100 | 11,866.42 |
|
|
|
|
|
|
|
|
|
| N(0,16) | | | | | | | | | | | |
| | 25 | 34,941.57 | 20,154.79 |
| 21,761.62 |
|
|
|
|
|
|
| | 50 |
|
|
|
|
|
|
|
|
|
|
| | 100 | 13,935.23 |
|
|
|
|
|
|
|
|
|
| | ∑ Ranks |
|
|
|
|
|
|
|
|
|
|
Table 9.
Estimated MSEs considering = 0.99, p = 16, and n = 25, 50, and 100 (superscript represents ranks).
Table 9.
Estimated MSEs considering = 0.99, p = 16, and n = 25, 50, and 100 (superscript represents ranks).
| | | | | | | = 0.99 | | | | | |
|---|
| | n | OLS | HK | KGM | KMS | MKED | KSM | MK | NIS1 | NIS2 | NIS3 |
|---|
| N(0,1) | | | | | | | | | | | |
| | 25 | 54,235.87 | 30,692.08 |
| 35,004.82 |
|
|
|
|
|
|
| | 50 | 33,156.23 | 20,084.7 |
| 18,843.62 |
|
|
|
|
|
|
| | 100 | 49,475.86 | 30,197.83 |
| 21,335.03 |
| 14,063.7 |
|
|
|
|
| N(0,5) | | | | | | | | | | | |
| | 25 | 82,168.61 | 46,450.04 |
| 56,017.79 |
|
|
|
|
|
|
| | 50 | 41,598.15 | 25,219.89 |
| 24,602.67 |
| 10,227.93 |
|
|
|
|
| | 100 | 55,795.63 | 34,094.54 |
| 24,806.85 |
| 16,076.75 |
|
|
|
|
| N(0,10) | | | | | | | | | | | |
| | 25 | 127,448.4 | 72,036.83 |
| 91,572.91 |
| 11,384.47 |
|
|
|
|
| | 50 | 53,950 | 32,754.83 |
| 33,326.56 |
| 13,660.75 |
|
|
|
|
| | 100 | 64,390.74 | 39,397.42 |
| 29,654.18 |
| 18,826.17 |
|
|
|
|
| N(0,16) | | | | | | | | | | | |
| | 25 | 196,984.3 | 111,399.6 |
| 148,300.4 |
| 18,710.43 |
|
|
|
|
| | 50 | 71,411.4 | 43,439.43 |
| 46,108.02 |
| 18,640.69 |
|
|
|
|
| | 100 | 75,724.79 | 46,394.93 |
| 36,238.51 |
| 22,532.52 |
|
|
|
|
| | ∑ Ranks |
|
|
|
|
|
|
|
|
|
|
Table 10.
Estimated MSEs considering = 0.90, p = 4, and n = 25, 50, and 100 (superscript represents ranks).
Table 10.
Estimated MSEs considering = 0.90, p = 4, and n = 25, 50, and 100 (superscript represents ranks).
| | | | | | | = 0.90 | | | | | |
|---|
| | n | OLS | HK | KGM | KMS | MKED | KSM | MK | NIS1 | NIS2 | NIS3 |
|---|
| t(1) | | | | | | | | | | | |
| | 25 |
|
|
|
|
|
|
|
|
|
|
| | 50 | 3,140,622 | 1,210,774 | 159,649.9 | 3,132,875 | 1,228,267 | 3,036,462 | 2,901,731 |
|
|
|
| | 100 | 48,713.52 | 26,074.74 |
| 45,165.85 | 25,964.3 | 41,738.44 | 44,062.66 |
|
|
|
| t(5) | | | | | | | | | | | |
| | 25 |
|
|
|
|
|
|
|
|
|
|
| | 50 |
|
|
|
|
|
|
|
|
|
|
| | 100 |
|
|
|
|
|
|
|
|
|
|
| t(10) | | | | | | | | | | | |
| | 25 |
|
|
|
|
|
|
|
|
|
|
| | 50 |
|
|
|
|
|
|
|
|
|
|
| | 100 |
|
|
|
|
|
|
|
|
|
|
| t(16) | | | | | | | | | | | |
| | 25 |
|
|
|
|
|
|
|
|
|
|
| | 50 |
|
|
|
|
|
|
|
|
|
|
| | 100 |
|
|
|
|
|
|
|
|
|
|
| | ∑ Ranks |
|
|
|
|
|
|
|
|
|
|
Table 11.
Estimated MSEs considering = 0.95, p = 4, and n = 25, 50, and 100 (superscript represents ranks).
Table 11.
Estimated MSEs considering = 0.95, p = 4, and n = 25, 50, and 100 (superscript represents ranks).
| | | | | | | = 0.95 | | | | | |
|---|
| | n | OLS | HK | KGM | KMS | MKED | KSM | MK | NIS1 | NIS2 | NIS3 |
|---|
| t(1) | | | | | | | | | | | |
| | 25 |
|
|
|
|
|
|
|
|
|
|
| | 50 | 6,100,242 | 2,304,251 |
| 6,088,629 | 1,392,989 | 4,818,257 | 4,954,487 |
|
|
|
| | 100 | 105,318.1 | 57,709.86 |
| 99,586.21 | 43,470.68 | 88,982.65 | 77,070.45 |
|
|
|
| t(5) | | | | | | | | | | | |
| | 25 |
|
|
|
|
|
|
|
|
|
|
| | 50 |
|
|
|
|
|
|
|
|
|
|
| | 100 |
|
|
|
|
|
|
|
|
|
|
| t(10) | | | | | | | | | | | |
| | 25 |
|
|
|
|
|
|
|
|
|
|
| | 50 |
|
|
|
|
|
|
|
|
|
|
| | 100 |
|
|
|
|
|
|
|
|
|
|
| t(16) | | | | | | | | | | | |
| | 25 |
|
|
|
|
|
|
|
|
|
|
| | 50 |
|
|
|
|
|
|
|
|
|
|
| | 100 |
|
|
|
|
|
|
|
|
|
|
| | ∑ Ranks |
|
|
|
|
|
|
|
|
|
|
Table 12.
Estimated MSEs considering = 0.99, p = 4, and n = 25, 50, and 100 (superscript represents ranks).
Table 12.
Estimated MSEs considering = 0.99, p = 4, and n = 25, 50, and 100 (superscript represents ranks).
| | | | | | | = 0.99 | | | | | |
|---|
| | n | OLS | HK | KGM | KMS | MKED | KSM | MK | NIS1 | NIS2 | NIS3 |
|---|
| t(1) | | | | | | | | | | | |
| | 25 | 44,750.82 | 20,708.49 |
| 42,063.01 |
| 26,707.6 |
|
|
|
|
| | 50 | 30,275,079 | 11,109,864 | 672,521.6 | 30,248,126 | 1,582,263 | 29,387,873 | 6,583,411 |
|
|
|
| | 100 | 612,818.6 | 343,088.6 | 28,701.8 | 596,284.8 | 114,919.5 | 510,770.8 | 70,218.83 |
|
|
|
| t(5) | | | | | | | | | | | |
| | 25 |
|
|
|
|
|
|
|
|
|
|
| | 50 |
|
|
|
|
|
|
|
|
|
|
| | 100 |
|
|
|
|
|
|
|
|
|
|
| t(10) | | | | | | | | | | | |
| | 25 |
|
|
|
|
|
|
|
|
|
|
| | 50 |
|
|
|
|
|
|
|
|
|
|
| | 100 |
|
|
|
|
|
|
|
|
|
|
| t(16) | | | | | | | | | | | |
| | 25 |
|
|
|
|
|
|
|
|
|
|
| | 50 |
|
|
|
|
|
|
|
|
|
|
| | 100 |
|
|
|
|
|
|
|
|
|
|
| | ∑ Ranks |
|
|
|
|
|
|
|
|
|
|
Table 13.
Estimated MSEs considering = 0.90, p = 8, and n = 25, 50, and 100 (superscript represents ranks).
Table 13.
Estimated MSEs considering = 0.90, p = 8, and n = 25, 50, and 100 (superscript represents ranks).
| | | | | | | = 0.90 | | | | | |
|---|
| | n | OLS | HK | KGM | KMS | MKED | KSM | MK | NIS1 | NIS2 | NIS3 |
|---|
| t(1) | | | | | | | | | | | |
| | 25 | 15,329.55 |
|
| 13,134.61 |
|
|
|
|
|
|
| | 50 | 10,358,337 | 3,659,540 | 198,194.7 | 10,322,179 | 1,496,151 | 8,864,309 | 5,207,725 |
|
|
|
| | 100 | 43,180.67 | 21,146.55 |
| 38,367.54 | 19,448.56 | 32,639.25 | 39,881.68 |
|
|
|
| t(5) | | | | | | | | | | | |
| | 25 |
|
|
|
|
|
|
|
|
|
|
| | 50 |
|
|
|
|
|
|
|
|
|
|
| | 100 |
|
|
|
|
|
|
|
|
|
|
| t(10) | | | | | | | | | | | |
| | 25 |
|
|
|
|
|
|
|
|
|
|
| | 50 |
|
|
|
|
|
|
|
|
|
|
| | 100 |
|
|
|
|
|
|
|
|
|
|
| t(16) | | | | | | | | | | | |
| | 25 |
|
|
|
|
|
|
|
|
|
|
| | 50 |
|
|
|
|
|
|
|
|
|
|
| | 100 |
|
|
|
|
|
|
|
|
|
|
| | ∑ Ranks |
|
|
|
|
|
|
|
|
|
|
Table 14.
Estimated MSEs considering = 0.95, p = 8, and n = 25, 50, and 100 (superscript represents ranks).
Table 14.
Estimated MSEs considering = 0.95, p = 8, and n = 25, 50, and 100 (superscript represents ranks).
| | | | | | | = 0.95 | | | | | |
|---|
| | n | OLS | HK | KGM | KMS | MKED | KSM | MK | NIS1 | NIS2 | NIS3 |
|---|
| t(1) | | | | | | | | | | | |
| | 25 | 31,956.69 | 18,472.45 | 724.925 | 28,268.24 |
| 12,258.81 | 3631.138 |
|
|
|
| | 50 | 21,079,258 | 7,129,596 | 343,020.8 | 21,018,374 | 2,134,812 | 17,871,708 | 5,914,655 |
|
|
|
| | 100 | 89,523.41 | 42,741.63 |
| 81,303.64 | 30,809.85 | 66,710.22 | 70,743.01 |
|
|
|
| t(5) | | | | | | | | | | | |
| | 25 |
|
|
|
|
|
|
|
|
|
|
| | 50 |
|
|
|
|
|
|
|
|
|
|
| | 100 |
|
|
|
|
|
|
|
|
|
|
| t(10) | | | | | | | | | | | |
| | 25 |
|
|
|
|
|
|
|
|
|
|
| | 50 |
|
|
|
|
|
|
|
|
|
|
| | 100 |
|
|
|
|
|
|
|
|
|
|
| t(16) | | | | | | | | | | | |
| | 25 |
|
|
|
|
|
|
|
|
|
|
| | 50 |
|
|
|
|
|
|
|
|
|
|
| | 100 |
|
|
|
|
|
|
|
|
|
|
| | ∑ Ranks |
|
|
|
|
|
|
|
|
|
|
Table 15.
Estimated MSEs considering = 0.99, p = 8, and n = 25, 50, and 100 (superscript represents ranks).
Table 15.
Estimated MSEs considering = 0.99, p = 8, and n = 25, 50, and 100 (superscript represents ranks).
| | | | | | | = 0.99 | | | | | |
|---|
| | n | OLS | HK | KGM | KMS | MKED | KSM | MK | NIS1 | NIS2 | NIS3 |
|---|
| t(1) | | | | | | | | | | | |
| | 25 | 174,621.7 | 101,519.1 |
| 163,439 |
| 68,450.21 |
|
|
|
|
| | 50 | 1,104,682,06 | 35,056,616 | 1,264,832 | 110,297,566 | 4,207,414 | 93,673,350 | 3,136,071 |
| 11,957.61 |
|
| | 100 | 498,140.4 | 224,600.1 | 17,786.33 | 472,044.2 | 86,248.34 | 368,950.3 | 121,778.9 |
|
|
|
| t(5) | | | | | | | | | | | |
| | 25 |
|
|
|
|
|
|
|
|
|
|
| | 50 |
|
|
|
|
|
|
|
|
|
|
| | 100 |
|
|
|
|
|
|
|
|
|
|
| t(10) | | | | | | | | | | | |
| | 25 |
|
|
|
|
|
|
|
|
|
|
| | 50 |
|
|
|
|
|
|
|
|
|
|
| | 100 |
|
|
|
|
|
|
|
|
|
|
| t(16) | | | | | | | | | | | |
| | 25 |
|
|
|
|
|
|
|
|
|
|
| | 50 |
|
|
|
|
|
|
|
|
|
|
| | 100 |
|
|
|
|
|
|
|
|
|
|
| | ∑ Rank |
|
|
|
|
|
|
|
|
|
|
Table 16.
Estimated MSEs considering = 0.90, p = 16, and n = 25, 50, and 100 (superscript represents ranks).
Table 16.
Estimated MSEs considering = 0.90, p = 16, and n = 25, 50, and 100 (superscript represents ranks).
| | | | | | | = 0.90 | | | | | |
|---|
| | n | OLS | HK | KGM | KMS | MKED | KSM | MK | NIS1 | NIS2 | NIS3 |
|---|
| t(1) | | | | | | | | | | | |
| | 25 | 93,295.66 | 52,472.02 |
| 88,978.23 |
| 25,608.32 |
|
|
|
|
| | 50 | 33,529,711 | 20,017,548 | 1,145,490 | 33,492,751 | 10,493,305 | 31,418,087 | 19,906,844 |
|
|
|
| | 100 | 262,446.3 | 178,755.4 |
| 251,046.9 | 70,274.53 | 190,263 | 170,815 |
|
|
|
| t(5) | | | | | | | | | | | |
| | 25 |
|
|
|
|
|
|
|
|
|
|
| | 50 |
|
|
|
|
|
|
|
|
|
|
| | 100 |
|
|
|
|
|
|
|
|
|
|
| t(10) | | | | | | | | | | | |
| | 25 |
|
|
|
|
|
|
|
|
|
|
| | 50 |
|
|
|
|
|
|
|
|
|
|
| | 100 |
|
|
|
|
|
|
|
|
|
|
| t(16) | | | | | | | | | | | |
| | 25 |
|
|
|
|
|
|
|
|
|
|
| | 50 |
|
|
|
|
|
|
|
|
|
|
| | 100 |
|
|
|
|
|
|
|
|
|
|
| | ∑ Rank |
|
|
|
|
|
|
|
|
|
|
Table 17.
Estimated MSEs considering = 0.95, p = 16, and n = 25, 50, and 100 (superscript represents ranks).
Table 17.
Estimated MSEs considering = 0.95, p = 16, and n = 25, 50, and 100 (superscript represents ranks).
| | | | | | | = 0.95 | | | | | |
|---|
| | n | OLS | HK | KGM | KMS | MKED | KSM | MK | NIS1 | NIS2 | NIS3 |
|---|
| t(1) | | | | | | | | | | | |
| | 25 | 205,892.7 | 115,282.9 |
| 198,383.2 |
| 53,291.83 |
|
|
| 136,956.5 |
| | 50 | 68,008,720 | 39,108,854 | 2,163,610 | 67,939,363 | 15,388,984 | 63,324,660 | 23,137,665 |
|
| 67,892,353 |
| | 100 | 576,843.5 | 393,668.6 | 17,581.14 | 557,053.2 | 107,712.6 | 404,821.7 | 217,585 |
|
| 567,996 |
| t(5) | | | | | | | | | | | |
| | 25 |
|
|
|
|
|
|
|
|
|
|
| | 50 |
|
|
|
|
|
|
|
|
|
|
| | 100 |
|
|
|
|
|
|
|
|
|
|
| t(10) | | | | | | | | | | | |
| | 25 |
|
|
|
|
|
|
|
|
|
|
| | 50 |
|
|
|
|
|
|
|
|
|
|
| | 100 |
|
|
|
|
|
|
|
|
|
|
| t(16) | | | | | | | | | | | |
| | 25 |
|
|
|
|
|
|
|
|
|
|
| | 50 |
|
|
|
|
|
|
|
|
|
|
| | 100 |
|
|
|
|
|
|
|
|
|
|
| | ∑ Rank |
|
|
|
|
|
|
|
|
|
|
Table 18.
Estimated MSEs considering = 0.99, p = 16, and n = 25, 50, and 100 (superscript represents ranks).
Table 18.
Estimated MSEs considering = 0.99, p = 16, and n = 25, 50, and 100 (superscript represents ranks).
| | | | | | | = 0.99 | | | | | |
|---|
| | n | OLS | HK | KGM | KMS | MKED | KSM | MK | NIS1 | NIS2 | NIS3 |
|---|
| t(1) | | | | | | | | | | | |
| | 25 | 1,222,384 | 673,986.3 |
| 1,198,574 | 13,710.99 | 317,124.7 |
|
|
| 360,525.3 |
| | 50 | 357,008,988 | 191,963,981 | 9,386,963 | 356,774,450 | 31,699,699 | 331,414,785 | 6,940,253 | 238.026 | 407.167 | 352,219,373 |
| | 100 | 3,405,965 | 2,312,607 | 76,342.04 | 3,344,188 | 268,166.9 | 2,363,639 | 153,422.6 |
|
|
|
| t(5) | | | | | | | | | | | |
| | 25 |
|
|
|
|
|
|
|
|
|
|
| | 50 |
|
|
|
|
|
|
|
|
|
|
| | 100 |
|
|
|
|
|
|
|
|
|
|
| t(10) | | | | | | | | | | | |
| | 25 |
|
|
|
|
|
|
|
|
|
|
| | 50 |
|
|
|
|
|
|
|
|
|
|
| | 100 |
|
|
|
|
|
|
|
|
|
|
| t(16) | | | | | | | | | | | |
| | 25 |
|
|
|
|
|
|
|
|
|
|
| | 50 |
|
|
|
|
|
|
|
|
|
|
| | 100 |
|
|
|
|
|
|
|
|
|
|
| | ∑ Rank |
|
|
|
|
|
|
|
|
|
|
Table 19.
Descriptive statistics for cruise ship info data.
Table 19.
Descriptive statistics for cruise ship info data.
| | Age | Tonnage | Passengers | Length | Cabins | Crew |
|---|
| Min. | 4.00 | 2.32 | 0.66 | 2.79 | 0.33 | 0.59 |
| Median | 14.00 | 71.89 | 19.50 | 8.56 | 9.57 | 8.15 |
| Mean | 15.00 | 71.29 | 18.46 | 8.13 | 8.83 | 7.79 |
| Max. | 48.00 | 220.00 | 54.00 | 11.82 | 27.00 | 21.00 |
Table 20.
Variance inflation factor values for cruise ship info data.
Table 20.
Variance inflation factor values for cruise ship info data.
| Age | Tonnage | Passengers | Length | Cabins |
|---|
| 1.706 | 18.086 | 23.155 | 6.824 | 25.389 |
Table 21.
Mean square error for different estimators of cruise ship info data (superscript represents ranks).
Table 21.
Mean square error for different estimators of cruise ship info data (superscript represents ranks).
| OLS | HK | KGM | KMS | MKED | KSM | MK | NIS1 | NIS2 | NIS3 |
|---|
|
|
|
|
|
|
|
|
|
|
|
Table 22.
Descriptive statistics for economic survey data of Pakistan.
Table 22.
Descriptive statistics for economic survey data of Pakistan.
| | Y | Z1 | Z2 | Z3 | Z4 | Z5 |
|---|
| Min. | 20.08 | 19.55 | 0.0387 | 3248 | 68.92 | 22.20 |
| Median | 29.49 | 20.73 | 0.2400 | 4558 | 103.82 | 28.05 |
| Mean | 29.73 | 20.85 | 0.2502 | 4382 | 103.21 | 31.93 |
| Max. | 41.20 | 21.99 | 0.6121 | 5128 | 140.47 | 52.00 |
Table 23.
Variance inflation factor values for economic survey data of Pakistan.
Table 23.
Variance inflation factor values for economic survey data of Pakistan.
| Z1 | Z2 | Z3 | Z4 | Z5 |
|---|
| 32.144 | 2.538 | 26.213 | 70.772 | 22.677 |
Table 24.
Meansquare error for different estimators of economic survey data of Pakistan (superscript represents ranks).
Table 24.
Meansquare error for different estimators of economic survey data of Pakistan (superscript represents ranks).
| OLS | HK | KGM | KMS | MKED | KSM | MK | NIS1 | NIS2 | NIS3 |
|---|
|
|
|
|
|
|
|
|
|
|
|


 ,
, 


