Abstract
With attention increasing towards worldwide ecological conservation, the energy policies of various countries are moving towards renewable energy systems, primarily with solar and wind as the primary power sources. The Western Electricity Coordinating Council (WECC) has developed a generic model as a simulation framework for a typical solar wind generation system to analyze the response of the actual equipment. In this paper, we propose a parameter tuning process for a generic model controller that combines Latin hypercube sampling and Pareto optimization to enable a generic model to effectively match the output of an actual inverter device. Different operating scenarios were considered to match the dynamic characteristics of the inverter device using the multi-objective particle swarm algorithm (MOPSO) along with Pareto optimization. The effectiveness of the proposed parameter tuning process was verified on a user-defined test system and, later, the IEEE 39 bus system with a large solar power facility.
Keywords:
inverter-based generation; Pareto front; parameter tuning; particle swarm optimization; photovoltaic energy system; WECC generic model MSC:
58E17; 68W50; 90C27; 90C29
1. Introduction
The rise of major global issues, such as climate change, environmental protection, the depletion of fossil fuels and global warming, has resulted in the topic of renewable energy receiving considerable attention from experts [1]. Accordingly, renewable power generation systems have opened a vast scope of fields for researchers [2]. Currently, solar and wind power have the capability to replace traditional fossil fuels in future power systems [3]. In the latest International Energy Agency (IEA) report, globally, the renewable energy sector was predicted to increase almost 60% from 2020 to 2026. Solar and wind systems account for more than 50% of power generation [4]. Taiwan, for example, has abundant wind energy and solar energy resources owing to its geographical location [5]. In view of this, the Taiwan government plans to expand renewable energy generation to a total capacity of 27,423 MW by 2025, with renewable energy accounting for 20% of the total electricity generation. However, installations of large-scale renewable sources into the existing power systems may pose several challenges to the system operations [6], owing to uncertainties in solar and wind power generation caused by climatic conditions [7,8]. Moreover, a risk of unstable system frequency exists when there is an imbalance between power supply and load demand [9]. In addition, the low inertia of renewable energy generation leads to poor frequency responses during abnormal events in power systems, affecting their stability [10,11]. Therefore, system operators must conduct stability analysis and dynamic assessment in accordance with the relevant grid codes and regulations before large-scale renewable energy sources are interconnected to the power grid [12,13]. In recent years, many studies have been performed on renewable systems and their advanced control theories. To assess the stability of inverter-based devices, the authors of [14] modeled a hybrid solar–wind generation system and presented its impact on power grid integration. In [15], different mathematical models of photovoltaic (PV) systems were developed based on power flow, harmonic and electromagnetic transient responses. In [16], a solar power generation model with a phase-locked loop (PLL) and the LCL filter was proposed to achieve low voltage ride-through (LVRT) capability. For examining the effects of solar power on distribution systems, Refs. [17,18] developed a tool to model solar power generation systems via the electromagnetic transient (EMTP) software and analyzed the model response in the Open Distribution System Simulator (OpenDSS) software. However, using different models from different equipment vendors may complicate the fast-screening process for power system operators. The Western Electricity Coordinating Council (WECC) and the International Electrotechnical Commission (IEC) have focused on developing generic models, as in [19,20], to enable power system operators and researchers to analyze the renewable power generation systems on a common simulation platform. Similarly, in [21], the Electric Power Research Institute (EPRI) has produced a technical guide to develop generic models based on the WECC. The generic models proposed by the WECC are already used in commercial software packages, such as PLSF, PSS/E, PowerWorld and DIgSILENT. In [22], wind turbine models based on the IEC and the WECC were proposed, and the compatibility of these two models was verified by adjusting the parameters between them. In [23], the development of solar dynamic models was introduced, and the dynamic response of the WECC model was verified with real-time test data. In [24], the output response of wind turbines was recorded via on-field measurements, and the actual measured data were verified using the WECC model. In [25], the WECC model was used to simulate a practical large-scale solar power system, and the frequency response of the power grid was successfully predicted under a contingency event. In [26], the WECC model was used to test the LVRT ability of large-scale solar power generation systems. Dynamic indices were used to evaluate system responses under different models to improve voltage stability.
Dynamic models are effective in assessing the response and stability of practical generation systems. Regarding the dynamic model configuration, the controller gains, time constants and other control parameters must be carefully tuned to ensure the stable operation of the generation systems and the responses of the actual equipment. However, the parameter tuning process is often performed by trial and error, and considerable time is required to tune the controller parameters. In electrical engineering, controller gain tuning is an optimization problem for determining the most suitable combination of controller gains. In related problems, optimization algorithms such as the genetic algorithm (GA), particle swarm optimization (PSO), ant colony optimization [27], Rao optimization [28] and the bat algorithm (BA) are used to search for solutions that are compatible with the operational situations. In [29], a lighting attachment procedure optimization (LAPO) algorithm was proposed to optimize the system voltage and current output responses for tuning PID controller gains in hybrid renewable energy systems. In [30,31], the design of the controller parameters of a static var compensator (SVC) and power stabilizer (PSS) was proposed using a GA and PSO. In addition, the rotor stability and dynamic stability of the power systems were considered. In [32], the Ziegler–Nichols PSO (ZN-PSO) algorithm was proposed for designing the dynamic parameters of the PI controller in the WECC generic model. The design results were validated against the actual measurement data.
However, traditional algorithms, which convert multiple objectives into a single-objective problem using a weighting approach, may not satisfy all objective criteria. In [33], NSGA-II was used to design the controller parameters of the static synchronous compensator (STATCOM) based on voltage stability, transient stability and dynamic robustness by considering the uncertainties of wind power generation. Therefore, to fit the expected response under different operating conditions, this paper proposes a parameter tuning process that combines multi-objective particle swarm optimization (MOPSO) with Pareto optimality. Generally, optimization techniques such as PSO and the GA often become stuck as the local optima or local best. In the proposed method, MOPSO is also equipped with the process of crowd distance calculation and the use of an external archive, which helps the optimization method to jump out of the local best and approach the global best. According to the characteristics of different response zones, a combination of controller parameters was selected using the minimum Manhattan distance method. The contributions of this study are as follows:
- (1)
- The parameter tuning of the WECC generic model controller was performed using MOPSO along with Pareto optimality, and the final solutions from all Pareto fronts were determined using the minimum Manhattan distance method.
- (2)
- Latin hypercube sampling (LHS) was used instead of the conventional random sampling method to increase the diversity of the variable initialization.
- (3)
- The proposed method was verified in an equivalent test system and the IEEE 39 bus system, considering six cases under two operating scenarios. Notably, the tuned parameters of any case could simultaneously satisfy different scenarios.
The remainder of this paper is organized as follows. Section 2 describes the multi-objective optimization algorithm, including Pareto optimality and hypercube sampling. Section 3 illustrates the proposed parameter tuning process and presents a WECC generic model. Section 4 describes the test system and presents the simulation results. Section 5 shows the application of the proposed method to the standard IEEE 39 bus system. Finally, conclusions are presented in Section 6.
2. Multi-Objective Optimization Algorithm
The optimization method follows a set of constraints to reach a desired single objective or goal. With more complex optimization problems, the number of objectives has increased. This shift from a single to multilevel problem is termed a multi-objective optimization problem. However, dealing with a multi-objective problem is always more complicated than dealing with a single-objective problem. This problem is often solved by converting multiple objectives into a single-objective function. A commonly used conversion method is the weighting sum method in which each objective is assigned a weighting factor in advance. The objective functions are weighted and combined into a single-objective function. However, the weighting sum method often provides unsatisfactory results for individual objectives, mainly because of the uneven and unknown selection of the weighting factors. The proposed parameter tuning algorithm can be divided into two steps: (1) parameter optimization and (2) parameter selection. MOPSO is used to generate a Pareto front set for parameter optimization. For parameter selection, the minimum Manhattan distance method is used to select the final solution from the feasible solution set. The framework of the proposed decision-making process is shown in Figure 1.
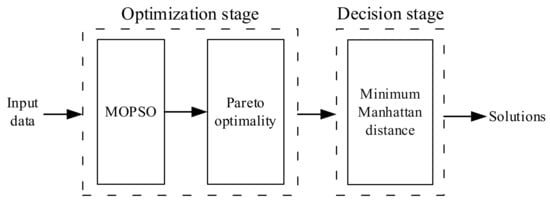
Figure 1.
Decision-making process framework.
2.1. Latin Hypercube Sampling (LHS)
Generally, PSO can generate the first population using general random sampling (GRS). However, simple random sampling can lead to uneven sampling results. As shown in Figure 2 and Figure 3, LHS [34] is a stratified sampling concept. Each variable is divided into n non-overlapping intervals, and the parameter values are randomly selected in each interval, according to the probability density. Compared with GRS, LHS can increase the diversity of variable initialization in the sampling space and help avoid the over-concentration of sampling data in a specific area.
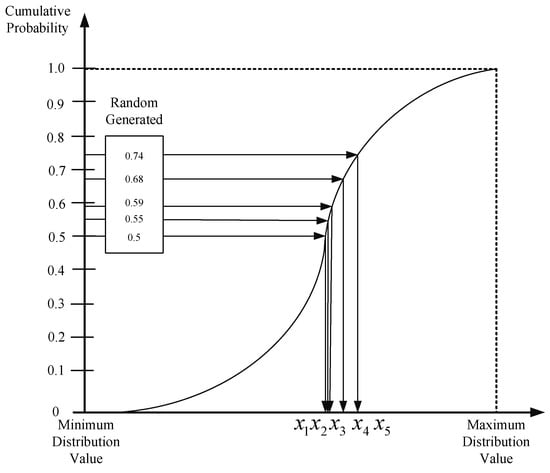
Figure 2.
General random sampling distribution.
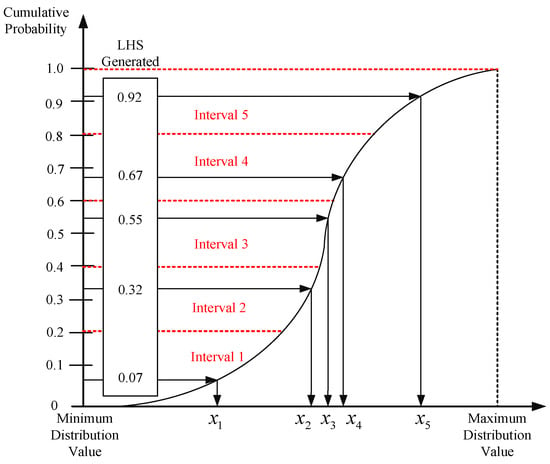
Figure 3.
Latin hypercube sampling distribution.
Based on LHS, the vector set of the initial random variables X can be expressed in (1) as
Equation (2) is the cumulative distribution function of the initial set of random variables X:
For any discrete random variable, the probability mass function is expressed as (3). If there are m variables in the set of variables X, then the probability condition of the discrete random variables in (4) must be satisfied:
Using (5), a sample of each variable at different intervals can be determined:
where is the ith variable in the jth sampling interval, m is the total number of variables, n is the number of sampling intervals, is the inverse function of the cumulative distribution, is a random permutation of , and are random variables generated by the standard uniform distribution.
2.2. Pareto Optimality
In multi-objective problems, conflicting solutions may occur when the objective functions are interdependent or proportional. In the Pareto optimality process, all feasible solutions are recorded using an external archive [35,36]. For multi-objective minimization, the individual solutions are compared for different objective functions using (6). If a set of feasible solutions outperforms other sets of feasible solutions in all objectives, it can be considered as a set of non-dominated solutions:
where and are feasible solutions. If the fitness of is better than that of for all objectives, is called the dominant solution, and is called the dominated solution. Conversely, is called a non-dominated solution if none of the existing solutions is better than the dominant solution. All non-dominated solutions regarded as Pareto fronts in the solution set space can be represented as (7):
where is the ith non-dominated solution, and is the total number of non-dominated solutions.
2.3. MOPSO Algorithm
The traditional PSO is designed with single-objective optimization and cannot be directly applied to multi-objective problems. In this study, MOPSO was adopted for multi-objective problems to avoid conflicting solutions owing to its dependency on individual objectives [37]. In MOPSO, the search capability of the swarm-based algorithm is combined with the Pareto optimality properties. The nondominated solutions are recorded in the external archive during the iterative process. Any nondominated solution in the external archive can be selected as the global best (Gbest). The velocity and position of the particles are updated using (8) and (9). For single-objective PSO, there is only one global best solution; however, for MOPSO, the global best solution is a set of solutions. Particle swarms gradually move towards the main goal, moving through the local and global best solutions. During the iterative process, the external archive accumulates all nondominated solutions. The final result is the Pareto front solution. In addition, the crowding distance procedure is used to select the appropriate global best solution and to evaluate the insertion and deletion of non-dominated solutions, especially when the external archive is full. Figure 4 shows the flowchart of the proposed MOPSO algorithm.
where is the best solution of the ith particle itself, Gbest is the best solution of the group, w is the inertia weight, k is the kth iteration, and are acceleration constants, and are random variables between 0 and 1, is the original position of the ith particle, is the new position of the ith particle, is the original velocity of the ith particle, and is the new velocity of the ith particle.
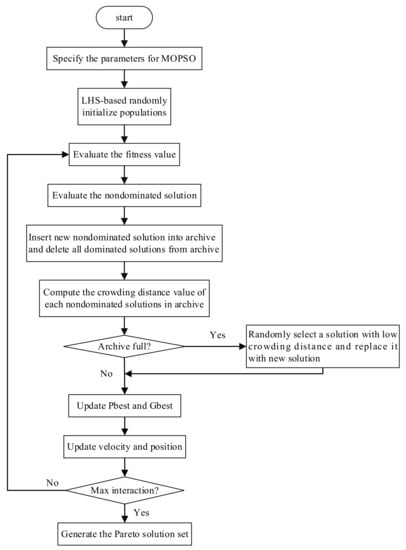
Figure 4.
Flow chart of the proposed MOPSO algorithm.
2.4. Manhattan Distance Method
The Manhattan distance is the sum of the absolute axis distances of two points on a standard coordinate system. For multi-objective optimization problems, selecting the final solutions from the Pareto front set is called multiple-criteria decision-making. The minimum Manhattan distance (MMD) method selects a solution with the minimum distance from the normalized ideal vector as the final solution [38]. The Pareto front set is obtained by MOPSO. The minimum of each objective function is calculated using (10), where is the ith solution in the Pareto front set:
Similarly, the difference between the maximum and minimum of each objective function is calculated using (11):
The ideal vector is defined as follows:
The normalized fitness vector for each objective is calculated using (13):
Following (12) and (13), the minimum Manhattan distance is defined as follows:
where is the 1-norm, also known as the Manhattan norm.
3. Proposed Parameter Tuning Methodology
To achieve the desired response of PV systems, power grid engineers must simulate the equipment behaviors and tune their controller parameters before the PV systems are connected to the existing power system. However, to satisfy both the actual responses of PV systems and the safety of power grid operation, operators must adjust the controller parameters to meet these two conditions continuously. To improve parameter tuning efficiency, this study proposes a parameter tuning method based on MOPSO and Pareto optimality.
3.1. Test System
The test system used in this study is shown in Figure 5. Section A is the equivalent circuit of a large-scale PV power system connected to the Section B grid via an equivalent transmission line from the point of interconnection (POI). During the parameter tuning process, contingency events result in various voltage disturbances in power systems. A contingency study was conducted to confirm the security of the PV connected to the power grid.
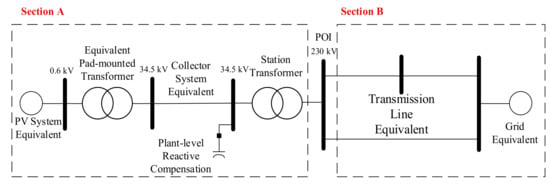
Figure 5.
Single line diagram for test system.
3.2. WECC Generic Model
During the design phase of a PV generation system, dynamic models are used to ensure that the grid-connected system satisfies the grid codes. Several inverters have been used in practical power systems. User-defined models are required for various inverters on the corresponding simulation platform. As many PV systems are integrated into the power grid, it is difficult to manage different types of user-defined models and parameters. Therefore, generic models are used to simulate the actual response of user devices in the power grid.
The generic renewable energy generation models developed by WECC can effectively simulate the actual response in dynamic simulations. The WECC generic model, shown in Figure 6, consists of a generator model (REGCA), an area control model (REECB) and a central control model (REPCA), which can simulate the response of various inverters in practical power systems by adjusting the model parameters. Each model can be described as follows:

Figure 6.
WECC generic model block diagram.
- REGCA model: The REGCA model represents the generator model of the PV generation systems for generating Iq and Ip based on Iqcmd and Ipcmd, as shown in Figure 6. Furthermore, it maintains the voltage profile of the power systems within a predefined range based on Vt.
- REECB model: As shown in Figure 7, the REECB model can simulate inverter behavior under different system states. The inverter controller strategies can be divided into real and reactive power control. Real power control is determined by the control signal at the previous level and remains between the maximum and minimum references. Reactive power control includes regulating reactive powers by iqinj during high- and low-voltage disturbance events and stabilizing the output using the PI controller under normal scenarios. The model output can be used to approximate the system responses by adjusting the controller parameters.
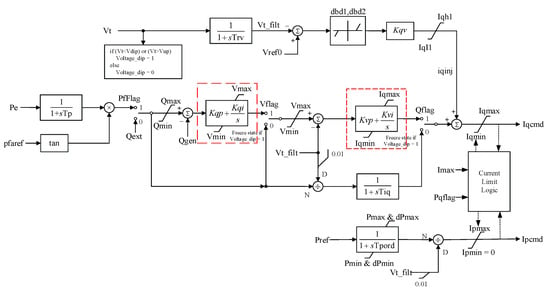 Figure 7. REECB control block diagram.
 - REPCA model: As shown in Figure 8, the REPCA model primarily receives the feedback response from the POI. The real P/F and Q/V control modes of all inverters in the PV systems can be realized using the REPCA model. The bus voltage and reactive power flow at the POI can be regulated in the reactive power control mode, in which PI controllers provide a primary frequency response according to the system frequency variations.
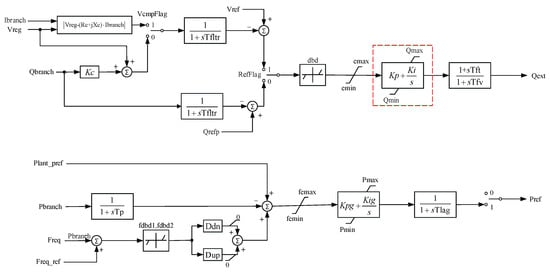 Figure 8. REPCA control block diagram.
3.3. Problem Description
Under different operating scenarios, the generic model may provide real and reactive power responses to power grids according to voltage deviations. It can also be used as a fault compensator or a stability controller. The dynamic response of the test system with a three-phase short-circuit fault for 5 s at the POI is illustrated in Figure 9. Massive fluctuations were observed in both the real and reactive powers. This study proposes tuning the controller parameters to meet the preset reference powers by the system operator in both the shaded zones, as shown in Figure 9.
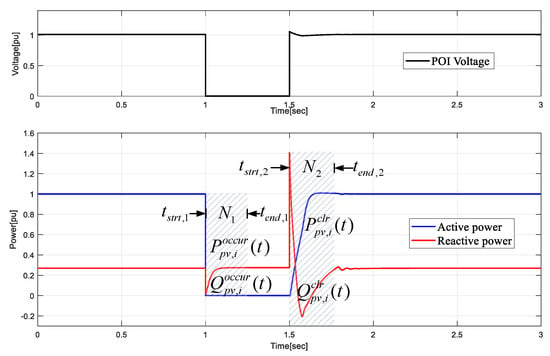
Figure 9.
Dynamic response of WECC model during fault disturbances.
To tune the control parameters, the objective functions, equation constraints, inequality constraints and solution sets can be expressed as follows:
where is the nth objective function; is the ith equation constraint; is the jth inequality constraint; and are the control and dependent variables, respectively.
3.3.1. Control Variables
The large-scale PV model developed by the WECC performs real and reactive power–control calculations based on the specified bus voltage. To obtain a stable output response, engineers may adjust the proportional and integral gains of the PI controllers at each stage to achieve the desired response. In this study, the parameters of the PI controllers in REECB and REPCA for Q/V control were designed to satisfy the performance of the reference responses under different operating voltage scenarios, as shown in Figure 7 and Figure 8 within the red dashed blocks. The control variable and dependent variable based on MOPSO can be expressed as (19) and (20), respectively:
where are the parameters of the Q/V control PI controller in REECB; are the parameters of the Q/V control PI controller in REPCA; and and are the real and reactive power responses for the ith voltage operation scenario, respectively.
3.3.2. Objective Functions
To achieve the objective of tuning the PI controller parameters under different operating voltage scenarios, in this study, the real and reactive power dynamic responses were used as the objective functions. As shown in Figure 9, the dynamic features of the real power responses (, ) and reactive power responses (, ) under fault disturbances during the occurrence period () and recovery period () were used to minimize the average absolute error between the power responses of each shaded zone (see Figure 9) and the reference powers (, , and ). The objective functions used in this study are shown in (22)–(25):
where denotes different operating voltage scenarios; is the total number of samples considered in the simulation time, which represents the number of samples taken at different times in .
The sampling time can be represented by . The variable is the sampling start time, is the sampling end time, and is the sampling interval of the simulation process; i.e., . In Figure 9, the first and second sampling intervals are represented by and . From and , the average absolute errors between the power responses obtained by the WECC model and the desired references for different operating voltage scenarios can be calculated to obtain a feasible solution.
3.3.3. Equality Constraints
For any power system, there must be a balance between power generation and load demand, as follows:
where and are the active and reactive powers at bus , is the voltage at bus , is the voltage at bus , and is the number of buses; and are the active and reactive power demands at bus , respectively, and are the conductance and inductance between bus and bus , respectively, and is the impedance angle between bus and bus .
3.3.4. Inequality Constraints
Considering the planning and design, the network components in power systems must operate within a specified range, including the output limits of each unit, bus voltage limits, and line capacity limits, all of which must satisfy the maximum and minimum limits, as follows:
where is the number of generating equipment, is the total number of buses, is the total number of lines, and are the upper and lower limits of active power for the th generating unit, and are the upper and lower limits of reactive power for the th generating unit, and are the upper and lower limits of the allowable operating voltage of bus , and and are the upper and lower limits of the thermal capacity for the th transmission line, respectively.
Additionally, to ensure that the active and reactive power responses can effectively match the response references, fitness should be less than the average tolerance threshold, as follows:
where is the average tolerance threshold.
3.4. Application of MOPSO to Parameter Tuning
The parameters of a dynamic model often require repeated tuning. In this paper, a tuning process is proposed to search for the Pareto front solutions of dynamic parameters using MOPSO. The most suitable solution is selected using the minimum Manhattan distance method. A flowchart of the proposed parameter tuning method is shown in Figure 10 with the following steps:
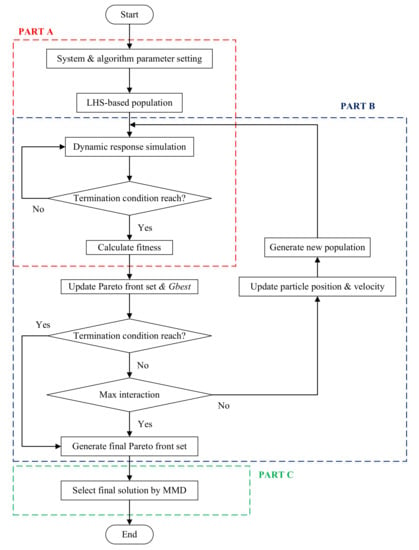
Figure 10.
Flow chart of the proposed parameter tuning method.
PART (A) Initialization
- Step (A-1)
- System initialization: The system architecture, line parameters, scenarios, objectives and constraints are initialized.
- Step (A-2)
- Control variable initialization: The control variables in (19) are initialized based on Latin hypercube sampling.
- Step (A-3)
- Dynamic simulation: Control variables are used for the dynamic simulations by considering different operating scenarios. The dependent variables in (20) are obtained from the simulation results.
- Step (A-4)
- Fitness calculation: The fitness values are calculated using (22)–(25) using the dependent variables obtained in Step A-4.
- Step (A-5)
- Initial external archive: According to Step A-4, the set of Pareto front solutions is obtained using (6) in the external archive.
PART (B) MOPSO algorithm
- Step (B-1)
- Gbest selection: The best solution is selected from the external archive using the crowding distance procedure.
- Step (B-2)
- PSO algorithm: As shown in Figure 4, the control variable is updated according to (8) and (9), and the new fitness values are evaluated.
- Step (B-3)
- Pareto optimality: The fitness generated in Step B-2 is compared with the non-dominated solutions in the external archive, and the external archive is updated if required.
- Step (B-4)
- Termination condition: The iterative process is stopped if a solution with all fitness values less than the preset threshold exists in the external archive.
PART (C) MMD decision-making
- Step (C-1)
- MMD solution selection: The final result is selected from the final external archive using (10)–(15).
4. Results and Discussion
To verify the performance of the proposed parameter tuning method, the responses of the controller parameters were simulated for different operating scenarios.
4.1. Scenarios
Figure 11 and Figure 12 are the reference responses under different operating scenarios set in this study, which can also be regarded as field measurements. Table 1 lists the operating scenarios of the test system, and Table 2 lists the controller parameters under the reference response.
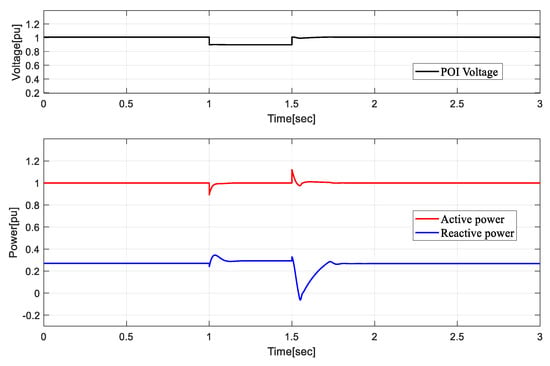
Figure 11.
Reference response of PV power generation under operating scenario 1.
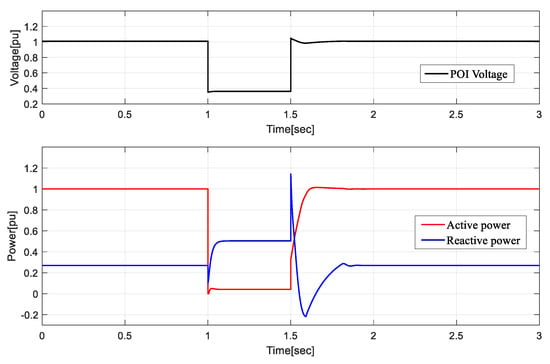
Figure 12.
Reference response of PV power generation under operating scenario 2.

Table 1.
Description of the operating scenarios.

Table 2.
Controller parameters under reference response.
In this study, based on the reference responses (field measurements), several different design scenarios were considered to validate the proposed parameter tuning process. The different controller parameters and cases are listed in Table 3.

Table 3.
Tuned controller parameters under each case.
The descriptions of the cases are as follows:
- Case (1)
- The controller parameters for the V/Q control in the REECB model are tuned. In other words, some parameters are used to adjust the responses of the PV systems.
- Case (2)
- The controller parameters for V/Q control in REECB and REPCA are tuned. In other words, all parameters are used to adjust the responses of the PV systems.
- Case (3)
- Some parameter settings for the inverter are already known from the device manual for applications. In this case, the controller parameters of the V/Q controls in the REECB and REPCA models are tuned using the known parameters of the PI controllers.
- Case (4)
- The limitations between the WECC generic model and the practical device are considered. The differences between the control schemes of the WECC generic model and the practical device are examined. In this case, the controller parameters of the V/Q control in the REECB and REPCA models are tuned with a false parameter of the PI controller.
- Case (5)
- The controller parameters for V/Q control in REECB and REPCA are tuned using only two dynamic features, and , considering the occurrence period of the fault disturbances.
- Case (6)
- Similarly to Case 5, the controller parameters for V/Q control in REECB and REPCA are tuned using and , considering the recovery period of fault disturbances.
4.2. Test System and Parameter Setting
The different operating scenarios in the test system shown in Figure 5 were used to verify the performance of the proposed optimization strategy to match the reference response based on the dynamic features of the active and reactive powers in different regions. Table 4 lists the relevant parameters and operating scenarios for the MOPSO algorithm.

Table 4.
MOPSO-related parameters and other variables of the proposed method.
In this study, the proposed parameter tuning strategy was modeled on a power system simulator for an engineering (PSS®E) dynamic simulation platform. Controller parameter optimization was implemented using MATLAB. A large-scale PV power system of 100 MW was modeled as shown in Figure 5. The WECC generic PV system was modeled under the V/Q control mode to tune the local control model (REECB) and central control model (REPCA) parameters.
Considering the stability of the output response, the PI controller parameters mentioned in the previous section were tuned, and the range of the controller variables is listed in Table 5. The other parameters in the general model were obtained directly from the WECC configuration [19,20,21]. The parameter tuning process is shown in Figure 10, and the two operating scenarios are listed in Table 1. The fault disturbance occurred at the POI at exactly 1 s and cleared at 1.5 s, and the dynamic simulation continued for 3 s.

Table 5.
Feasible ranges of controller parameters.
4.3. Test Results
The well-tuned controller parameters according to the proposed method for different cases are listed in Table 6. The fitness values of the objective functions are listed in Table 7 according to the active and reactive power responses in different characteristic zones. Based on the responses of Figure 13, Figure 14, Figure 15 and Figure 16 in different cases, the following conclusions can be drawn:

Table 6.
Tuned controller parameters in different cases.

Table 7.
Fitness values in different cases.
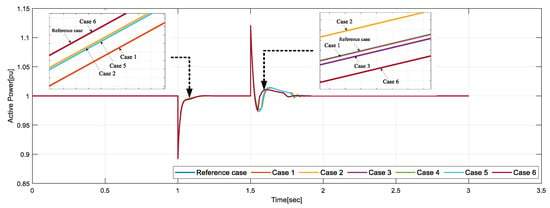
Figure 13.
Active power dynamic response in each case under operating scenario 1.
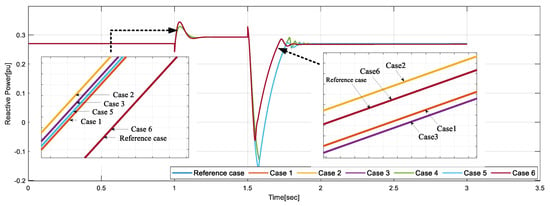
Figure 14.
Reactive power dynamic response in each case under operating scenario 1.
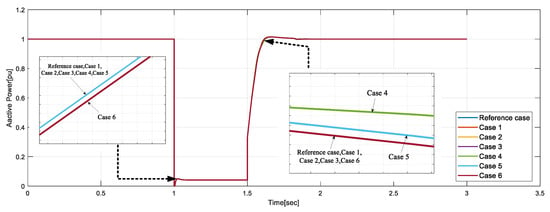
Figure 15.
Active power dynamic response in each case under operating scenario 2.
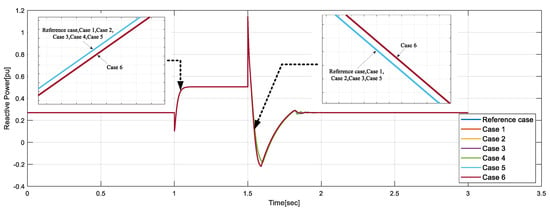
Figure 16.
Reactive power dynamic response in each case under operating scenario 2.
- (1)
- The response results and fitness values in Cases 1 and 2 matched the reference response in the base case. The tuned controller parameters approximate the control parameters of the base response and thus can be used as a benchmark for inverter design.
- (2)
- From the results of Case 3, it can be observed that in practical applications, if some parameters of the inverter are known, the reference values can be effectively tracked, and the remaining control parameters can be tuned.
- (3)
- Case 4 shows that if the equipment conditions limit the tuning parameters, the difficulty of the parameter tuning may increase.
- (4)
- Cases 5 and 6 were tuned using only two dynamic features under the occurrence and recovery periods of fault disturbances. The difficulty of parameter tuning may have increased in Case 5.
Generally, in multi-objective problems, PSO evaluates the fitness value using the weighting sum method. The weighting sum method involves assigning weights to each single-objective function. In this case, each objective function value is assigned an equal weight for equal representation. MOPSO continuously updates the Pareto front solutions in the external archives according to Pareto optimality, and the best solutions are selected. To compare the searchability of the multi-objective and single-objective algorithms, the MOPSO and PSO algorithms were compared by normalizing the results of the original objective functions with equal weighting to all objectives for Cases 1 and 2. Table 8 lists the controller parameters tuned using MOPSO and PSO, and Table 9 lists the fitness values calculated for MOPSO and PSO with different objective functions. Figure 17 and Figure 18 show the performance comparison for Cases 1 and 2, respectively. This shows that, owing to the continuous updating and replacement of the Pareto front solutions, MOPSO has better search performance and convergence than PSO and can be effectively applied for tuning controller parameters.

Table 8.
Tuned controller parameters using multi-objective algorithms and single-objective algorithms.

Table 9.
Fitness values in the test system using multi-objective algorithms and single-objective algorithms.
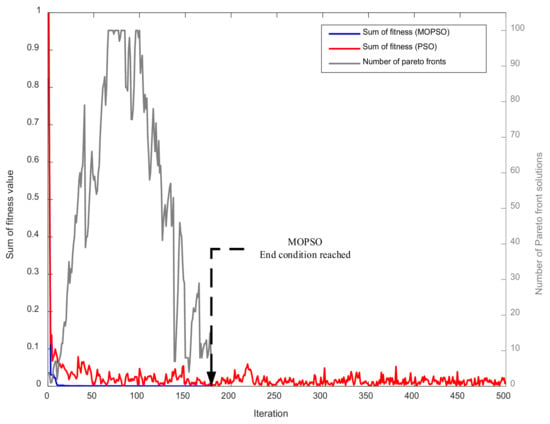
Figure 17.
Performance comparison in Case 1 using different algorithms.
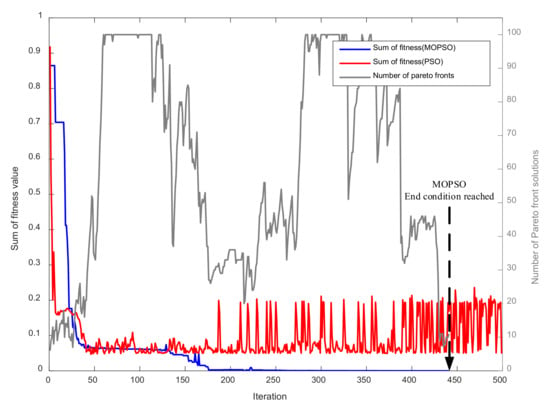
Figure 18.
Performance comparison in Case 2 using different algorithms.
5. Applications
To test the parameter tuning method proposed in this paper for practical application, the IEEE 39 bus power system shown in Figure 19 was used as the sample system, and a 100 MW PV power plant was installed at Bus 2. The effects of the reference cases in Table 1 on the IEEE 39 bus system are shown in Figure 20 and Figure 21. The controller parameters were adjusted based on the base scenarios and cases, as described in Table 3.
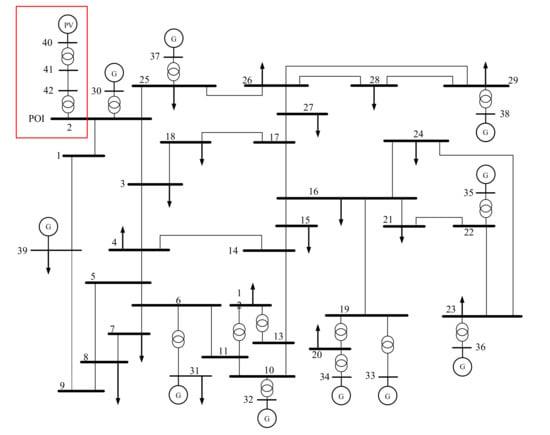
Figure 19.
IEEE 39 bus power system.
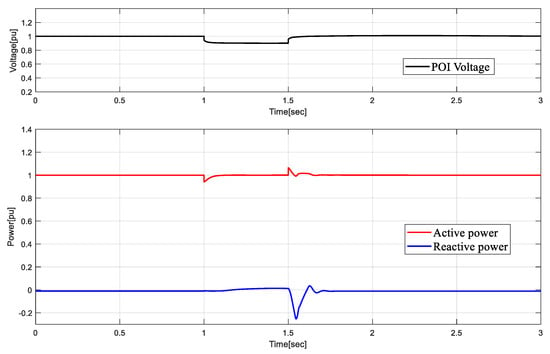
Figure 20.
Reference response of PV system installed in the IEEE 39 bus system under operating scenario 1.
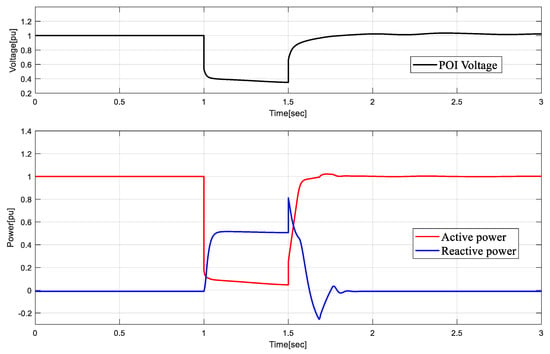
Figure 21.
Reference response of PV system installed in the IEEE 39 bus system under operating scenario 2.
The tuned controller parameters in the IEEE 39 bus system are listed in Table 10 according to the different cases. The fitness values of the objective functions are tabulated in Table 11 according to the active and reactive power responses in the different feature regions.

Table 10.
Tuned controller parameters of the IEEE 39 bus system under different scenarios.

Table 11.
Fitness values of the IEEE 39 bus system in different design scenarios.
According to the response and tuned parameters for Figure 22, Figure 23, Figure 24 and Figure 25 in different cases, the observations are as follows:
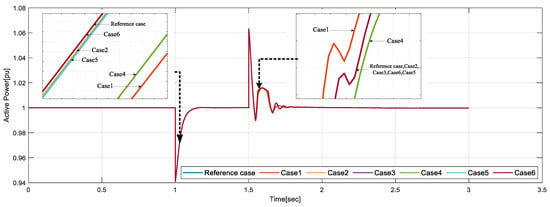
Figure 22.
Active power dynamic response in the IEEE 39 bus system under operating scenario 1.
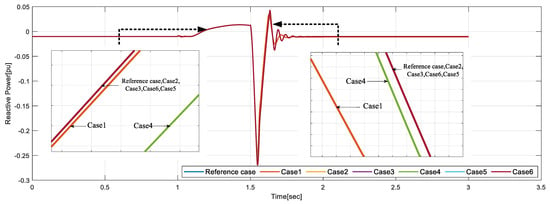
Figure 23.
Reactive power dynamic response in the IEEE 39 bus system under operating scenario 1.
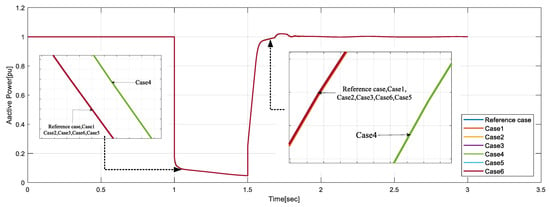
Figure 24.
Active power dynamic response of the IEEE 39 bus system under operating scenario 2.
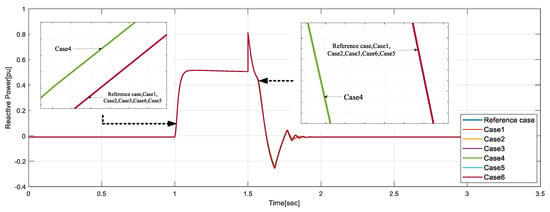
Figure 25.
Reactive power dynamic response of the IEEE 39 bus system under operating scenario 2.
- (1)
- Table 10 shows that the Case 1–Case 3 tuning results can approximate the reference cases. The dynamic response of the actual inverter in the power system can be simulated effectively.
- (2)
- In Case 4, if the equipment conditions limit the inverter responses, the difficulty in parameter tuning may increase.
- (3)
- Cases 5 and 6 are tuned by only two dynamic features under the occurrence and recovery periods of fault disturbances. The difficulty of parameter tuning in Cases 5 and 6 is more serious than that in Cases 1–3.
Table 12 shows the controller parameters tuned by MOPSO and PSO in Cases 1 and 2 for the IEEE 39 bus system. The fitness values obtained by MOPSO and PSO under different objectives are listed in Table 13. Figure 26 and Figure 27 show the performance comparisons for Cases 1 and 2, respectively. MOPSO has better search performance and convergence than PSO. Table 14 presents the GD and IGD values of the proposed method. It is observed that for both the systems and cases the performance values are quite low.

Table 12.
Tuned controller parameters in the IEEE 39 bus system using multi-objective algorithms and single-objective algorithms.

Table 13.
Fitness values in the IEEE 39 bus system using multi-objective algorithms and single-objective algorithms.
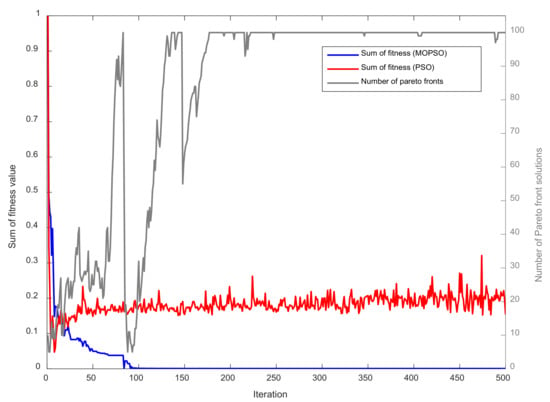
Figure 26.
Performance comparison of the IEEE 39 bus system in Case 1 using different algorithms.
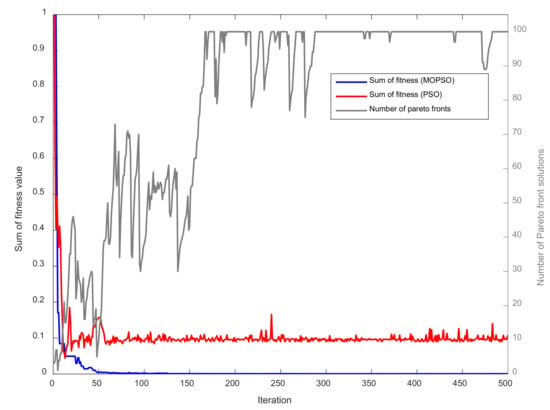
Figure 27.
Performance comparison of the IEEE 39 bus system in Case 2 using different algorithms.

Table 14.
Generational distance (GD) and inverted generational distance (IGD) using MOPSO for Test system IEEE 39 system.
6. Conclusions
With a large number of renewable energy generation systems connected to power systems, a regressive stability analysis is imperative. During the simulation stage, the WECC generic model was used to evaluate system stability. To ensure that the model response can meet the expected response of the equipment, a generic model parameter tuning method was proposed using MOPSO combined with Pareto optimality. The effectiveness of the proposed method was tested on a user-defined test system and an IEEE 39 bus system. The major conclusions drawn are as follows:
- (1)
- MOPSO can effectively improve the ability to search for the best solution in the solution space by continuously updating and replacing an external archive.
- (2)
- The performance of each objective feature in MOPSO is better than that of the single-objective weighting sum method. The lowest fitness values for IEEE 39 using MOPSO and PSO were 6.82 × 10⁻¹⁰ and 7.34 × 10⁻⁶, respectively, whereas the highest value using MOPSO was 1.76 × 10⁻⁷, and the highest value using PSO was 4.88 × 10⁻⁴. In other words, the MOPSO method is superior to the standard PSO method.
- (3)
- For different cases with different parameter selections and objective features, the proposed method can effectively tune the parameters to approximate the expected response. For the IEEE 39 system, the level of error between the MOPSO-tuned parameter values and the reference values was under 1%.
- (4)
- The proposed method can operate efficiently under various voltage scenarios. In other words, the proposed method is flexible under different field measurement conditions.
As an extended work, we plan to design a new objective function in accordance with the control system. In addition, more response characteristics, operation scenarios and different control modes will be considered. Moreover, the acquisition of real-time inverter data is planned, which will improve the tracking and performance of the method even further.
Author Contributions
Conceptualization, N.-C.Y.; funding acquisition, N.-C.Y.; investigation, N.-C.Y. and C.-W.H.; methodology, N.-C.Y. and C.-W.H.; software, N.-C.Y. and C.-W.H.; supervision, N.-C.Y.; validation, N.-C.Y. and C.-W.H.; writing—original draft preparation, N.-C.Y., C.-W.H. and A.S.; writing—review and editing, N.-C.Y. and Abhilash Sen. All authors have read and agreed to the published version of the manuscript.
Funding
This work was partially supported by the National Science and Technology Council (NSTC) in Taiwan (NSTC 111-2622-8-011-014-SB) and the DELTA-NTUST Joint Research Center.
Data Availability Statement
Not applicable.
Acknowledgments
This work was supported by the National Science and Technology Council (NSTC) in Taiwan. The authors are thankful for the funding provided by NSTC (NSTC 111-2622-8-011-014-SB) and Delta Electronics (DELTA)—National Taiwan University of Science of Technology (NTUST) Joint Research Center.
Conflicts of Interest
The authors declare no conflict of interest.
References
- Qazi, A.; Hussain, F.; Rahim, N.A.; Hardaker, G.; Alghazzawi, D.; Shaban, K.; Haruna, K. Towards sustainable energy: A systematic review of renewable energy sources, technologies, and public opinions. IEEE Access 2019, 7, 63837–63851. [Google Scholar] [CrossRef]
- Rizzi, F.; van Eck, N.J.; Frey, M. The production of scientific knowledge on renewable energies: Worldwide trends, dynamics and challenges and implications for management. Renew. Energy 2014, 62, 657–671. [Google Scholar] [CrossRef]
- Sadeghi, H.; Rashidinejad, M.; Moeini-Aghtaie, M.; Abdollahi, A. The energy hub: An extensive survey on the state-of-the-art. Appl. Therm. Eng. 2019, 161, 114071. [Google Scholar] [CrossRef]
- Renewables 2021; IEA: Paris, France, 2021.
- Chen, H.H.; Lee, A.H.J.R.; Reviews, S.E. Comprehensive overview of renewable energy development in taiwan. Renew. Sustain. Energy Rev. 2014, 37, 215–228. [Google Scholar] [CrossRef]
- Alam, M.S.; Al-Ismail, F.S.; Salem, A.; Abido, M.A.J.I.A. High-level penetration of renewable energy sources into grid utility: Challenges and solutions. IEEE Access 2020, 8, 190277–190299. [Google Scholar] [CrossRef]
- Kumar, K.P.; Saravanan, B. Recent techniques to model uncertainties in power generation from renewable energy sources and loads in microgrids—A review. Renew. Sustain. Energy Rev. 2017, 71, 348–358. [Google Scholar] [CrossRef]
- Athari, M.H.; Wang, Z. Modeling the uncertainties in renewable generation and smart grid loads for the study of the grid vulnerability. In Proceedings of the 2016 IEEE Power & Energy Society Innovative Smart Grid Technologies Conference (ISGT), Minneapolis, MN, USA, 6–9 September 2016; IEEE: Minneapolis, MN, USA, 2016; pp. 1–5. [Google Scholar]
- Dreidy, M.; Mokhlis, H.; Mekhilef, S. Inertia response and frequency control techniques for renewable energy sources: A review. Renew. Sustain. Energy Rev. 2017, 69, 144–155. [Google Scholar] [CrossRef]
- Yu, S.; Zhang, L.; Lu, H.H.-C.; Fernando, T.; Wong, K.P. A dse-based power system frequency restoration strategy for pv-integrated power systems considering solar irradiance variations. IEEE Trans. Ind. Inform. 2017, 13, 2511–2518. [Google Scholar] [CrossRef]
- Johnson, S.C.; Papageorgiou, D.J.; Mallapragada, D.S.; Deetjen, T.A.; Rhodes, J.D.; Webber, M.E. Evaluating rotational inertia as a component of grid reliability with high penetrations of variable renewable energy. Energy 2019, 180, 258–271. [Google Scholar] [CrossRef]
- Etxegarai, A.; Eguia, P.; Torres, E.; Iturregi, A.; Valverde, V. Review of grid connection requirements for generation assets in weak power grids. Renew. Sustain. Energy Rev. 2015, 41, 1501–1514. [Google Scholar] [CrossRef]
- Lammert, G.; Heß, T.; Schmidt, M.; Schegner, P.; Braun, M. Dynamic grid support in low voltage grids—Fault ride-through and reactive power/voltage support during grid disturbances. In Proceedings of the 2014 Power Systems Computation Conference, Wroclaw, Poland, 18–22 August 2014; IEEE: Wroclaw, Poland, 2014; pp. 1–7. [Google Scholar]
- Zhu, S.; Piper, D.; Ramasubramanian, D.; Quint, R.; Isaacs, A.; Bauer, R. Modeling inverter-based resources in stability studies. In Proceedings of the 2018 IEEE Power & Energy Society General Meeting (PESGM), Portland, OR, USA, 5–10 August 2018; IEEE: Portland, OR, USA, 2018; pp. 1–5. [Google Scholar]
- Ćuk, V.; Ribeiro, P.F.; Cobben, J.F.; Kling, W.L.; Isleifsson, F.R.; Bindner, H.W.; Martensen, N.; Samadi, A.; Söder, L. Considerations on the Modeling of Photovoltaic Systems for Grid Impact Studies. In Proceedings of the 1st International Workshop on the Integration of Solar Power into Power Systems, Aarhus, Denmark, 24 October 2011; pp. 35–42. [Google Scholar]
- Nanou, S.I.; Papathanassiou, S.A. Modeling of a pv system with grid code compatibility. Electr. Power Syst. Res. 2014, 116, 301–310. [Google Scholar] [CrossRef]
- Mahseredjian, J.; Dinavahi, V.; Martinez, J.A. Simulation tools for electromagnetic transients in power systems: Overview and challenges. IEEE Trans. Power Deliv. 2009, 24, 1657–1669. [Google Scholar] [CrossRef]
- Hariri, A.; Faruque, M.O. A hybrid simulation tool for the study of pv integration impacts on distribution networks. IEEE Trans. Sustain. Energy 2016, 8, 648–657. [Google Scholar] [CrossRef]
- Ellis, A.; Behnke, M.; Elliott, R. Generic Solar Photovoltaic System Dynamicsimulation Model Specification; Sandia Report; Sandia National Laboratories: Albuquerque, NM, USA, 2013. [Google Scholar]
- Sørensen, P.; Andresen, B.; Fortmann, J.; Pourbeik, P. Modular structure of wind turbine models in iec 61400-27-1. In Proceedings of the 2013 IEEE Power & Energy Society General Meeting, Vancouver, BC, Canada, 21–25 July 2013; IEEE: Vancouver, BC, Canada, 2013; pp. 1–5. [Google Scholar]
- Farantatos, E. Model User Guide for Generic Renewable Energy Systemmodels; Tech. Rep. 3002014083; Electric Power Research Institute: Washington, DC, USA, 2018. [Google Scholar]
- Göksu, Ö.; Sørensen, P.; Morales, A.; Weigel, S.; Fortmann, J.; Pourbeik, P. Compatibility of iec 61400-27-1 and wecc 2nd generation wind turbine models. In Proceedings of the 15th International Workshop on Large-Scale Integration of Wind Power into Power Systems as well as on Transmission Networks for Offshore Wind Power Plants, Vienna, Austria, 15–17 November 2016; pp. 15–17. [Google Scholar]
- Eguia, P.; Etxegarai, A.; Torres, E.; San Martin, J.; Albizu, I. Modeling and validation of photovoltaic plants using generic dynamic models. In Proceedings of the 2015 International Conference on Clean Electrical Power (ICCEP), Taormina, Italy, 16–18 June 2015; IEEE: Taormina, Italy, 2015; pp. 78–84. [Google Scholar]
- Pourbeik, P.; Etzel, N.; Wang, S. Model validation of large wind power plants through field testing. IEEE Trans. Sustain. Energy 2017, 9, 1212–1219. [Google Scholar] [CrossRef]
- Machlev, R.; Batushansky, Z.; Soni, S.; Chadliev, V.; Belikov, J.; Levron, Y. Verification of utility-scale solar photovoltaic plant models for dynamic studies of transmission networks. Energies 2020, 13, 3191. [Google Scholar] [CrossRef]
- Lammert, G.; Premm, D.; Ospina, L.D.P.; Boemer, J.C.; Braun, M.; Van Cutsem, T. Control of photovoltaic systems for enhanced short-term voltage stability and recovery. IEEE Trans. Energy Convers. 2018, 34, 243–254. [Google Scholar] [CrossRef]
- Abubakar, H.; Abdullahi, M.; Smaiala, B. Ants colony optimization algorithm in the hopfield neural network for agricultural soil fertility reverse analysis. Iraqi J. Comput. Sci. Math. 2022, 3, 32–42. [Google Scholar] [CrossRef]
- Shamis, N.A.; Mohammad, A.; Hind Raad, I. Rao-svm machine learning algorithm for intrusion detection System. Iraqi J. Comput. Sci. Math. 2020, 1, 23–27. [Google Scholar] [CrossRef]
- Saleh, B.; Yousef, A.M.; Ebeed, M.; Abo-Elyousr, F.K.; Elnozahy, A.; Mohamed, M.; Abdelwahab, S.A.M. Design of pid controller with grid connected hybrid renewable energy system using optimization algorithms. J. Electr. Eng. Technol. 2021, 16, 3219–3233. [Google Scholar] [CrossRef]
- Fetouh, T.; Zaky, M.S. New approach to design svc-based stabiliser using genetic algorithm and rough set theory. IET Gener. Transm. Distrib. 2017, 11, 372–382. [Google Scholar] [CrossRef]
- Shahgholian, G.; Movahedi, A. Power system stabiliser and flexible alternating current transmission systems controller coordinated design using adaptive velocity update relaxation particle swarm optimisation algorithm in multi-machine power system. IET Gener. Transm. Distrib. 2016, 10, 1860–1868. [Google Scholar] [CrossRef]
- Soni, S. Solar pv Plant Model Validation for Grid Integration Studies; Arizona State University: Tempe, AZ, USA, 2014. [Google Scholar]
- Chi, Y.; Xu, Y. Multi-objective robust tuning of statcom controller parameters for stability enhancement of stochastic wind-penetrated power systems. IET Gener. Transm. Distrib. 2020, 14, 4805–4814. [Google Scholar] [CrossRef]
- Helton, J.C.; Davis, F.J. Latin hypercube sampling and the propagation of uncertainty in analyses of complex systems. Reliab. Eng. 2003, 81, 23–69. [Google Scholar] [CrossRef]
- Yang, N.C.; Le, M.D. Multi-objective bat algorithm with time-varying inertia weights for optimal design of passive power filters set. IET Gener. Transm. Distrib. 2015, 9, 644–654. [Google Scholar] [CrossRef]
- Yang, N.-C.; Le, M.-D. Optimal design of passive power filters based on multi-objective bat algorithm and pareto front. Applied Soft Computing 2015, 35, 257–266. [Google Scholar] [CrossRef]
- Reyes-Sierra, M.; Coello, C.C. Multi-objective particle swarm optimizers: A survey of the state-of-the-art. Int. J. Comput. Intell. Res. 2006, 2, 287–308. [Google Scholar]
- Chiu, W.-Y.; Yen, G.G.; Juan, T.-K. Minimum manhattan distance approach to multiple criteria decision making in multiobjective optimization problems. IEEE Trans. Evol. Comput. 2016, 20, 972–985. [Google Scholar] [CrossRef]
Disclaimer/Publisher’s Note: The statements, opinions and data contained in all publications are solely those of the individual author(s) and contributor(s) and not of MDPI and/or the editor(s). MDPI and/or the editor(s) disclaim responsibility for any injury to people or property resulting from any ideas, methods, instructions or products referred to in the content. |
© 2023 by the authors. Licensee MDPI, Basel, Switzerland. This article is an open access article distributed under the terms and conditions of the Creative Commons Attribution (CC BY) license (https://creativecommons.org/licenses/by/4.0/).