Article

Numerical Method for Geometrical Feature Extraction and Identification of Patient-Specific Aorta Models in Pediatric Congenital Heart Disease

by
Alex G. Kuchumov
1,2,
Olga V. Doroshenko
1,*,
Mikhail V. Golub
1,
Nikita D. Saychenko
1,
Irina O. Rakisheva
2 and
Roman M. Shekhmametyev
3
1
Institute for Mathematics, Mechanics and Informatics, Kuban State University, Krasnodar 350040, Russia
2
Department of Computational Mathematics, Mechanics and Biomechanics, Perm National Research Polytechnic University, Perm 614990, Russia
3
S.G. Sukhanov Federal Center for Cardiovascular Surgery, Perm 614013, Russia
*
Author to whom correspondence should be addressed.
Mathematics 2023, 11(13), 2871; https://doi.org/10.3390/math11132871
Submission received: 4 June 2023 / Revised: 19 June 2023 / Accepted: 25 June 2023 / Published: 27 June 2023
(This article belongs to the Section Mathematical Physics)

Abstract

:
An algorithm providing information on the key geometric features of an aorta extracted from multi-slice computed tomography images is proposed. Using the numerical method, the aorta’s geometric characteristics, such as vessel cross-sectional areas and diameters, as well as distances between arteries, can be determined. This step is crucial for training the meta-model necessary to construct an expert system with a significantly reduced volume of data and for identifying key relationships between diagnoses and geometric and hydrodynamic features. This methodology is expected to be part of an innovative decision-making software product for clinical implementation. Based on clinical and anamnestic data as well as calculations, the software will provide the shunt parameters (in particular, its diameter) and installation position to ensure regular blood flow.

1. Introduction

Congenital heart defects are anomalies in the structure of the heart and/or major blood vessels that disrupt normal hemodynamics [1,2]. This leads to a lack of oxygenated blood supply to newborn internal organs, resulting in abnormal development. A total of 25–30% of newborns suffer from congenital heart defects, with up to half requiring surgical intervention in their first year of life [3]. It is important to note that not all congenital heart defects require treatment, but they can lead to serious health problems and even death in severe cases [4]. Common diseases of the aorta include aortic arch hypoplasia, coarctation of the aorta (CoA), and patent ductus arteriosus [4]. Turbulent flow in the wide post-coarctation area can cause aneurysm development [5], while a decrease in pressure wave velocity is observed in the descending aorta. Some authors have noted a very high mortality rate (up to 25%) after surgical correction of aortic arch hypoplasia [6].
It should be noted that there is currently no standardized method for correcting CoA and hypoplasia [7]. In each case, the anatomical and hemodynamic characteristics of the patient should guide the assessment of treatment outcomes [8]. Therefore, obtaining detailed information on hemodynamics in aorta, which has complex geometry (see Figure 1), before and after intervention may be crucial for the optimal treatment of congenital heart defects.
Over the past several decades, traditional modeling methods such as computational fluid dynamics (CFD) have been used to assist surgery [9,10,11]. This method has found applications in medical research and helps fill gaps in knowledge about processes occurring in aortas with different pathologies. CFD allows the modeling of hemodynamics while taking into account patient-specific features using CT, 4D MRI, and other images [12,13,14,15,16]. Based on CFD, methodologies for studying surgical treatment effectiveness have been developed [12,14]. Computational modeling enables a detailed analysis of flow characteristics and the distribution of wall shear stresses [14,17,18], making this method almost universal.
However, due to the high complexity of the underlying physical problem of viscous flow in three-dimensional fluids, such methods are highly specialized and time-consuming and require expertise in engineering and medicine, which hinders their use in emergency situations. Thus, many promising applications of hemodynamic modeling based on images have not yet found practical use in clinical practice. Machine learning may solve this problem, as it can provide an answer in a few minutes, even on low-performance computers. Deep neural networks, as a sub-field of machine learning, find the correct mathematical transformation to convert input data into output data, regardless of linear or nonlinear correlation. In recent years, there has been increasing interest in machine learning applications in hydrodynamics. This is evidenced by Taebi [5], who showed that about 87% of the articles related to the topic were published after 2020.
There have already been studies on the use of deep neural networks as an alternative to traditional computational methods [19,20,21]. These studies demonstrate neural networks’ ability to find complex relationships between shapes, boundary conditions, and flow hemodynamics. The accuracy of such neural networks approaches that of CFD. However, researchers often face the problem that multi-spiral computed tomography (MSCT) or 4D MRI is only prescribed to patients in cases of acute necessity, which creates a data deficit for training. These problems were solved by Liang et al. [19], Bruse et al. [22], Liang et al. [23], and Hahn et al. [24], who created surrogate aortas using statistical shape analysis (SSM). As a result, the aortas obtained differ from real ones in 95.58% of cases according to experts [23].
A modified Blalock–Taussig shunt (MBTS) is adopted as the first step in the surgical treatment of congenital heart disease. A polytetrafluoroethylene shunt provides blood flow from the systemic circulation to the pulmonary circulation. However, MBTS operations cause complications. Modern modeling techniques can be applied to predict and evaluate complications in the post-surgical period.
Computational modeling is used to study local hemodynamics in MBTS surgery. Such studies using numerical simulation were first conducted by Song et al. [25] and Lagana et al. [26] using the computational fluid dynamics (CFD) method. The shunt size, its location, and its angles of proximal anastomoses for an idealized geometry were considered in these works. A similar study was carried out by Arnaz et al. [27]. CFD is employed to determine the parameters of flow in a channel with solid walls. It allows for a detailed description of local flow in complex geometry. Thus, the hemodynamic effects of the nonclosure of patent ductus arteriosus [28] on pulmonary blood flow were analyzed using the CFD method. Liu et al. [29] and Zhao et al. [30] conducted a series of studies of MBTS shunts using real geometry to analyze the hemodynamic parameters of local blood flow, including the degree of shunt occlusion.
The numerical method proposed here is intended to be further included in a machine learning (ML)-based meta-model to determine patient-specific hemodynamic parameters during MBTS surgery as an alternative to conventional numerical methods. As a result of the use of key geometric parameters of an infant’s aorta, the meta-model being developed will predict the hemodynamics. A brief description of the concept to be developed in future studies can be found in Section 5. Our methodology has the advantage of CFD-based methods in that a patient-specific hemodynamic outcome can be computed quickly with minimal demand on processing resources. The aim is to use clinical and anamnestic data and fluid structure interaction simulations to determine the shunt parameters (at least the shunt diameter) and installation position to ensure regular blood flow following surgery. Thus, the approach to be developed seems promising to overcome the high rate of post-operation mortality and boost the development of ML-based software for the prediction of such surgical interventions.
The extraction of key geometric features is crucial for training the meta-model since it allows for a significant reduction in the volume of data and identifies key relationships between diagnoses and geometric and hydrodynamic features. Recently, a method to estimate shape features to identify patients at high risk of ascending aortic aneurysm growth was proposed in [31]. To obtain a tessellated surface, Geronzi et al. [31] employed the semiautomatic local thresholding method and the flying edges algorithm as well as the post-processing erosion and expansion methods. The latter is time-consuming and demands a lot of manual work. On the other hand, Saitta et al. [32] trained a convolutional neural network (CNN) using 400 arrays of 3D images and applied this CNN to automatically segment the thoracic aorta. An authentic and rather simple numerical method that allows the fast processing of raw images to determine key geometric features without labeling data is proposed in this study. The proposed algorithm can be rather easily implemented (only the density-based spatial clustering of applications with noise (DBSCAN) [33] and common numerical geometric evaluations are employed), and it can also be applied if the tessellated model is available (for instance, for geometry saved in stl. format).
Piccinelli et al. [34] presented a framework for the geometric analysis of vascular structures. In particular, the framework quantifies the geometric relationships between the elements of a vascular network based on centerlines. In the present study, a dissimilar algorithm for the processing and extraction of information about the geometry of an aorta from a set of multi-slice computed tomography images is proposed. First, by employing triangulation, the surfaces corresponding to the inner walls of the aorta and outgoing arteries are reconstructed. The entry point is determined, and a sequence of aortic cross-sections is obtained as planes that deviate the least from the normal to the surfaces. Next, the geometric center of the surface section corresponding to the aortic walls is calculated for each cross-section.

2. Vessel Surface Determination from Multi-Slice Computed Tomography Images

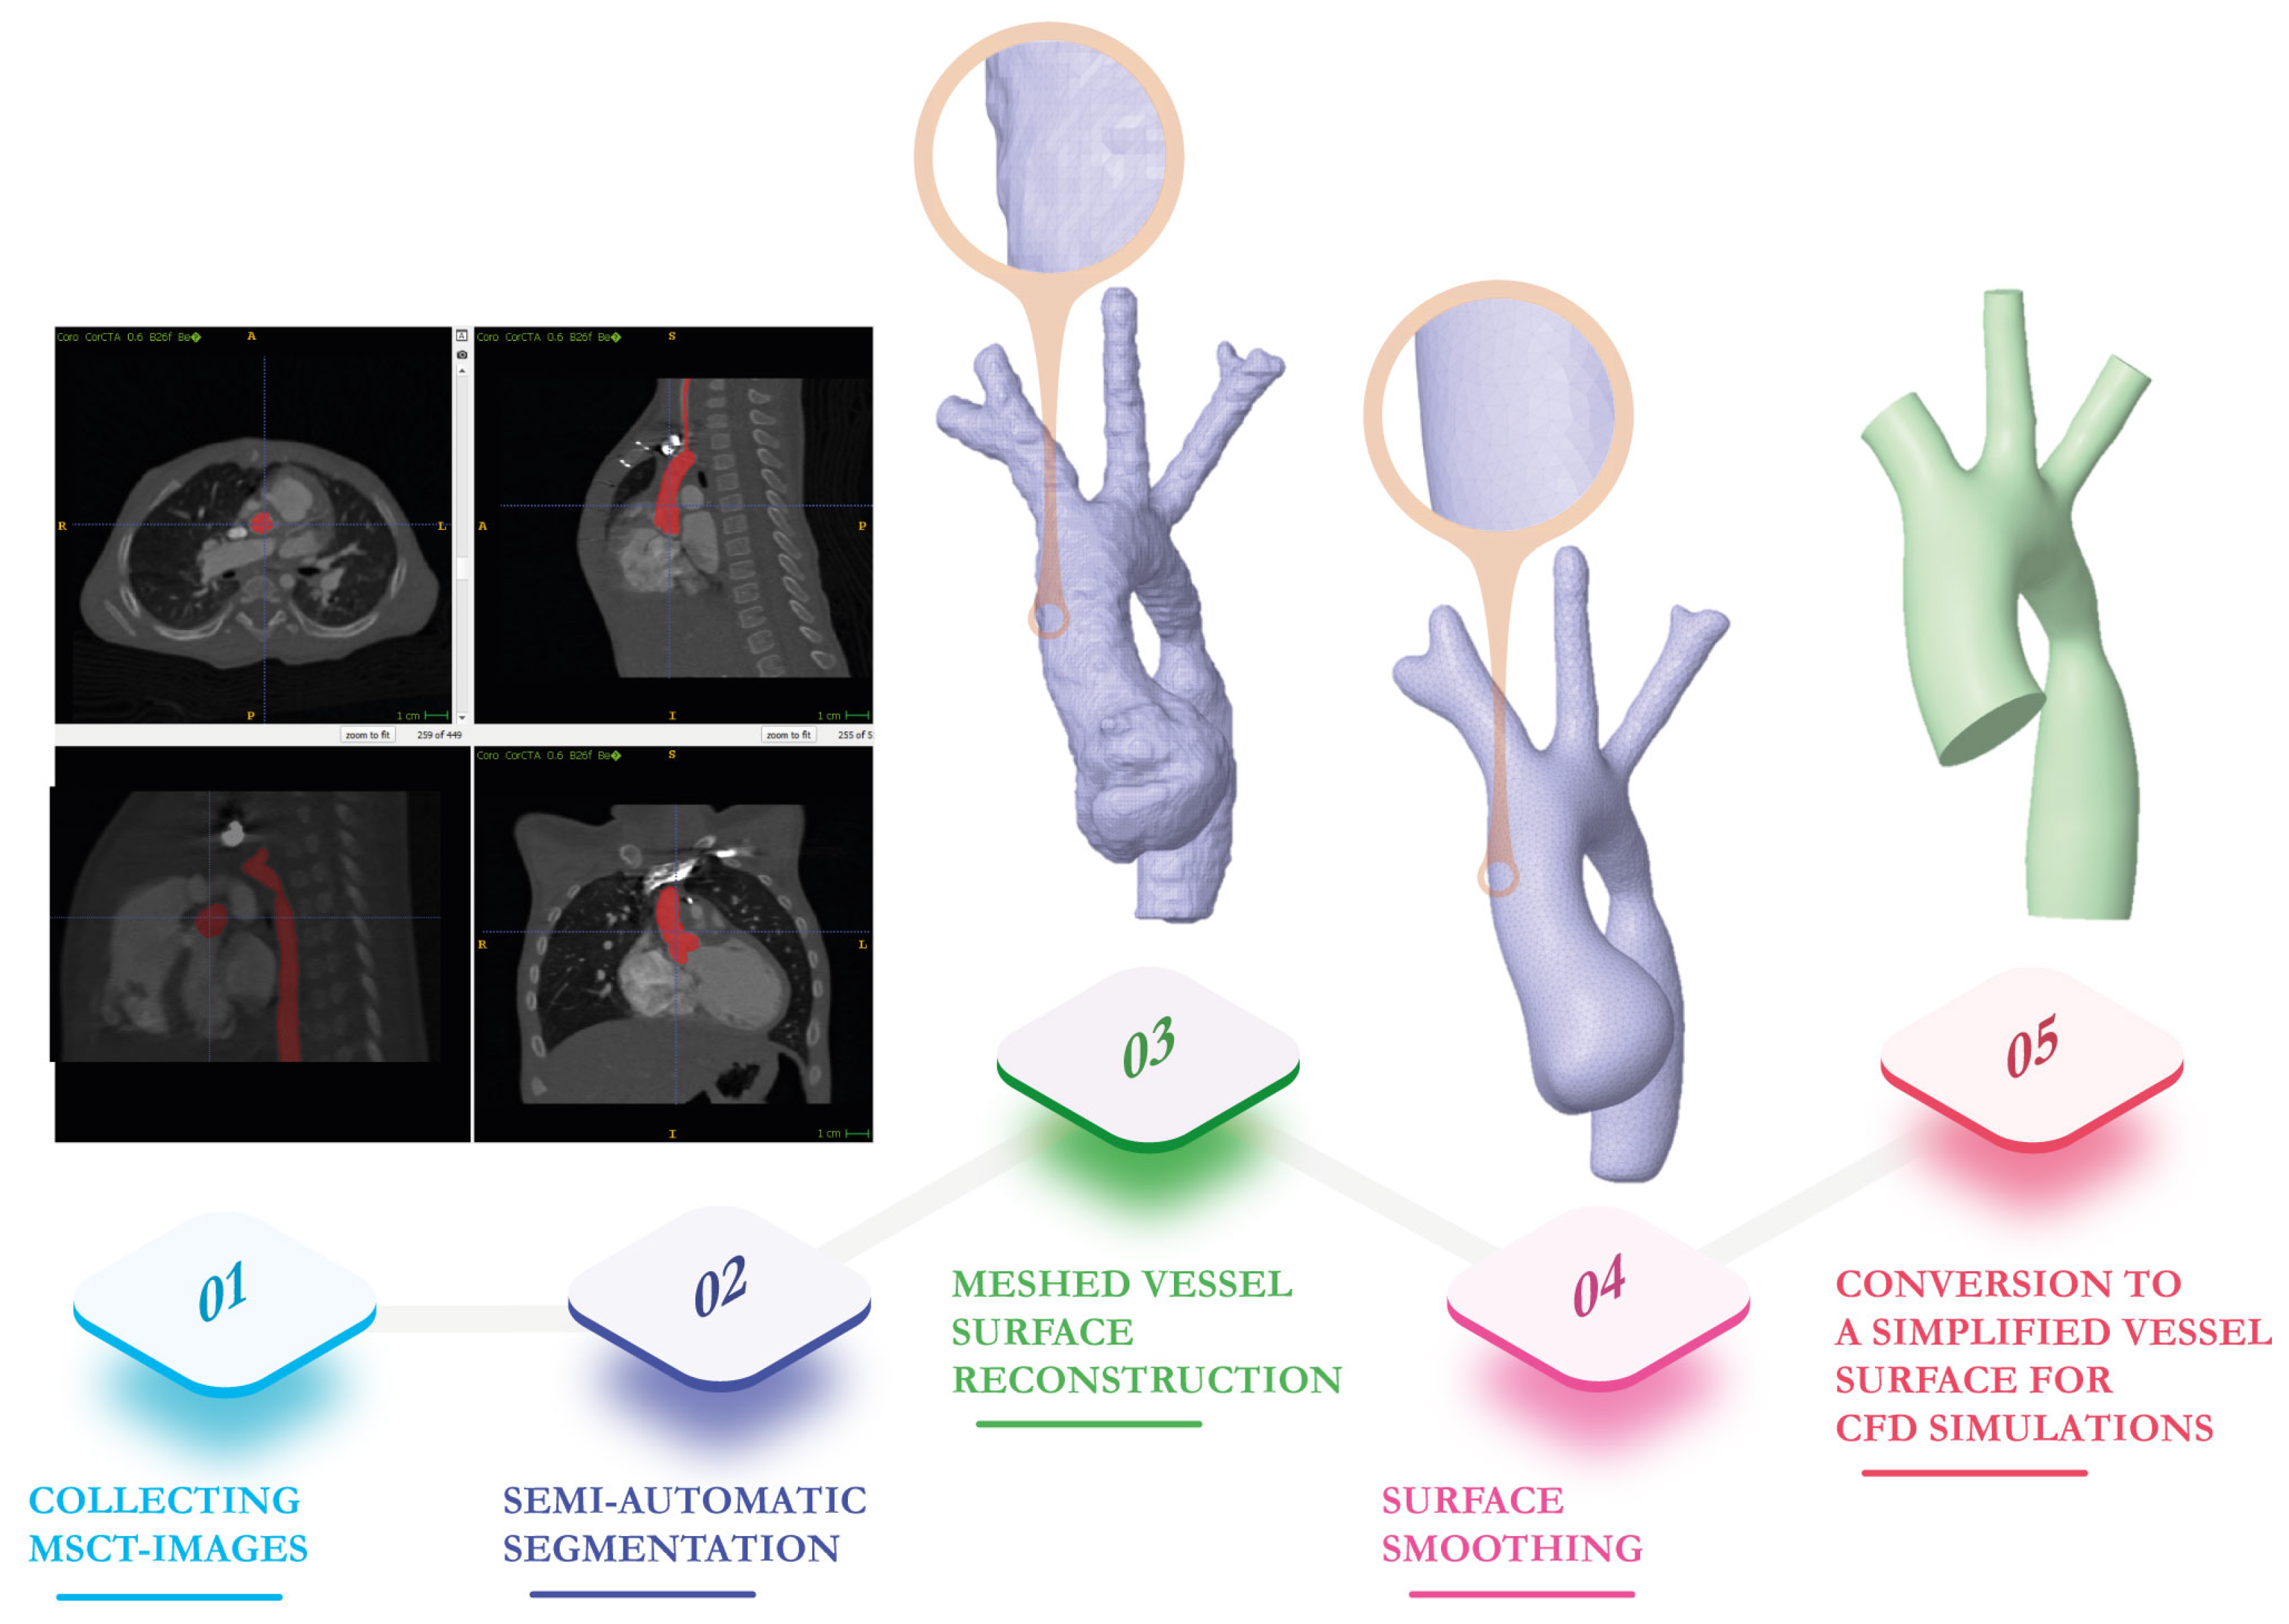
To obtain 3D models suitable for key geometrical feature extraction and CFD computations, for instance, using ANSYS, it is necessary to segment the aorta from a CT scan and convert MSCT images into the resulting vessel surfaces see the scheme of the reconstruction in Figure 2. Thus, .stl format can be employed for 3D printing or geometry feature analysis, whereas .stp format is preferable for CFD simulations. The first step (segmentation) is implemented by employing the open-source software ITK-Snap, which allows the manual selection of areas of interest and the semi-automatic segmentation of medical images.
In ITK-Snap, automatic segmentation using region competition snakes was used. First, the caudate nucleus was segmented. After that, we selected a sub-region of the image that contained the caudate nucleus. The region of interest is a rectilinear box, while the regions in region competition are arbitrary in shape and are defined by uniform intensity. The region of interest is adjusted by dragging the sides of the selection box. The next step is the estimation of the range of intensities to which the voxels in the caudate nucleus belong. Finally, the Snake Evolution algorithm was applied to create the 3D aorta model surface.
The output from ITK-Snap is a 3D model of the aorta in the form of triangles that describe the shape of the patient’s specific aorta. The second step is surface smoothing, which is necessary because the ITK-Snap model is composed of triangles whose vertices are located at the points, where the voxels are located. This makes the surface appear “stepped”.
Meshmixer (free open-source software) was used for surface smoothing using the Sculpt tool. Different brushes can be used to create convex and concave shapes and increase the number of triangles describing the surface. The final step is converting the .stl file to .stp using ANSYS’s built-in SpaceClaim program. SpaceClaim has an automatic shell-forming tool that creates patches on the surface of the aorta, completely enveloping it and resulting in an object that can be saved in .stp format. It is also necessary to create planes for further calculations to which initial conditions will be applied. This algorithm was developed to be applied to more than 500 scans that will be further integrated into the meta-model.

3. Main Geometrical Characteristics of Aorta

To provide data for the meta-model based on machine learning methods and the prediction of the hemodynamics of the aorta without CFD simulations, the key geometrical features need to first be defined. One can see that four vessels can be distinguished for the aorta: the aorta, consisting of three sub-domains (the ascending part of aorta, the aortic arch, and the descending part of the aorta) and three arteries: the brachiocephalic artery (BCA), left subclavian artery (LSCA), and left common carotid artery (LCCA) (see Figure 1).
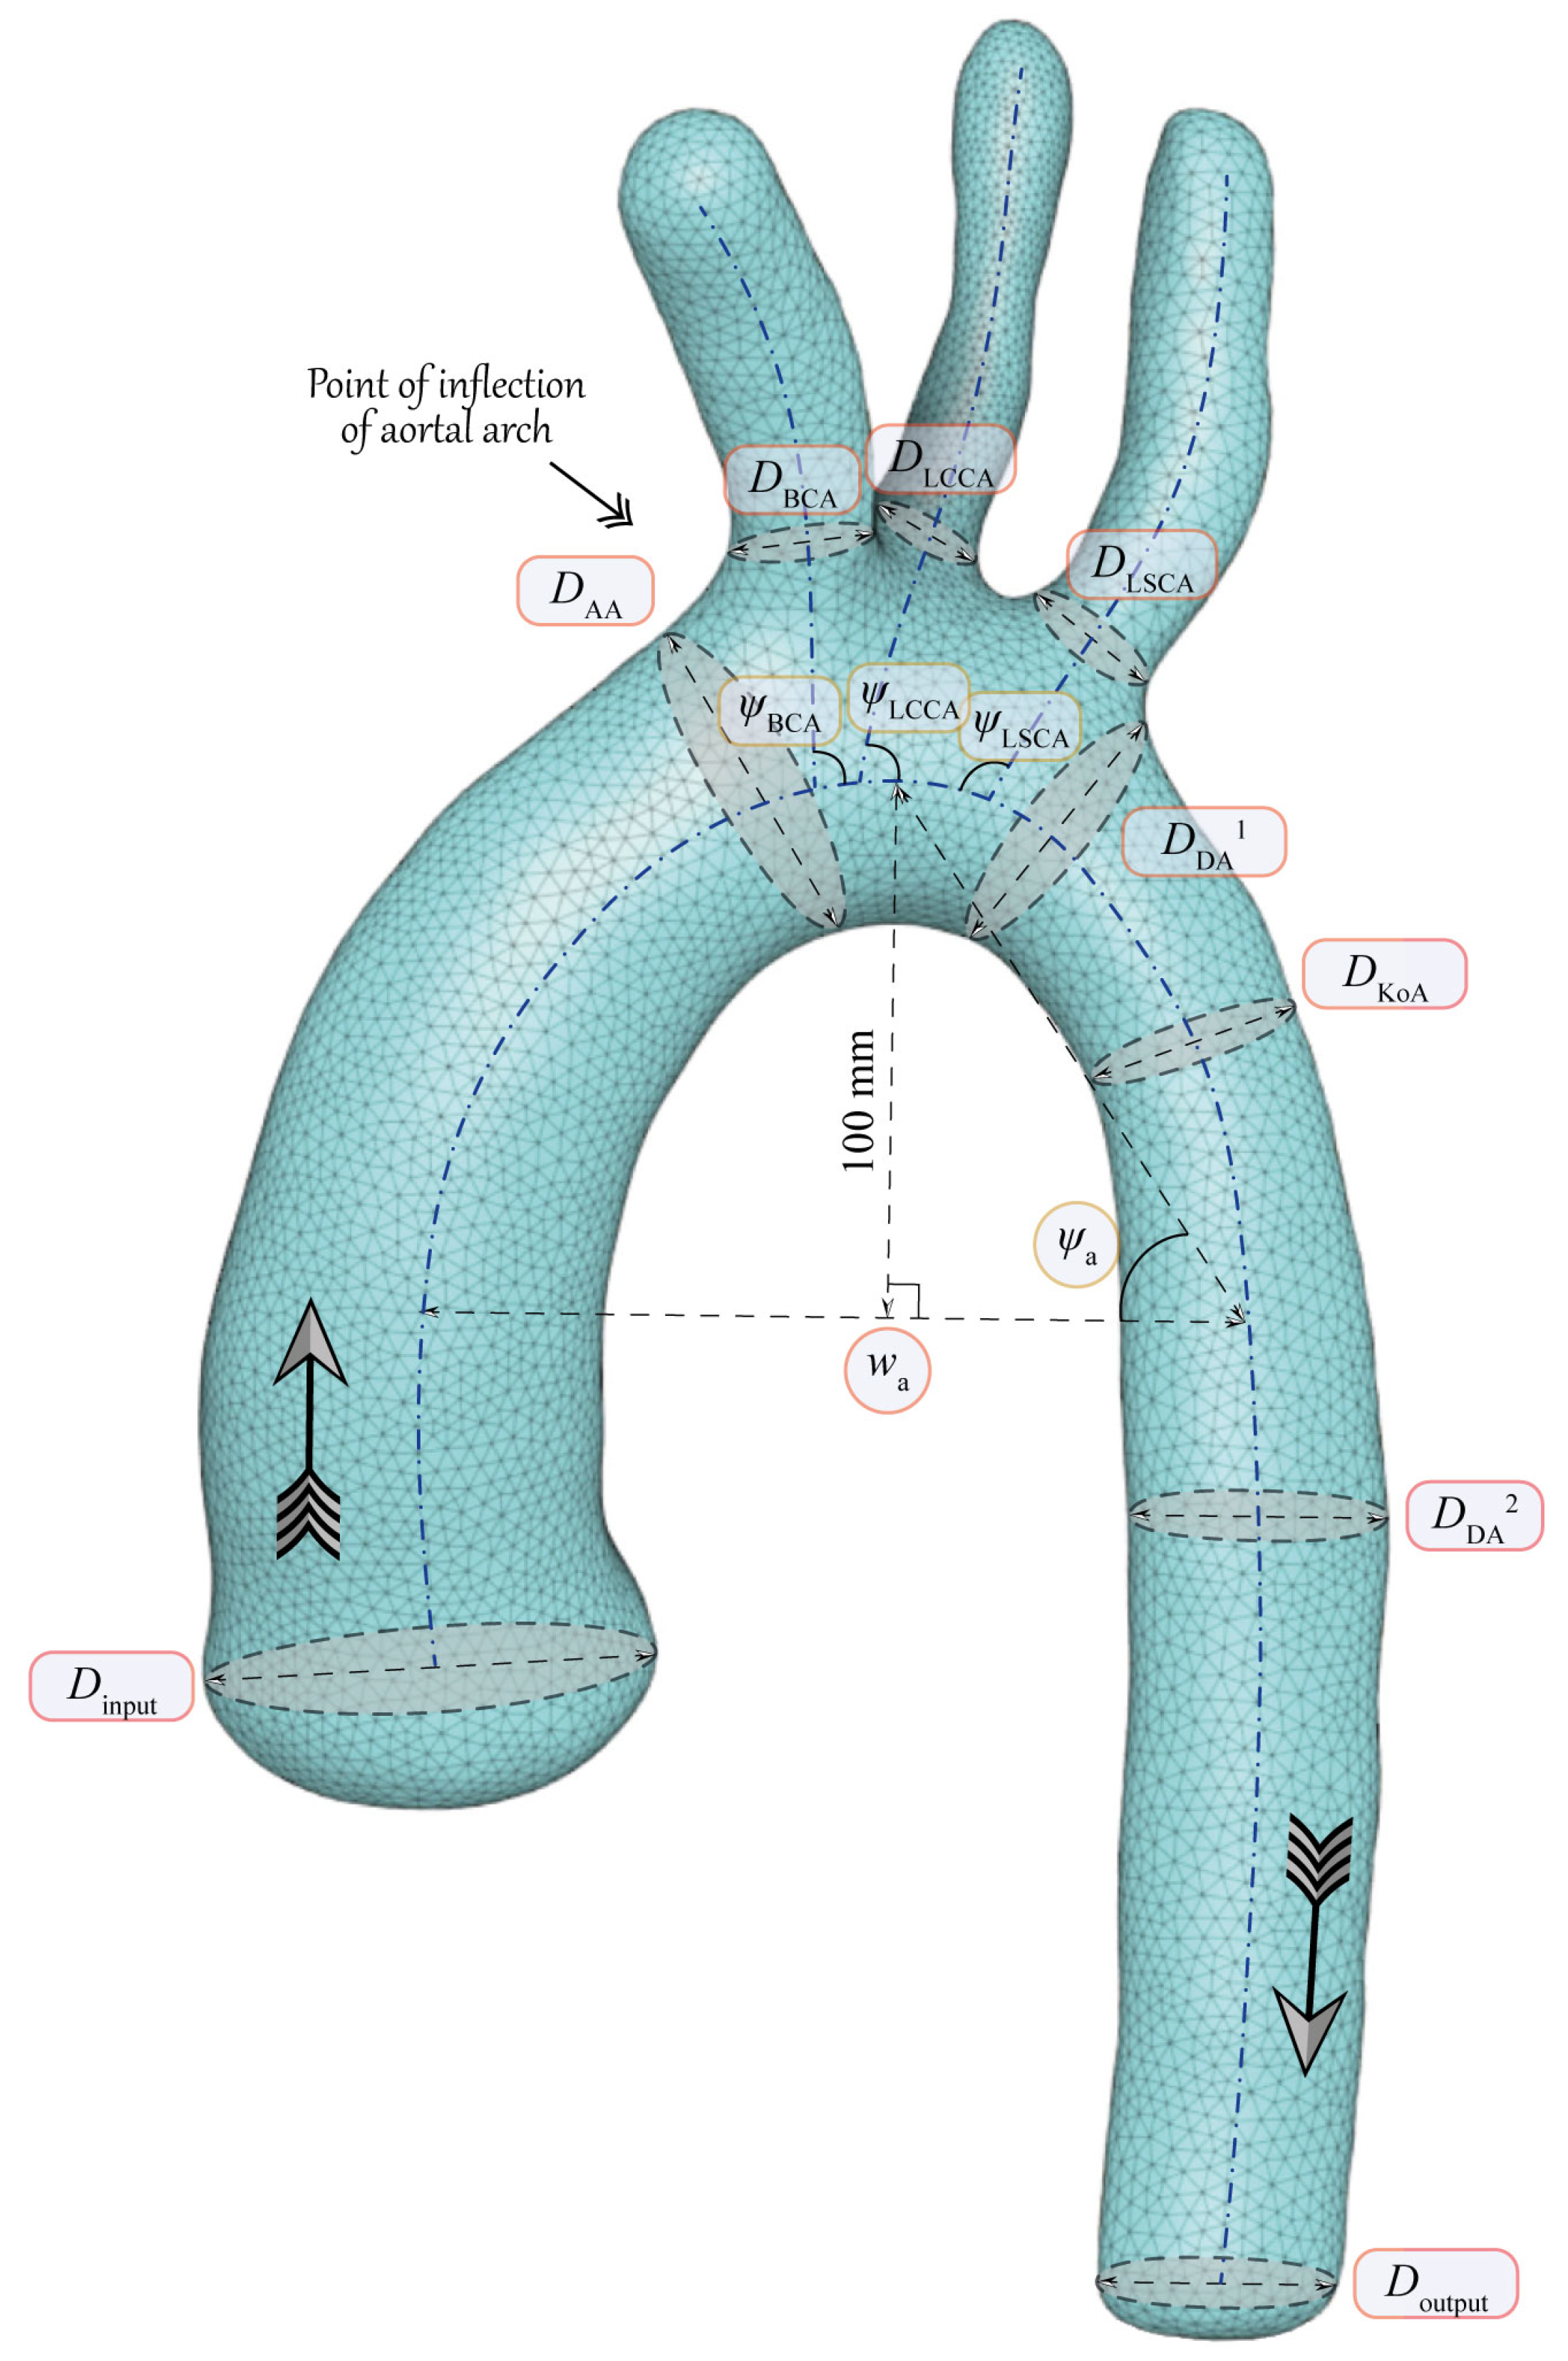
Figure 3 exhibits a particular aorta with the set of features determined and proposed here based on experience and estimations in medicine, differential geometry, and hydrodynamics. The key geometrical parameters are split into several parts: the cross-sectional area s i j and the corresponding maximum and minimum diameters of the vessels, denoted by D i j , the angles between arteries and the aorta ψ j in the vicinity of bifurcation points, and the parameters of the aortic arch ( ψ a and w a ). Since the proposed numerical method extracts the central lines and cross-section parameters along with them, the set of key features can be further extended for more accurate predictions during meta-model adjustment.

4. Algorithm for Extraction of Geometrical Characteristics of Aorta

Step 1. The stage of the evaluation of the multi-slice computed tomography images described in Section 2 provides us with the array of points situated at the surface describing all the considered vessels related to the aorta. Let us denote the points corresponding to the surface of the m-th discretized vessel (the aorta or arteries) by M = { M k } , whereas points C k ( m ) situated at the centerlines L ( m ) of vessels are to be determined along with the characteristics of the cross-section with the minimum area (minimum diameter d k ( m ) and maximum diameter D k ( m ) ).
Since all parts of the vessels can be evaluated in the same manner, the same numerical procedure can be applied for each vessel, but with different criteria for approaching the end of the current vessel only. The flowchart of the proposed algorithm is depicted in Figure 4. In the first stage, the input point for the m-th vessel and the normal to determine the direction of the search for the first point of the centerline are defined. Next, the algorithm determines points lying on centerlines and the corresponding cross-sections with the minimum area.
The superscript m is omitted below for simplicity as long as the procedure is applicable to all parts without sufficient restrictions. The average circumradius of the triangles Δ h obtained is calculated first. The step for the reconstruction of centerlines is as follows:
h i = 2 Δ h i = 1 Δ h i 1 .
Step 2. First, let us determine the input point C 0 and normal n 0 , which are necessary in Step 3 for evaluating the next point at the centerline in the m-th vessel.
Step 2.1. To this end, the point A 0 with the minimum ( m = 1 , 2 ) or maximum ( m = 3 , 4 , 5 ) coordinate x 3 is chosen. The latter assumption is correct because the orientation of the patient is the same during multi-slice computed tomography. All points in the ϵ -neighborhood are denoted by
S 0 = { M k M : ρ ( M k , A 0 ) ϵ } .
Step 2.2. The approximation of the point set S 0 by a surface of the second order
x 3 = ω 0 + ω 1 x 1 + ω 2 x 2 + ω 3 x 1 x 2 + ω 4 x 1 2 + ω 5 x 2 2 + ε
with the minimum deviation from S 0 is then performed using the least-squares method.
The unitary vector of the normal n 0 ( | n 0 | = 1 ) at the critical point C 0 of the surface x 3 = F ( x 1 , x 2 ) is chosen as a starting point, which is employed in the next step to determine the next point A 1 as
A 1 = C 0 + n 0 · h 0 .
Step 3. The movement along the centerline L and the determination of the point C i L assume that the previous point C i 1 and the direction of the search for the next point n i 1 ( | n i 1 | = 1 ) are already determined.
Step 3.1. Let us determine a point
A i = C i 1 + n i 1 · h i ,
in the vicinity of the sought point C i . The next segment of data is:
S i = { M k M : ρ ( M k , P ( A i , n i 1 ) ) h i } ,
where P ( A i , n i 1 ) is the plane passing through the point A i with the normal n i 1 . In this step, it is also ensured using DBSCAN that only one class of points is obtained intersecting the plane with M . If the segment of data is divided into several classes, then the required class is selected by the condition
k = c l a s s _ i n d e x min j ρ ( A i , O i j ) ,
where O i j is the center of the class j. An example of the application of the algorithm for the third vessel is depicted in Figure 5.
Step 3.2. Therefore, the search for the cross-section with the minimum area starts. It is assumed that the plane is situated at the point A i , and the normal corresponding to the minimum area is to be determined numerically so that
n i = arg min n A r e a M P A i , n ,
where A r e a M P A i , n determines the area of the cross-section using the procedure approximating the curve obtained from the projection of the point in the vicinity of the plane onto it.
Step 3.3. Finally, the point C i L can be calculated as the central point of the vessel part
S i = { M k M : ρ ( M k , P ( A i , n i ) ) h i }
or as a central point of M P A i , n i .
Step 4. At each iteration, the criteria for the end of the search are checked, and the points lying in the vicinity of the current plane P A i , n are marked as belonging to the m-th vessel.
At this stage, DBSCAN is employed to distinguish points from those belonging to other arteries, and the centerline is assumed to be near the bifurcation point if the number of separated sets decreases. If the current cross-section does not meet the stop criteria, then Step 3 of the algorithm is repeated again.
Step 5. The last step is to check the vessel data layout. The computation is finalized if all six parts of the aorta are identified; otherwise, the routine is repeated for m + 1 to determine the vessel characteristics in Step 2. At this stage, the resulting separation of the points M into six classes M ( m ) with the corresponding centerlines L ( m ) is performed.
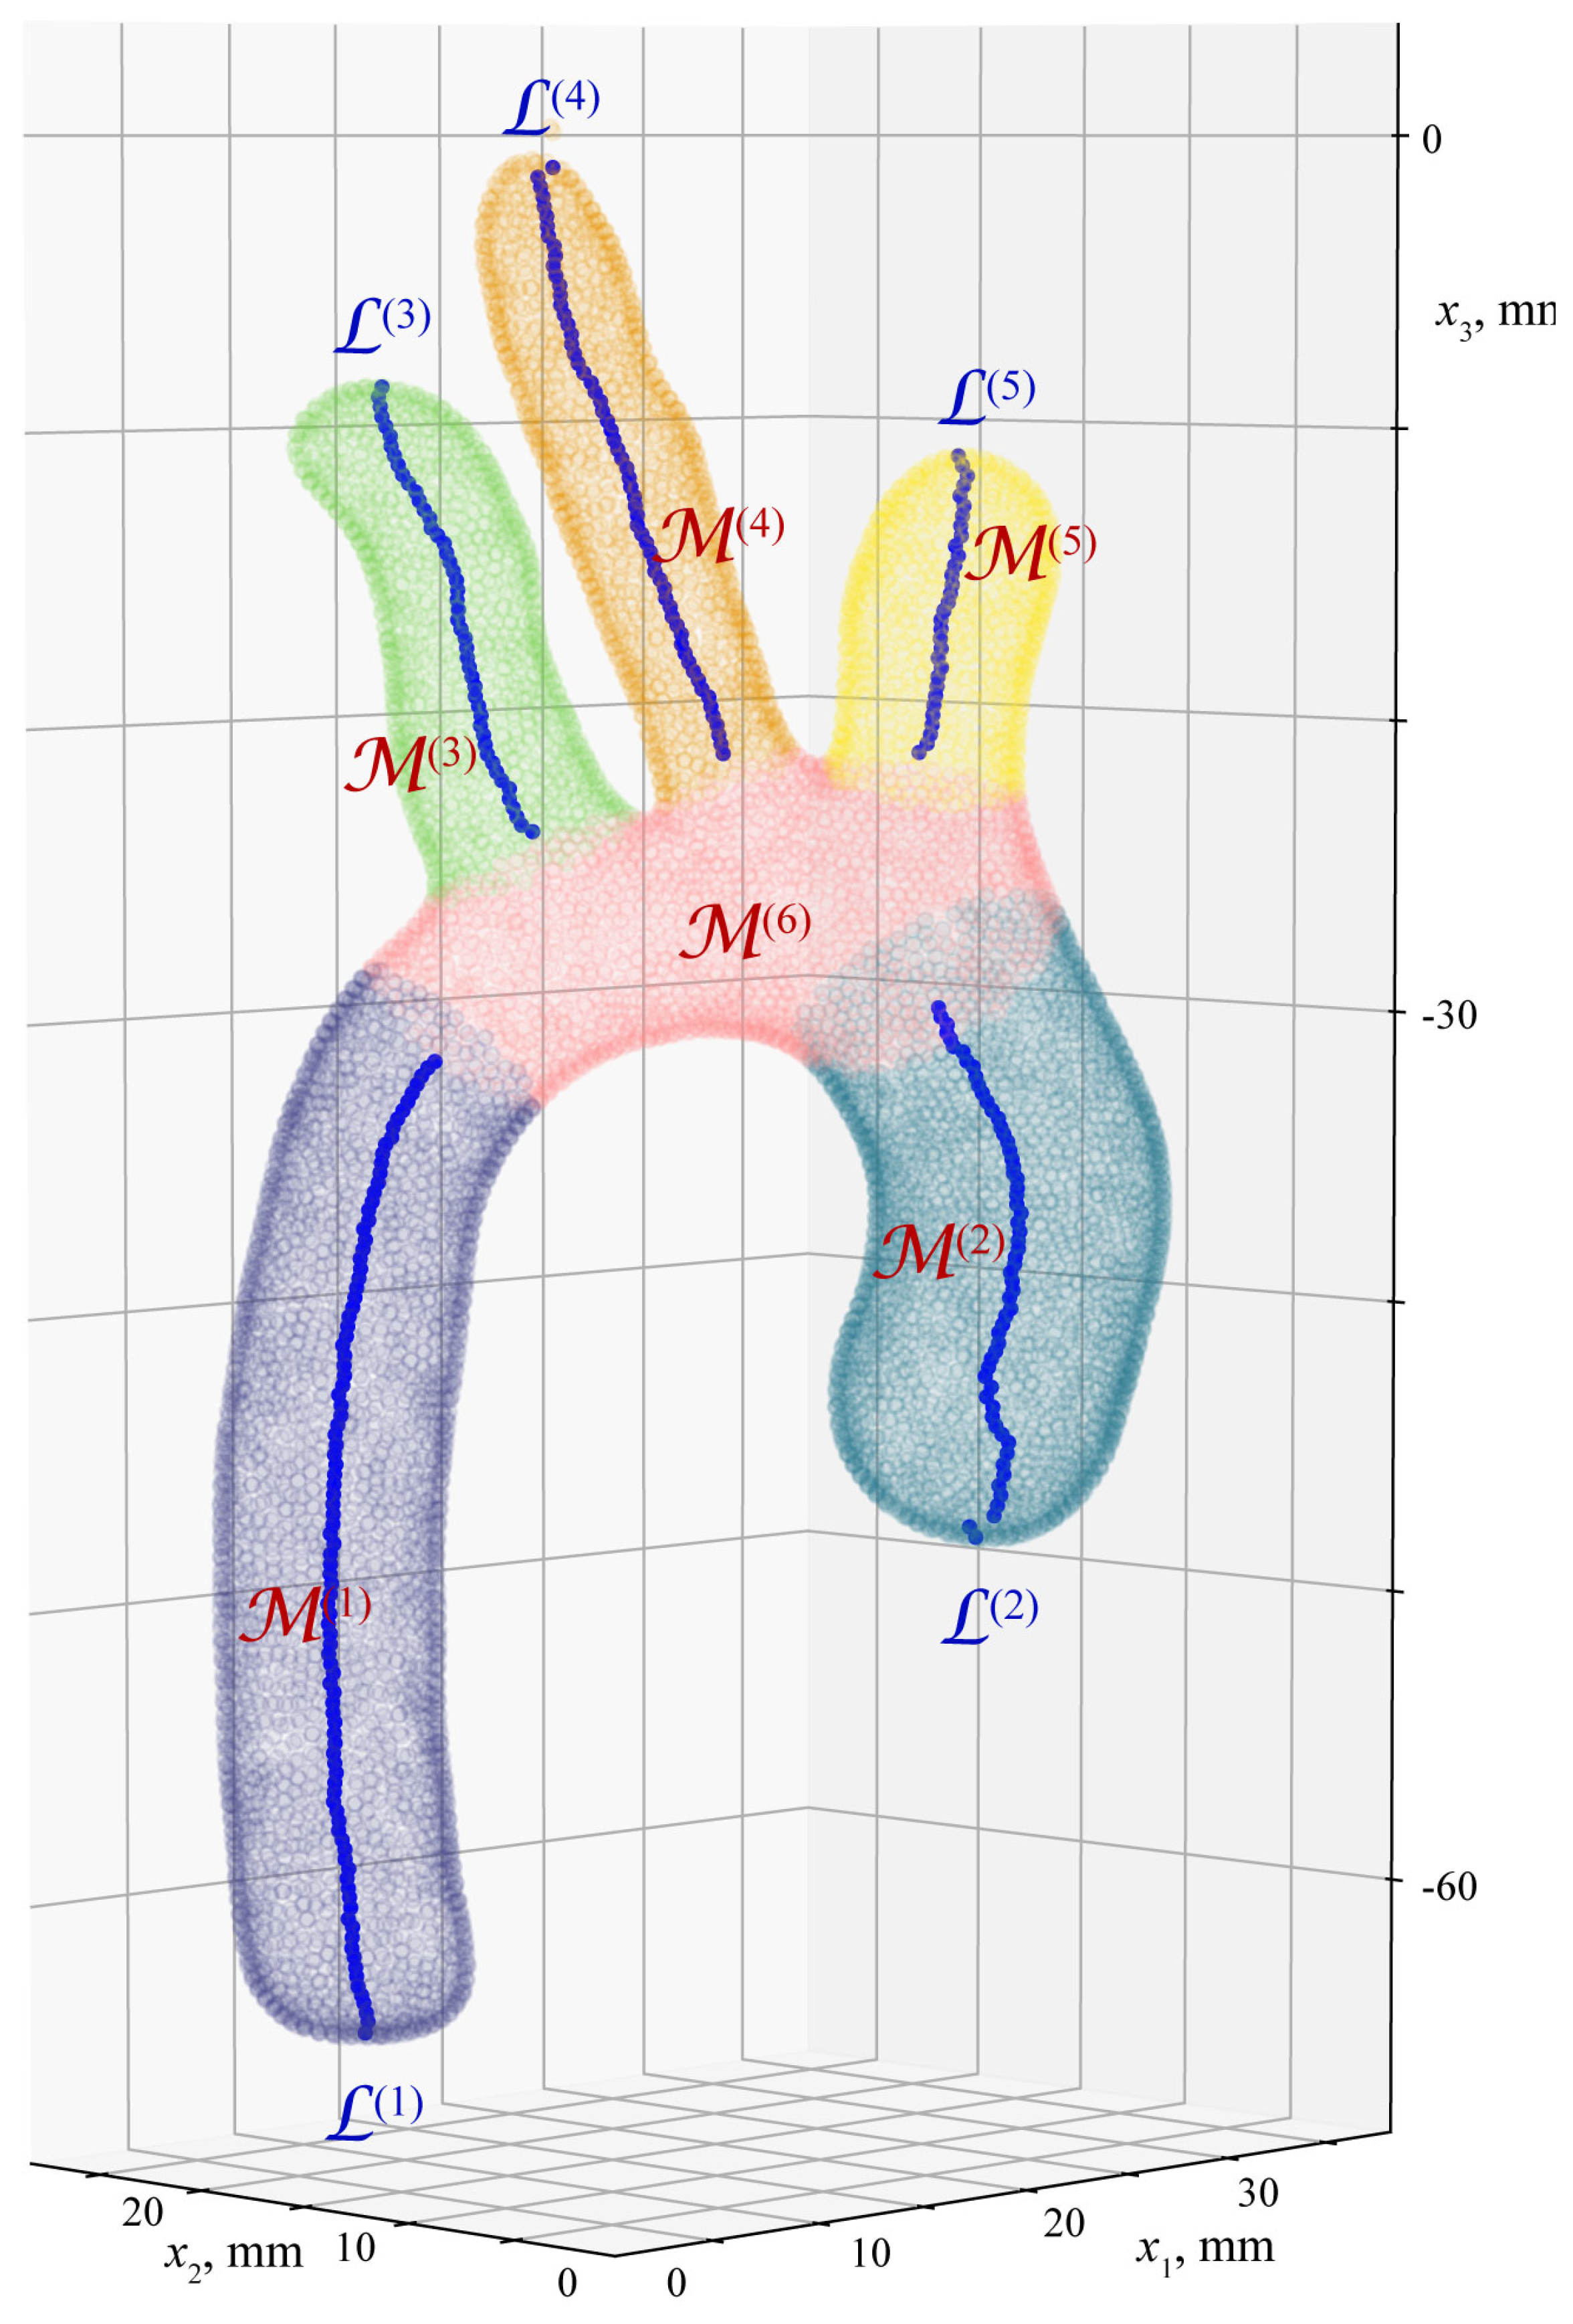
Two examples of the application of the developed numerical algorithm to particular aortas for patients with an interventricular septal defect and coarctation are shown in Figure 6 and Figure 7, respectively. Here, points belonging to the six split classes M ( m ) are marked with different colors, while dark blue dots demonstrate centerlines for five vessels (except the aortic arch, which is evaluated at the final stage using the proposed algorithm for M ( 1 ) M ( 2 ) M ( 6 ) ).
Within the application, using the developed numerical procedure, the coordinates of the discretized centerlines along with the cross-sections and their characteristics are determined. To study the stability of the proposed numerical method, the relative differences between the estimated geometric features, i.e., diameters and cross-sectional areas, were considered for various aortas. The numerical analysis showed the reasonable stability of the method: the reconstructed cross-sectional areas for a rather complicated geometry with various values of Δ h , which regulates the step during segmentation. Three examples of the application of the proposed numerical method to calculate the cross-sectional area s 1 ( t ) of the descending aorta of a patient with aorta coarctation (the same as depicted in Figure 7) using different values of Δ h exhibited in Figure 8 illustrate the stability of the method. Here, t is the length of the curve corresponding to the centerline L ( 1 ) . The results of the segmentation and cross-sectional area calculation were manually verified using rulers and plane cross-section instruments in Autodesk Inventor software. Of course, the precise results are not possible in this case, but good agreement was verified.

5. Discussion

The modified Blalock–Taussig shunt is a palliative treatment for some congenital heart diseases [35,36,37]. However, currently, surgeons use simplified and slanted criteria to select the diameter and location of the shunt, which leads to negative consequences for patients [38]. To address this problem, we aim to obtain objective data and develop a neural network taking into account patient-specific geometry that predicts the optimal location and diameter of the shunt. The geometry should include three elements (aorta, pulmonary artery, and shunt), which add complexity.
As the next step, we intend to develop a meta-model that predicts hemodynamic characteristics in patient-specific aortic geometries. We will use an iterative procedure to optimize the shunt placement that will improve the hemodynamic performance of the patient-specific aortic geometry. The meta-model will be based on clinical data and a modified mathematical model proposed in [39]. For this purpose, a set of N tessellated aortic surfaces will be formed. For each aorta, M + 1 CFD simulations will be performed for M MBTSs in various configurations (installation positions and shunt diameters). In the meta-model, a training data set will be formed using the extracted key geometric features G = { g 1 n , , g K n } and the extracted key hemodynamic characteristics { a 1 n m , , a L n m } (L features for each CFD simulation of MBTS). The meta-model will predict the optimal shunt configurations from M of the possible cases using only the list of key geometric features G * .
The original algorithm proposed here for processing and extracting information about the key geometrical characteristics of an aorta extracted from a set of multi-slice computed tomography images is essential for further stages. Thus, by using the key geometric features of the aorta as input, neural networks can derive the required distributions. This is expected to be many times faster than computational fluid dynamics methods. In the future, various algorithms will be tested, including convolutional neural networks. These networks can model complex, nonlinear relationships between input and output variables. Thus, with the accumulation of sufficient data for training, including anatomical models and hemodynamic data, in real time, neural networks for a particular patient will suggest potential surgical solutions based on expert decisions by leading specialists and the computational modeling of hemodynamics in the aorta. In the future, it is planned to analyze and classify more than 1500 different geometries and corresponding simulation results (distributions of hemodynamic parameters with and without shunts).

Author Contributions

Conceptualization, M.V.G., O.V.D. and A.G.K.; methodology, O.V.D., M.V.G. and A.G.K.; software, N.D.S., O.V.D. and I.O.R.; validation, O.V.D., A.G.K., I.O.R., N.D.S. and O.V.D.; formal analysis, O.V.D., N.D.S., A.G.K., N.D.S., R.M.S. and M.V.G.; investigation, O.V.D., I.O.R., M.V.G., N.D.S., A.G.K. and R.M.S.; resources, R.M.S., M.V.G. and A.G.K.; data curation, R.M.S., I.O.R., O.V.D. and N.D.S.; writing—original draft preparation, M.V.G., A.G.K., O.V.D. and I.O.R.; writing—review and editing, M.V.G., A.G.K. and O.V.D.; visualization, M.V.G. and N.D.S.; project administration, M.V.G. and A.G.K. All authors have read and agreed to the published version of the manuscript.

Funding

This research was carried out with the financial support of the Kuban Science Foundation in the framework of scientific project № MFI-20.1/12.

Institutional Review Board Statement

Not applicable.

Informed Consent Statement

Not applicable.

Data Availability Statement

Data sharing not applicable.

Conflicts of Interest

The authors declare no conflict of interest.

References

  1. Midgett, M.; Rugonyi, S. Congenital heart malformations induced by hemodynamic altering surgical interventions. Front. Physiol. 2014, 5, 287. [Google Scholar] [CrossRef] [PubMed] [Green Version]
  2. Verheugt, C.L.; Uiterwaal, C.S.; Grobbee, D.E.; Mulder, B.J. Long-term prognosis of congenital heart defects: A systematic review. Int. J. Cardiol. 2008, 131, 25–32. [Google Scholar] [CrossRef] [PubMed]
  3. Zhu, Y.; Chen, R.; Juan, Y.H.; Li, H.; Wang, J.; Yu, Z.; Liu, H. Clinical validation and assessment of aortic hemodynamics using computational fluid dynamics simulations from computed tomography angiography. Biomed. Eng. Online 2018, 17, 53. [Google Scholar] [CrossRef] [PubMed] [Green Version]
  4. Tsang, V.; Haapanen, H.; Neijenhuis, R. Aortic Coarctation/Arch Hypoplasia Repair: How Small Is Too Small. Semin. Thorac. Cardiovasc. Surg. Pediatr. Card. Surg. Annu. 2019, 22, 10–13. [Google Scholar] [CrossRef]
  5. Taebi, A. Deep Learning for Computational Hemodynamics: A Brief Review of Recent Advances. Fluids 2022, 7, 197. [Google Scholar] [CrossRef]
  6. Oster, M.E.; McCracken, C.; Kiener, A.; Aylward, B.; Cory, M.; Hunting, J.; Kochilas, L.K. Long-Term Survival of Patients With Coarctation Repaired During Infancy (from the Pediatric Cardiac Care Consortium). Am. J. Cardiol. 2019, 124, 795–802. [Google Scholar] [CrossRef]
  7. Alkashkari, W.; Albugami, S.; Hijazi, Z.M. Management of Coarctation of The Aorta in Adult Patients: State of The Art. Korean Circ. J. 2019, 49, 298. [Google Scholar] [CrossRef]
  8. Cao, H.; Li, Y.; Zhao, Y.; Xiong, T.; Liu, Z.; Zheng, T.; Chen, M. Hemodynamic Characteristics of Patients With Suspected Coronary Heart Disease at Their Initial Visit. Front. Physiol. 2021, 12, 714438. [Google Scholar] [CrossRef]
  9. Kuchumov, A.G.; Kamaltdinov, M.R.; Khairulin, A.R.; Kochergin, M.V.; Shmurak, M.I. Patient-Specific 0D–3D Modeling of Blood Flow in Newborns To Predict Risks of Complications After Surgery. Health Risk Anal. 2022, 2022, 159–167. [Google Scholar] [CrossRef]
  10. Kuchumov, A.G.; Khairulin, A.; Shmurak, M.; Porodikov, A.; Merzlyakov, A. The Effects of the Mechanical Properties of Vascular Grafts and an Anisotropic Hyperelastic Aortic Model on Local Hemodynamics during Modified Blalock–Taussig Shunt Operation, Assessed Using FSI Simulation. Materials 2022, 15, 2719. [Google Scholar] [CrossRef]
  11. Pil, N.; Kuchumov, A.G.; Kadyraliev, B.; Arutunyan, V. Influence of Aortic Valve Leaflet Material Model on Hemodynamic Features in Healthy and Pathological States. Mathematics 2023, 11, 428. [Google Scholar] [CrossRef]
  12. Totorean, A.F.; Totorean, I.C.; Bernad, S.I.; Ciocan, T.; Malita, D.C.; Gaita, D.; Bernad, E.S. Patient-Specific Image-Based Computational Fluid Dynamics Analysis of Abdominal Aorta and Branches. J. Pers. Med. 2022, 12, 1502. [Google Scholar] [CrossRef] [PubMed]
  13. Thamsen, B.; Yevtushenko, P.; Gundelwein, L.; Lamecker, H.; Kühne, T.; Goubergrits, L. Unsupervised Learning and Statistical Shape Modeling of the Morphometry and Hemodynamics of Coarctation of the Aorta; Springer International Publishing: Cham, Switzerland, 2020; Volume 12264 LNCS, pp. 776–785. [Google Scholar] [CrossRef]
  14. Yang, F.; Zhai, B.; Hou, L.G.; Zhang, Q.; Wang, J. Computational fluid dynamics in the numerical simulation analysis of end-to-side anastomosis for coarctation of the aorta. J. Thorac. Dis. 2018, 10, 6578–6584. [Google Scholar] [CrossRef] [PubMed]
  15. Manchester, E.L.; Pirola, S.; Salmasi, M.Y.; O’Regan, D.P.; Athanasiou, T.; Xu, X.Y. Analysis of Turbulence Effects in a Patient-Specific Aorta with Aortic Valve Stenosis. Cardiovasc. Eng. Technol. 2021, 12, 438–453. [Google Scholar] [CrossRef] [PubMed]
  16. Wang, Q.; Guo, X.; Stäb, D.; Jin, N.; Poon, E.K.; Lim, R.P.; Ooi, A. Computational fluid dynamic simulations informed by CT and 4D flow MRI for post-surgery aortic dissection—A case study. Int. J. Heat Fluid Flow 2022, 96, 108986. [Google Scholar] [CrossRef]
  17. Hassanein, W.; Albert, A.; Florath, I.; Hegazy, Y.Y.; Rosendahl, U.; Bauer, S.; Ennker, J. Concomitant aortic valve replacement and coronary bypass: The effect of valve type on the blood flow in bypass grafts. Eur. J. Cardio-Thorac. Surg. 2007, 31, 391–396. [Google Scholar] [CrossRef] [Green Version]
  18. Deyranlou, A.; Miller, C.A.; Revell, A.; Keshmiri, A. Effects of Ageing on Aortic Circulation During Atrial Fibrillation; a Numerical Study on Different Aortic Morphologies. Ann. Biomed. Eng. 2021, 49, 2196–2213. [Google Scholar] [CrossRef]
  19. Liang, L.; Mao, W.; Sun, W. A feasibility study of deep learning for predicting hemodynamics of human thoracic aorta. J. Biomech. 2020, 99, 109544. [Google Scholar] [CrossRef]
  20. Yevtushenko, P.; Goubergrits, L.; Gundelwein, L.; Setio, A.; Ramm, H.; Lamecker, H.; Heimann, T.; Meyer, A.; Kuehne, T.; Schafstedde, M. Deep Learning Based Centerline-Aggregated Aortic Hemodynamics: An Efficient Alternative to Numerical Modeling of Hemodynamics. IEEE J. Biomed. Health Inform. 2022, 26, 1815–1825. [Google Scholar] [CrossRef]
  21. Gu, Y.; Zhang, C.; Zhang, P.; Golub, M.V.; Yu, B. Enriched physics-informed neural networks for 2D in-plane crack analysis: Theory and MATLAB code. Int. J. Solids Struct. 2023, 276, 112321. [Google Scholar] [CrossRef]
  22. Bruse, J.L.; McLeod, K.; Biglino, G.; Ntsinjana, H.N.; Capelli, C.; Hsia, T.Y.; Sermesant, M.; Pennec, X.; Taylor, A.M.; Schievano, S.; et al. A statistical shape modelling framework to extract 3D shape biomarkers from medical imaging data: Assessing arch morphology of repaired coarctation of the aorta. BMC Med. Imaging 2016, 16, 40. [Google Scholar] [CrossRef] [PubMed] [Green Version]
  23. Liang, L.; Liu, M.; Martin, C.; Elefteriades, J.A.; Sun, W. A machine learning approach to investigate the relationship between shape features and numerically predicted risk of ascending aortic aneurysm. Biomech. Model. Mechanobiol. 2017, 16, 1519–1533. [Google Scholar] [CrossRef]
  24. Hahn, L.D.; Baeumler, K.; Hsiao, A. Artificial intelligence and machine learning in aortic disease. Curr. Opin. Cardiol. 2021, 36, 695–703. [Google Scholar] [CrossRef]
  25. Song, M.H.; Sato, M.; Ueda, Y. Three-dimensional simulation of the Blalock-Taussig shunt using computational fluid dynamics. Surg. Today 2001, 31, 688–694. [Google Scholar] [CrossRef] [PubMed]
  26. Lagana, K.; Balossino, R.; Migliavacca, F.; Pennati, G.; Bove, E.L.; de Leval, M.R.; Dubini, G. Multiscale modeling of the cardiovascular system: Application to the study of pulmonary and coronary perfusions in the univentricular circulation. J. Biomech. 2005, 38, 1129–1141. [Google Scholar] [CrossRef]
  27. Arnaz, A.; Piskin, S.; Oguz, G.N.; Yusuf, Y.; Pekkan, K.; Sarioglu, T. Effect of modified Blalock-Taussig shunt anastomosis angle and pulmonary artery diameter on pulmonary flow. Anatol. J. Cardiol. 2018, 20, 2–8. [Google Scholar] [CrossRef] [PubMed]
  28. Zhang, N.; Yuan, H.; Chen, X.; Liu, J.; Zhou, C.; Huang, M.; Jian, Q.; Zhuang, J. Hemodynamic of the patent ductus arteriosus in neonates with modified Blalock-Taussig shunts. Comput. Methods Programs Biomed. 2020, 186, 105223. [Google Scholar] [CrossRef]
  29. Liu, J.; Sun, Q.; Qian, Y.; Hong, H.; Liu, J. Numerical simulation and hemodynamic analysis of the modified Blalock-Taussig shunt. In Proceedings of the 2013 35th Annual International Conference of the IEEE Engineering in Medicine and Biology Society (EMBC), Osaka, Japan, 3–7 July 2013; pp. 707–710. [Google Scholar] [CrossRef]
  30. Zhao, X.; Liu, Y.; Ding, J.; Ren, X.; Bai, F.; Zhang, M.; Ma, L.; Wang, W.; Xie, J.; Qiao, A. Hemodynamic effects of the anastomoses in the modified blalock-taussig shunt: A numerical study using a 0D/3D coupling method. J. Mech. Med. Biol. 2015, 15, 1550017. [Google Scholar] [CrossRef]
  31. Geronzi, L.; Haigron, P.; Martinez, A.; Yan, K.; Rochette, M.; Bel-Brunon, A.; Porterie, J.; Lin, S.; Marin-Castrillon, D.M.; Lalande, A.; et al. Assessment of shape-based features ability to predict the ascending aortic aneurysm growth. Front. Physiol. 2023, 14, 378. [Google Scholar] [CrossRef]
  32. Saitta, S.; Sturla, F.; Caimi, A.; Riva, A.; Palumbo, M.C.; Nano, G.; Votta, E.; Corte, A.D.; Glauber, M.; Chiappino, D.; et al. A Deep Learning-Based and Fully Automated Pipeline for Thoracic Aorta Geometric Analysis and Planning for Endovascular Repair from Computed Tomography. J. Digit. Imaging 2022, 35, 226–239. [Google Scholar] [CrossRef]
  33. Ester, M.; Kriegel, H.P.; Sander, J.; Xu, X. A Density-Based Algorithm for Discovering Clustersin Large Spatial Databases with Noise. In Proceedings of the 2nd International Conference on Knowledge Discovery and Data Mining (KDD-96), Portland, OR, USA, 2–4 August 1996; pp. 226–231. [Google Scholar]
  34. Piccinelli, M.; Veneziani, A.; Steinman, D.A.; Remuzzi, A.; Antiga, L. A Framework for Geometric Analysis of Vascular Structures: Application to Cerebral Aneurysms. IEEE Trans. Med. Imaging 2009, 28, 1141–1155. [Google Scholar] [CrossRef]
  35. Dirks, V.; Prêtre, R.; Knirsch, W.; Valsangiacomo Buechel, E.R.; Seifert, B.; Schweiger, M.; Hübler, M.; Dave, H. Modified Blalock Taussig shunt: A not-so-simple palliative procedure. Eur. J. Cardio-Thorac. Surg. 2013, 44, 1096–1102. [Google Scholar] [CrossRef]
  36. Kuchumov, A.; Khairulin, A.; Biyanov, A.; Porodikov, A.; Arutyunyan, V.; Sinelnikov, Y. Effectiveness of Blalock-Taussig shunt performance in the congenital heart disease children. Russ. J. Biomech. 2020, 24, 65–83. [Google Scholar] [CrossRef]
  37. Shaikh, S.; Al-Mukhaini, K.S.; Al-Rawahi, A.H.; Al-Dafie, O. Outcomes of Infants Undergoing Modified Blalock-Taussig Shunt Procedures in Oman: A retrospective study. Sultan Qaboos Univ. Med. J. 2021, 21, 457–464. [Google Scholar] [CrossRef] [PubMed]
  38. Sahuquillo, J.; Rosas, K.; Calvo, H.; Alcina, A.; Gándara, D.; López-Bermeo, D.; Poca, M.A. How to Choose a Shunt for Patients with Normal Pressure Hydrocephalus: A Short Guide to Selecting the Best Shunt Assembly. J. Clin. Med. 2021, 10, 1210. [Google Scholar] [CrossRef] [PubMed]
  39. Kamaltdinov, M.; Kuchumov, A. Application of a mathematical model of systemic circulation for determination of blood flow parameters after modified Blalock-Taussig shunt operation in newborns. Russ. J. Biomech. 2021, 25, 268–284. [Google Scholar] [CrossRef]
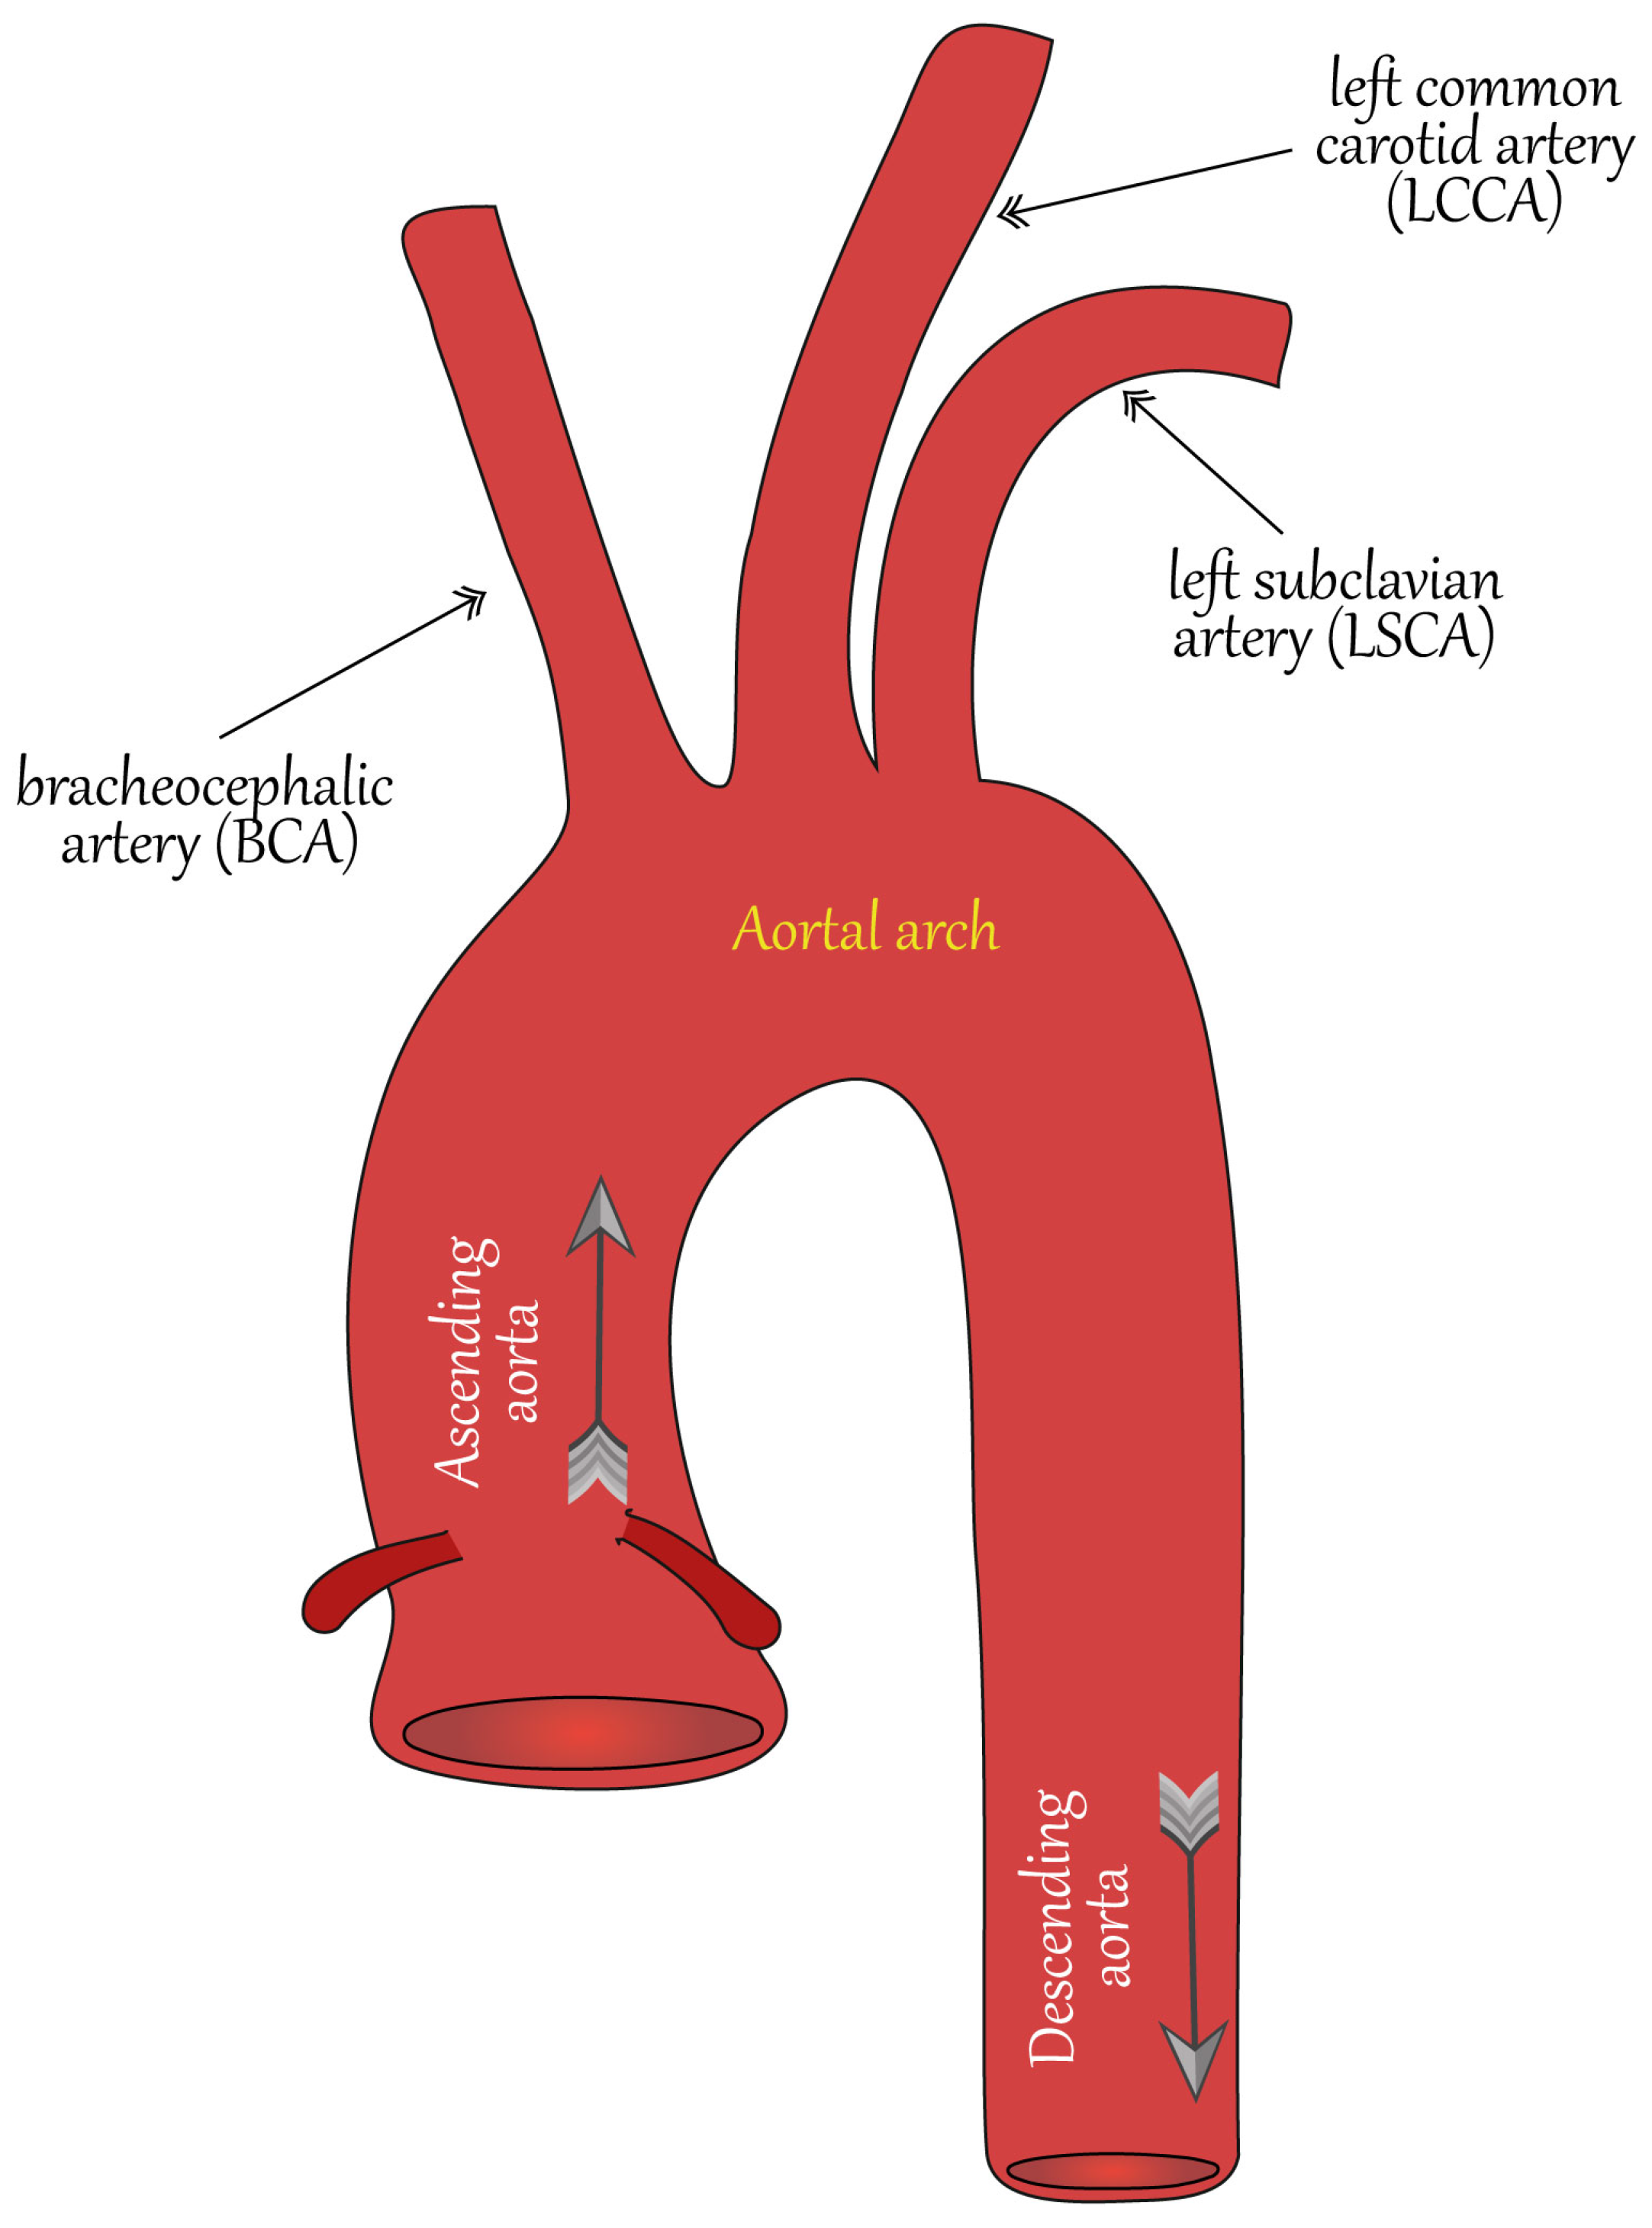
Figure 1. Aorta (schematic).
Mathematics 11 02871 g001
Figure 2. Scheme of the vessel surface reconstruction from an array of multi-slice computed tomography images and preparation for meta-model development.
Mathematics 11 02871 g002
Figure 3. Maingeometrical characteristics of aorta.
Mathematics 11 02871 g003
Figure 4. The flowchart of the proposed algorithm for the determination of the geometric properties of aorta and arteries.
Mathematics 11 02871 g004
Figure 5. An example of the application of DBSCAN [33] to the intersection of P ( A i , n i 1 ) with M .
Mathematics 11 02871 g005
Figure 6. An example of centerlines L ( m ) and splitting into different parts M ( m ) of a particular aorta with an interventricular septal defect.
Mathematics 11 02871 g006
Figure 7. An example of centerlines L ( m ) and splitting into different parts M ( m ) of a particular aorta with coarctation.
Mathematics 11 02871 g007
Figure 8. The cross-sectional area s 1 ( t ) of the descending aorta of a patient with coarctation for various step Δ h .
Mathematics 11 02871 g008
Disclaimer/Publisher’s Note: The statements, opinions and data contained in all publications are solely those of the individual author(s) and contributor(s) and not of MDPI and/or the editor(s). MDPI and/or the editor(s) disclaim responsibility for any injury to people or property resulting from any ideas, methods, instructions or products referred to in the content.