Abstract
The long queuing time for electric vehicles to charge under intelligent network connection leads to low distribution efficiency. Therefore, this paper proposes a strategy to predict the probability of queues forming for electric vehicles arriving at charging stations under intelligent network connection. Both the dynamic demand of customers and the characteristics of the alternating influence of charging vehicles should be considered when studying such problems. Based on the above problem characteristics, a real-time dynamic charging selection strategy is developed by predicting the probability of other vehicles in the region going to the charging station. A distribution path optimization model based on intelligent network connection and queuing theory is proposed for electric logistics vehicles in charging mode, taking into account the time window constraint and the influence of charging vehicles when using intelligent network connection for path planning. The objective is to minimize the total cost, and the route for electric logistics vehicles is adjusted in real time. This is solved by an improved hybrid genetic-annealing algorithm. The experimental results show that this paper obtains real-time dynamic road information and charging information with the help of intelligent network connection. It predicts the queuing probability of electric vehicles by combining with queuing theory, which can help select a more suitable charging location and timing for electric logistics vehicles. This can effectively avoid peak periods and reduce waiting times. By comparing with other models, this paper’s model can save the distribution cost of electric vehicles.
Keywords:
path planning; electric vehicles; intelligent network connection; queuing theory; charging prediction MSC:
60-02
1. Introduction
Electric vehicles have become the main force of end-delivery transportation because of their energy savings, low carbon emissions, and low noise levels [1,2]. The wireless communication network system equipped on electric vehicles can obtain real-time traffic information, accurately sense the road environment, and facilitate information interaction between vehicles, roads, and networks [3,4]. Due to their limited range, electric vehicles often require recharging, which necessitates finding a suitable location and time for recharging during delivery. The dynamic charging demand of other vehicles often affects the queuing and waiting time of electric logistics vehicles. As a result, electric vehicles waste a lot of time waiting to charge. This not only affects distribution efficiency but also increases the total cost. Therefore, the introduction of intelligent network connection technology in electric vehicle distribution is conducive to giving full play to the advantages of both and improving the efficiency of distribution. Therefore, it is practical to study the charging queuing problem of intelligent, net-connected electric vehicles.
In order to solve the time cost of electric vehicles in the distribution process due to queuing for charging, the scholars proposed to combine intelligent Internet connection with vehicles, using intelligent devices to collect real-time road condition information and adjust the distribution path of logistics vehicles in real time at different stages. Mohamed (2018) proposed a new method for generating waiting strategies for customers with possible expected demand on the dynamic vehicle path problem, which increases the number of target customers [5]. Sun Lijun et al. (2022) studied traditional single-vehicle charging demand and designed a real-time demand response strategy based on the dynamic alternation of LCs and ECs from the operator’s perspective to obtain maximum revenue [6]. Wang Zhe et al. (2022) focused on current social affairs and proposed a prediction strategy under intelligent network connection for the situation of manually driven vehicles in complex traffic scenarios due to the reality of frequent dangerous driving behavior. They achieved both user and cloud information sharing, ensured real-time dynamics according to road information collected and uploaded by users, and developed decision plans for users under different optimization goals. They took into account the problem of big data easily leading to information leakage and the protection of user information security [7]. Gokasar et al. (2023) proposed a novel rough numbers-based extended Measuring Attractiveness by a Categorical Based Evaluation Technique method for prioritizing real-time traffic management systems [8]. Younes et al. (2023) used intelligent transportation systems to solve traffic congestion problems and proposed an effective real-time path planning strategy based on cooperative information sharing between vehicles and RSUs, which improves the travel time of vehicles on the road and reduces communication costs [9]. Most of the appeal studies are aimed at path studies considering only current traffic information, and the obtained traffic road condition information is generally updated at regular intervals without combining intelligent network technology with real-time road conditions, which has great limitations.
Electric vehicles, as the preferred means of transportation in the distribution process, are facing the problem of low charging and swapping efficiency, especially during holidays or extreme weather when long queues may occur. This results in low distribution efficiency and reduced customer satisfaction. Therefore, the selection of charging and swapping locations, as well as the timing of charging and swapping in the distribution process of electric logistics vehicles, has become an issue of great concern in the industry. Dudin et al. (2020) proposed a competitive queuing system with a hierarchical evaluation mechanism [10]. Yang et al. (2020) constructed a charging station siting model for electric vehicles based on the interceptor siting model, taking into account the warning mileage of pure electric vehicles and the bi-directional nature of vehicle travel on urban roads, and constructed a charging post sizing model based on the queuing theory for the shortest waiting time for charging [11]. Xiao et al. (2020) used the M/M/S/N queuing model to limit the finite queue length and finite charging service volume at each charging station and proposed an optimization model for the location and capacity of the charging infrastructure [12]. Hong Wei et al. (2021) proposed a multi-objective transport optimization model based on queuing theory to minimize cost, time, and carbon emissions, taking into account the choice of third-party logistics providers, routes, and transport modes [13]. Keskin et al. (2021) considered the queuing problem when charging EVs and built a two-stage mathematical model with an M/G/1 queuing system to simulate the charging waiting time and plan the optimal distribution path [14]. In EV research, the EVRP problem of queuing theory is mostly considered in the traditional station queuing stage, and the optimization of the location and capacity of the charging pile is mostly considered. It is worth exploring whether it is possible to shift to the perspective of queuing vehicles to find the shortest queuing time for vehicles. There is a lack of research into the problems of long charging times and insufficient range caused by other EV charging demands in the region.
In summary, most of the research on intelligent network technology mostly considers path studies under current traffic information, and the acquired traffic road information is generally updated regularly; at the same time, the existing literature focuses on the choice of charging location and timing when charging demand for EVs arises, without considering the dynamic impact of charging other vehicles in the area, resulting in long queues or increased mileage when EVs arrive at charging stations, with the ultimate result of increased total distribution costs. This paper not only combines intelligent network technology with electric vehicles but also uses intelligent network data to predict future traffic conditions, considers the impact of dynamic alternate vehicle charging, builds an EVRP model based on intelligent network connection and queuing theory, uses data or information provided by intelligent network technology to obtain real-time vehicle data to analyze the traffic network, and predicts the traffic flow near charging stations. When an electric vehicle is in need of charging, the information obtained from the charging station by the intelligent network will be used to predict the probability of queuing up at the charging station based on the traffic flow and the power situation, thus selecting the best charging location and timing for the electric logistics vehicle.
2. Model Description and Construction
2.1. Problem Description
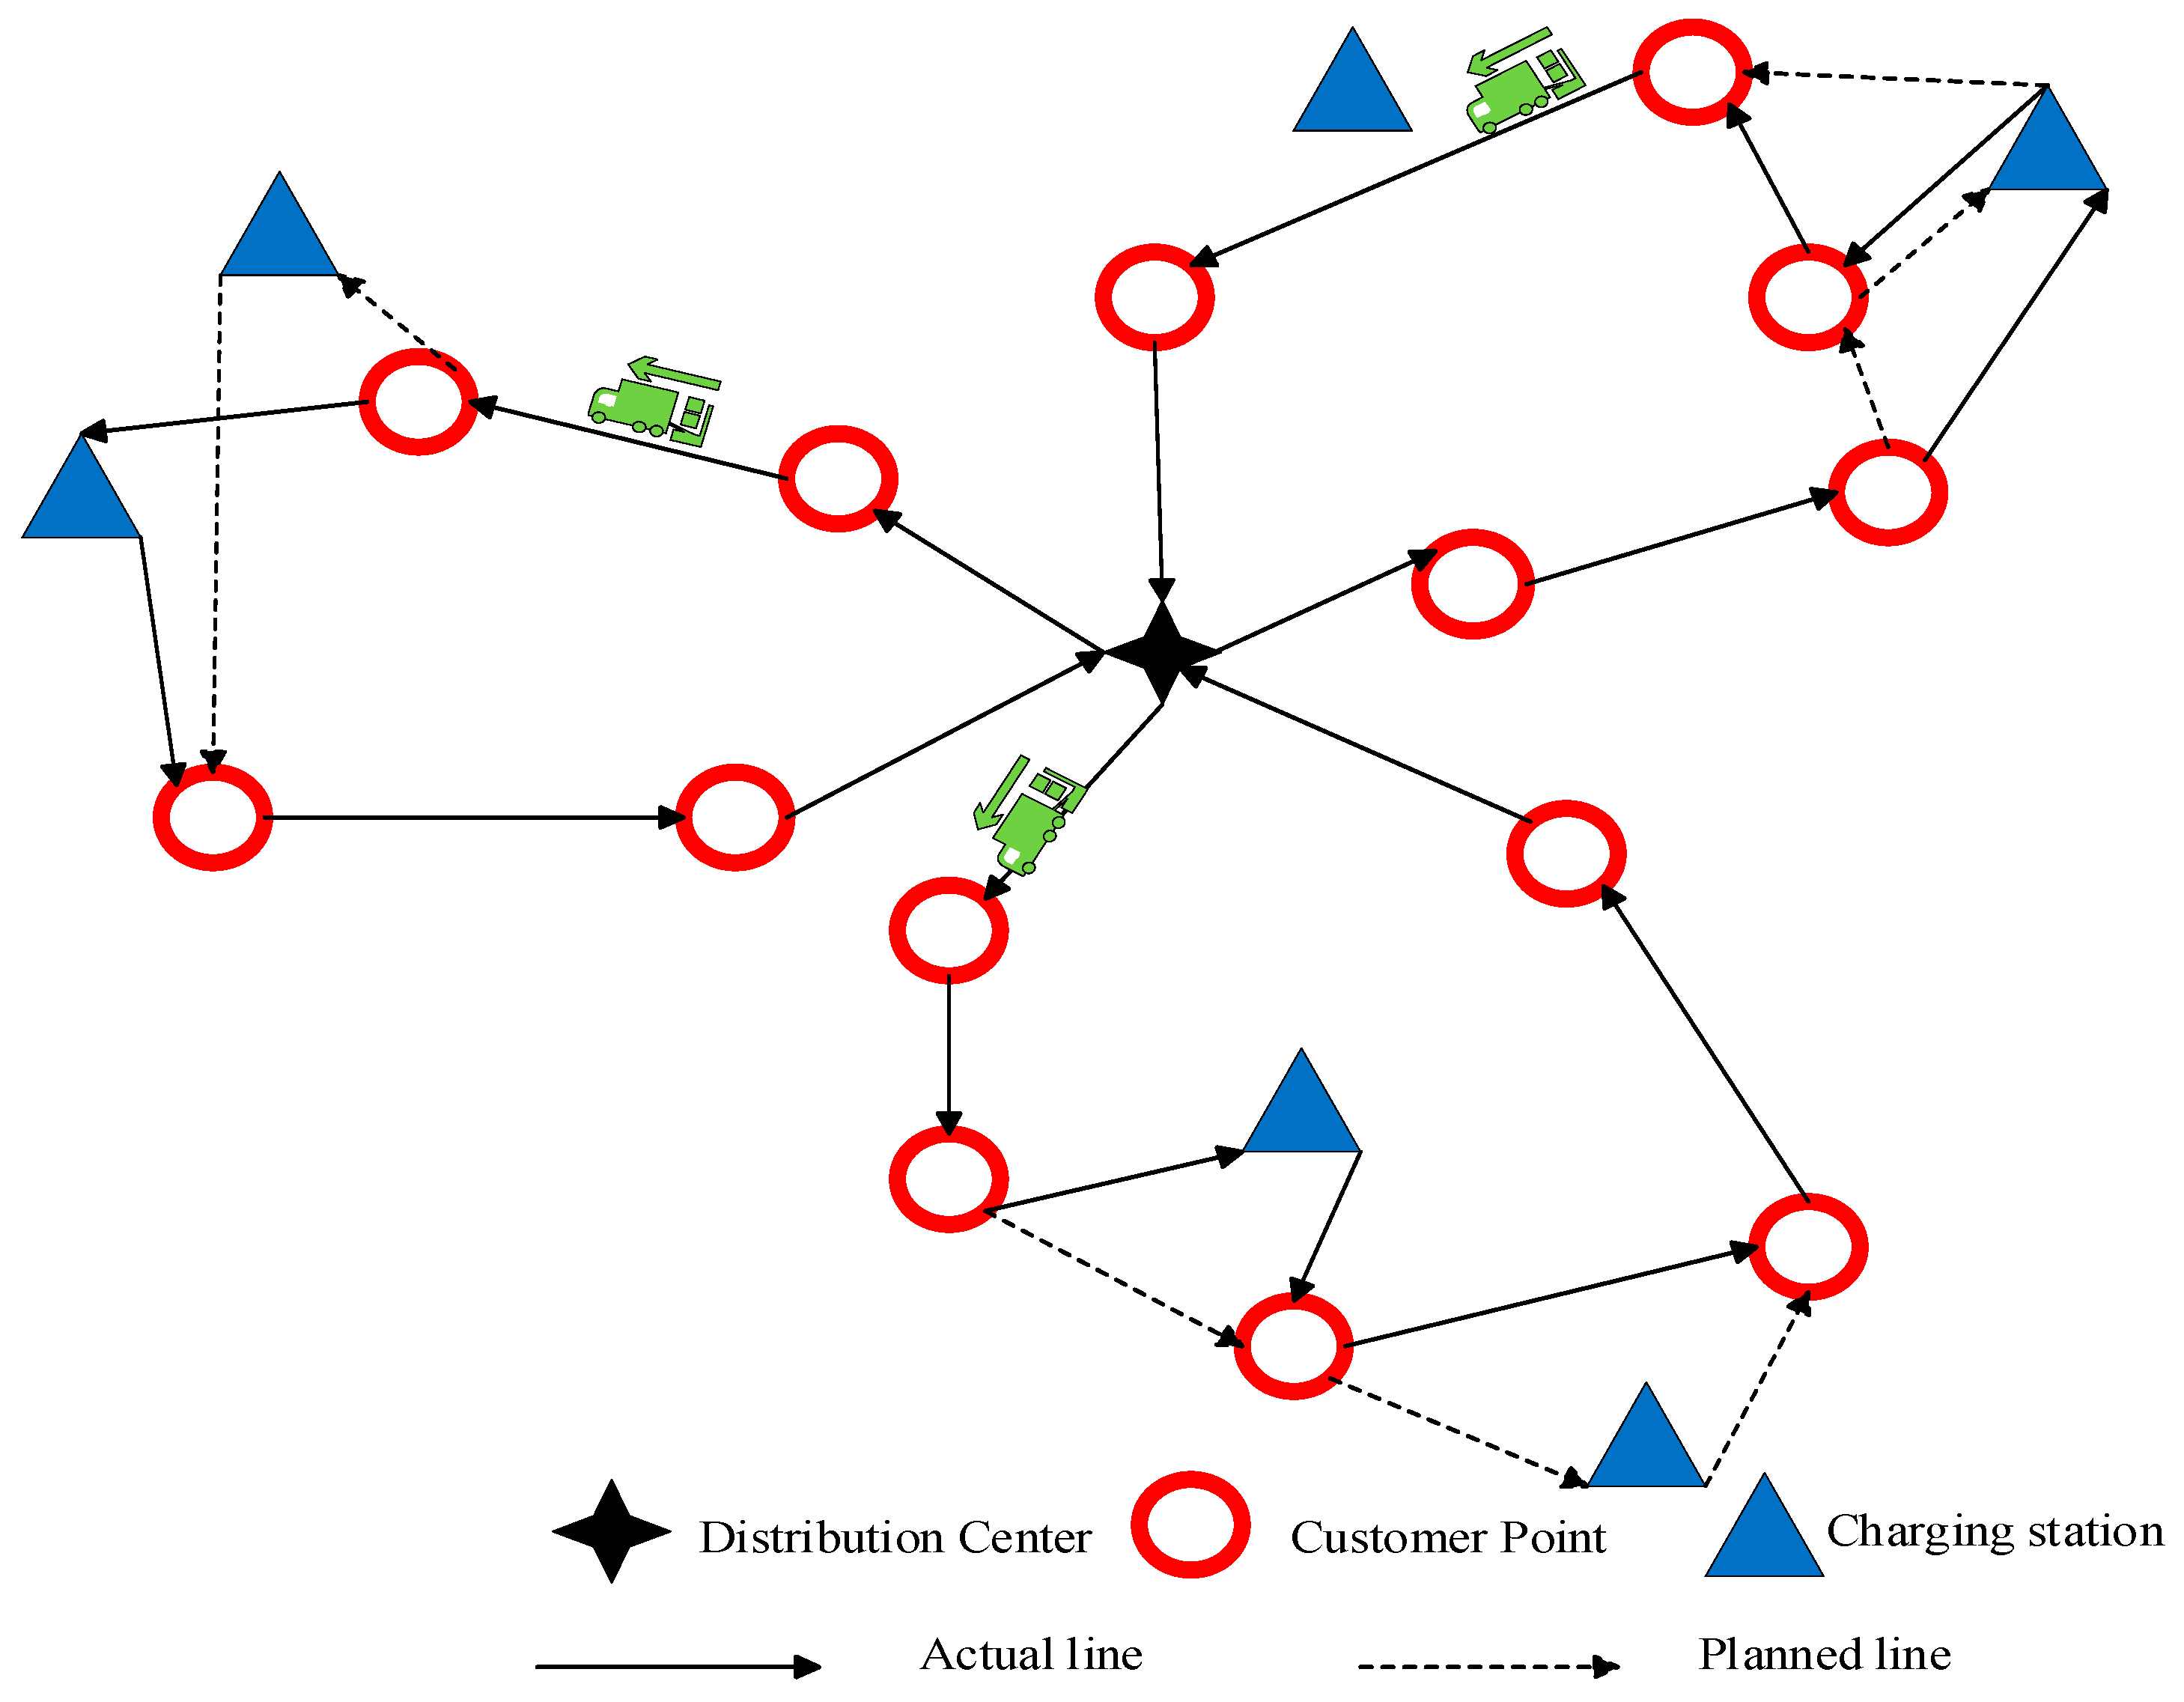
In this section, an EV distribution path optimization model in charging mode is developed, and the model can be described as follows: there exists only one distribution center in the region with EVs, whose load capacity limit is and battery capacity limit is . Its task is to deliver to customer points in the region, and the demand at customer is . In this paper, a soft time window is used, and if the vehicle performing the delivery arrives outside the moment requested by the customer, then it needs to receive the corresponding penalty [15]. Considering the electric vehicle range and the limitation of the distribution task during the distribution route, and compared with the traditional EVRP model, the model in this paper should be more fully combined with the characteristics of intelligent network connection. The charging probability of other vehicles in the region is predicted by collecting the real-time road condition information and the remaining power of the vehicle, the best charging location and timing are selected under the premise of minimum total cost, and the distribution route is dynamically adjusted in real time (see Figure 1).

Figure 1.
Vehicle route map.
2.2. Problem Assumptions
- (1)
- Vehicles starting and ending at distribution centers.
- (2)
- Vehicles are for delivery tasks only, not for pick-ups.
- (3)
- Dynamic changes in the remaining power of all vehicles in the area are fed back to the cloud via the onboard wireless mobile communication system.
- (4)
- The geographical location of all assembly points is known.
- (5)
- The same type for all electric vehicles.
- (6)
- A known amount of demand per customer point.
- (7)
- A sub-path can only be served by one vehicle, and each customer point can only be served once.
- (8)
- The weight of the cargo carried by the electric vehicle shall not exceed its maximum capacity.
- (9)
- Vehicles are subject to a soft time window in the delivery process and may incur penalties if they do not arrive within the specified time period.
2.3. Model Construction
In this paper, based on the characteristics of rechargeable electric vehicles, we use intelligent network technology to obtain the real-time electric vehicle flow in the region; combine with queuing theory to predict the queuing probability of vehicles arriving at charging stations; solve the problems of charging station location selection, charging timing selection, and corresponding path planning; reasonably allocate charging time; and construct an electric vehicle distribution path optimization model. The model parameters and variables are described as follows:
- : Collection of customer points ;
- : Collection of charging stations ;
- : A collection of distribution centers and charging stations;
- : A collection of distribution centers, customer points and charging stations;
- : A collection of customer points and charging stations;
- : The number of electric vehicles;
- : The maximum load capacity of each electric vehicle;
- : Demand for customer point ;
- : The distance from point to ;
- : The cost of fixed vehicle trips;
- : The average speed at which the vehicle travels;
- : The average hourly rate of power consumption while the vehicle is in motion;
- : The average hourly rate of power consumption while vehicles wait in line to be charged;
- : The average hourly rate of power consumption for vehicles waiting and servicing at customer locations;
- : Charging rate of charging stations;
- /: Penalty weights for vehicles arriving earlier or later than the time window;
- : The maximum capacity of the vehicle;
- : Vehicle remaining power;
- : The power level of the vehicle when it reaches point ;
- : The power level of the vehicle when it leaves point ;
- : The unit time cost of the vehicle distribution process;
- : Unit tariffs;
- : The moment of arrival of the vehicle at ;
- : The moment when the vehicle leaves ;
- : The waiting time of the vehicle at ;
- : The service time of the vehicle at ;
- : Collection of the number of facilities providing charging services ;
- : The number of electric vehicles receiving charging services;
- : The moment when electric vehicles begin to receive charging.
2.4. Queuing Model
The factors affecting the electric power demand of EVs mainly include three aspects: power battery, charging facilities, and user behavior [16]. The real-time road traffic in the region is obtained through the wireless mobile communication system equipped with EVs. Then, the probability of other arbitrary vehicles going to the charging station for charging is analyzed based on the traffic flow in the region and the remaining power of the vehicle. The measurement curves of different discharge depths and the cycle life of Tesla’s battery system show that charging when the remaining charge does not exceed 50% maximizes the battery life cycle. Even after 3000 cycles, there is no significant change in the battery, while the capacity decays to about 50% after 900 cycles in depth. Additionally, according to the internal structure of the lithium battery, it is recommended to charge it at 30–50%. This not only reduces the charging time but also maximizes the protection of the battery [17]. In this paper, the probability of other vehicles in the area going to the nearest charging station is set according to the power level:
The queuing theory obtains statistical indicators such as waiting time, queue length, and service intensity by studying customer demand in a system. Based on these statistical laws, it optimizes the system parameters to serve customers and obtain the optimal value of the system parameters [18] (see Figure 2). The prediction probability is introduced in the queuing model to consider the influence of other charging vehicles in the region on the queuing of electric logistics vehicles for charging.
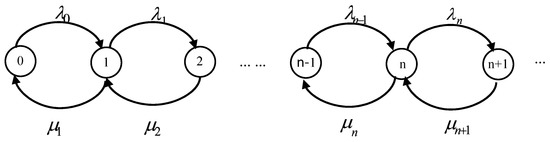
Figure 2.
Equilibrium state.
- (1)
- Number of customers arriving at charging stations per unit of time:
- (2)
- State probability distribution :
- (3)
- Customer queue captain :
- (4)
- System Captain :
- (5)
- Average customer waiting time :
- (6)
- Average customer dwell time :
When , it means that n vehicles in the system are receiving service and the remaining rechargeable facilities are idle; when , it means that all rechargeable facilities in the system are performing charging service and the remaining vehicles are queuing for charging [19].
2.5. Queuing Mode
Objective function:
Total time cost of the vehicle in the distribution process :
Fixed costs of vehicle travel :
Time window penalty cost :
Vehicle queuing charging costs :
Binding Conditions:
The number of vehicles entering the customer point is the same as the number of vehicles leaving the customer point:
Each customer is served by one vehicle only once:
The whole distribution process of vehicles leaving the distribution center and returning to the distribution center is a loop:
The total distribution volume of vehicles in each loop does not exceed its load limit:
The power level of vehicles leaving the node:
The time of vehicles leaving the node:
The time of vehicles arriving at the next node:
3. Algorithm Design
The electric vehicle routing problem (EVRP) is a complex NP-hard problem [20]. The traditional Genetic Algorithm (GA) can escape local optima and find the global optimal solution. However, when the solution space is small, it can pose significant challenges for finding the optimal solution. In order to improve the searchability of the algorithm and make up for the shortcomings of the traditional genetic algorithm, this paper improves it by using the natural number encoding method and generating the initial population using the scanning method. At the same time, considering the efficiency of the Simulated Annealing (SA) algorithm in searching for local optimal solutions, the improved genetic algorithm is combined with the Simulated Annealing algorithm. This combination can solve the problem of low efficiency of the global search operation of the Simulated Annealing algorithm by using the improved genetic algorithm in the early stage. Additionally, it can improve the search efficiency by the Simulated Annealing algorithm in the later stage, making the global optimal solution more accurate [21].
3.1. Forecasting Process
3.1.1. Coding Design
To make the expression concise and convenient, this paper uses integers as the chromosome encoding form. Each chromosome represents a path, and the set of paths consists of distribution centers, customer points, and charging stations. In the distribution network, the distribution center is labeled as 0, the customer points are coded from 1 to n, and the charging stations are coded from n + 1 to n + m. For example, if two vehicles deliver to eight customer points in a region with only two charging stations, the corresponding complete distribution route is 0-2-4-7-9-3-1-0. This means that the vehicles start from the distribution center, pass through customer points 2, 4, and 7 in order, and then go through charging station 9 in order. After that, it continues to deliver to customer points 3 and 1, and then returns to the distribution center.
3.1.2. Initial Population
The improved genetic algorithm is very demanding and strongly dependent on the initial population, which also means that the distribution of initial population positions in the solution space affects the accuracy of the algorithm’s solution. Therefore, the Metropolis criterion of the simulated annealing algorithm is used as the search direction strategy for the improved genetic algorithm, and the temperature is set to , if , then is accepted as the current state; if the probability P is greater than a random number in the interval [0,1), state is still accepted as the current state; if it does not hold, state is retained as the current state. A chromosome, i.e., a complete distribution path, is formed by the scanning method.
3.1.3. Degree of Adaptation Function
The selection of the fitness function has a very important impact on the convergence speed of the hybrid algorithm and the final solution’s effectiveness. According to the characteristics of the electric vehicle path planning problem and in combination with the principle of non-negativity of the fitness function, this paper uses the inverse of the total cost ) as the fitness function, i.e.,
3.1.4. Genetic Manipulation
- (1)
- Selection operator design
After constructing the fitness function, the good genes need to be selected for operation. For the hybrid algorithm, this paper adopts the elite retention strategy to construct the operators. This involves retaining the elite individuals that appear during the evolution of the population and replacing the worst operators in the new generation population with the current elite individuals under a fixed population size.
- (2)
- Crossover operator design
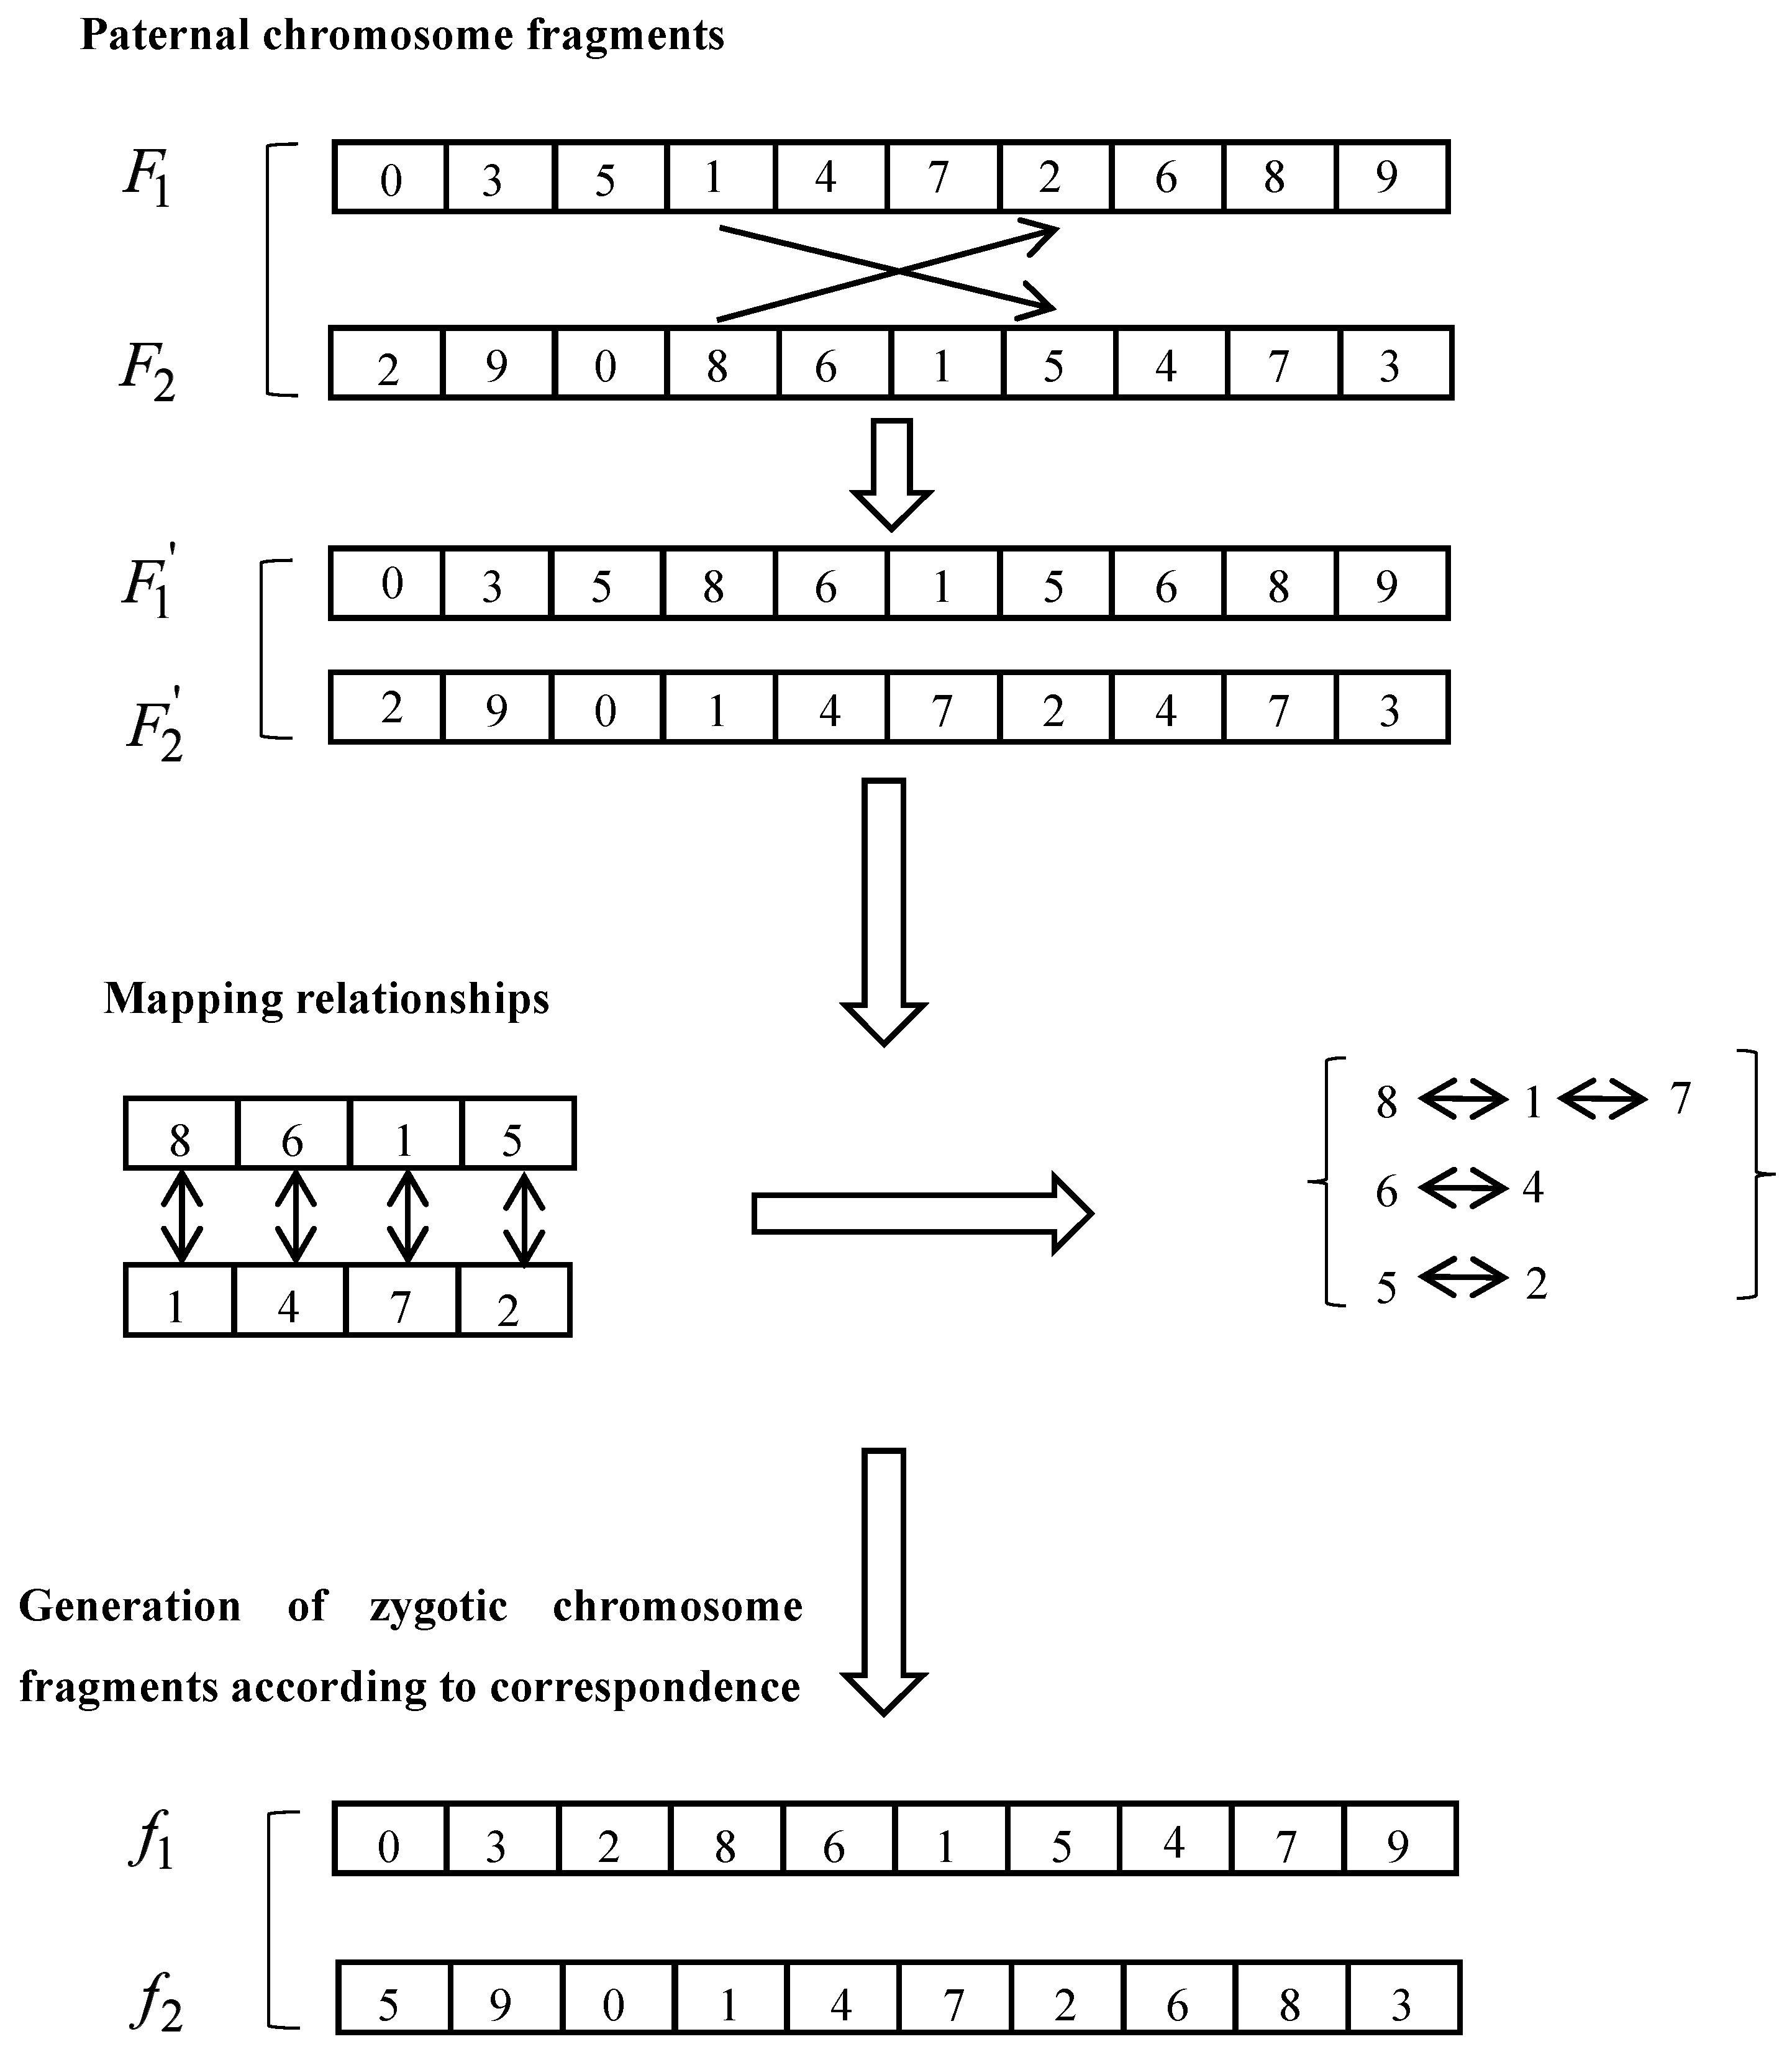
Considering that there are customer points and charging stations included in the process of chromosome coding, in order to avoid destroying the better combination during the crossover operation, the charging station point gene coding in the parent is eliminated as a priority [22]. Then, the crossover operator is designed using the partial matching crossover strategy (see Figure 3), and the process is as follows:

Figure 3.
Cross-operation.
- Step 1: Randomly selecting a pair of parental chromosomes , and picking the starting and ending positions of gene fragments;
- Step 2: Exchange the positions of corresponding gene values in gene fragments and to form a mapping relationship;
- Step 3: To ensure that the newly generated set of offspring chromosomes are conflict-free, do conflict detection according to the mapping relationship established in step 2.
- (3)
- Mutation operator design
The mutation operation can enrich the population genetic diversity and improve the local search ability of the algorithm. On the same chromosome, is used as the inserted gene and is used as the inserted gene, and then is extracted and placed in front of the inserted gene to get a new mutated chromosome.
3.1.5. Termination Conditions
In this paper, the termination condition is set according to the double-layer cycle characteristic of the hybrid algorithm, and the control temperature is varied in the outer cycle, calculated by the formula:
The temperature decay coefficient is randomly taken in the interval [0.7, 1], and the iteration is completed when the initial temperature drops to the thermal equilibrium condition, i.e., the termination temperature , and the final result is output; in the inner loop, the temperature is fixed and the operation is terminated when the number of iterations reaches a specified number. In addition, the length of the Markov chain set in this paper is 1000. The flow chart is shown in Figure 4.
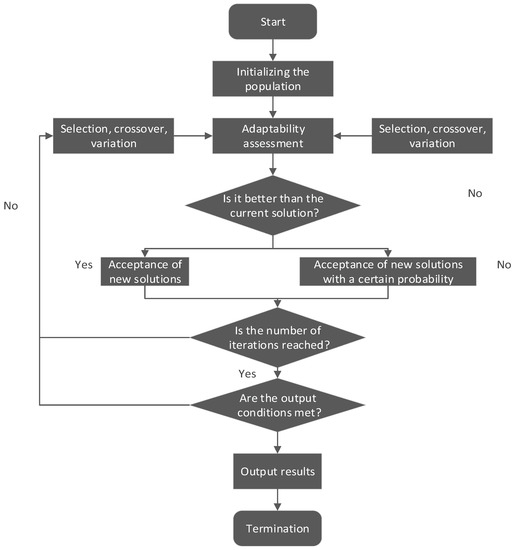
Figure 4.
Flowchart.
3.2. Algorithmic Advantages
A hybrid optimization algorithm consisting of the genetic algorithm combined with the annealing algorithm can improve the search for the global optimal solution to some extent. This is because the features and mechanisms of the two algorithms complement each other and enable the search space to be explored in different ways.
Hybrid optimization algorithms combine genetic algorithms and annealing algorithms, using the strengths of both algorithms to enhance global search. Genetic algorithms are able to search the search space quickly and avoid local optima through the diversity of populations, while annealing algorithms are able to perform a wider exploration in the search space through the mechanism of random perturbation and acceptance of inferior solutions. By combining the two algorithms, the hybrid optimization algorithm is able to take into account both global search and local optimization in the search process, making it more likely to find the global optimal solution.
Overall, a hybrid optimization algorithm consisting of the genetic algorithm combined with the annealing algorithm is able to exploit the advantages of both algorithms to increase the probability of finding a globally optimal solution through the mechanisms of global search and local optimization. At the same time, setting reasonable termination conditions ensures that the algorithm completes the search in a reasonable amount of time.
4. Example Analysis
4.1. Description of the Algorithm
In order to better verify the validity of the model in this paper, references [23,24] are made to the Solomon dataset. RC201 is chosen as the simulation example for this paper based on the distribution of customer point locations. One distribution center, 50 customer points, and 5 charging stations are randomly generated in the distribution area. The distribution area is set to 8 km × 8 km according to the general distribution rule of the city. Three electric vehicles with the same model and maximum load capacity of 5 t are used, and the rated battery capacity of the vehicles is 80 kW. The relevant test parameters to be set are as follows Table 1:

Table 1.
Parameter values for models and algorithms.
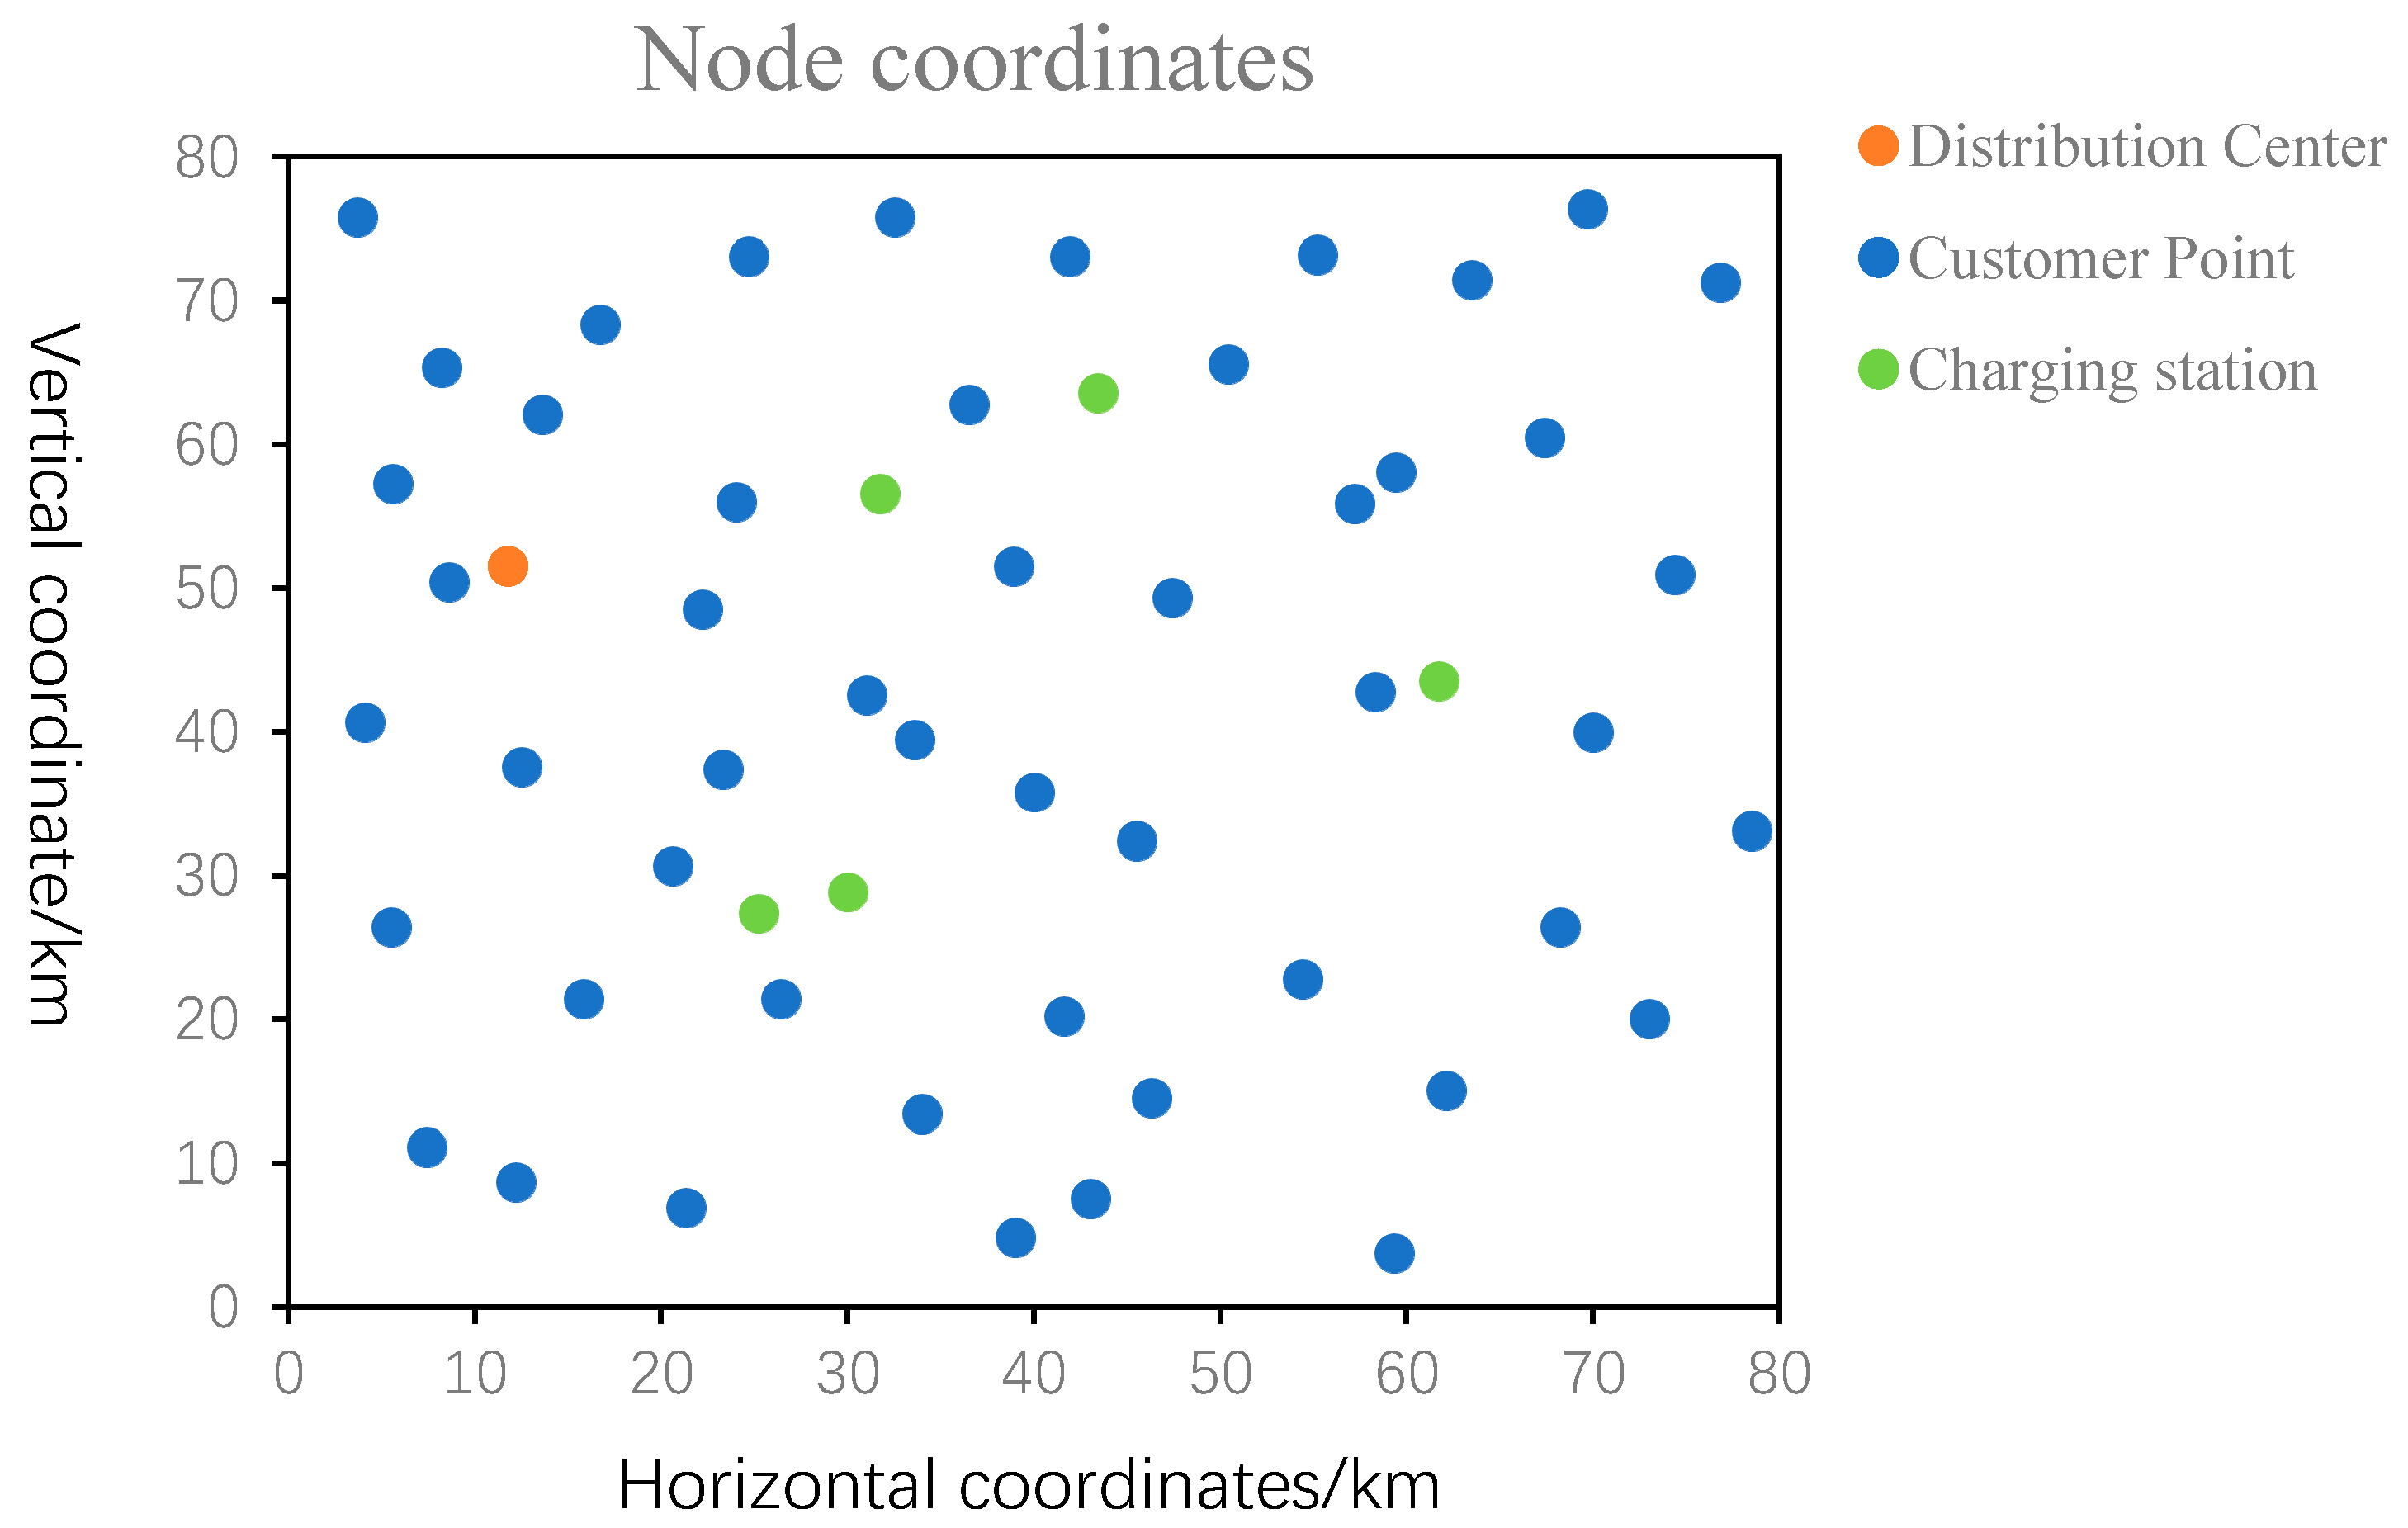
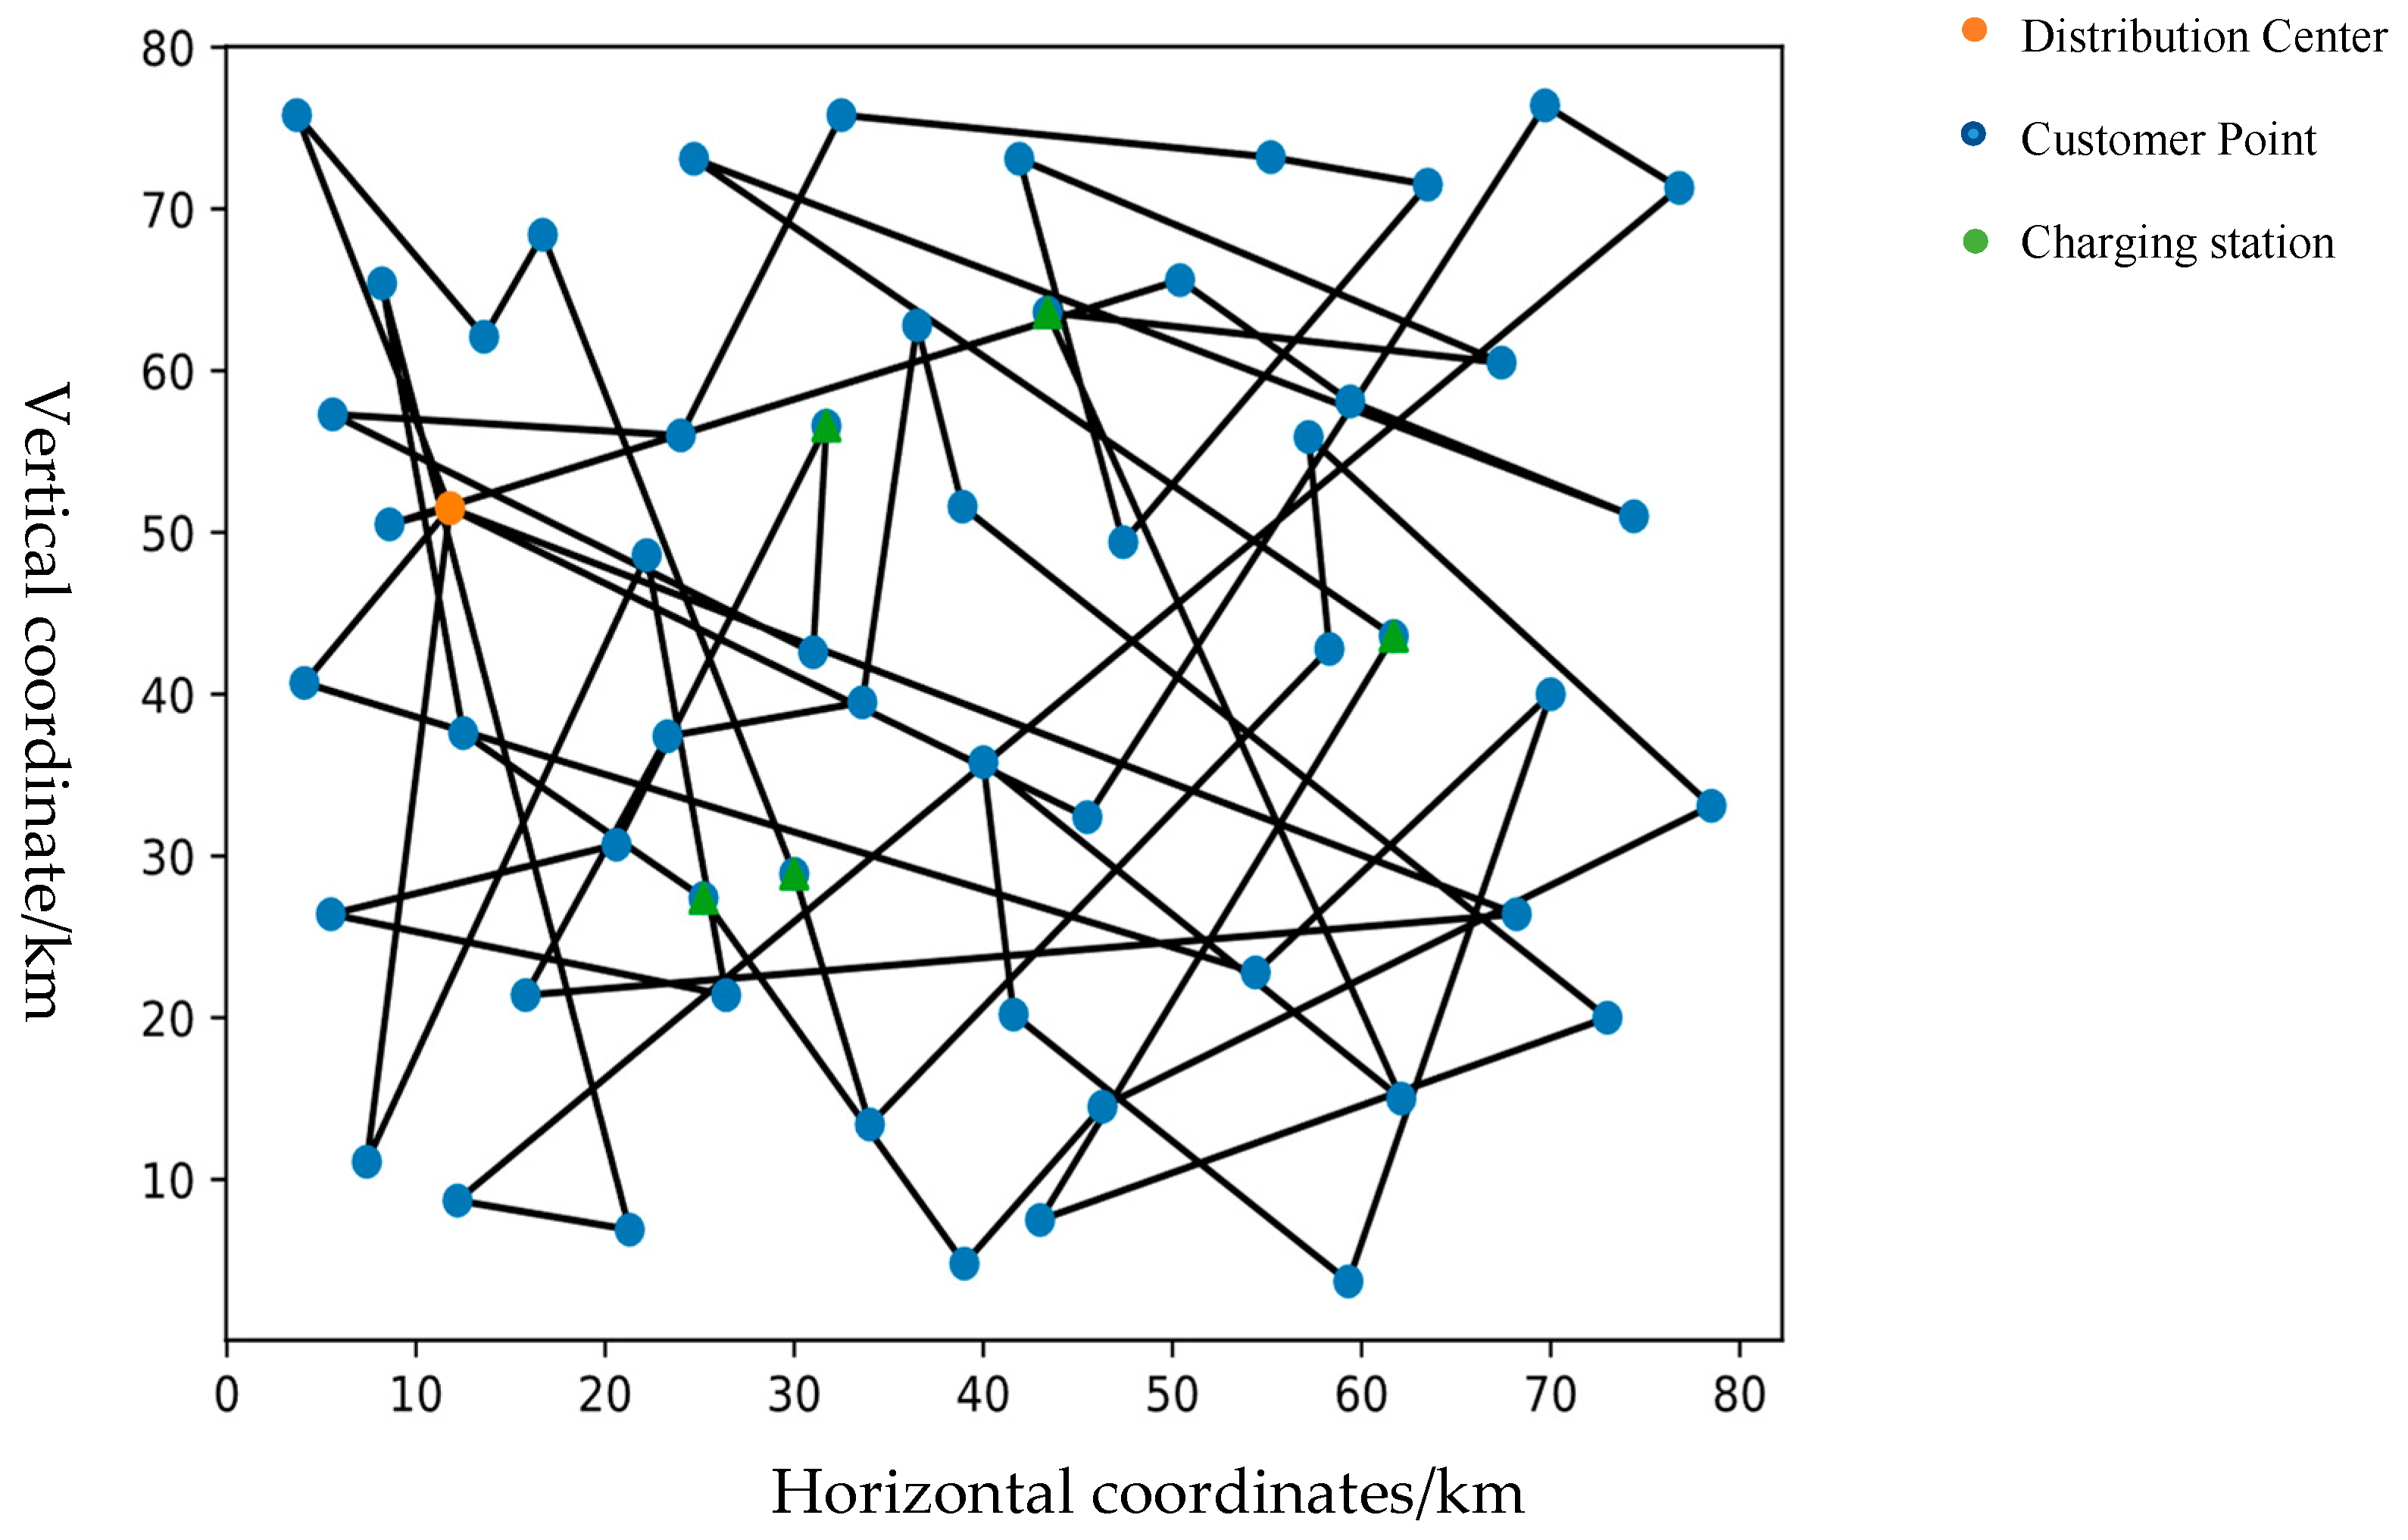
In order to better reflect the actual situation, the number of electric vehicles in the region is simulated based on the density of customer points. The region is divided into several small areas of 2 km × 2 km [25], with two new energy vehicles assigned to each small area. The number of additional electric vehicles is then determined based on the number of customer points. For example, if there are two customer locations in Area A, the number of EVs is the base quantity of two plus the additional quantity of two, for a total of four. Since the model usually uses the straight-line distance as the road distance between nodes, this practice deviates from the actual situation. Therefore, the road detour factor σ (σ = 1.2) is chosen for this example. The node distribution of distribution centers, customer points, and charging stations in the example is shown in Figure 5 (in order to show the node distribution more intuitively and clearly, the figure is enlarged 100 times. This means that one unit calculated in the figure represents 0.1 km).
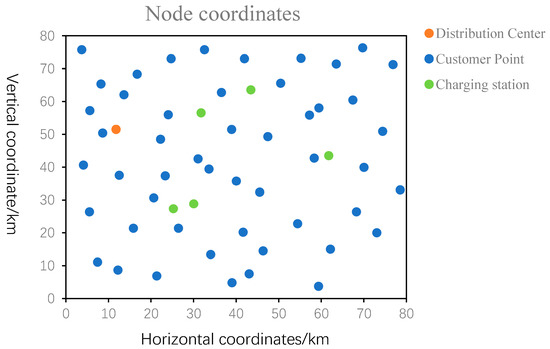
Figure 5.
Node location distribution graph.
4.2. Analysis of Results
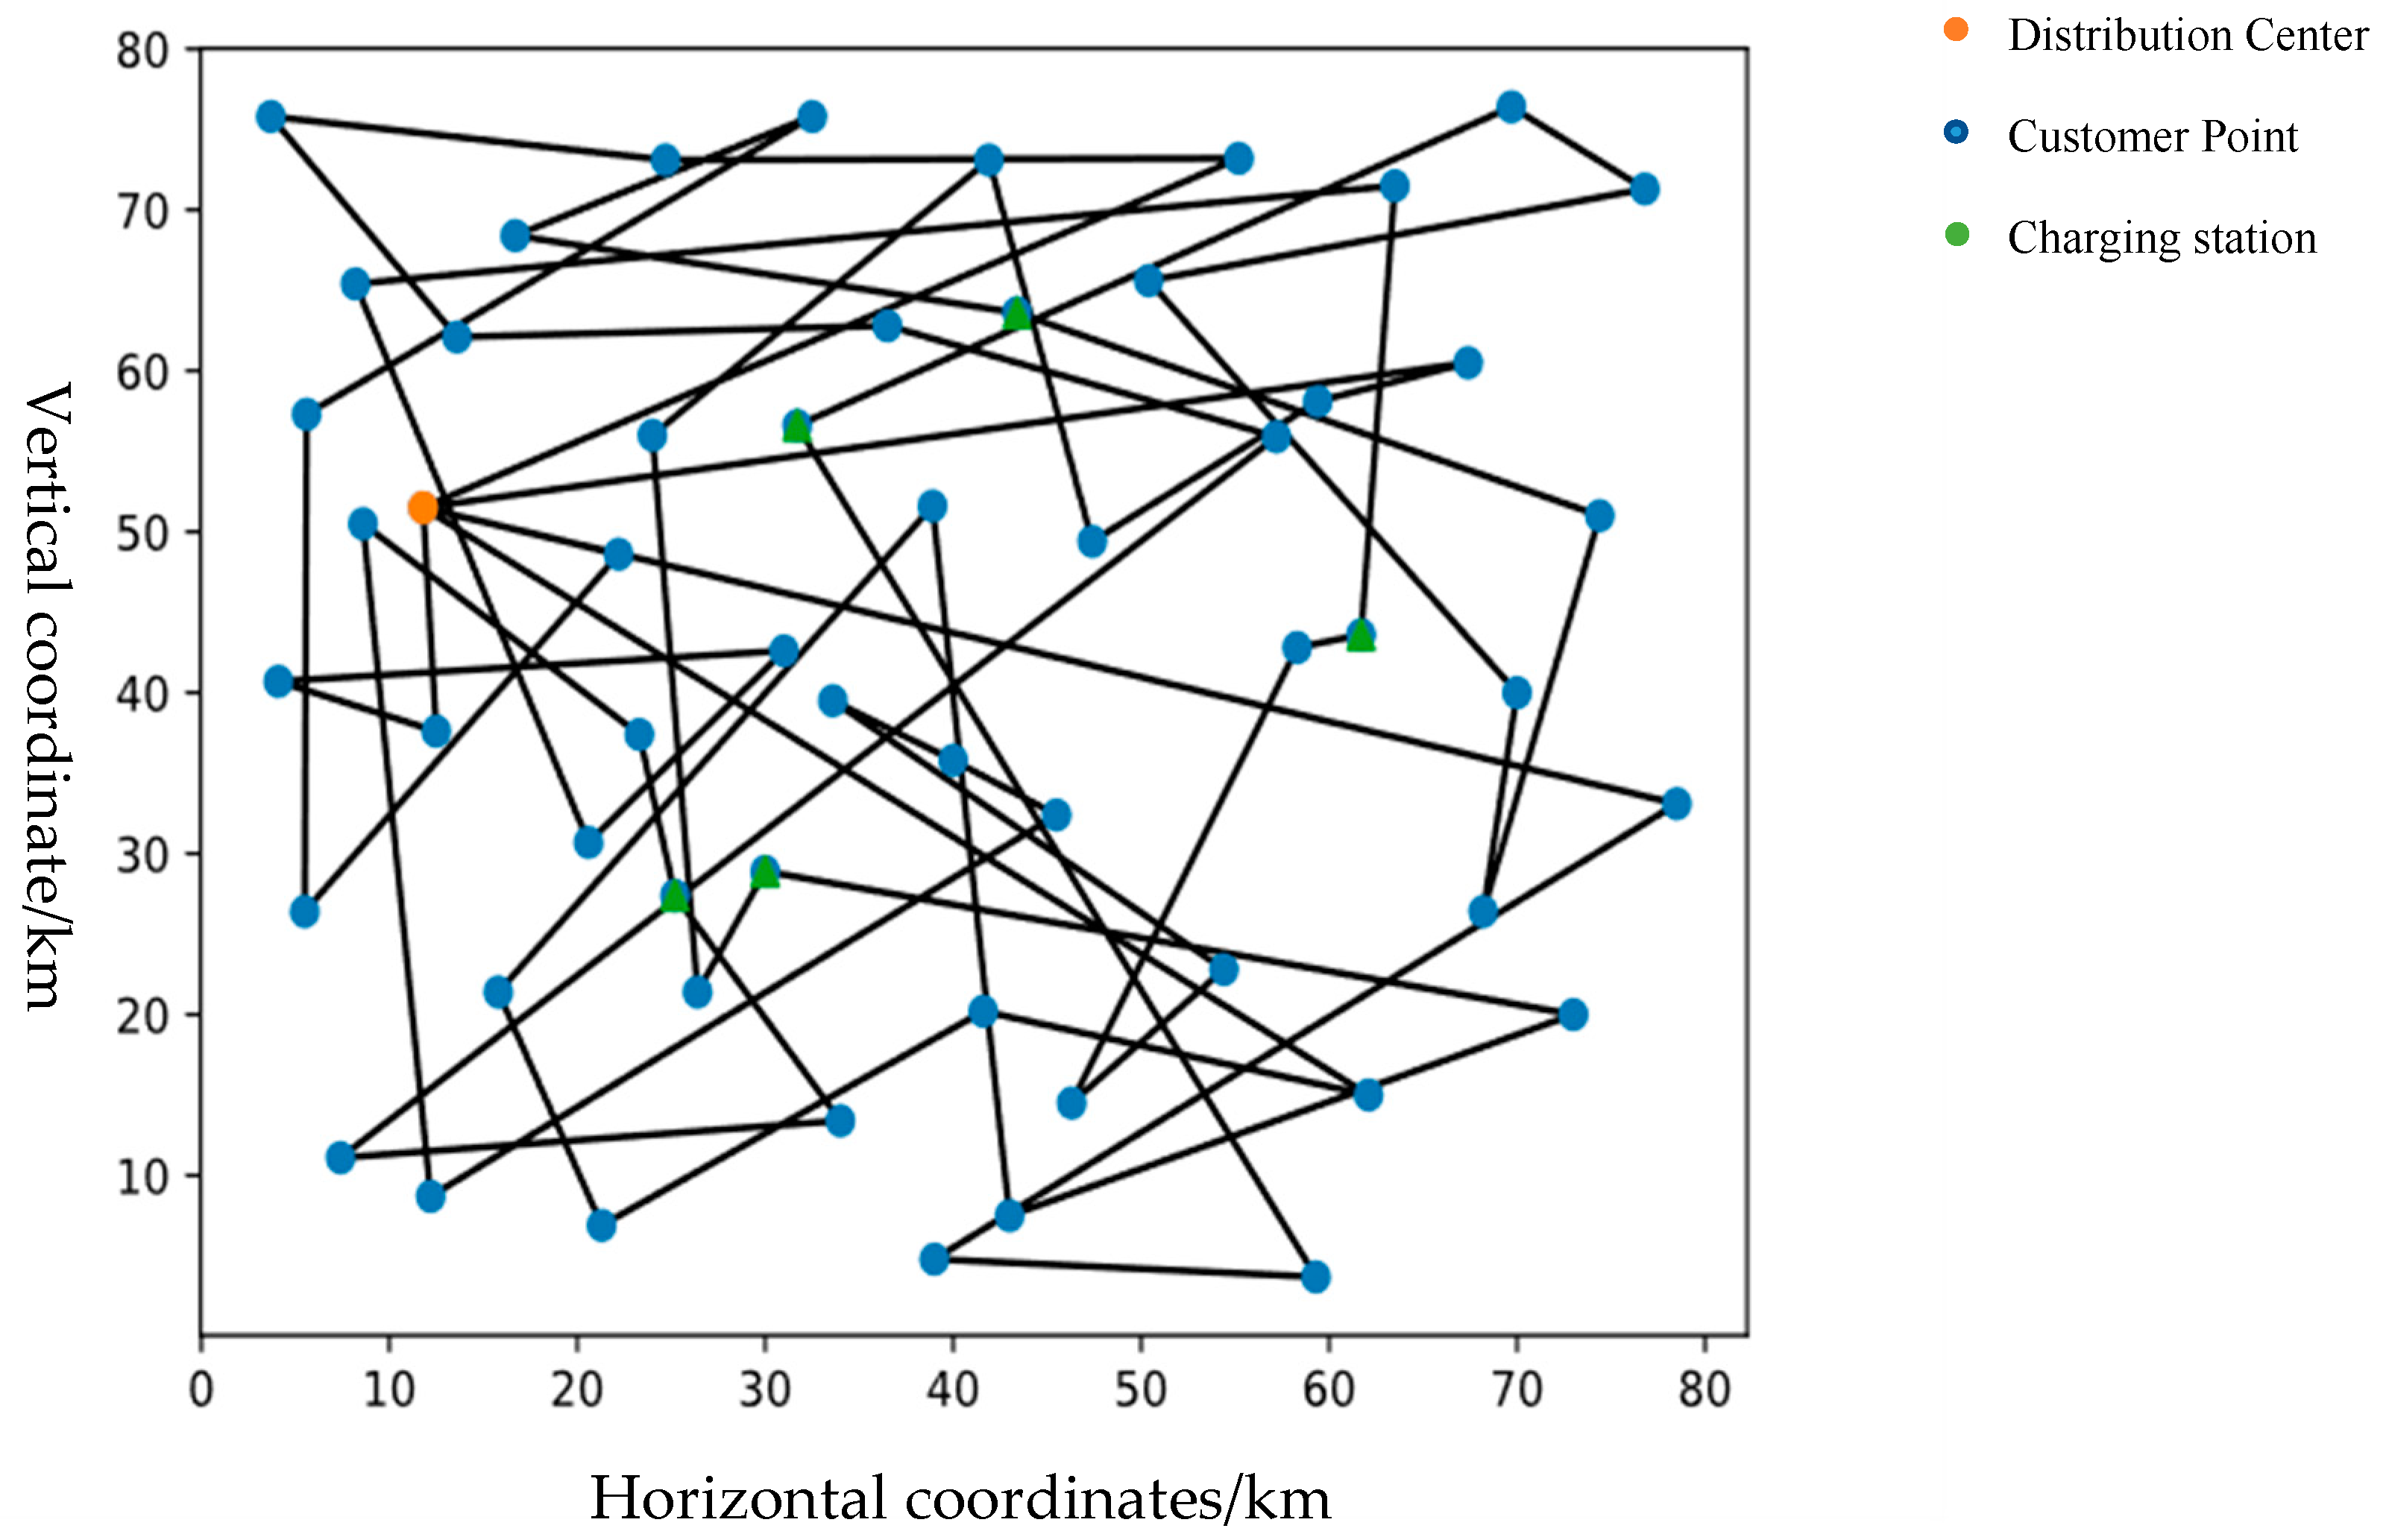
The electric vehicle is equipped with a mobile smart device that actively uploads real-time information, such as perceived vehicle location, travel speed and remaining power, to the cloud platform. At the same time, the charging situation of vehicles within the charging station, the queuing situation, and the usage rate of charging piles will be fed back to the platform dynamically in real time. The decision centre uses the above real-time data to calculate and predict the probability of charging vehicles in the area in the coming time. Considering the constraint of soft time window at the customer point, when the electric vehicle is facing charging demand, the vehicle equipped with a wireless mobile communication network system can use the real-time information to predict the queuing time when arriving at the charging station and then compare the sum of queuing time and travel time to select the best charging station location; the electric vehicle without intelligent network technology goes to the nearby charging station when the power is low. In this paper, the programming software PYTHON (python 3.9, pytorch 1.6.4, AMD Ryzen 7 6800H with Radeon Graphics, RAM 16G.) is chosen as the experimental tool for the algorithm, and the improved hybrid genetic-annealing algorithm is used to solve the problem. The results of the optimal distribution planning path are shown in Figure 6, and the information for each optimal path scheme for vehicle logistics planning is shown in Table 2, Figure 7.
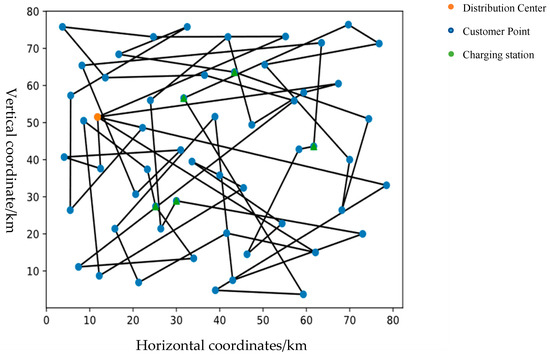
Figure 6.
Intelligent network strategy distribution path map.
Table 2.
Table of vehicle route optimization results.
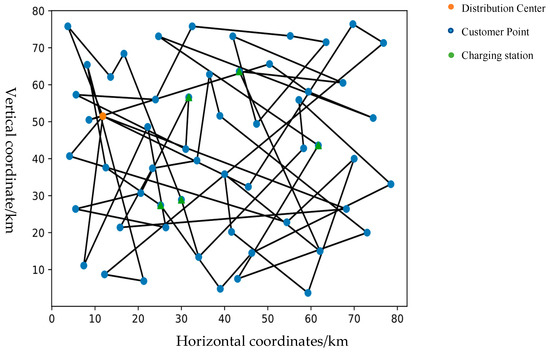
Figure 7.
Latest charge strategy distribution path map.
From the data in Table 2, we can see that: (1) comparing the results for vehicles under the two strategies, we find that in the situation where the number of customer points served is the same and the driving distance is roughly equal, the adoption of the intelligent network connection strategy can plan a more reasonable route for the vehicles—especially in the case where charging is needed—using the intelligent network connection technology to find the best charging location for the vehicles and reduce the charging waiting time, which can shorten the delivery time and reduce the total cost. (2) From the data in Table 2, we can see that as the number of customer points served by the vehicle and the driving distance increase, the difference between the delivery time spent by the vehicle under the two strategies becomes larger and larger, and the difference in the total cost spent also increases from more than 200 yuan to 600 yuan. This shows that when the delivery distance becomes longer, the electric vehicle needs to go to the charging station to charge and extend the range, and the resulting total cost will be significantly increased, which shows that the distribution route planning of electric vehicles is an important factor in improving distribution efficiency and saving distribution costs. Compared with the latest charging strategy, the intelligent network approach used in this paper can shorten the delivery time of electric vehicles while effectively reducing the total cost of delivery and improving the efficiency of delivery.
4.3. Sensitivity Analysis
Electric vehicles can obtain real-time road information and collect vehicle data when equipped with an intelligent network system, and then predict the queuing time of electric vehicles arriving at charging stations. The latest charge strategy only considers the vehicle queuing probability and does not make charging predictions for the traffic flow near the charging station. The strategy in this paper introduces regional vehicle charging probability based on queuing theory and dynamically predicts the queuing waiting time. In order to further verify the impact of this paper’s strategy on vehicle distribution path planning, a comparison is made with the latest charge strategy to analyze each cost of electric vehicle distribution with other conditions kept constant, as shown in Table 3.
Table 3.
Optimized comparison table for different waiting times.
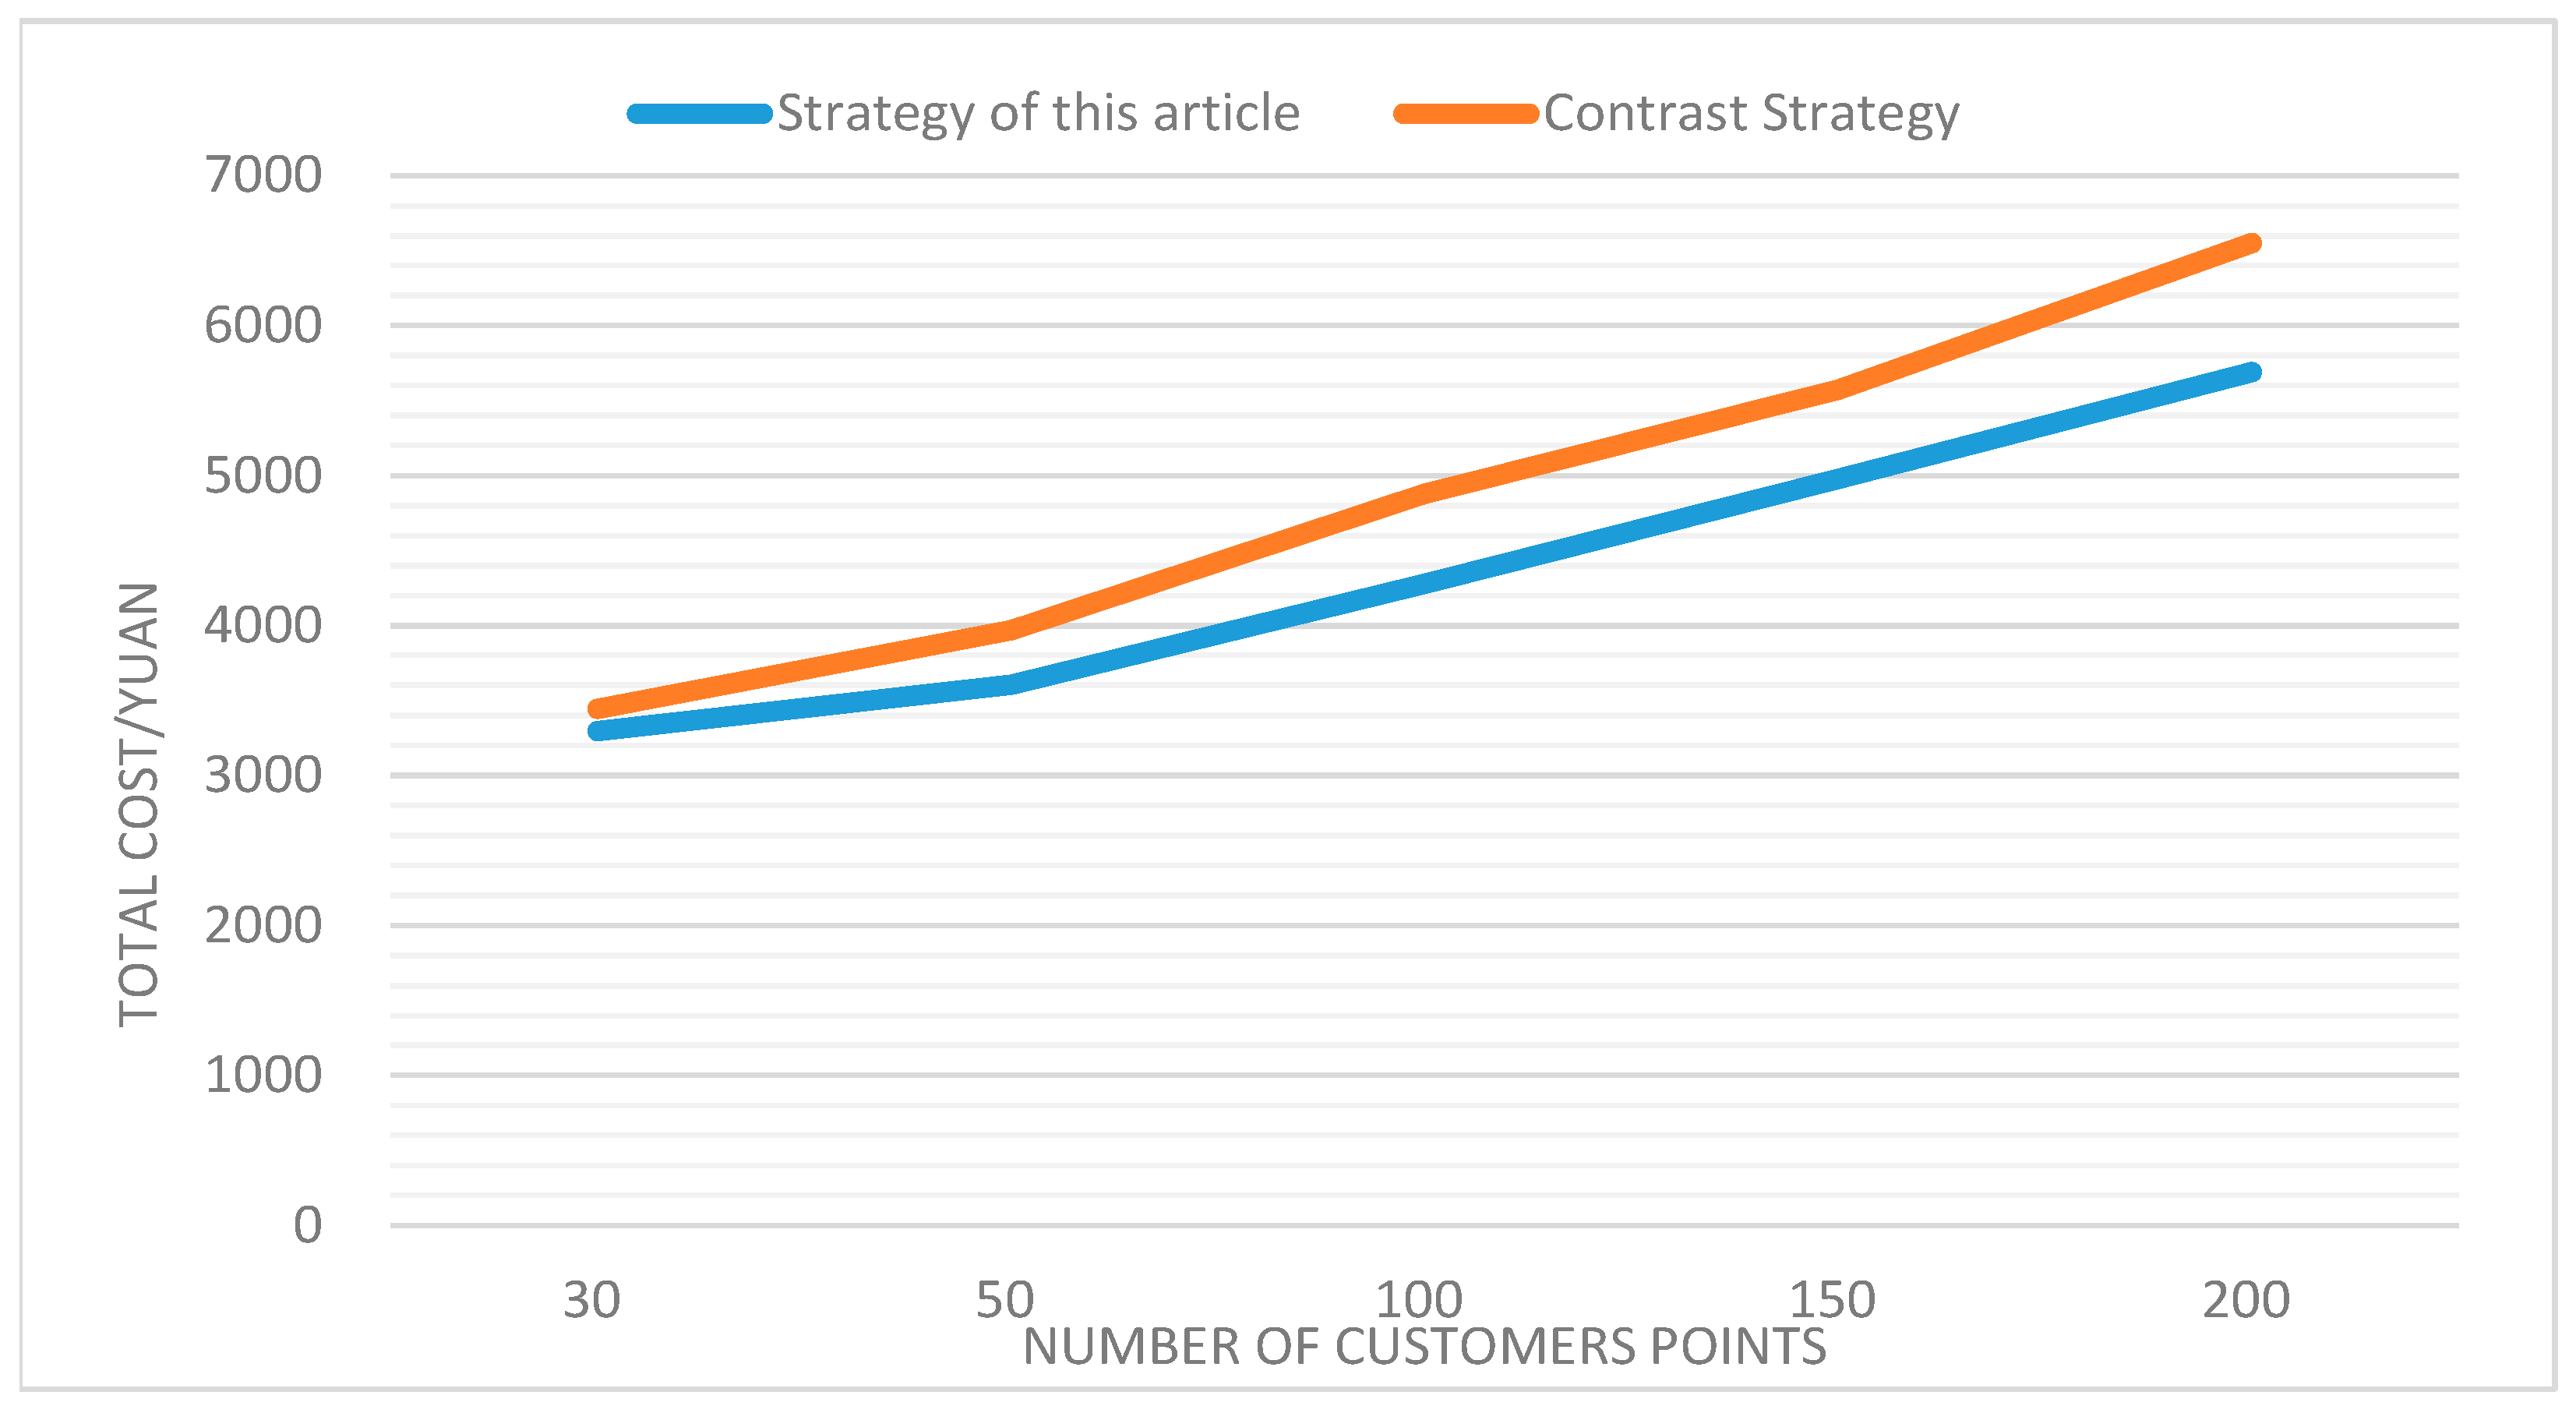
By analyzing the experimental results in Table 3, we find that time cost accounts for the highest proportion of the overall distribution cost; therefore, reducing the time cost of EV is the key to improving the total cost of logistics and distribution. In order to illustrate the effectiveness of this paper’s strategy, we compared the total cost of the two strategies for different customer sizes, as shown in Figure 8. It can be found that the total cost under both strategies grows with the number of customer points, and this paper’s strategy is better than the latest charge strategy in reducing the distribution cost, mainly because this paper’s strategy predicts the traffic flow in the region and considers the charging probability of other vehicles so as to choose a better route for electric vehicles with charging stations. Moreover, as the number of customer points increases, the difference between the two becomes larger.
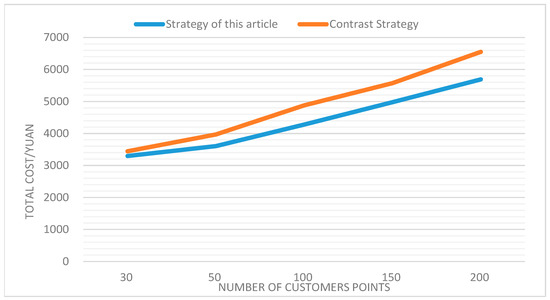
Figure 8.
The total cost of distribution under both strategies Fig.
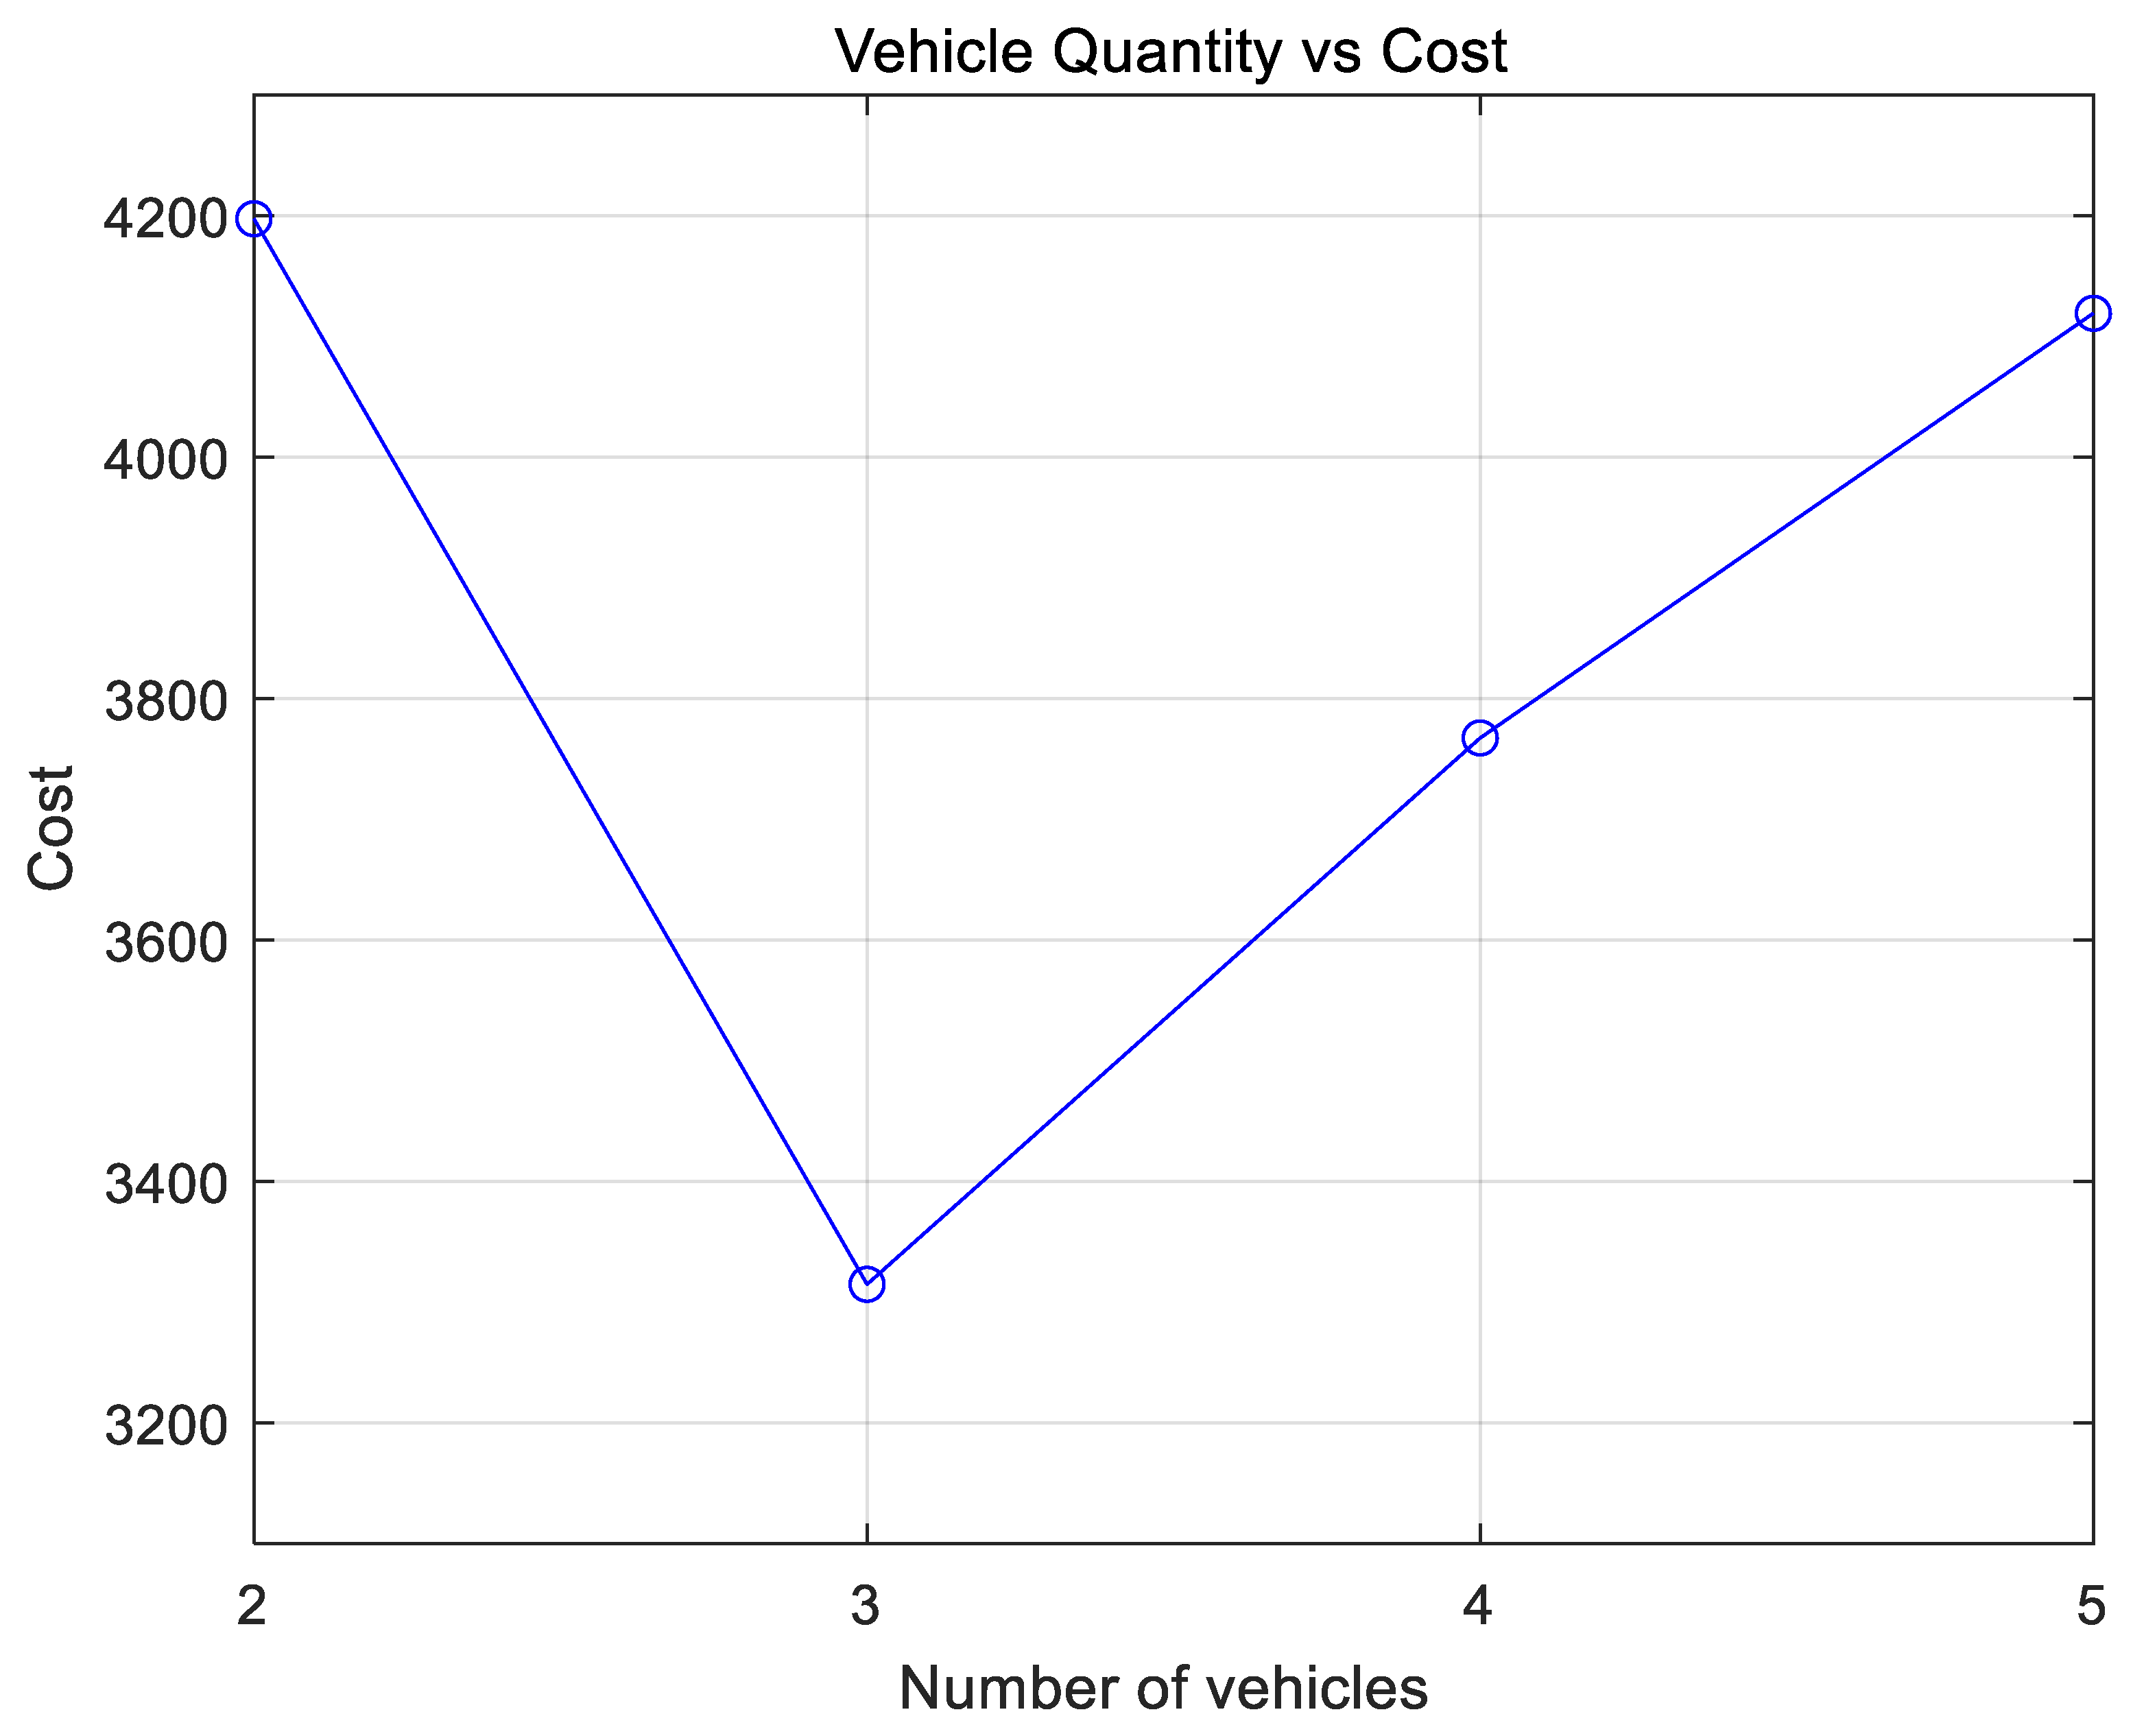
To further verify the effectiveness of the strategy in this paper, the total cost of different numbers of EVs under intelligent network connection strategy is investigated with a customer size of 50 and all other conditions being equal, as shown in Figure 9. By comparing the total costs for different numbers of vehicles, it can be seen that for a customer point count of 50, the choice of three electric vehicles increases the fixed vehicle cost but minimizes the total cost of operation during the delivery process.
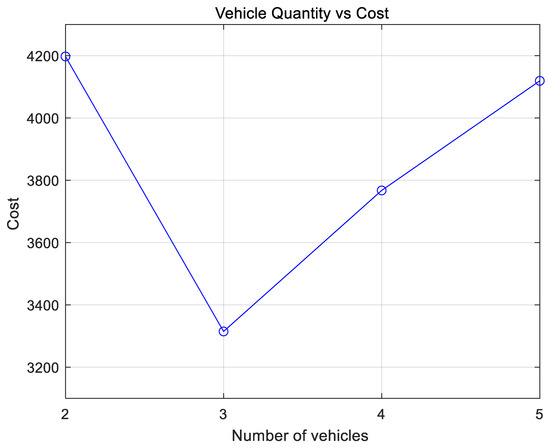
Figure 9.
Total costs for different number of vehicles.
Based on the above analysis, it can be shown that reducing the queuing time of electric vehicles can significantly reduce the total cost of distribution. The strategy of this paper uses the intelligent network connection to obtain real-time information on vehicles and roads, selects the best charging location and timing for electric vehicles by analyzing the dynamic alternating impact of vehicles, and plans a more reasonable route. Although the advantages of this paper’s strategy over the latest charge strategy are not obvious when the number of customer points is small, the advantages brought by this paper’s strategy become more and more obvious as the number of customer points increases.
4.4. Comparison between Different Algorithms
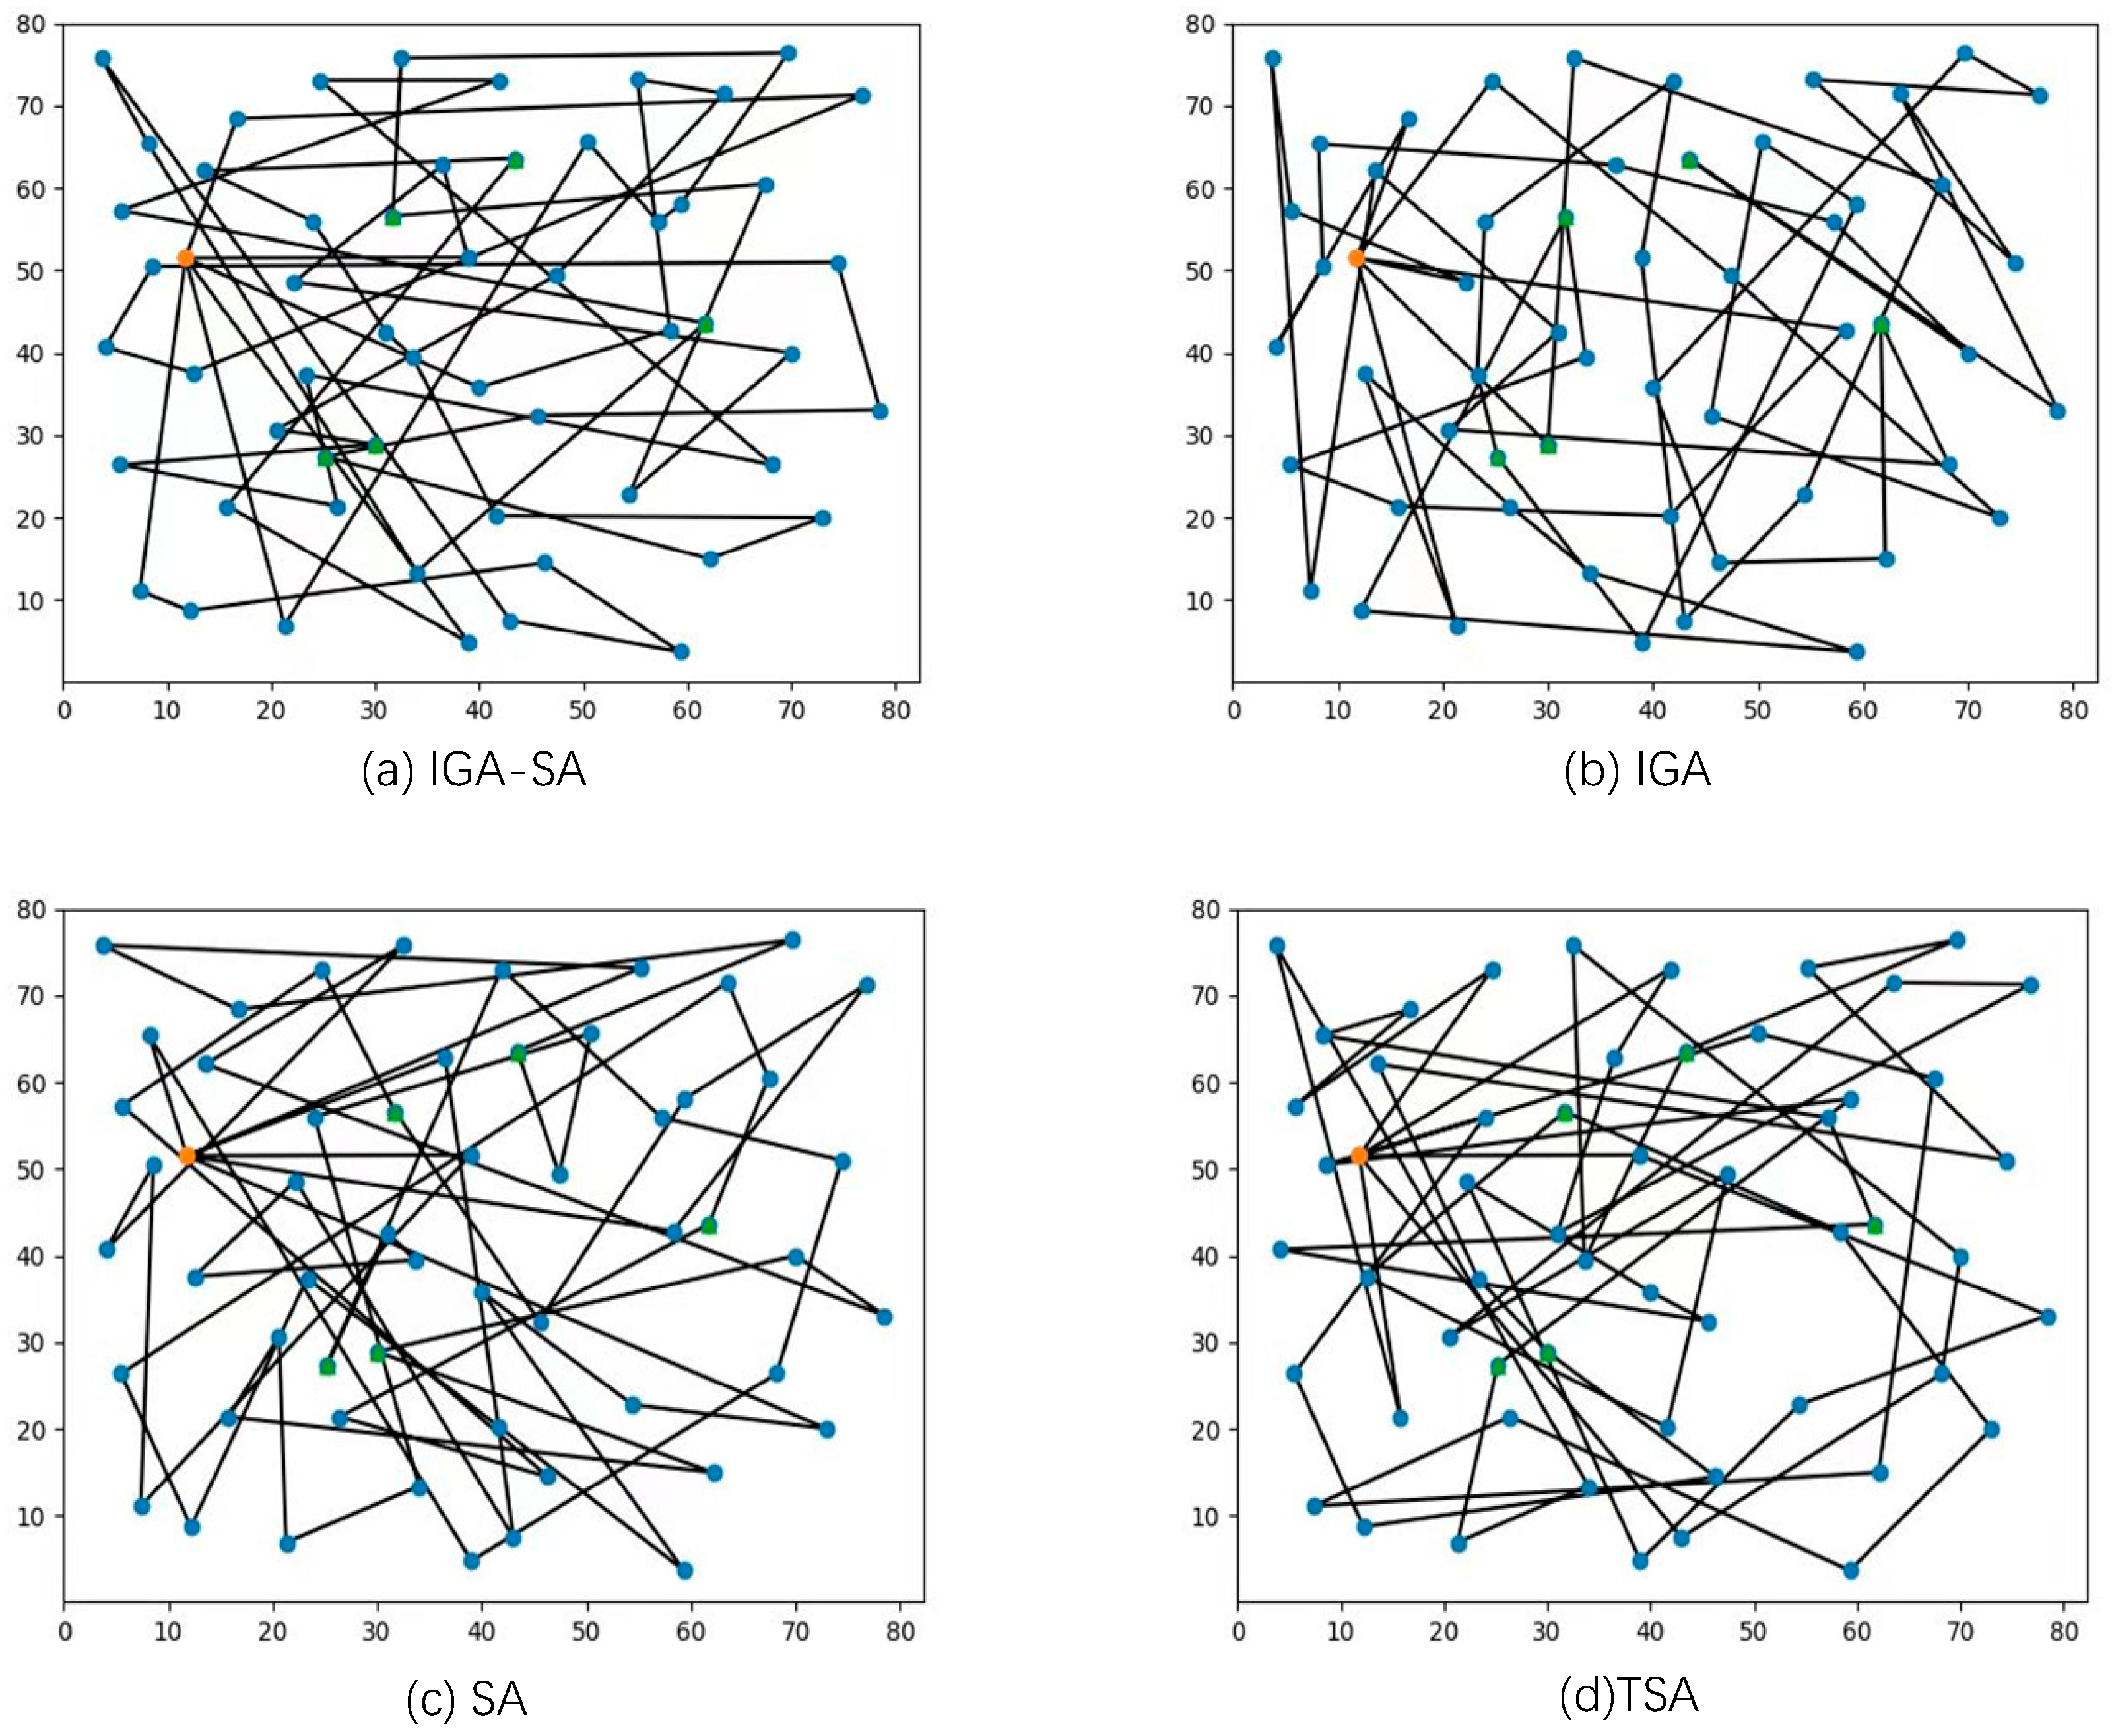
To verify the effectiveness of the algorithm in this paper, the Improved Genetic Algorithm-Simulated Annealing (IGA-SA), it is compared with the Improved Genetic Algorithm (IGA), Simulated Annealing (SA), and Tabu Search Algorithm (TSA). The charging waiting time is set to 0.5 h uniformly. The results of the four algorithms are shown in Figure 10 and the experimental results are shown in Table 4. In terms of cost, the algorithm IGA-SA used in this paper reduces distribution cost and improves logistics and transportation efficiency compared with the other three algorithms; in terms of computation time, the algorithm in this paper outperforms TSA at the speed level, improves computation efficiency, and outperforms IGA and SA at the local search and global convergence levels to obtain optimal results in a shorter period of time.
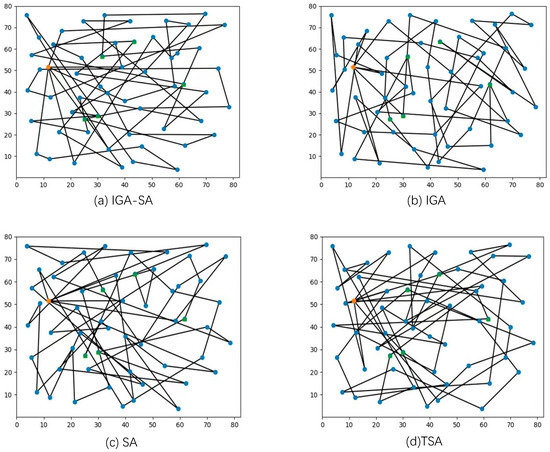
Figure 10.
Four algorithm path result graphs.
Table 4.
Table of results compared to different algorithms.
5. Conclusions
Considering the impact of vehicle alternation during charging and future customer demand, queuing prediction probability is introduced, and a distribution path optimization model based on intelligent network connection and queuing theory for electric logistics vehicles is constructed, which makes real-time demand response decision in charging mode more intelligent. According to the model characteristics, an improved genetic-annealing algorithm is designed to save distribution cost and improve computing efficiency. The following conclusions can be made from the above simulation analysis:
- (1)
- By obtaining real-time dynamic traffic information with the help of intelligent network connection technology, we can introduce the probability of charging other vehicles in the region on the basis of queuing theory, calculate the time logistics vehicles need to wait after arriving at charging stations, and select the best charging location and charging timing for vehicles, thus avoiding time wastage in the distribution process, meeting the time window requirements of customers, and effectively reducing distribution costs.
- (2)
- The strategy in this paper is suitable for distributions with large customer size and high time window requirements. The overall gain is greater as the number of customers increases, and the advantage over the latest charge strategy is also more obvious.
- (3)
- This paper considers both dynamic demand and real-time traffic when studying the EV path problem, which provides a reference value for EV dynamic path planning research and extends the direction of EV distribution research.
Based on the research in this paper, we will continue to promote the application of intelligent network technology in electric vehicle distribution in subsequent research and analyze for more factors that may affect charging behavior. On one hand, we will consider the impact of different charging equipment and costs on the selection of charging stations, especially in the face of advancements in high-power and high-voltage charging technology, and will also consider the constraints of various equipment at different charging stations for electric vehicles, as well as the impact of charging prices at different times on the selection of charging stations. Additionally, we will consider the influence of weather forecast on the selection of charging station, including the difference in power consumption under extreme weather and the influence of weather forecast on the charging behavior of vehicle owners. This will allow for building a charging mode that is more suitable for the actual environment and provide more optimization solutions for enterprises.
Author Contributions
X.W. designed research methods; Q.X. wrote the manuscript; X.S. designed the computer programs. All authors have read and agreed to the published version of the manuscript.
Funding
This research was funded by the Major Project on Philosophy and Social Sciences Research of Higher Education in Hubei Province Education Department under Grant 19ZD015 and the Research Topics on China Society of Logistics, China Federation of Logistics and Purchasing under Grant 2022CSLKT-336.
Data Availability Statement
The data presented in this study can be requested from the authors.
Conflicts of Interest
The authors declare no conflict of interest.
References
- Wang, Y.; Lu, G.; Chen, P.; Li, Z. Research and application of fundamental theories and common key technologies for intelligent vehicle networking. China Sci. Found. 2021, 35, 185–191. [Google Scholar] [CrossRef]
- Mastoi, M.S.; Zhuang, S.; Munir, H.M.; Haris, M.; Hassan, M.; Usman, M.; Bukhari, S.S.H.; Ro, J.-S. An in-depth analysis of electric vehicle charging station infrastructure, policy implications, and future trends. Energy Rep. 2022, 8, 11504–11529. [Google Scholar] [CrossRef]
- Aung, N.; Zhang, W.; Sultan, K.; Dhelim, S.; Ai, Y. Dynamic traffic congestion pricing and electric vehicle charging management system for the internet of vehicles in smart cities. Digit. Commun. Netw. 2021, 7, 492–504. [Google Scholar] [CrossRef]
- Wang, Y.; Hu, H.; Liu, F.; Wang, Y.; Zhao, J. Optimization of unmanned vehicle delivery paths under intelligent network connectivity. Oper. Res. Manag. 2021, 30, 52–58. [Google Scholar]
- Barkaoui, M. A co-evolutionary approach using information about future requests for dynamic vehicle routing problem with soft time windows. Memetic Comput. 2018, 10, 307–319. [Google Scholar] [CrossRef]
- Sun, L.; Li, F.F.; Wang, W.; Hu, X. Research on real-time demand response strategy of mobile charging vehicles based on reservation mode. Oper. Res. Manag. 2022, 31, 121–129. [Google Scholar]
- Wang, Z.; Han, Y.; Jiang, M.; Yuan, Z.; Zhang, L. Intelligent trajectory prediction algorithm of wireless cluster based on vehicular network under hybrid traffic. Radio Eng. 2022, 52, 33–38. [Google Scholar]
- Gokasar, I.; Pamucar, D.; Deveci, M.; Ding, W. A novel rough numbers based extended MACBETH method for the prioritization of the connected autonomous vehicles in real-time traffic management. Expert Syst. Appl. 2023, 211, 118445. [Google Scholar] [CrossRef]
- Younes, R.; Najem, M. A real-time path planning for reducing vehicles traveling time in cooperative-intelligent transportation systems. Simul. Model. Pract. Theory 2023, 123, 102710. [Google Scholar]
- Dudin, A.N.; Dudin, S.A.; Dudina, O.S.; Samouylov, K.E. Competitive queueing systems with comparative rating dependent arrivals. Oper. Res. Perspect. 2020, 7, 100139. [Google Scholar] [CrossRef]
- Yang, Y.; Gao, P.; Zhao, C.-Z. A model for siting and sizing of temporary charging stations for electric vehicles in cities. J. Chongqing Norm. Univ. 2020, 37, 1–6. [Google Scholar]
- Xiao, D.; An, S.; Cai, H.; Wang, J.; Cai, H. An optimization model for electric vehicle charging infrastructure planning considering queuing behavior with finite queue length. J. Energy Storage 2020, 29, 101317. [Google Scholar] [CrossRef]
- Hong, W.; Xu, Z.; Liu, W.; Wu, L.; Pu, X. Queuing theory-based optimization research on the multi-objective transportation problem of fourth party logistics. Proc. Inst. Mech. Eng. 2021, 235, 1327–1337. [Google Scholar] [CrossRef]
- Keskin, M.; Çatay, B.; Laporte, G. A simulation-based heuristic for the electric vehicle routing problem with time windows and stochastic waiting times at recharging stations. Comput. Oper. Res. 2021, 125, 105060. [Google Scholar] [CrossRef]
- Lam, E.; Desaulniers, G.; Stuckey, P.J. Branch-and-cut-and-price for the Electric Vehicle Routing Problem with Time Windows, Piecewise-Linear Recharging and Capacitated Recharging Stations. Comput. Oper. Res. 2022, 145, 105870. [Google Scholar] [CrossRef]
- Fioriti, D.; Scarpelli, C.; Pellegrino, L.; Lutzemberger, G.; Micolano, E.; Salamone, S. Battery lifetime of electric vehicles by novel rainflow-counting algorithm with temperature and C-rate dynamics: Effects of fast charging, user habits, vehicle-to-grid and climate zones. J. Energy Storage 2023, 59, 106458. [Google Scholar] [CrossRef]
- Huber, J.; Dann, D.; Weinhardt, C. Probabilistic forecasts of time and energy flexibility in battery electric vehicle charging. Appl. Energy 2020, 262, 114525. [Google Scholar] [CrossRef]
- Kumar, N.; Kumar, T.; Nema, S.; Thakur, T. A comprehensive planning framework for electric vehicles fast charging station assisted by solar and battery based on Queueing theory and non-dominated sorting genetic algorithm-II in a co-ordinated transportation and power network. J. Energy Storage 2022, 49, 104180. [Google Scholar] [CrossRef]
- Zhang, W.; Zhang, S.; Luo, J.; Wang, G. Dynamic optimization model of electric vehicle charging pile queuing service. J. Jilin Univ. 2022, 52, 1045–1051. [Google Scholar]
- Kucukoglu, I.; Dewil, R.; Cattrysse, D. The electric vehicle routing problem and its variations: A literature review. Comput. Ind. Eng. 2021, 161, 107650. [Google Scholar] [CrossRef]
- Fontes Dalila, B.M.M.; Homayouni, S.M.; Gonçalves, J.F. A hybrid particle swarm optimization and simulated annealing algorithm for the job shop scheduling problem with transport resources. Eur. J. Oper. Res. 2023, 306, 1140–1157. [Google Scholar] [CrossRef]
- Ge, X.; Li, Z.-W.; Ge, S.-B. Study on logistics distribution path optimization with time window considering flexible charging strategy. Control. Theory Appl. 2020, 37, 1293–1301. [Google Scholar]
- Yang, J.; Feng, P.; Sun, H.; Yang, C. Research on the site selection and path optimization of electric vehicle logistics distribution system for switching stations. China Manag. Sci. 2015, 23, 87–96. [Google Scholar]
- Zhao, Z.; Li, X. Path optimization method of electric vehicles for fresh food delivery under time-varying traffic. Transp. Syst. Eng. Inf. 2020, 20, 218–225+239. [Google Scholar]
- Sica, L.; Deflorio, F. Estimation of charging demand for electric vehicles by discrete choice models and numerical simulations: Application to a case study in Turin. Green Energy Intell. Transp. 2023, 2, 100069. [Google Scholar] [CrossRef]


Disclaimer/Publisher’s Note: The statements, opinions and data contained in all publications are solely those of the individual author(s) and contributor(s) and not of MDPI and/or the editor(s). MDPI and/or the editor(s) disclaim responsibility for any injury to people or property resulting from any ideas, methods, instructions or products referred to in the content. |
© 2023 by the authors. Licensee MDPI, Basel, Switzerland. This article is an open access article distributed under the terms and conditions of the Creative Commons Attribution (CC BY) license (https://creativecommons.org/licenses/by/4.0/).