Abstract
The article presents the predictive capabilities of a fuzzy multi-criteria evaluation system that operates on the basis of a non-fuzzy neural approach, but also one that is capable of implementing a learning paradigm and working with vague concepts. Within this context, the necessary elements of fuzzy logic are identified and the algebraic formulation of the fuzzy system is presented. It is with the help of the aforementioned that the task of predicting the short-term trend and price of the Tesla share is solved. The functioning of a fuzzy system and fuzzy neural network in the field of time series value prediction is discussed. The authors are inclined to the opinion that, despite the fact that a fuzzy neural network reacts in terms of applicability and effectiveness when solving prediction problems in relation to input data with a faster output than a fuzzy system, and is more “user friendly”, a sufficiently knowledgeable and experienced solver/expert could, by using a fuzzy system, achieve a higher speed of convergence in the learning process than a fuzzy neural network using the minimum range of input data carrying the necessary information. A fuzzy system could therefore be a possible alternative to a fuzzy neural network from the point of view of prediction.
MSC:
26E50
1. Introduction
Predicting stock market prices is one of the basic objectives of scientific and business research. Historically, the key area of study has involved the modelling of time series [1]. Traditional methods are based on parametric models and include the autoregressive method, exponential smoothing, and structural models of time series (e.g., [2,3]). For example, Debnath and Srivastava [4] conducted a paired t-test for the significance of the difference between the average returns of the sectors in 2019 and 2021 to test the appropriateness of the stock selection methodology proposed.
Modern approaches to temporal data analysis include machine learning methods ([5], which provide procedures for learning temporal dynamics purely based on data series [6] or prediction algorithms based on fuzzy logic, as demonstrated in Castillo and Melin [7]).
Fuzzy logic makes it possible, to a certain extent, to solve the problem of insufficient knowledge. The reason being that it provides a simple way to reach a certain conclusion based on vague, ambiguous, imprecise, or missing input data [8]. Models combining fuzzy logic and dynamic modelling based on regression analysis [9] and time series analysis [10] have been used to this effect.
There is a merger of methods implementing the paradigm of learning with methods based on fuzzy-logic-formed predictive fuzzy neural networks [11]. In terms of cognitive science, these are artificially created systems capable of working with vague concepts and effectively utilising the implicit knowledge gained from the data presented in the learning process, either under the supervision of a teacher or without [12]. The basic structure of these systems is a tailor-made problem of a neural network type in terms of an allegorical model of the structure and the functioning of the human brain on the micro level [13]. The learning process of the fuzzy neural network is controlled by a fuzzy learning algorithm, which gradually selects each element of the training set and calculates the necessary changes in synaptic weights, so that the network generates an adequate right side for its left side, i.e., an output that differs as little as possible from the desired output [14]. The vagueness of the term “as little as possible” is one of the reasons why fuzzy logic, with fuzzy inference rules of the fuzzy implications type, which therefore become part of the instructions of the fuzzy learning algorithm, enters the game.
With a properly chosen fuzzy learning algorithm, the learning process, after some time, converges to such a synaptic weight setting, whereby the sum of the quadrates of output deviations from the desired values reaches its minimum and the running of the fuzzy learning algorithm stops. This means that all the available information, contained in the training set, is “incarnated” into the structure of the network, which responds to each new input not contained in the training set, with an output in terms of the learnt range [15].
Our aim is to introduce a prediction tool that is able to implement the learning paradigm and work with vague concepts with a minimum of input data carrying the necessary information; however, it will operate on a different basis than the aforementioned fuzzy neural approach. This prediction tool is in the general concept presented as a fuzzy system for multi-criteria evaluation (hereinafter “fuzzy system”).
The conceptual framework of the fuzzy system is based on Kahneman’s allegorical model of the functioning of the human mind in terms of the identification of the processes of the functioning of systems S1 and S2 of Kahneman’s model, with the phases of the functioning of the fuzzy system [16]. S1 and S2 perform two cooperating subsystems represented by the conscious and subconscious components of thinking. The characteristic of S1, among others, is intuitiveness. It is a system that operates unconsciously, producing spontaneous reactions to various stimuli. It is responsible for quick situation assessment and automatic responses, such as facial recognition or responses to danger, and so on. The characteristics of S2, among others, are analytical thinking, intentionality, and awareness. S2 is activated when tackling more complex tasks that require logical reasoning, analysis, and planning. It is responsible for critical thinking, decision making based on rational deliberation, and control over the impulses triggered by S1. In contrast to vaguely defined intuitive concepts, into which the human mind categorizes more or less related details (S1), there are vaguely defined supports of fuzzy sets, into which the fuzzy system “blurs” the more or less related values of the input stimuli. Just as the rational component of the human mind oversees the appropriateness of the reactions to stimuli (S2), the processes of fuzzy logical inference, functioning within fuzzy logic, maintain the proper proportionality between the left and right sides of the inference rules.
A fuzzy system is a tool with a uniform structure, independent of the type of problem, in which the inference rules are not fuzzy implications, whereby simple rules of conventional situational control are applied.
In the text that follows, we summarize the current state of knowledge in relation to the issue of modern prediction methods. In the methodological part, we identify the necessary elements of fuzzy logic and present the algebraic formulation of the fuzzy system, with the help of which, the task of predicting the short-term trend of Tesla, Inc. (hereinafter “Tesla”) shares is solved. As part of the discussion, the functioning of the fuzzy system and fuzzy neural networks in terms of time series value prediction is compared.
The key contribution of the article is the presentation of the fuzzy system and its verification as a possible alternative to a fuzzy neural network from the point of view of prediction ability based on the minimum required input data. The determination of the real capabilities of the fuzzy system, in terms of short-term trend prediction, is performed on the Tesla share price estimate.
2. Related Work
In the past, several methods were developed that utilised fuzzy logic in combination with artificial intelligence and machine learning. What follows maps some of these methods.
In the field of economics, fuzzy logic has been used as a prediction method for some time. In practice, fuzzy logic is used independently [17,18], but more often in combination with other procedures [19]. Fuzzy logic and fuzzy hybrid models are not just used for the prediction of stock price developments, but in many other fields too. For example, Maciel and Ballini [20] used a fuzzy model to analyse the problem of time within the framework of an interval time series of low and high asset prices. They compared their model to traditional econometric methods for time series and interval models based on statistical criteria. Their results revealed that the fuzzy model outperformed the standard sample of the competing method in the range of interval values. The high efficiency of this method was also pointed out by Kutlu et al. [21], who, through the Fuzzy Analytic Hierarchy Process (FAHP), tackled the issue of the optimal allocation of a renewable energy source from an economic point of view. Ben Jabeur et al. [22] investigated the effect of the 2008 financial crisis on the corporate performance of 805 French companies in the period of 2007–2009, using the method of a qualitative comparative analysis of fuzzy sets (fsQCA).
Similar models have been successfully used by traders for the fuzzy prediction of the exchange rates within the emissions allowance market [23]. Likewise, Hašková [24] dealt with predicting the profitability of investments in supported renewable energy sources—biogas stations; the given fuzzy model provided information about the level of investment security in terms of its resistance to possible loss. This was due, among other things, to the fact that the fuzzy approach expands the range of the sensitivity analysis performed by the evaluator when valuing projects and companies and enables decision makers to have more relevant information available for processes or predictions [25]. The connection between fuzzy predictive methods and sustainability was documented by Lo et al. [26]. They applied a regression analysis of least squares (OLS) and a qualitative comparative fuzzy set analysis (FsQCA) to obtain optimal sustainability models for a commercial firm. Research on fuzzy economic predictions in the form of an evaluation experiment has been used relatively rarely. An exception is represented by Shao et al. [27]. They successfully used the optimized intuitionistic fuzzy case-based reasoning (IFCBR) method to predict demand in crisis periods. Fuzzy logic can also be used as part of a pair trading strategy. It can partially solve the problem of the difficult prediction of this market-neutral arbitrage strategy and increase its returns, which has been proven by comparing it with traditional technical analysis methods for trading within the spread [28].
Wu et al. [29] used multivariate fuzzy logic relationships based on a technical analysis, affinity propagation (AP), clustering, and a support vector regression (SVR) model to predict the performance of the Taiwan Capitalization Weighted Stock Index (TAIEX), the Standard & Poor’s 500 (S&P500), and the Dow Jones Industrial Average (DJIA) dataset. Chourmouziadis et al. [30] tested a model for the fuzzy prediction of the development of an investment portfolio on the Athens Stock Exchange, with the goal of outperforming the market (Buy and Hold strategy) in the medium and long terms. The approach was also proven to work during both bull and bear market periods. As part of their prediction of stock price developments, Mohamed et al. [31] applied an adaptive fuzzy neural model to 58 listed firms, examining the significance of four performance predictors—return on assets (ROA), return on equity (ROE), earnings per share (EPS), and profit margin (PM). Chang and Liu [32] developed a Takagi–Sugeno–Kang (TSK) Fuzzy Rule Based System for stock price prediction. The TSK fuzzy model applied a technical index as an input variable, with the subsequent part being a linear combination of the input variables. This was successfully tested on Taiwanese electronic stocks listed on the Taiwan Stock Exchange. Liu et al. [33] presented an application of type two fuzzy neural modelling to predict TAIEX and NASDAQ stock prices based on a given set of training data. Xie et al. [34] proposed an approach that integrated a fuzzy neural system with a Hammerstein–Wiener model that formed an indivisible five-layer network, whereby the implication of the fuzzy neural system was realised through a linear dynamic computation of the Hammerstein–Wiener model. The effectiveness of the model was evaluated on three data sets of financial stocks. An interesting contribution was published by Nasiri and Ebadzadeh [35], where a new multi-functional recurrent fuzzy neural network was introduced. It consisted of two fuzzy neural networks with Takagi–Sugeno–Kang fuzzy rules. There was a feedback loop between these two networks, which allowed the network to learn and memorize historical information from past observations, enabling it to learn multiple functions simultaneously.
The summary of the text, which includes the mentioned methods, has been addressed in several works. In this regard, a highly successful review work is “Systematic literature review of fuzzy logic based text summarization” by Kumar and Sharma [36], which presented a systematic review of the literature with the aim of gathering, analysing, and reporting the trends, gaps, and prospects of using fuzzy logic based on the findings in original studies. Another comprehensive study is “A comprehensive review of deep neuro-fuzzy system architectures and their optimization methods” by Talpur et al. [37]. The study aimed to assist researchers in understanding the various ways that deep neuro-fuzzy systems are developed through the hybridization of deep neural networks and reasoning aptitude from fuzzy inference systems, as well as gradient-based and metaheuristic-based optimization methods. In the context of the reviewed methods, it is worth mentioning the work “Applications of neuro fuzzy systems: A brief review and future outline” [38]. The work provided an overview of the development of neuro-fuzzy systems through the classification and a literature review of the articles from the decade of 2002–2012, aiming to explore how various neuro-fuzzy system methods were developed during this period.
Forecasting the price of Tesla shares has been covered by many authors. For example, Agrawal [39] proposed a non-linear regression method based on deep learning to predict the stock price. Barapatre et al. [40] proposed a machine learning artificial neural network (ANN) model for stock market price prediction that integrated a backpropagation algorithm that was used to train the ANN model, with the research implemented on the back of a Tesla stock price dataset. Aldhyani and Alzahrani [41] proposed a framework based on long short-term memory (LSTM) and a hybrid of a convolutional neural network with LSTM (CNN-LSTM) to predict the closing prices for Tesla, Inc. and Apple, Inc. Alkhatib et al. [42] used six deep learning models: MLP, GRU, LSTM, Bi-LSTM, CNN, and CNN-LSTM to predict the adjusted closing stock price. The results showed that the LSTM-based models improved with the new approach, with no model performing better or outperforming the other models.
Why is Tesla a frequent target for the analysis of techniques related to their ability to predict future share prices? Tesla is not only an exceptional company in the field of technology, but also in the field of economics. As a heavily loss-making company (until 2019), it has achieved very high market capitalization and brought profit to long-term equity investors. Tesla is an example of a company with a radical innovation strategy that, according to Czakon et al. [43], has remained relatively unaffected by the strong market uncertainty of recent years. The reason for the growth of Tesla’s value was not only its value orientation focused on innovation and the future, but also the application of regular “air-to-air” software upgrades. Tesla undoubtedly timed its market entry to coincide with a period of rapid technological development, when the boundaries between products and the market became more dynamic [44]. Chen et al. [45] pointed out that Tesla, more than other brands, strives for a high degree of integrity in its product architecture, thereby employing significant vertical integration. The majority owner of the company, Elon Musk, also plays an important role. According to Kozinets [46], he is a charismatic, utopian entrepreneur. However, his power, given his significant involvement in social networks, is so great that he can effectively manipulate the markets.
3. Fuzzy Approach Methodology
The fuzzy approach has its foundations in various versions of fuzzy logic, which were created by adapting the binary numerical characteristics of propositional operators to the interval ⟨0, 1⟩. Here, fuzzy logic is used as a tool for the exact handling of fuzzy sets, the theory of which was published by Zadeh [47].
3.1. Principles of Fuzzy Set Theory
Let set U be the domain of consideration or discussion, let μA: U → ⟨0, 1⟩ be the so-called membership function, and let A = {(y, µA(y)): y ∈ U} be the set of all pairs (y, µA(y)), in which the numbers 0 ≤ µA(y) ≤ 1 indicate that, for a given y ∈ U, the degree of membership of the element y to the set UA = {y: 0 < µA(y) ≤ 1, y ∈ U} ⊂ U.
It follows that A is a fuzzy subset of universe U and UA is its support. From the point of view of fuzzy logic, µA(y) is the truth value of the statement y ∈ UA. The element y ∈ U with µA(y) = 0.5 is called a crossover point in A. For values greater than 0.5, the element y rather belongs to UA, and for smaller values, it rather does not belong to it (for details see [48,49]).
3.2. Fuzzy System
The fuzzy system is shown schematically in Figure 1. It receives input data from the converter IN, which converts real values xi ∈ into internal input values ui ∈ ⟨0, 100⟩ = Ui. The internal output value vu ∈ ⟨0, 100⟩ = V is then converted into the value of yx ∈ by the output converter OUT.
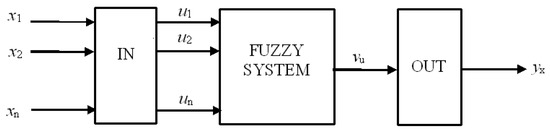
Figure 1.
Fuzzy system.
From a conventional system operating on the basis of systems of algebraic or differential equations, the fuzzy system differs in terms of its internal mechanism for the transformation of u into vu, i.e., what happens inside the “black box”, i.e., what takes place in the process of solving problems within the fuzzy approach—see Section 3.3.
3.3. Framework Description of the Functioning of the Fuzzy Mechanism of the Fuzzy System
In the fuzzy system in Figure 1, there is a scale of internal numerical values ui of universe Ui = ⟨0, 100⟩ of the input linguistic variable Ui, i = 1, 2,…, n, which is covered by three overlapping intervals at its edges by a knowledgeable expert. Each of these intervals is the support UTi of one of three different fuzzy numbers Ti ∈ {Li, Mi, Hi} = Si, as specified by the membership function μTi: Ui → ⟨0,1⟩, whose trapezoidal course is algebraically defined by the relations [50]:
The same applies to universe V = ⟨0, 100⟩ of the output linguistic variable with fuzzy numbers T ∈ {L, M, H} = S. The fuzzy numbers Li, Mi, and Hi, respectively, L, M, and H, formally represent the terms “low value”, “common value”, and “high value” of the linguistic variable i, respectively, . It therefore acquires values on two levels: on the level of the numerical values ui in universe Ui, respectively, the numerical values v in universe V, and on the level of the fuzzy numbers Ti (i.e., terms) in universe Si = {Li, Mi, Hi}, respectively, and the fuzzy numbers T in universe S = {L, M, H} [51].
A significant role In the exact description of what happens inside the “black box” is played by the binary fuzzy coincidence relation Ci = {((ui, Ti), μCi(ui, Ti)): (ui, Ti) ∈ Ui × Si}, μSi: Ui × Si → ⟨0, 1⟩ from universe Ui to universe Si of the input linguistic variable i, i = 1,2,…, n. The relational matrix of this fuzzy relationship is presented in Table 1. In it, a corresponding line is assigned to each value ui ∈ Ui, depending on which decomposition class of universe Ui it belongs to. In it, the general number μCi(ui, Ti) = μTi(ui) = |ui ∈ UTi| is written in the field below Ti, indicating the truth value of the statement “the element ui from universe Ui is an element of the support UTi of the fuzzy subset Ti on Ui”. This is interpreted as the degree of coincidence of an element from the level of the numerical values with an element from the level of the terms of the linguistic variable i. Positive values in a given row state on which fuzzy subsets Ti the singleton {(ui,1)} will be fuzzified. Table 1 (the relational matrix of the binary fuzzy relation Ci) is therefore called a fuzzification table.

Table 1.
Fuzzification table.
The fuzzification table assigns to each value ui ∈ Ui a three-element fuzzy set Si = {(Li, μLi(ui)), (Mi, μMi(ui)), (Hi, μHi(ui))}, with a one-element or two-element support. The Cartesian product = S1 × S2…× Sn then defines the n-ary fuzzy relation S as S = S1 × S2…× Sn = {((T1, T2,…, Tn), μS(T1, T2,…, Tn)): (T1, T2,…, Tn) ∈ S1 × S2…× Sn}, which is decomposable according to the components S1, S2, …, Sn with support S = {(T1, T2,…, Tn): μS(T1, T2,…, Tn) > 0, (T1, T2,…, Tn) ∈ S1 × S2…× Sn}, which, by means of projection F, whose elements (pair (((T1, T2,…, Tn), T), where T = F(T1, T2,…, Tn)), form a set of inference rules, is transferred from universe to universe S in accordance with the extension principle.
The number of elements of the n-ary fuzzy relation S and the number of inference rules corresponding to it is 3n; the number of elements of its support S, containing only those tuples of terms (T1, T2,…, Tn) ∈ S1 × S2…× Sn, with which the input vector u = (u1, u2,…, un) coincides and is therefore blurred into them, amounts to 2n−α, where α is the number of prototypical elements (i.e., components ui with μTi(ui) = 1). For example, in the case where n = 3, 3n = 27, while 1 ≤ 2n−α ≤ 8. Therefore, when applying fuzzy inference, it is not effective to take into account all inference rules, but sufficient to take into account only those whose left sides match with the elements of support S.
The process of the transformation of vector x = (x1, x2,…, xn) into yx then gradually passes through phases 1–5, as shown in Figure 2, where fuzzy inference begins with fuzzification and ends with aggregation [52]:
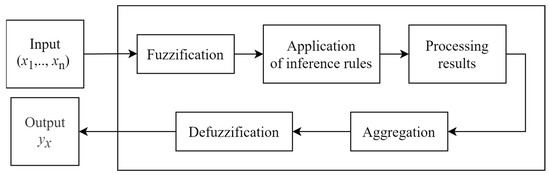
Figure 2.
Problem solving process within the framework of the fuzzy approach.
- In the fuzzification phase, the entered point values are converted into membership values for individual fuzzy sets using the membership function. The “fuzzification” block in the fuzzy system also includes the IN converter (see Figure 1), which converts real values xi ∈ into internal input values ui ∈ ⟨0, 100⟩ = Ui. By applying the relevant fuzzification tables, the input vector u = (u1, u2,…, un) is then blurred into a tuple of terms (T1, T2,…, Tn) ∈ S1 × S2…× Sn, with which it coincides, even to a small extent. The set S is then assembled from them, with each element (T1, T2,…, Tn) ∈ S being evaluated according to its degree of coincidence with vector u, which is the number min{μT1(u1),μT2(u2),…,μTn(un)}.
- In the previous stage, sharp sets of variables enter the system, which are subsequently fuzzified, i.e., converted into input fuzzy sets. The next steps include the derivation of the output fuzzy sets using an inference mechanism based on the rule base. In the “application of inference rules”, the relation F−1(T) = {(T1, T2,…, Tn): F(T1, T2,…, Tn) = T, (T1, T2,…, Tn) ∈ S}, T ∈ S, is inversed to projection F and set S is decomposed into the mutually disjoint classes F−1(L), F−1(M) and F−1(H). If any of the resulting decomposition classes are empty (F−1(T) = Ø), they are characterised by the number T = 0; otherwise (F−1(T) ≠ Ø) the characteristic number of class F−1(T) is the number T = max{min{μT1(u1), μT2(u2),…, μTn(un)}: (T1, T2,…, Tn) ∈ F−1(T)}. The number T is interpreted as the strength of the reaction T “lent” to it by vector u = (u1, u2,…, un).
- In the “result processing” phase, the fuzzy mechanism of the fuzzy system generates on V fuzzy subsets T* = {(v, µT*(v)): v ∈ V}, where μT*(v) = min{μT(v), T}, T ∈ S. These are mostly fuzzy subsets of T ∈ {L, M, H} with membership functions of μT(v), bound from above by T constants, so that μT*: V → ⟨0, T⟩. In other words, in this phase, the evaluation of the rule takes place with the determination of the values of the causes, creating the minimum result value of the entire rule.
- In the “aggregation” phase, the output values of all the activated rules for each linguistic variable are united into one fuzzy set, i.e., the fuzzy subsets L*, M*, and H* are united, resulting in a fuzzy set R = {(v, µagg(v)): v ∈ V} = L* ∪ M* ∪ H*, in which µagg(v) = max{μL*(v), μM*(v), μH*(v)}, v ∈ V.
- Finally, in the “defuzzification” phase, the fuzzy mechanism of the fuzzy system, via integration using the parts over the interval ⟨0, 100⟩, finds the values of the definite integrals ∫v · μagg(v) dv and ∫μagg(v) dv and, from them, a ratio is obtained:
This is a standard defuzzification method in the literature, referred to as the CoG (Center of Gravity) method. The defuzzification of the output consists of finding the centroid of the surface after aggregating the outputs of the rules using the previous aggregation step.
The “defuzzification” block also includes converter OUT (see Figure 1), which converts internal values v ∈ ⟨0, 100⟩ = V to external values y ∈ .
As part of setting the default parameters for a given task, a knowledgeable expert chooses the intervals ⟨xi_min, xi_max⟩, i = 1, …, n, respectively ⟨ymin, ymax⟩, in which, according to their opinion, the values of external numerical variables can occur. Therefore, for each of these variables, the expert enters the parameter xi_ref = xi_max − xi_min, respectively, yref = ymax − ymin. The following functions play key roles in the conversion of the external values of input variables (xi) and output variables (y) to internal values, with which the internal mechanism of the fuzzy system works; this happens in the IN converter:
respectively,
The inputs to the IN converter are divided into two groups: those that have a positive effect on the result from the point of view of the solved problem, and those whose effect on the result is negative. The first of them are recalculated to internal values using the formula ui = k(xi), and the second using the formula ui = 100 − k(xi). This is an application of the unary t-norm, which is an involutive negation. This approach makes it possible, in the case of having fewer than four input linguistic variables, to apply, among other things, the strategy of the predominant element in the formulation of the inference rules, whereby the expert intervenes only in necessary cases.
The conversion of the output values y from the OUT converter into internal output values v ∈ V takes place according to the formula v = k(y); in the opposite direction:
4. Data
This article aims to predict the short-term trend and share price of Tesla (TSLA) at the beginning of 2023. Methodologically, the task is solved using the fuzzy approach. The inputs to the model are the variables influencing the value of the output variable—the TSLA share price. Table 2 summarises the values of these selected variables and the output variables of the TSLA share price for the monitored period of 2016–2022. The real values at the beginning of 2023 for all the variables are presented in the last column.
The input variables of the task are the EPS (net earnings per share) indicator, whose high value indicates the attractiveness of the share, the Federal Funds Rates (FFR), which are a key tool for managing US monetary policy, the annual close stock price of the NASDAQ Composite Index (COMP), which is heavily loaded with companies in the technology sector, and the year close stock prices of the output variable TSLA (TSLA). The input data, EPS, FFR, and COMP were chosen based on their proven strong regression relationship with the development of stock prices, which has been demonstrated in a number of published works, e.g., by Boyacioglu and Avci [53] and Alenezy et al. [54].
Table 2.
Values of EPS, FFR, COMP, and TSLA in period 2016–2023.
Table 2.
Values of EPS, FFR, COMP, and TSLA in period 2016–2023.
| Year | 2016 | 2017 | 2018 | 2019 | 2020 | 2021 | 2022 |
|---|---|---|---|---|---|---|---|
| x_EPS ($) | −0.31 | −0.79 | −0.38 | −0.33 | 0.21 | 1.63 | 2.55 |
| x_FFR (%) | 0.55 | 1.33 | 2.40 | 1.55 | 0.09 | 0.07 | 4.33 |
| x_COMP ($) | 5383 | 6903 | 6635 | 8973 | 12,888 | 15,645 | 10,466 |
| Y_TSLA ($) | 14 | 21 | 22 | 28 | 235 | 352 | 123 |
Source: [55,56].
The data were collected through the Macrotrends and Yahoo! Finance databases [57,58] based on annual closing prices. The measurement units of the variables correspond to their nature—the EPS, COMP, and TSLA are expressed in nominal US dollars and the FFR in percentage rate. The annual closing prices of the COMP and TSLA are the market prices traded at the end of December of the year in question.
From the development of the EPS, FFR, COMP, and TSLA variables, one can see a turning point in 2019/2020. The EPS indicator changed from negative to positive, with its value continuing to grow over time. The FFR rate fell by 94% from 2019 to 2020, followed by a sharp increase in 2022 (the FFR increased 48 times from 2020–2022). The COMP share price increased by almost 43% in 2019/2020, which was the smallest increase over the entire period under review. The change in the TSLA share price during the breakthrough period was enormous—the 739% increase was the highest in the entire period under review; from 2020, as in the case of the COMP share price, the continuous phase of growth ended.
The specifics of the breakthrough period of 2019/2020 are considered in the subsequent fuzzy analysis. The short-term trend and TSLA share price predictions for early 2023 (31st January 2023) are based on a range of input variable values for the period of 2020–2022—see Table 2. The data used and their frequency corresponds to the desired range of data carrying the necessary information. A longer range of data would bias the prediction. The nature of the task (the prediction of the price of a volatile title and high market uncertainty) allows for the share price prediction to be realized only in the short term—a maximum within 1 month from the last detected share price.
5. Construction of the Fuzzy Prediction Model
The formulation of the fuzzy model for the prediction of the next member of the time series of the TSLA share price is specific and based on the fact that we know the number of the previous members of the resulting series of this linguistic variable—see Table 2, respectively, Table 3. From them, it is possible to estimate in which phase of its development (decline, growth, and stagnation) that the price of the share is now. Furthermore, we know the historical series of the basal values of the linguistic variables, upon which the price of the share broadly and vaguely depends. This dependence is mainly reflected in the values of the extreme limits in which we look for the result of the prediction.
Table 3.
Conversion of basal input data of Table 2 relevant to the historical period 2020–2022 into dimensionless data according to (3) and (4).
The opinion of the expert plays an important role in the construction of fuzzy prediction models. When formulating the framework for a model, they must consider their experiences and expectations, intervening in the structure of the model when it comes to the definition of the inference rules and the course of the functions of the linguistic variables, accordingly.
In terms of the specified model, if positive and high EPS values are expected, which therefore make the stock more attractive, the expert predicts a rise in the stock price in the next period. In contrast, a rise in FFR interest rates is expected to have the opposite effect; the reason being the inverse relationship between the required interest income, the amount of which is determined by the interest rate, and the share price. If interest rates are lowered (and nothing else changes), stock prices theoretically rise, and vice versa. Due to the importance of technology companies, the expected price development of the COMP index can also be projected into the development of the TSLA share price in the same direction—a positive correlation is assumed.
6. Results: Fuzzy Prediction for TSLA Share PRICE and Short-Term Trend for Beginning of 2023
This model works with the dimensionless input variables uEPS, uFFR, and uCOMP of the UEPS, UFFR, and UCOMP universes, respectively, with the dimensionless output variable y of the YTSLA universe on the interval ⟨0, 100⟩. The conversion of the basic values of the linguistic variable quantities xEPS, xFFR, and xCOMP to an interval is mediated by converting them according to relationship (3), where xmax is the highest value of x, and, respectively, xmin is the lowest value of x statistically recorded in the period of 2020–2022 (see Table 3).The output linguistic variable Y is the TSLA share price in the year immediately following the historically known period. The transformation of the basal output variable xTSLA of the YTSLA universe of the output linguistic variable y to the dimensionless value y ∈ YTSLA = ⟨0, 100⟩, where YTSLA is marked as Y in the graphs, is given by relationship (4), where ymax is the highest value of y, and, respectively, ymin is the lowest value of y statistically recorded in the period of 2020–2022. The conversion in the opposite direction—the recalculation of the dimensionless output variable to the output linguistic variable xTSLA—is performed using (5).
The progress of YTSLA (see Table 2) in the years of 2016–2022 shows an upward trend—the TSLA share price increased almost 20 times. However, due to the expected recession in the USA, accompanied by the expected increase in basic interest rates, it is possible to consider a stagnation of the TSLA share price for the year 2023. This consideration is compensated by the expected positive development of the EPS. Nothing definite can be said about the expected development of the price of the COMP index based on the historical data in relation to the future TSLA share price.
The formulation of the prediction fuzzy model for the beginning of 2023 is based on the numerical characteristics of the period 2020–2022 and assumptions about the development of variables that have an impact on the TSLA share price.
From the last column in Table 3, the triple (100, 0, 0) ∈ UEPS × UFFR × UCOMP is created. Due to the external and internal uncertainty of the model, points a, b, c, and d of the interval ⟨0, 100⟩ are evenly distributed, i.e., a = 20, b = 40, c = 60, and d = 80. The course of the membership functions of all the converted variables (input and output) over the set of the universe Y values of the output linguistic variable (Y_TSLA) are identical (see Figure 3).
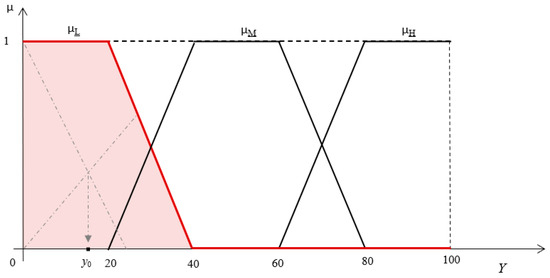
Figure 3.
Courses of the membership functions with even distribution of points a = 20, b = 40, c = 60 and d = 80 within the interval values y ∈ Y = ⟨0, 100⟩ and the course of the membership function µAGG. The value y0 is the dimensionless output of the linguistic variable (Y_TSLA).
The fuzzification table (see Table 4) applies to i = EPS, FFR, COMP. The contents are the values of the membership functions µAi(ui), where A ∈ {L, M, H} are derived from the aforementioned equations and inequalities (see (1)).
Table 4.
Fuzzification table valid for i = EPS, FFR, COMP (see Table 1).
Only non-zero elements are considered in the fuzzification table. With its help, set X = {(HEPS, 1), (LFFR, 1), (LCOMP, 1)} is created from the input data vector (100, 0, 0) ∈ UEPS × UFFR × UCOMP. The three-element set LF = {(H, L, L)} is created from its three elements. The triplet (H, L, L) of the input fuzzy sets from mapping F assigns the output fuzzy set L based on the strategy of the prevailing element of the rule, whereby µAGG(y) = µL(y) applies (see µAGG function (in red) in Figure 3).
For the dimensionless variable, y0 applies (see relationship (2)):
LL, which presents a point in the body of the coloured figure under the curve highlighted in red, where the total weight of the body may be thought to be concentrated.
The internal dimensionless output value y0 ∈ ⟨0, 100⟩ = V is then converted into the external value yx ∈ by the output converter OUT. Thus, for the predicted basal value x0 of the xY_TSLA variable at the beginning of 2023 (31st January), it applies (see (5)):
x0 ~ 123 + 15.55·(352 – 123)/100 = $159.
The result of the fuzzy model depends significantly on the experience and expectations of the expert. This was reflected in the model by the expert in terms of the definition of the inference rules and the progressions of the membership functions of the linguistic variables. In our case:
- The expert chose the frequency and data range of the input and output variables. The expert’s rationale was: the frequency of the annual closing prices of a three-year historically known period sufficiently determines the price shift in the subsequent short-term horizon of 1–12 months; the choice of a longer period for analysis is inadequate, given the landmark development of the input and output variables, both recent and current.
- The expert chose a uniform distribution of points a, b, c, and d on the interval of the values y ∈ Y = ⟨0, 100⟩ by which they defined the progressions of the membership functions for all the variables. The expert’s rationale was: the courses of the membership functions defined in this way correspond to the state of the highest degree of uncertainty, which corresponds to the situation of uncertainty regarding the future decisions of the FED, the development of the economy, the marketing behaviour of TSLA, and the public engagement of the owner, Elon Musk.
- The expert chose to select the prevailing element rule. The expert’s rationale was: the choice of the prevailing element is the choice of a rational decision maker with a neutral attitude to risk.
The resulting fuzzy prediction for the value of the TSLA share price at the beginning of 2023 came in at 159 USD (31st January), with a clear upward trend compared to the last recorded value at the end of December 2022 (123 USD). The real TSLA share price on 31 January 2023 was 173 USD (Yahoo! Finance [56])—see Figure 4.
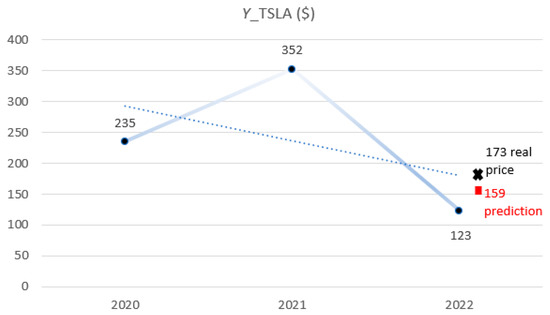
Figure 4.
Evolution of annual closing prices of TSLA (solid line) relevant to fuzzy prediction including regression price trend (dotted line), short-term fuzzy prediction (■) versus actual closing price of TSLA on 31 January 2023 (×).
The difference between the growth rate of the actual and fuzzy predicted price is a consequence of the experts’ limited information and the imprecise assumptions they made when setting up the model.
7. Discussion: Functioning of Fuzzy Neural Network and Fuzzy System in the Field of Time Series Value Prediction
The fuzzy system presented here differs from the predictive fuzzy neural network in many ways. The fuzzy system is based on Kahneman’s allegorical model of the functioning of the human mind, which deals with the cognitive processes taking place on a macro level within two cooperating subsystems, S1 and S2, as represented by the conscious and subconscious components of thinking [59]. Just as system S1 classifies particulars into vaguely defined content of intuitive concepts, which it retrieves based on the input stimulus through a mental process called “free-floating of associations” by cognitive scientists (see Thagard [60]), the fuzzy mechanism of the fuzzy system, through the “fuzzification” phase, “blurs” the vector u = (u1, u2,..., un) into n-tuples (T1, T2,..., Tn) of the fuzzy subsets of the support S, with which it coincides, and classifies “particulars” into the framework of the relevant terms that the vector u “resembles”. Just as system S2, based on a rational analysis of what is presented by S1, arrives at appropriate conclusions, the fuzzy mechanism of the fuzzy system, during the subsequent four phases of the solving process, according to Figure 2, identifies an adequate resulting reaction yx to the arising situation described by the vector x = (x1, x2,..., xn).
What a fuzzy neural network has in common with a fuzzy system in the field of time series value prediction is the training set [61], even though the elements are worked with differently in each of them. In our training set, the four time series values of the variables EPS, FFR, COMP, and TSLA, entered in the unshaded part of Table 2, play a crucial role. Here, similar to fuzzy neural networks, each column of values can be viewed as a time-indexed element ((EPS, FFR, and COMP), TSLA) within a seven-element “training set”, in which the triplet (EPS, FFR, and COMP) is the input and TSLA is the desired output. This seven-element set is then reduced to a three-element set (columns for the years 2020, 2021, and 2022—see Table 3) for the reasons justified above, from which the value in the last column (Y_TSLA) in Table 2 should be derived.
In a fuzzy neural network with a teacher, the teacher inserts, on the input side of the neural network, the EPS, FFR, and COMP values of the given element ((EPS, FFR, and COMP) TSLA) of the aforementioned three-element training set, with the network reacting to this with some output. Then, according to the instructions of the learning fuzzy backpropagation algorithm, the teacher changes the weights of the synaptic connections in the network, bringing its output closer to the desired TSLA value (bottom row and last column of Table 2). The same is repeated with the next element of the training set, over and over again, until a situation occurs where the fuzzy learning algorithm no longer requires any change in its weights. This ends the learning process. As a result, the network is optimally set and ready to search for the correct TSLA values, even for other triplets of the EPS, FFR, and COMP values that it did not encounter in the training set.
In the fuzzy system presented here, the analogy of a fuzzy neural network with a teacher is the fuzzy mechanism described in Section 3, with the role of the teacher played by the solver/expert. They, like the teacher in the previous case, inserted, on the input side of the fuzzy system, the three values of the EPS, FFR, and COMP of the element ((EPS, FFR, and COMP), TSLA), with the fuzzy system subsequently “giving” them the answer through its output. Here, instead of changing the weights of the synapses in the network, the solver/expert changed parameters a, b, c, and d in the numerical universe of the output linguistic variable (see Figure 3), thereby changing its terms (i.e., the supports and cores of the respective fuzzy sets) in order to bring the output of the fuzzy system closer in line with the desired TSLA value, or changing the setting of the inference rules. However, unlike the fuzzy neural network teacher, the solver/expert with a fuzzy system did not have any learning algorithm at their disposal that advised them how to change parameters a, b, c, and d, or how to reset the inference rules. Their decisions were based on attempts, such as successes, errors, or iterative methods, to help them get as close as possible to the desired TSLA value. They did the same with each element of the training set and went through it so many times that the outputs from the fuzzy system for all three elements of the training set stabilised at values close to the desired TSLA values. As in the case of backpropagation, the convergence of this procedure cannot be proven in general. However, practice shows that it works.
If we compare a fuzzy system and a fuzzy neural network from the point of view of their applicability and effectiveness in the field of solving the problems of predicting time series values, we come to the conclusion that a fuzzy neural network, implementing a semi-parallel computing process, reacts to input data by producing outputs much faster than a fuzzy system implementing a disproportionately more complex sequential computing process [62]. Fuzzy neural network learning is also more user friendly. The fuzzy neural network teacher does not have to think too much and acts completely mechanically. A fuzzy learning algorithm tells them what to do [63]. In contrast, the fuzzy system teacher has no proven learning algorithm at their disposal and must think about what they will do in the learning process. However, if they are sufficiently knowledgeable and experienced, they have a chance to achieve a higher convergence speed of the learning process than a fuzzy neural network.
The limitations of the proposed fuzzy system are derived from the limitations of the fuzzy logic that are mainly based on the limited information available to the expert and their possible ignorance or inexperience, which are circumstances that are interrelated. Specifically, the disadvantages of using fuzzy logic to solve problems include (a) its complexity (while fuzzy logic systems are generally simpler than other AI systems, they can still be quite complex), (b) its lack of accuracy (fuzzy logic systems may not be suitable for applications that require a very high level of accuracy), and (c) the difficulty in refining the system (it can be difficult to debug fuzzy logic systems because it is not always clear how the system has arrived at a particular result)—see [64]. To overcome this to some extent, the model in its future form may include a suitable intelligent agent to assist with expert reasoning.
Among other alternative approaches to stock price prediction that share the commonality of deriving the information base for price prediction from sources other than the historical series of realized prices, there is BERT-LSTM, for example, which extracts informative features regarding the direction of stock price movements from news on Twitter, using a natural language processing (NLP) model called BERT [65]. Selected tweets from Twitter were included for prediction in Velu et al. [66]. In order to obtain attributes for prediction, the study employed an approach to a sentiment analysis that combined psychological labelling and valence rating, representing the strength of emotional expression. Worth mentioning is the analysis by Bhadkamar and Bhattachary [67], who examined the relationship between Elon Musk’s tweets and the value of Tesla’s stock. A data analysis was used as the primary method to discern patterns within the preprocessed dataset, which had all stop words removed. The combination of methodologies and elements yielded a conclusion that an increase in the number of tweets/interactions corresponded to an increase in Tesla’s closing price, and conversely.
These predictive approaches combine different methods; the fuzzy system presented here is a unique model based on fuzzy logic. They share the commonality that the prediction results are unequivocally supported by underlying drivers of the researched subject, which ultimately leads to a higher accuracy in estimation compared to approaches that rely purely on a historical time series analysis. These methods are based on statistical inference and require the correct selection of a model, which incorporates knowledge about the system. The fuzzy approach requires us to choose a predictive algorithm based on its empirical capabilities. The justification of the inference model typically relies on whether we feel if it adequately captures the essence of the system [68].
8. Conclusions
Investors and analysts use a number of models to predict stock market trends and future share prices. Modern approaches make it possible to solve problems in which uncertainty is involved, which is typical for stock markets. Fuzzy logic enables this to some extent, especially in relation to uncertain problems linked to insufficient knowledge. By combining methods that implement learning paradigms with methods based on fuzzy logic, predictive fuzzy neural networks have been created, which were discussed in the introduction.
The purpose of this article was to present the predictive capabilities of a tool for multi-criteria evaluation, a so-called fuzzy system, operating on the basis of a non-fuzzy neural approach, but also one that was capable of implementing a learning paradigm and working with vague concepts. The principle behind the fuzzy system was the transformation of input data by the IN converter, which converted real external input values into internal input values in the interval of 0–100. The internal output value for the given interval was then converted by the output converter OUT into an external output value, which was the result of the process of what happened inside the “black box” of the fuzzy system, i.e., what took place in the process of solving problems within the fuzzy approach, i.e., the algorithm described in steps 1 to 5. The formulation of the fuzzy model for predicting the next member of the time series was based on the knowledge of a number of previous members of the target variable, a historical series of variable values upon which the target variable depended, and on the opinion and experience of the solver/expert. When formulating the model, the solver/expert took into account their expectations by setting inference rules and defining the course of the functions of the linguistic variables.
The task of predicting the short-term trend of Tesla share price development was solved by applying a fuzzy system. An upward trend was identified with an early 2023 price estimate of 159 USD (31st January); the actual closing price of the end of January 2023 was 173 USD, a difference of 14 USD.
The difference between the rate of growth of the actual price and the price predicted by the fuzzy system was a consequence of the limited knowledge of the solver/expert and the assumptions they used when constructing the model. A fuzzy system is an analogy of a fuzzy neural network with a teacher, whereby the role of the teacher is played by the solver/expert. They place influencing variables on the inputs of the fuzzy system, which subsequently “gives” them the answer in the form of output. The learning of the system is achieved by changing parameters a, b, c, and d in the numerical universe of the linguistic variables, thereby changing their terms in order to bring the output of the fuzzy system closer in line with the desired value, or changing the setting of the inference rules. Unlike the fuzzy neural network teacher, the solver/expert with a fuzzy system does not have any learning algorithm available to them to advise them how to change parameters a, b, c, and d, or how to reset the inference rules.
In terms of its applicability and effectiveness in solving prediction problems, a fuzzy neural network reacts to input data by producing outputs faster than a fuzzy system, which implements a more complex sequential calculation process, and is more “user friendly”. The fuzzy neural network teacher works completely mechanically and follows a fuzzy learning algorithm. In contrast, the fuzzy system teacher has no proven learning algorithm at their disposal and has to think about what they will do in the learning process. However, if they are sufficiently knowledgeable and experienced, they have a chance to achieve a higher convergence speed of the learning process than a fuzzy neural network.
The above shows that the presented fuzzy system can be an alternative to fuzzy neural networks from the point of view of prediction, and that it has real capabilities to predict short-term development trends.
The perspective of the author’s fuzzy system is in translating the generally described fuzzy system into the set of algorithms of the fuzzy process in order to design a “fuzzy calculator”, a programming language of a software that will significantly speed up and facilitate the process of multi-criteria evaluation and prediction. The fuzzy calculator will then be tested in order to verify the basic hypotheses and assumptions regarding its practical applicability to the stock market data of publicly traded companies for the purpose of prediction and to the companies´ accounting statements for the purpose of multi-criteria decision making.
Author Contributions
Conceptualization, S.H. and P.Š.; methodology, S.H. and P.Š; formal analysis, S.H.; investigation, R.K.; resources, R.K.; data curation, R.K.; writing—original draft preparation, S.H.; writing—review and editing, S.H. and P.Š.; visualization, R.K.; supervision, S.H.; project administration, S.H.; funding acquisition, S.H. All authors have read and agreed to the published version of the manuscript.
Funding
This research was funded by Grant No. IVSUZO2302, School of Expertness and Valuation, Institute of Technology and Business in Ceske Budejovice.
Data Availability Statement
Macrotrends Federal Funds Rate—62 Year Historical Chart. 2023. Available online: https://www.macrotrends.net/2015/fed-funds-rate-historical-chart. Yahoo!Finance Tesla, Inc. (TSLA). 2023. Available online: https://finance.yahoo.com/quote/TSLA/history/. Macrotrends NASDAQ Composite—45 Year Historical Chart. 2023. Available online: https://www.macrotrends.net/1320/nasdaq-historical-chart. Macrotrends Tesla EPS—Earnings per Share 2010–2022|TSLA. 2023. Available online: https://www.macrotrends.net/stocks/charts/TSLA/tesla/eps-earnings-per-share-diluted.
Conflicts of Interest
The authors declare no conflict of interest. The funders had no role in the design of the study; in the collection, analyses, or interpretation of data; in the writing of the manuscript; or in the decision to publish the results.
References
- Stefko, R.; Heckova, J.; Gavurova, B.; Valentiny, T.; Chapcakova, A.; Kascakova, D.R. An analysis of the impact of economic context of selected determinants of cross-border mergers and acquisitions in the EU. Econ. Res.-Ekon. Istraživanja 2022, 35, 6385–6402. [Google Scholar] [CrossRef]
- Ng’ang’a, F.W.; Oleche, M. Modelling and Forecasting of Crude Oil Price Volatility Comparative Analysis of Volatility Models. J. Financ. Risk Manag. 2022, 11, 154–187. [Google Scholar] [CrossRef]
- Chu, J.; Chan, S.; Nadarajah, S.; Osterrieder, J. GARCH modelling of cryptocurrencies. J. Risk Financ. Manag. 2017, 10, 17. [Google Scholar] [CrossRef]
- Debnath, P.; Srivastava, H.M. Optimal Returns in Indian Stock Market during Global Pandemic: A Comparative Study. J. Risk Financ. Manag. 2021, 14, 592. [Google Scholar] [CrossRef]
- Nikou, M.; Mansourfar, G.; Bagherzadeh, J. Stock price prediction using DEEP learning algorithm and its comparison with machine learning algorithms. Intell. Syst. Account. Financ. Manag. 2019, 26, 164–174. [Google Scholar] [CrossRef]
- Vochozka, M.; Horák, J.; Šuleř, P. Equalizing seasonal time series using artificial neural networks in predicting the Euro–Yuan exchange rate. J. Risk Financ. Manag. 2019, 12, 76. [Google Scholar] [CrossRef]
- Castillo, O.; Melin, P. Forecasting of COVID-19 time series for countries in the world based on a hybrid approach combining the fractal dimension and fuzzy logic. Chaos Solitons Fractals 2020, 140, 110242. [Google Scholar] [CrossRef]
- Polishchuk, V.; Kelemen, M.; Gavurová, B.; Varotsos, C.; Andoga, R.; Gera, M.; Christodoulakis, J.; Soušek, R.; Kozuba, J.; Blišťan, P.; et al. A Fuzzy Model of Risk Assessment for Environmental Start-Up Projects in the Air Transport Sector. Int. J. Environ. Res. Public Health 2019, 16, 3573. [Google Scholar] [CrossRef]
- Wang, H.-F.; Tsaur, R.-C. Insight of a fuzzy regression model. Fuzzy Sets Syst. 2000, 112, 355–369. [Google Scholar] [CrossRef]
- Tsaur, R.C. A fuzzy time series-Markov chain model with an application to forecast the exchange rate between the Taiwan and US dollar. Int. J. Innov. Comput. Inf. Control. 2012, 8, 4931–4942. [Google Scholar]
- Souza, P.V.D.C. Fuzzy neural networks and neuro-fuzzy networks: A review the main techniques and applications used in the literature. Appl. Soft Comput. 2020, 92, 106275. [Google Scholar] [CrossRef]
- Wang, G.; Zhang, Y.; Ye, X.; Mou, X. Machine Learning for Tomographic Imaging; IOP Publishing: Bristol, UK, 2019. [Google Scholar] [CrossRef]
- Khuat, T.T.; Le, M.H. An Application of Artificial Neural Networks and Fuzzy Logic on the Stock Price Prediction Problem. JOIV: Int. J. Inform. Vis. 2017, 1, 40–49. [Google Scholar] [CrossRef]
- Kulkarni, A.; Kulkarni, N. Fuzzy Neural Network for Pattern Classification. Procedia Comput. Sci. 2020, 167, 2606–2616. [Google Scholar] [CrossRef]
- Kumar, G.; Jain, S.; Singh, U.P. Stock Market Forecasting Using Computational Intelligence: A Survey. Arch. Comput. Methods Eng. 2020, 28, 1069–1101. [Google Scholar] [CrossRef]
- Hašková, S.; Šuleř, P.; Krulický, T. Advantages of fuzzy approach compared to probabilistic approach in project evaluation. Entrep. Sustain. Issues 2021, 9, 446–456. [Google Scholar] [CrossRef]
- Cheng, S.-H.; Chen, S.-M.; Jian, W.-S. Fuzzy time series forecasting based on fuzzy logical relationships and similarity measures. Inf. Sci. 2016, 327, 272–287. [Google Scholar] [CrossRef]
- Zhang, R.; Ashuri, B.; Deng, Y. A novel method for forecasting time series based on fuzzy logic and visibility graph. Adv. Data Anal. Classif. 2017, 11, 759–783. [Google Scholar] [CrossRef]
- Moshkin, V.; Kurilo, D.; Yarushkina, N. Integration of Fuzzy Ontologies and Neural Networks in the Detection of Time Series Anomalies. Mathematics 2023, 11, 1204. [Google Scholar] [CrossRef]
- Maciel, L.; Ballini, R. Functional Fuzzy Rule-Based Modeling for Interval-Valued Data: An Empirical Application for Exchange Rates Forecasting. Comput. Econ. 2020, 57, 743–771. [Google Scholar] [CrossRef]
- Gündoğdu, F.K.; Kahraman, C. A novel spherical fuzzy analytic hierarchy process and its renewable energy application. Soft Comput. 2019, 24, 4607–4621. [Google Scholar] [CrossRef]
- Ben Jabeur, S.; Hassine, R.B.; Mefteh-Wali, S. Firm financial performance during the financial crisis: A French case study. Int. J. Financ. Econ. 2020, 26, 2800–2812. [Google Scholar] [CrossRef]
- Song, Y.; Liu, T.; Liang, D.; Li, Y.; Song, X. A Fuzzy Stochastic Model for Carbon Price Prediction Under the Effect of Demand-related Policy in China’s Carbon Market. Ecol. Econ. 2018, 157, 253–265. [Google Scholar] [CrossRef]
- Hašková, S. Analysis of Prediction of Current Profit and Interval Fuzzy Profit in the Case of Subsidized Projects. In Proceedings of the 13th International Days of Statistics and Economics, Prague, Czech Republic, 5–7 September 2019. [Google Scholar] [CrossRef]
- Taliento, M. Corporate Valuation: Looking Beyond the Forecast Period Through New “Fuzzy Lenses”. IEEE Trans. Eng. Manag. 2019, 68, 467–482. [Google Scholar] [CrossRef]
- Lo, F.-Y.; Wong, W.-K.; Geovani, J. Optimal combinations of factors influencing the sustainability of Taiwanese firms. Int. J. Emerg. Mark. 2021, 16, 909–928. [Google Scholar] [CrossRef]
- Shao, J.; Liang, C.; Liu, Y.; Xu, J.; Zhao, S. Relief demand forecasting based on intuitionistic fuzzy case-based reasoning. Socio-Econ. Plan. Sci. 2020, 74, 100932. [Google Scholar] [CrossRef]
- Bayram, M.; Akat, M. Market-neutral trading with fuzzy inference, a new method for the pairs trading strategy. Eng. Econ. 2019, 30, 411–421. [Google Scholar] [CrossRef]
- Wu, H.; Long, H.; Wang, Y.; Wang, Y. Stock index forecasting: A new fuzzy time series forecasting method. J. Forecast. 2020, 40, 653–666. [Google Scholar] [CrossRef]
- Chourmouziadis, K.; Chourmouziadou, D.K.; Chatzoglou, P.D. Embedding Four Medium-Term Technical Indicators to an Intelligent Stock Trading Fuzzy System for Predicting: A Portfolio Management Approach. Comput. Econ. 2020, 57, 1183–1216. [Google Scholar] [CrossRef]
- Mohamed, E.A.; Ahmed, I.E.; Mehdi, R.; Hussain, H. Impact of corporate performance on stock price predictions in the UAE markets: Neuro-fuzzy model. Intell. Syst. Account. Financ. Manag. 2021, 28, 52–71. [Google Scholar] [CrossRef]
- Chang, P.-C.; Liu, C.-H. A TSK type fuzzy rule based system for stock price prediction. Expert Syst. Appl. 2008, 34, 135–144. [Google Scholar] [CrossRef]
- Liu, C.-F.; Yeh, C.-Y.; Lee, S.-J. Application of type-2 neuro-fuzzy modeling in stock price prediction. Appl. Soft Comput. 2012, 12, 1348–1358. [Google Scholar] [CrossRef]
- Xie, C.; Rajan, D.; Chai, Q. An interpretable Neural Fuzzy Hammerstein-Wiener network for stock price prediction. Inf. Sci. 2021, 577, 324–335. [Google Scholar] [CrossRef]
- Nasiri, H.; Ebadzadeh, M.M. MFRFNN: Multi-Functional Recurrent Fuzzy Neural Network for Chaotic Time Series Prediction. Neurocomputing 2022, 507, 292–310. [Google Scholar] [CrossRef]
- Kumar, A.; Sharma, A. Systematic literature review of fuzzy logic based text summarization. Iran. J. Fuzzy Syst. 2019, 16, 45–59. [Google Scholar] [CrossRef]
- Talpur, N.; Abdulkadir, S.J.; Alhussian, H.; Hasan, H.; Aziz, N.; Bamhdi, A. A comprehensive review of deep neuro-fuzzy system architectures and their optimization methods. Neural Comput. Appl. 2022, 34, 1837–1875. [Google Scholar] [CrossRef]
- Kar, S.; Das, S.; Ghosh, P.K. Applications of neuro fuzzy systems: A brief review and future outline. Appl. Soft Comput. 2014, 15, 243–259. [Google Scholar] [CrossRef]
- Agrawal, S.C. Deep learning based non-linear regression for Stock Prediction. In IOP Conference Series: Materials Science and Engineering; IOP Publishing: Bristol, UK, 2021; Volume 1116, p. 012189. [Google Scholar]
- Barapatre, O.; Tete, E.; Sahu, C.L.; Kumar, D.; Kshatriya, H. Stock price prediction using artificial neural network. Int. J. Adv. Res. Ideas Innov. Technol. 2018, 4, 916–922. [Google Scholar]
- Aldhyani, T.H.H.; Alzahrani, A. Framework for Predicting and Modeling Stock Market Prices Based on Deep Learning Algorithms. Electronics 2022, 11, 3149. [Google Scholar] [CrossRef]
- Alkhatib, K.; Khazaleh, H.; Alkhazaleh, H.A.; Alsoud, A.R.; Abualigah, L. A New Stock Price Forecasting Method Using Active Deep Learning Approach. J. Open Innov. Technol. Mark. Complex. 2022, 8, 96. [Google Scholar] [CrossRef]
- Czakon, W.; Niemand, T.; Gast, J.; Kraus, S.; Frühstück, L. Designing coopetition for radical innovation: An experimental study of managers’ preferences for developing self-driving electric cars. Technol. Forecast. Soc. Chang. 2020, 155, 119992. [Google Scholar] [CrossRef]
- Yang, Y.; Zhang, K.; Kannan, P. Identifying Market Structure: A Deep Network Representation Learning of Social Engagement. J. Mark. 2021, 86, 37–56. [Google Scholar] [CrossRef]
- Chen, Y.; Chowdhury, S.D.; Donada, C. Mirroring hypothesis and integrality: Evidence from Tesla Motors. J. Eng. Technol. Manag. 2019, 54, 41–55. [Google Scholar] [CrossRef]
- Kozinets, R.V. YouTube utopianism: Social media profanation and the clicktivism of capitalist critique. J. Bus. Res. 2019, 98, 65–81. [Google Scholar] [CrossRef]
- Zadeh, L.A. Fuzzy sets. Inf. Control. 1965, 8, 338–353. [Google Scholar] [CrossRef]
- Novák, V.; Perfilieva, I.; Mockor, J. Mathematical Principles of Fuzzy Logic; Springer Science & Business Media: Berlin/Heidelberg, Germany, 2012; Volume 517. [Google Scholar]
- Běhounek, L.; Cintula, P. Fuzzy class theory. Fuzzy Sets Syst. 2005, 154, 34–55. [Google Scholar] [CrossRef]
- Hašková, S.; Fiala, P. A fuzzy approach for the estimation of foreign investment risk based on values of rating indices. Risk Manag. 2019, 21, 183–199. [Google Scholar] [CrossRef]
- Bai, Y.; Wang, D. Fundamentals of Fuzzy Logic Control—Fuzzy Sets, Fuzzy Rules and Defuzzifications. In Advances in Industrial Control; Springer: London, UK, 2006; pp. 17–36. [Google Scholar] [CrossRef]
- Shen, Q.; Chouchoulas, A. A rough-fuzzy approach for generating classification rules. Pattern Recognit. 2002, 35, 2425–2438. [Google Scholar] [CrossRef]
- Boyacioglu, M.A.; Avci, D. An Adaptive Network-Based Fuzzy Inference System (ANFIS) for the prediction of stock market return: The case of the Istanbul Stock Exchange. Expert Syst. Appl. 2010, 37, 7908–7912. [Google Scholar] [CrossRef]
- Alenezy, A.H.; Ismail, M.T.; Al Wadi, S.; Tahir, M.; Hamadneh, N.N.; Jaber, J.J.; Khan, W.A. Forecasting Stock Market Volatility Using Hybrid of Adaptive Network of Fuzzy Inference System and Wavelet Functions. J. Math. 2021, 2021, 9954341. [Google Scholar] [CrossRef]
- Macrotrends Federal Funds Rate—62 Year Historical Chart. 2023. Available online: https://www.macrotrends.net/2015/fed-funds-rate-historical-chart (accessed on 10 December 2022).
- Yahoo!Finance Tesla, Inc. (TSLA). 2023. Available online: https://finance.yahoo.com/quote/TSLA/history/ (accessed on 5 February 2023).
- Macrotrends NASDAQ Composite—45 Year Historical Chart. 2023. Available online: https://www.macrotrends.net/1320/nasdaq-historical-chart (accessed on 10 December 2022).
- Macrotrends Tesla EPS—Earnings per Share 2010–2022|TSLA. 2023. Available online: https://www.macrotrends.net/stocks/charts/TSLA/tesla/eps-earnings-per-share-diluted (accessed on 10 December 2022).
- Kannengiesser, U.; Gero, J.S. Empirical evidence for Kahneman’s System 1 and System 2 thinking in design. Hum. Behav. Design. 2019, 89–100. [Google Scholar] [CrossRef]
- Thagard, P. Mind: Introduction to Cognitive Science; MIT Press: Cambridge, MA, USA, 2005. [Google Scholar]
- Vimal, K.; Vinodh, S. Application of artificial neural network for fuzzy logic based leanness assessment. J. Manuf. Technol. Manag. 2013, 24, 274–292. [Google Scholar] [CrossRef]
- Nguyen, H.T.; Sugeno, M. (Eds.) Fuzzy Systems: Modeling and Control; Springer Science & Business Media: Berlin/Heidelberg, Germany, 2012; Volume 2. [Google Scholar]
- Shihabudheen, K.; Pillai, G. Recent advances in neuro-fuzzy system: A survey. Knowl.-Based Syst. 2018, 152, 136–162. [Google Scholar] [CrossRef]
- Mittal, K.; Jain, A.; Vaisla, K.S.; Castillo, O.; Kacprzyk, J. A comprehensive review on type 2 fuzzy logic applications: Past, present and future. Eng. Appl. Artif. Intell. 2020, 95, 103916. [Google Scholar] [CrossRef]
- Dong, Y.; Yan, D.; Almudaifer, A.I.; Yan, S.; Jiang, Z.; Zhou, Y. Belt: A pipeline for stock price prediction using news. In Proceedings of the 2020 IEEE International Conference on Big Data, Online, 10–13 December 2020; pp. 1137–1146. [Google Scholar]
- Velu, S.R.; Ravi, V.; Tabianan, K. Multi-Lexicon Classification and Valence-Based Sentiment Analysis as Features for Deep Neural Stock Price Prediction. Sci 2023, 5, 8. [Google Scholar] [CrossRef]
- Bhadkamar, A.; Bhattacharya, S. Tesla Inc. Stock Prediction using Sentiment Analysis. Australas. Account. Bus. Financ. J. 2022, 16, 52–66. [Google Scholar] [CrossRef]
- Ij, H. Statistics versus machine learning. Nat. Methods 2018, 15, 233. [Google Scholar]


Disclaimer/Publisher’s Note: The statements, opinions and data contained in all publications are solely those of the individual author(s) and contributor(s) and not of MDPI and/or the editor(s). MDPI and/or the editor(s) disclaim responsibility for any injury to people or property resulting from any ideas, methods, instructions or products referred to in the content. |
© 2023 by the authors. Licensee MDPI, Basel, Switzerland. This article is an open access article distributed under the terms and conditions of the Creative Commons Attribution (CC BY) license (https://creativecommons.org/licenses/by/4.0/).