

The Impact of Sentiment Indices on the Stock Exchange—The Connections between Quantitative Sentiment Indicators, Technical Analysis, and Stock Market

 , ,
, ,
Abstract
:1. Introduction
2. Literature Review
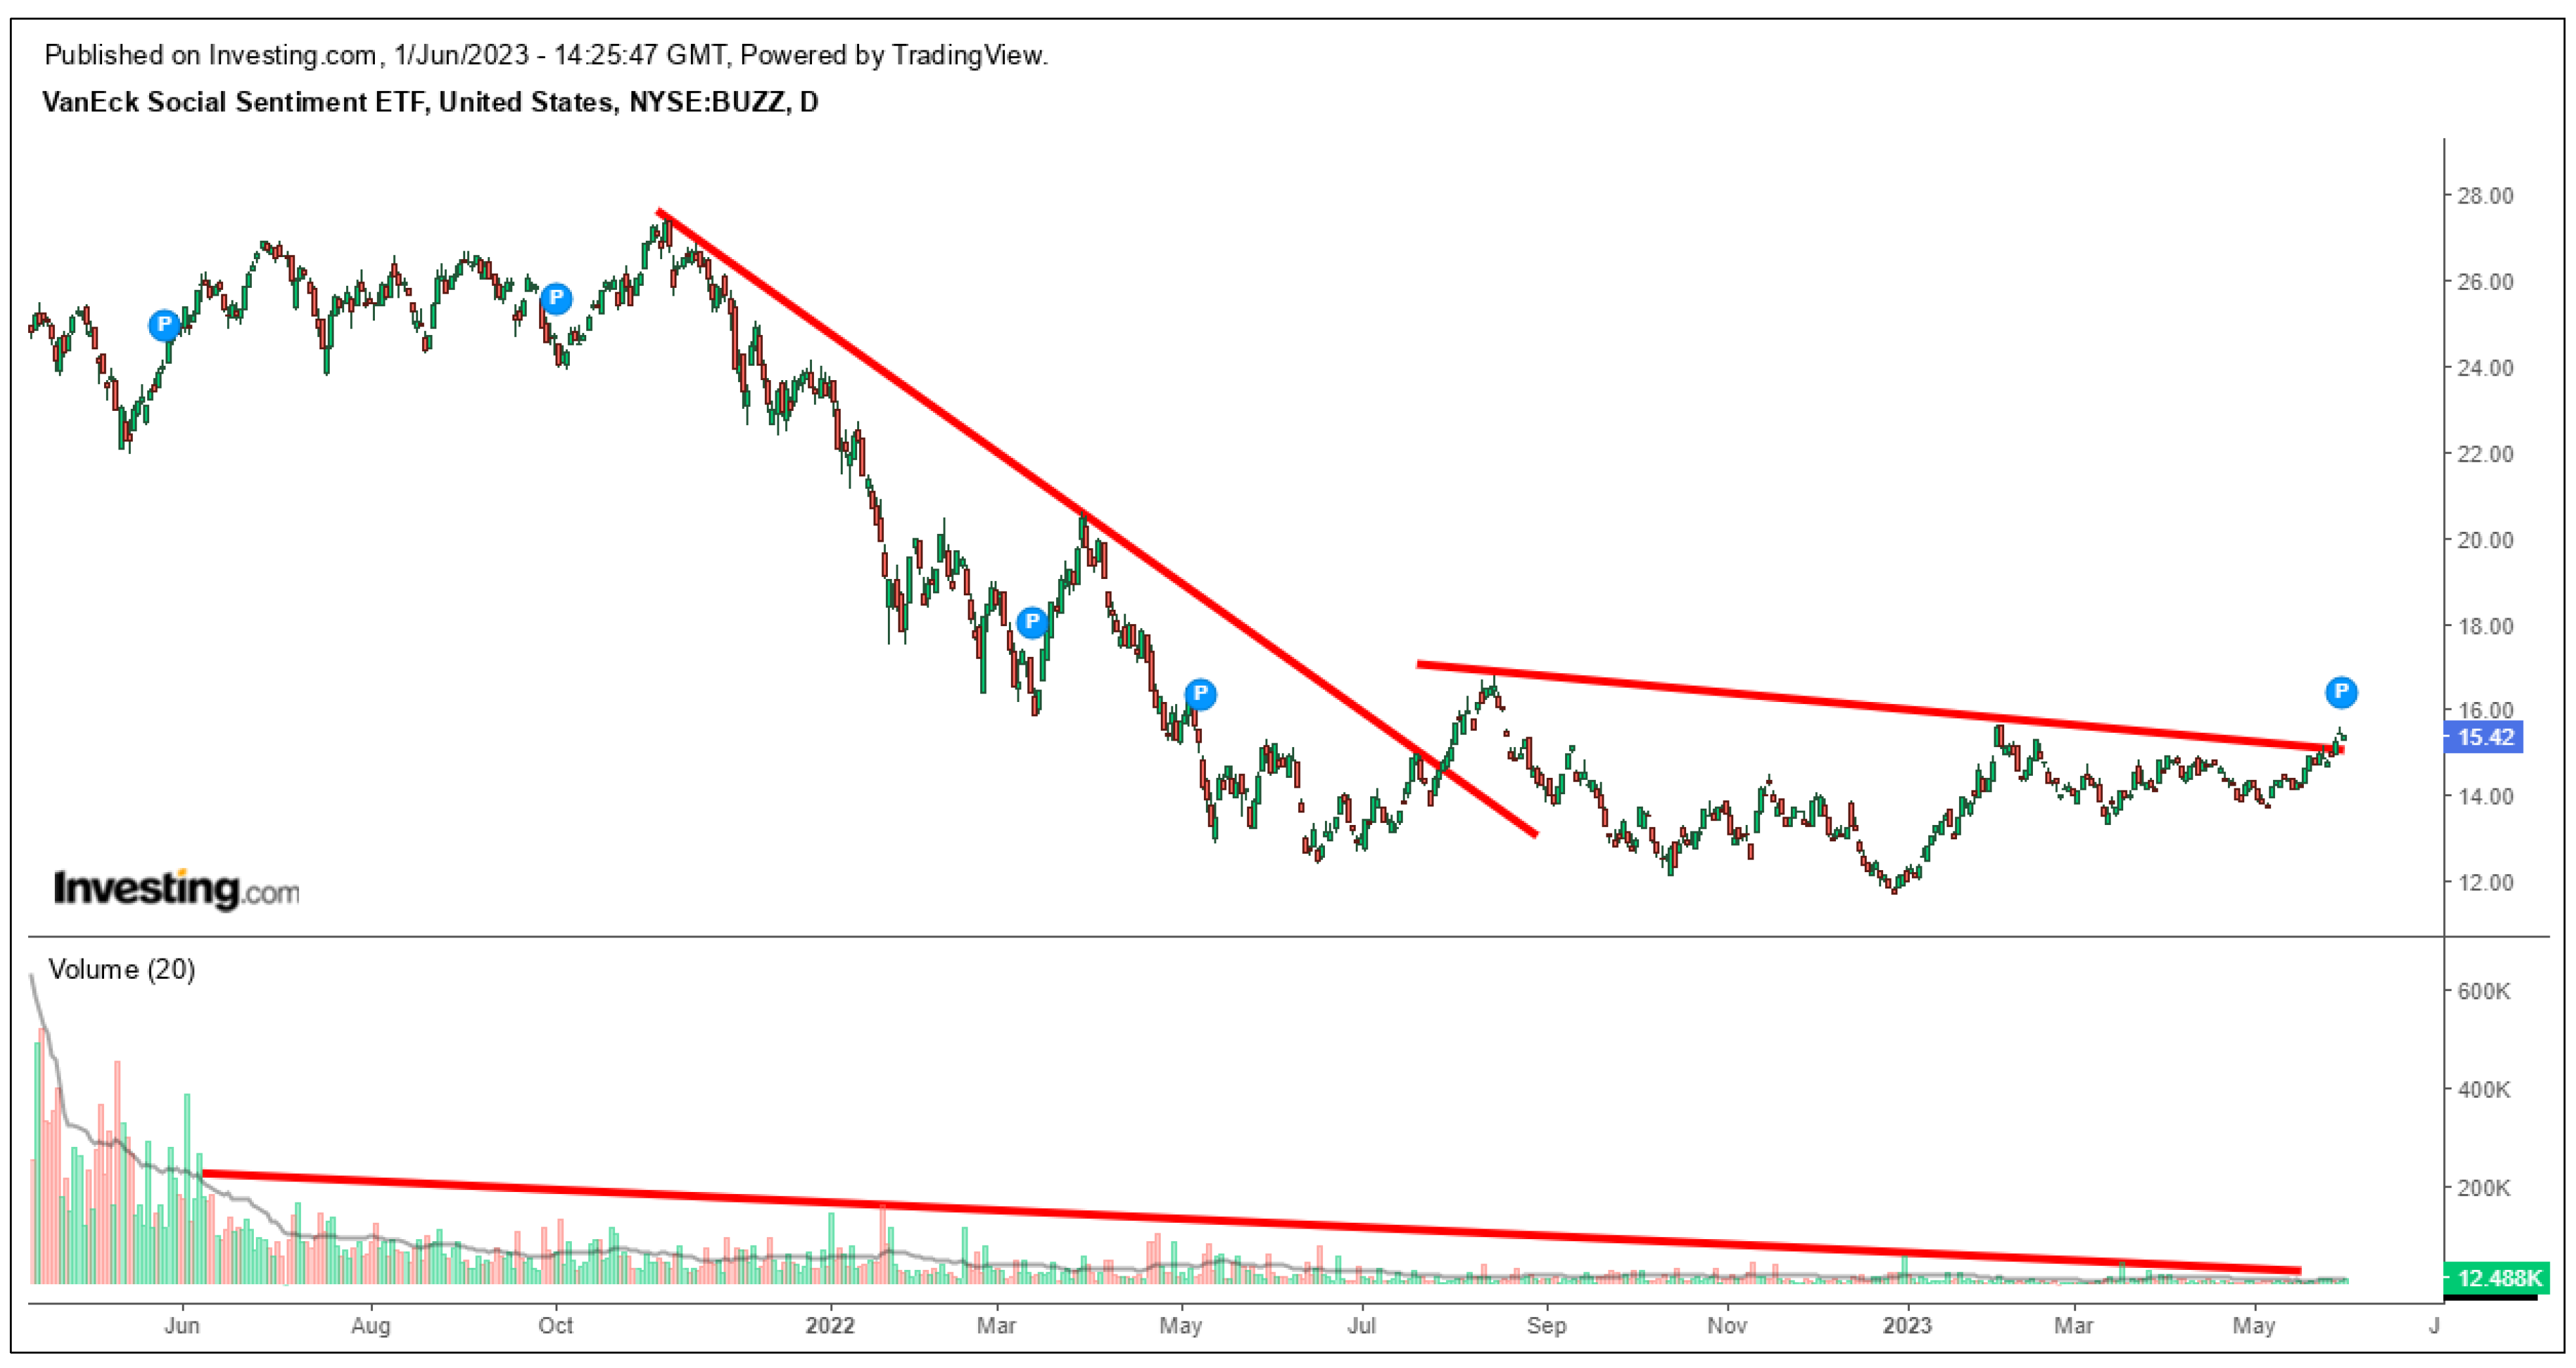
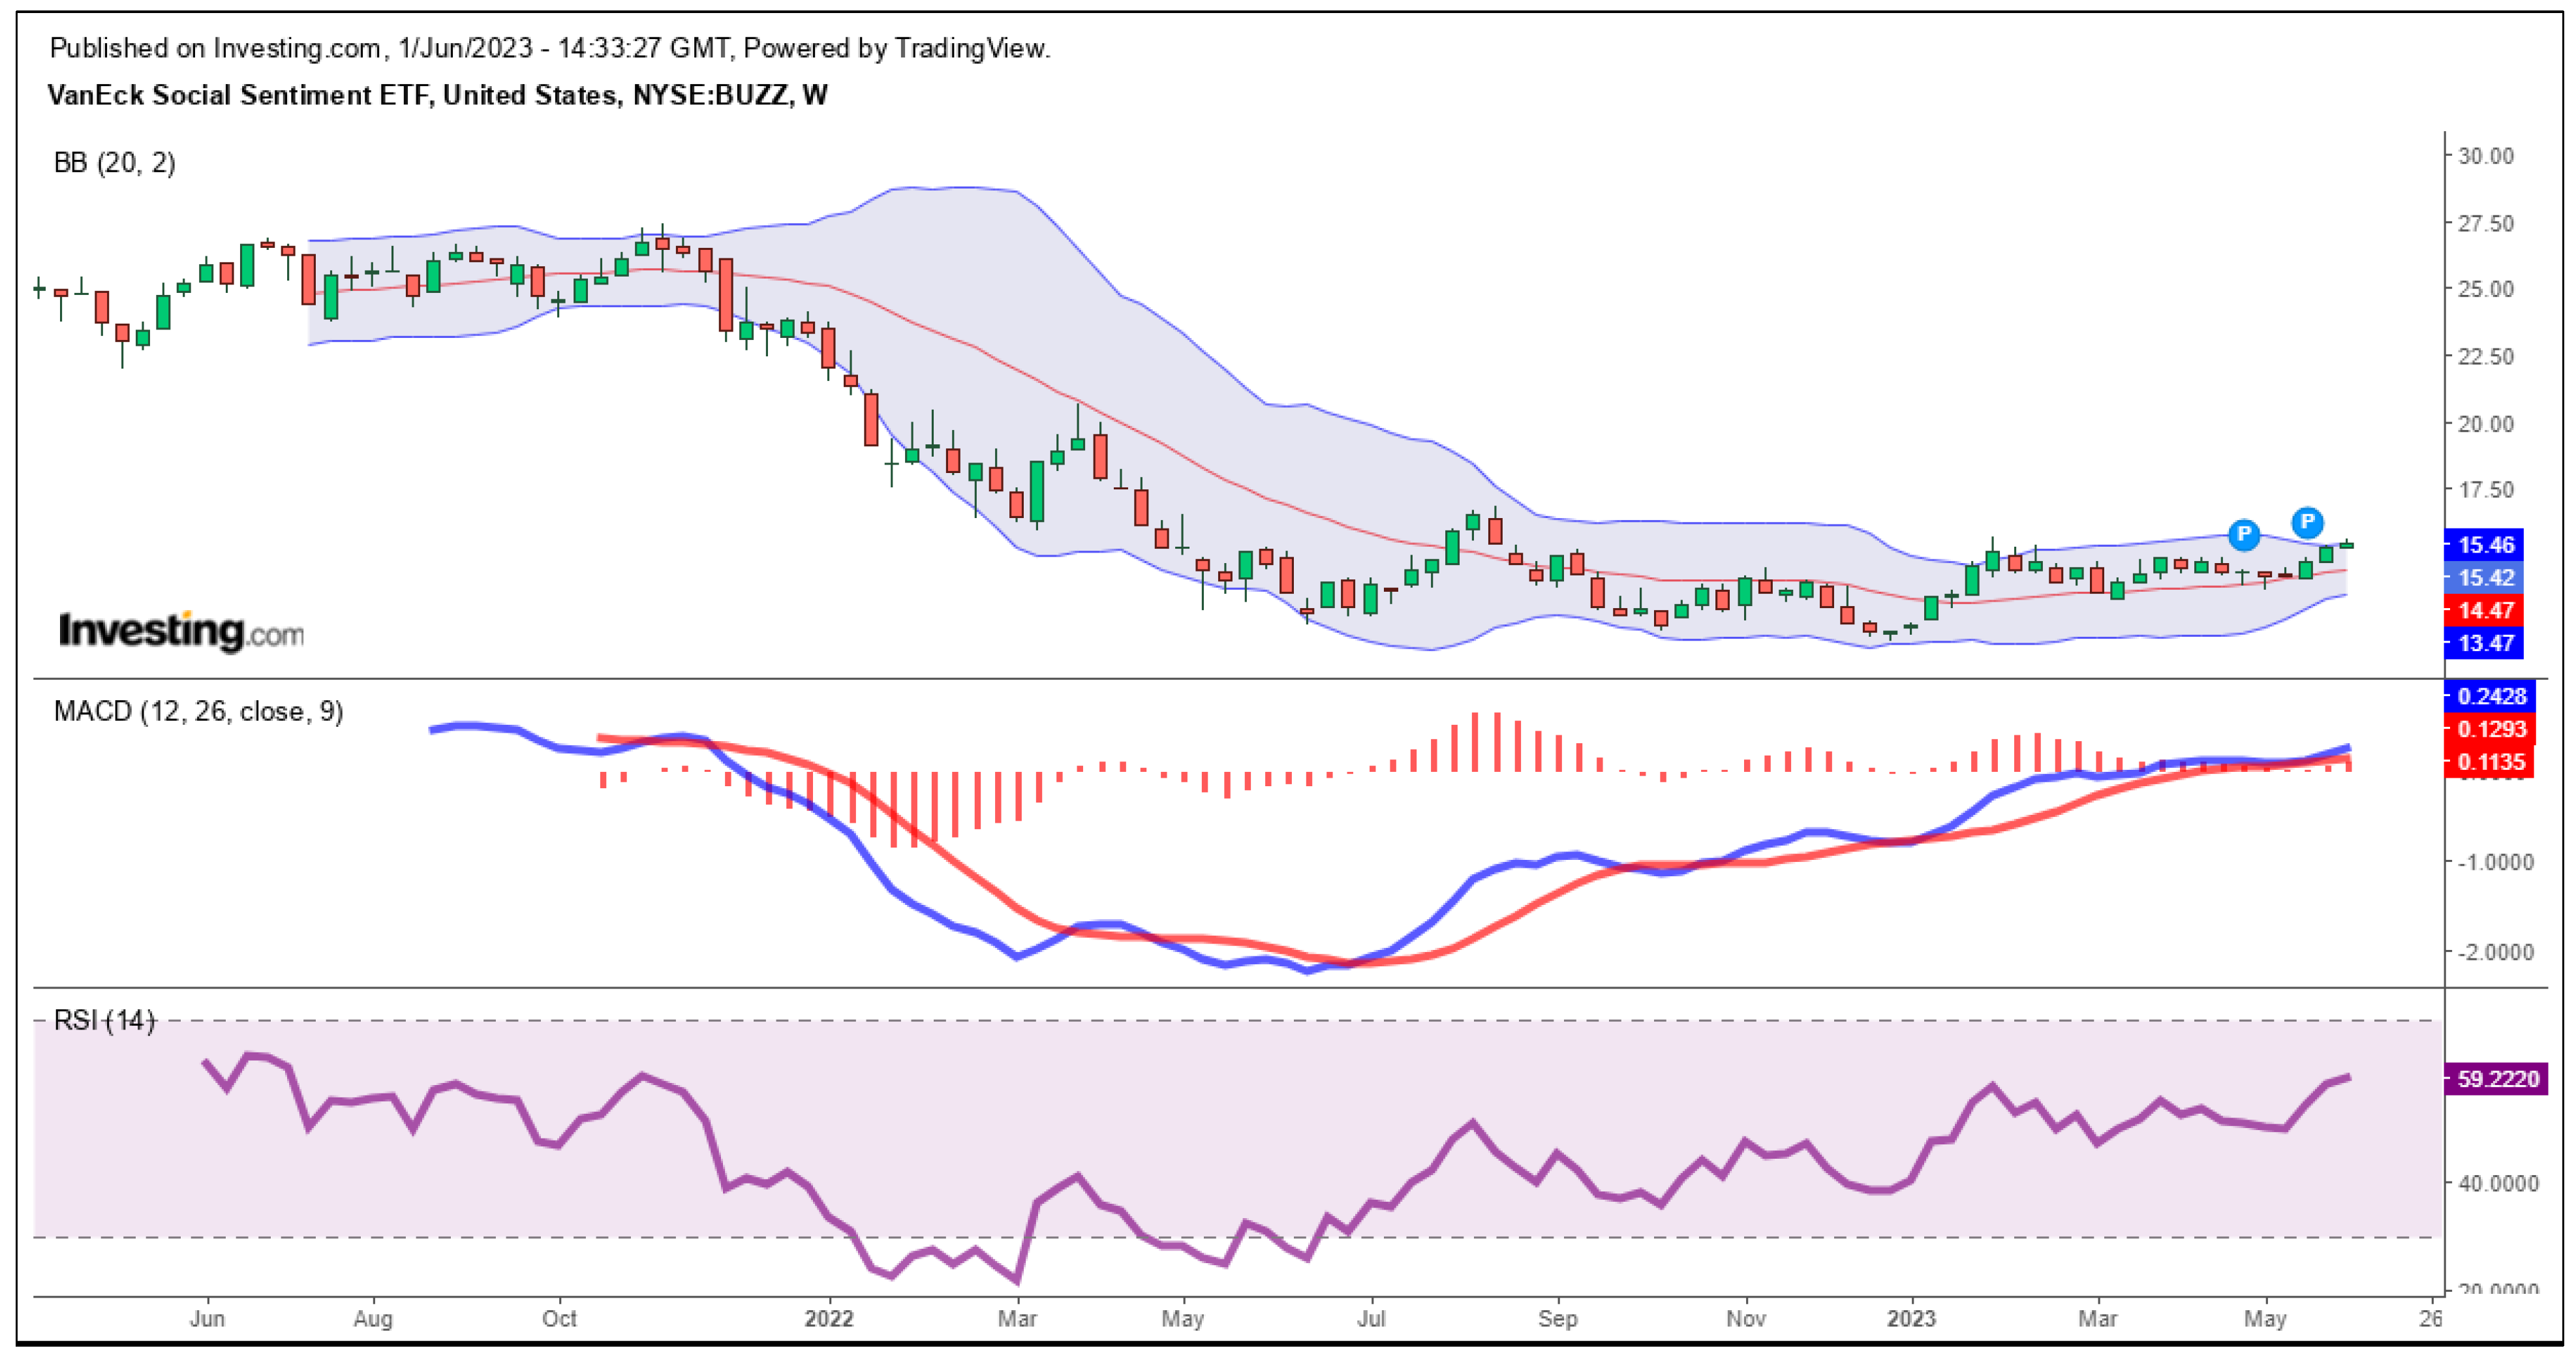
3. The Impact of News Sentiment Indices Figures in the Technical Analysis
- The trend is downward, a fact confirmed by the decreasing volumes.
- MACD intersection, nearby Bollinger bands, and RSI below 70% (only 60%).
- 1.
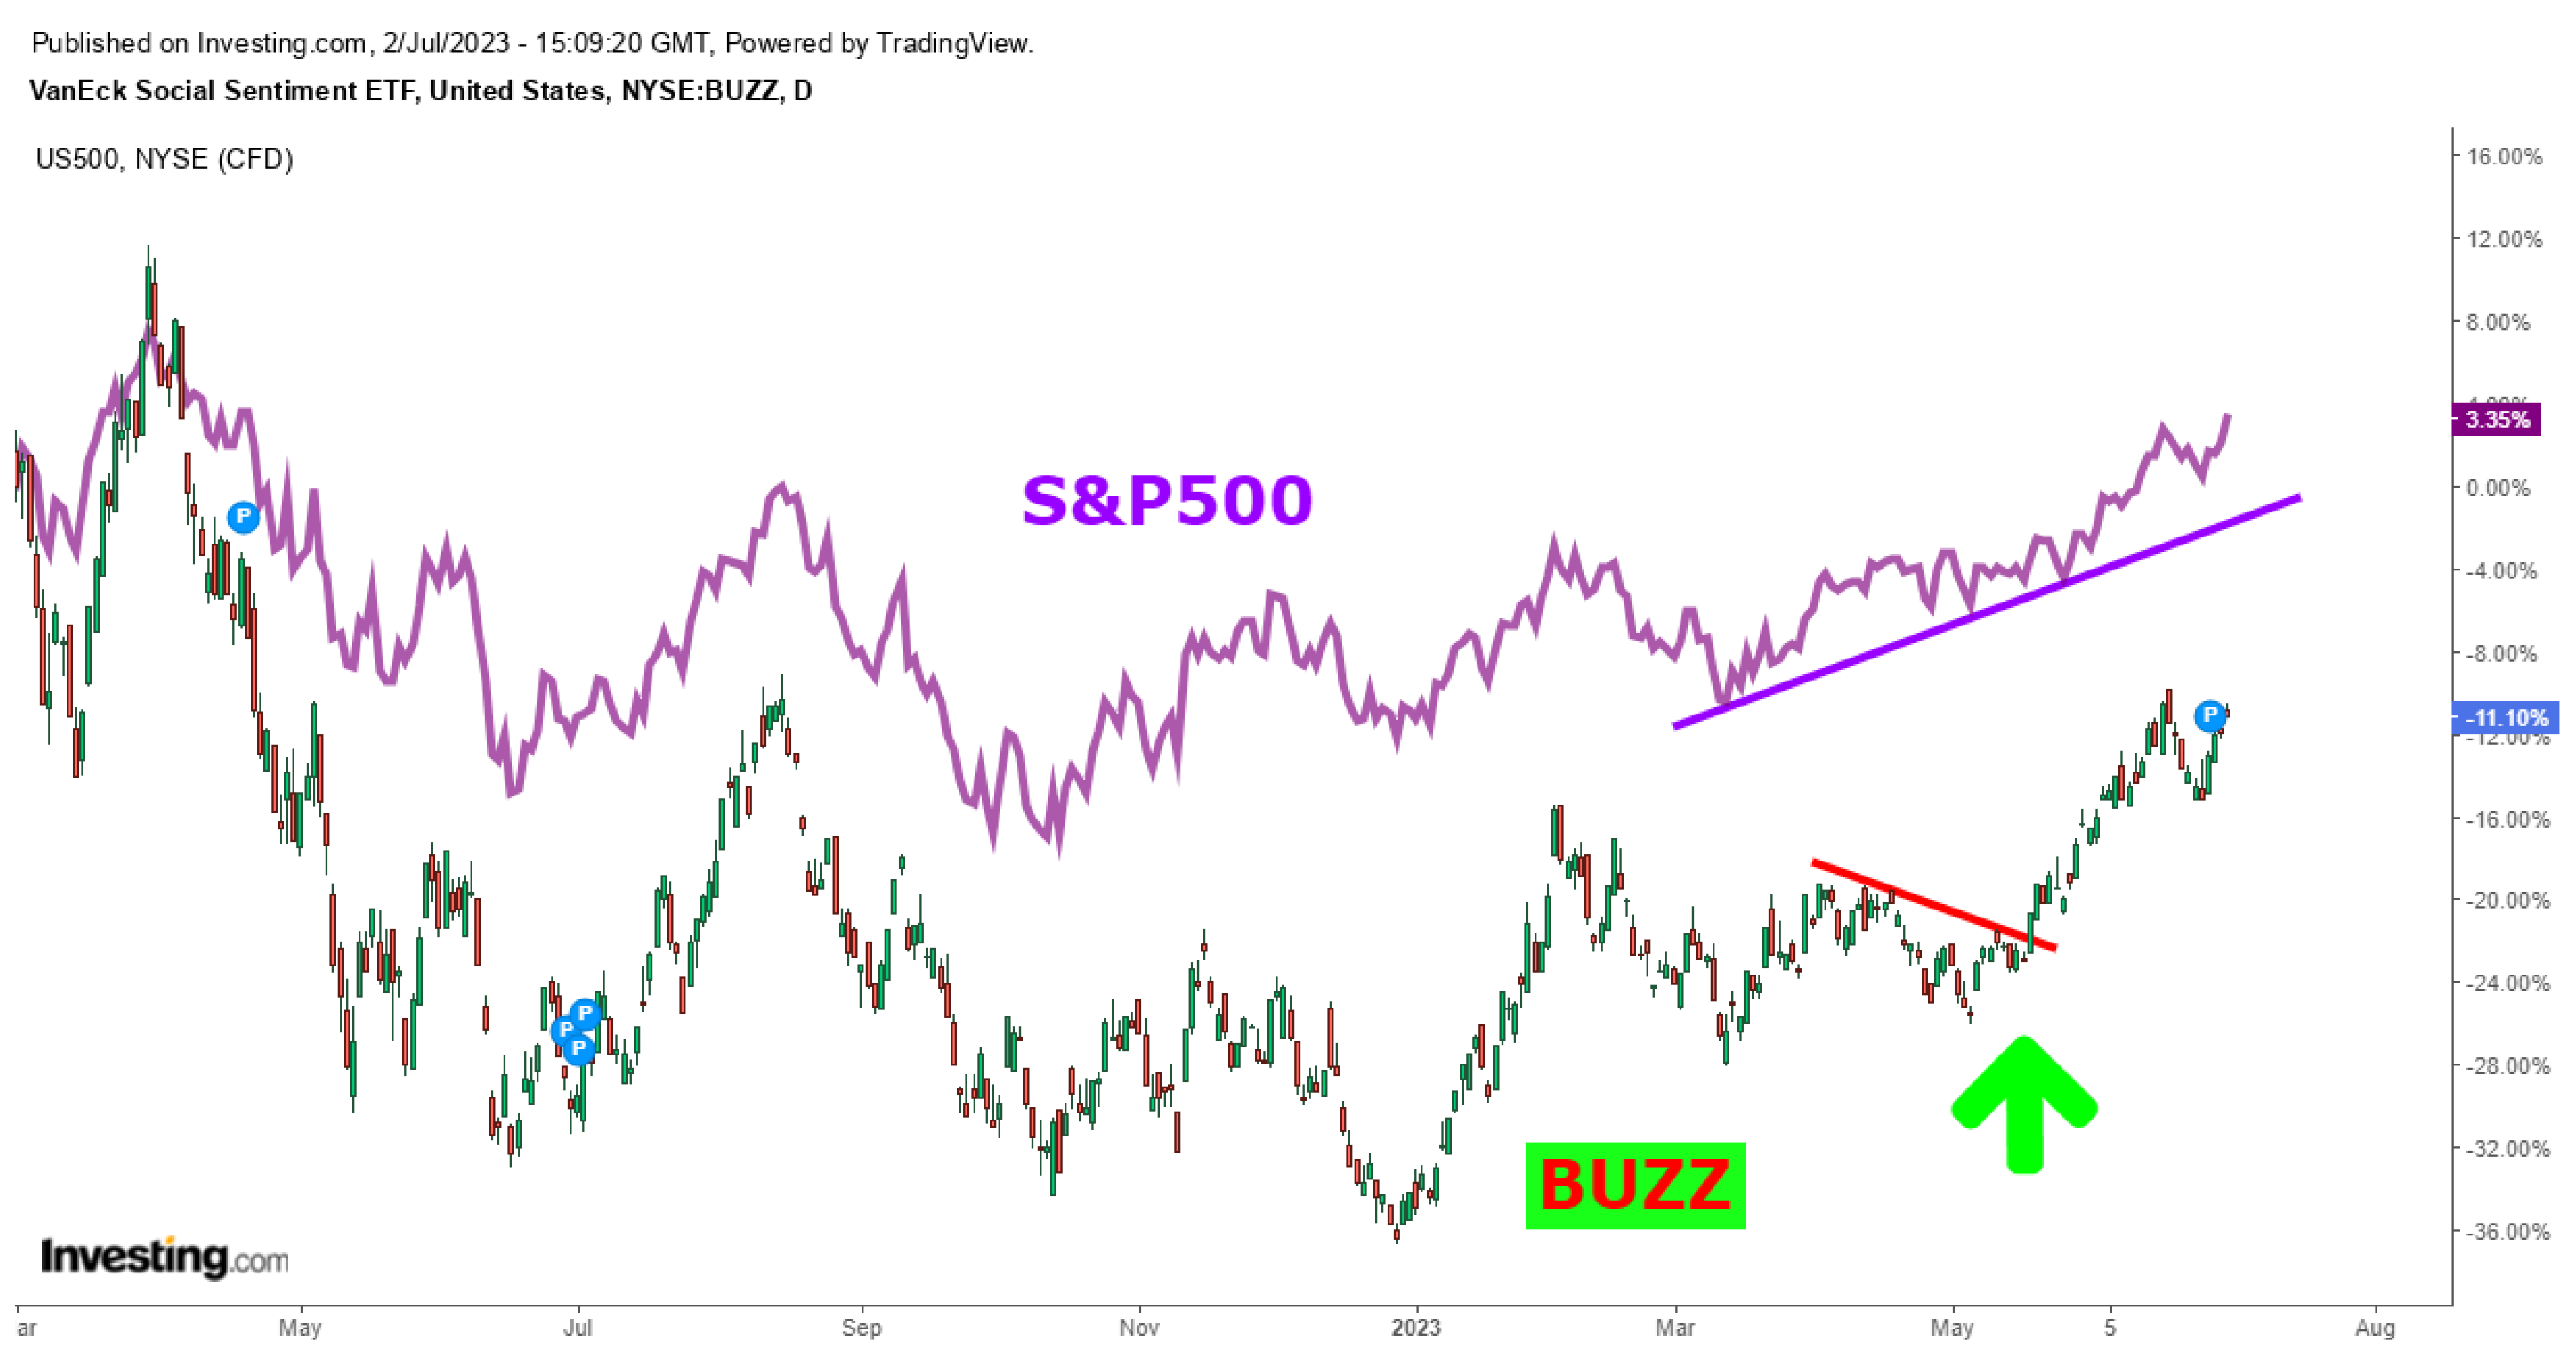
- The economic lockdown generated by the pandemic was much more strongly felt by the DAX stock index (DE40) than by the sentiment indicator.
- 2.
- Similarly, the outbreak of the war in Ukraine caused a much more drastic drop in the DAX than the CFD.
4. Quantitative Approaches of Sentiment Indicators on the Stock Market
4.1. Methodology and Data
4.2. Empirical Results
4.3. Correlation Analysis for the Variables
5. Discussion and Recommendations
- 1.
- Elon Musk is publicly accused of market manipulation through public intelligence sources: “According to Reuters, investors are claiming (opens in a new tab) that Musk used his influence on Twitter, TV appearances, and paid online influencers to trade profitably at the expense of other investors (mashable.com/article/elon-musk-dogecoin-lawsuit, accessed on 16 May 2023)”.
- 2.
- The chaos created in social media on the subject of the pandemic.
- 3.
- All, but absolutely all of the press is partisan about the war in Ukraine—either on one side or the other, but we do not know any objective, equidistant source.
- 4.
- Banning Donald Trump on some social media during the election campaign.
- 5.
- Questionnaires (if used) are often ambiguous, and unclear, some even put in a certain direction.
6. Conclusions
Author Contributions
Funding
Data Availability Statement
Acknowledgments
Conflicts of Interest
Appendix A
Appendix A.1. DJI
| Correlation | |||||||||
| Probability | DJI_CL | DJI_HI | DJI_LOW | DJI_OP | DJI_R | DJI_VOL | FFR_VAR | NS | INF |
| DJI_CL | 1.0000 | ||||||||
| ------- | |||||||||
| DJI_HI | 0.9998 | 1.0000 | |||||||
| 0.0000 | ------- | ||||||||
| DJI_LOW | 0.9998 | 0.9997 | 1.0000 | ||||||
| 0.0000 | 0.0000 | ------- | |||||||
| DJI_OP | 0.9997 | 0.9998 | 0.9998 | 1.0000 | |||||
| 0.0000 | 0.0000 | 0.0000 | ------- | ||||||
| DJI_R | 0.0204 | 0.0093 | 0.0116 | 0.0002 | 1.0000 | ||||
| 0.0939 | 0.4445 | 0.3395 | 0.9844 | ------ | |||||
| DJI_VOL | 0.4140 | 0.4188 | 0.4102 | 0.4157 | −0.0440 | 1.0000 | |||
| 0.0000 | 0.0000 | 0.0000 | 0.0000 | 0.0003 | ------ | ||||
| FFR_VAR | 0.0212 | 0.0213 | 0.0219 | 0.0217 | −0.0396 | −0.0112 | 1.0000 | ||
| 0.0824 | 0.0810 | 0.0722 | 0.0747 | 0.0012 | 0.3560 | ------ | |||
| NS | −0.0358 | −0.0395 | −0.0314 | −0.0356 | −0.1891 | −0.1641 | 0.01636 | 1.0000 | |
| 0.0033 | 0.0012 | 0.0100 | 0.0035 | 0.1199 | 0.0000 | 0.1802 | ------ | ||
| INF | 0.4114 | 0.4129 | 0.4104 | 0.4118 | −0.0284 | 0.2964 | 0.0255 | 0.0580 | 1.0000 |
| 0.0000 | 0.0000 | 0.0000 | 0.000 | 0.0197 | 0.0000 | 0.0364 | 0.0000 | ------ |
Appendix A.2. GOOGL
| Correlation | |||||||||
| Probability | GOOGL_CL | GOOGL_HI | GOOGL_LOW | GOOGL_OP | GOOGL_R | GOOGL_VOL | FFR_VAR | NS | INF |
| GOOGL_CL | 1.000 | ||||||||
| ------- | |||||||||
| GOOGL_HI | 0.9998 | 1.0000 | |||||||
| 0.0000 | ------- | ||||||||
| GOOGL_LOW | 0.9998 | 0.9998 | 1.0000 | ||||||
| 0.0000 | 0.0000 | ------- | |||||||
| GOOGL_R | −0.0123 | −0.0185 | −0.0176 | 1.0000 | |||||
| 0.3124 | 0.1299 | 0.1478 | ------- | ||||||
| GOOGL_OP | 0.9997 | 0.9999 | 0.9998 | −0.0231 | 1.0000 | ||||
| 0.0000 | 0.0000 | 0.0000 | 0.0580 | ------ | |||||
| GOOGL_VOL | −0.4504 | −0.4489 | −0.4516 | 0.0703 | −0.4499 | 1.0000 | |||
| 0.0000 | 0.0000 | 0.0000 | 0.0000 | 0.0000 | ------ | ||||
| INF | 0.4936 | 0.4954 | 0.4925 | −0.0385 | 0.4942 | 0.0976 | 1.0000 | ||
| 0.0000 | 0.0000 | 0.0000 | 0.0016 | 0.0000 | 0.0000 | ------ | |||
| NS | −0.1028 | −0.1043 | −0.1010 | −0.0006 | −0.1025 | 0.1958 | 0.0577 | 1.0000 | |
| 0.0000 | 0.0000 | 0.0000 | 0.9571 | 0.0000 | 0.0000 | 0.0000 | ------ | ||
| FFR_VAR | 0.0270 | 0.0269 | 0.0268 | −0.0124 | 0.0266 | −0.0140 | 0.0255 | 0.0163 | 1.0000 |
| 0.0267 | 0.0275 | 0.0276 | 0.3072 | 0.0289 | 0.2502 | 0.0365 | 0.1807 | ------ |
Appendix A.3. AMZN
| Correlation | |||||||||
| Probability | AMZN_CL | AMZN_HI | AMZN_LOW | AMZN_OP | AMZN_R | AMZN_VOL | FFR_VAR | INF | NS |
| AMZN_CL | 1.000 | ||||||||
| ------- | |||||||||
| AMZN_HI | 0.9998 | 1.0000 | |||||||
| 0.0000 | ------- | ||||||||
| AMZN_LOW | 0.9998 | 0.9998 | 1.0000 | ||||||
| 0.0000 | 0.0000 | ------- | |||||||
| AMZN_OP | 0.9997 | 0.9999 | 0.9998 | 1.0000 | |||||
| 0.0000 | 0.0000 | 0.0000 | ------- | ||||||
| AMZN_R | −0.0146 | −0.0195 | −0.0188 | −0.0233 | 1.0000 | ||||
| 0.2315 | 0.1094 | 0.1219 | 0.0555 | ------ | |||||
| AMZN_VOL | −0.2319 | −0.2300 | −0.2338 | −0.2316 | 0.1257 | 1.0000 | |||
| 0.0000 | 0.0000 | 0.0000 | 0.0000 | 0.0000 | ------ | ||||
| FFR_VAR | 0.0162 | 0.0160 | 0.0164 | 0.0160 | 0.0090 | −0.0155 | 1.0000 | ||
| 0.1832 | 0.1893 | 0.1779 | 0.1894 | 0.4609 | 0.2026 | ------ | |||
| INF | 0.3616 | 0.3635 | 0.3603 | 0.3618 | −0.0529 | −0.0085 | 0.0255 | 1.0000 | |
| 0.0000 | 0.0000 | 0.0000 | 0.0000 | 0.0000 | 0.4841 | 0.0364 | ------ | ||
| NS | −0.1788 | −0.1799 | −0.1772 | −0.1785 | −0.0209 | −0.0520 | 0.0163 | 0.0579 | 1.0000 |
| 0.0000 | 0.0000 | 0.0000 | 0.0000 | 0.0870 | 0.0000 | 0.1804 | 0.0000 | ------ |
Appendix A.4. AAPL
| Correlation | |||||||||
| Probability | AAPL_CL | AAPL_HI | AAPL_LOW | AAPL_OP | AAPL_R | AAPL_VOL | FFR_VAR | INF | NS |
| AAPL_CL | 1.000 | ||||||||
| ------- | |||||||||
| AAPL_HI | 0.9998 | 1.0000 | |||||||
| 0.0000 | ------- | ||||||||
| AAP_LOW | 0.9998 | 0.9998 | 1.0000 | ||||||
| 0.0000 | 0.0000 | ------- | |||||||
| AAPL_OP | 0.9997 | 0.9999 | 0.9998 | 1.0000 | |||||
| 0.0000 | 0.0000 | 0.0000 | ------- | ||||||
| AAPL_R | −0.0057 | −0.0114 | −0.0107 | −0.0152 | 1.0000 | ||||
| 0.6389 | 0.3487 | 0.3777 | 0.2103 | ------ | |||||
| AAPL_VOL | −0.5173 | −0.5161 | −0.5185 | −0.5171 | 0.0017 | 1.0000 | |||
| 0.0000 | 0.0000 | 0.0000 | 0.0000 | 0.8842 | ------ | ||||
| FFR_VAR | 0.0270 | 0.0269 | 0.0270 | 0.0268 | −0.0401 | −0.0182 | 1.0000 | ||
| 0.0265 | 0.0274 | 0.0267 | 0.0279 | 0.0010 | 0.1356 | ------ | |||
| INF | 0.5353 | 0.5357 | 0.5350 | 0.5351 | −0.0211 | 0.0273 | 0.0255 | 1.0000 | |
| 0.0000 | 0.0000 | 0.0000 | 0.0000 | 0.0840 | 0.0249 | 0.0364 | ------ | ||
| NS | −0.1678 | −0.1687 | −0.1664 | −0.1675 | −0.0027 | −0.0284 | 0.0163 | 0.0580 | 1.0000 |
| 0.0000 | 0.0000 | 0.0000 | 0.0000 | 0.8189 | 0.0197 | 0.1802 | 0.0000 | ------ |
Appendix A.5. eBay
| Correlation | |||||||||
| Probability | eBay_CL | eBay_HI | eBay_LOW | eBay_OP | eBay_R | eBay_VOL | FFR_VAR | INF | NS |
| eBay_CL | 1.000 | ||||||||
| ------- | |||||||||
| eBay_HI | 0.9997 | 1.0000 | |||||||
| 0.0000 | ------- | ||||||||
| eBay_LOW | 0.9997 | 0.9997 | 1.0000 | ||||||
| 0.0000 | 0.0000 | ------- | |||||||
| eBay_OP | 0.9994 | 0.9997 | 0.9997 | 1.0000 | |||||
| 0.0000 | 0.0000 | 0.000 | ------- | ||||||
| eBay_R | 0.0035 | −0.0006 | −0.0006 | −0.017 | 1.0000 | ||||
| 0.7722 | 0.6044 | 0.5807 | 0.1621 | ------ | |||||
| eBay_VOL | −0.5650 | −0.5618 | −0.5678 | −0.5645 | 0.0211 | 1.0000 | |||
| 0.0000 | 0.0000 | 0.0000 | 0.0000 | 0.0833 | ------ | ||||
| FFR_VAR | 0.0225 | 0.0224 | 0.0225 | 0.0223 | 0.0014 | −0.011 | 1.0000 | ||
| 0.0646 | 0.0665 | 0.0647 | 0.0672 | 0.9037 | 0.3487 | ------ | |||
| INF | 0.3808 | 0.3836 | 0.3793 | 0.3817 | −0.0411 | −0.1011 | 0.0255 | 1.0000 | |
| 0.0000 | 0.0000 | 0.0000 | 0.0000 | 0.0008 | 0.0000 | 0.0364 | ------ | ||
| NS | 0.0071 | 0.0053 | 0.0098 | 0.0081 | −0.0446 | 0.0536 | 0.0163 | 0.0579 | 1.0000 |
| 0.5593 | 0.6601 | 0.4211 | 0.5071 | 0.0003 | 0.0000 | 0.1803 | 0.0000 | ------ |
Appendix A.6. C
| Correlation | |||||||||
| Probability | C_CL | C_HI | C_LOW | C_OP | C_R | C_VOL | FFR_VAR | INF | NS |
| C_CL | 1.000 | ||||||||
| ------- | |||||||||
| C_HI | 0.9998 | 1.0000 | |||||||
| 0.0000 | ------- | ||||||||
| C_LOW | 0.9999 | 0.9997 | 1.0000 | ||||||
| 0.0000 | 0.0000 | ------- | |||||||
| C_OP | 0.9998 | 0.9998 | 0.9998 | 1.0000 | |||||
| 0.0000 | 0.0000 | 0.0000 | ------- | ||||||
| C_R | −0.0012 | −0.0067 | −0.0056 | −0.0104 | 1.0000 | ||||
| 0.9165 | 0.5788 | 0.6443 | 0.3945 | ------ | |||||
| C_VOL | −0.5100 | −0.5089 | −0.5109 | −0.5095 | −0.0039 | 1.0000 | |||
| 0.0000 | 0.0000 | 0.0000 | 0.0000 | 0.7493 | ------ | ||||
| FFR_VAR | −0.0162 | −0.0161 | −0.0159 | −0.0160 | −0.0244 | 0.0038 | 1.0000 | ||
| 0.1848 | 0.1862 | 0.1925 | 0.1882 | 0.0456 | 0.7552 | ------ | |||
| INF | 0.2129 | 0.2140 | 0.2120 | 0.2129 | −0.0158 | −0.2340 | 0.0257 | 1.0000 | |
| 0.0000 | 0.0000 | 0.0000 | 0.0000 | 0.1950 | 0.0000 | 0.0350 | ------ | ||
| NS | 0.4824 | 0.4784 | 0.4858 | 0.4816 | 0.0092 | −0.3981 | 0.0164 | 0.0575 | 1.0000 |
| 0.0000 | 0.0000 | 0.0000 | 0.0000 | 0.4479 | 0.0000 | 0.1782 | 0.0000 | ------ |
Appendix A.7. VIX
| Correlation | ||||||||
| Probability | VIX_CH | VIX_HI | VIX_LOW | VIX_OP | VIX_P | FFR_VAR | INF | NS |
| VIX_CH | 1.000 | |||||||
| ------- | ||||||||
| VIX_HI | 0.0635 | 1.0000 | ||||||
| 0.0000 | ------- | |||||||
| VIX_LOW | 0.0249 | 0.9876 | 1.0000 | |||||
| 0.0411 | 0.0000 | ------- | ||||||
| VIX_OP | −0.0207 | 0.9893 | 0.9932 | 1.0000 | ||||
| 0.0899 | 0.0000 | 0.0000 | ------- | |||||
| VIX_P | 0.1128 | 0.9926 | 0.9908 | 0.9843 | 1.0000 | |||
| 0.0000 | 0.0000 | 0.0000 | 0.0000 | ------ | ||||
| FFR_VAR | 0.0083 | −0.0352 | −0.0306 | −0.0357 | −0.0300 | 1.0000 | ||
| 0.4945 | 0.0038 | 0.0122 | 0.0034 | 0.0140 | ------ | |||
| INF | 0.0186 | 0.0025 | −0.0030 | −0.0021 | −0.0003 | 0.0256 | 1.0000 | |
| 0.1275 | 0.8316 | 0.8045 | 0.8582 | 0.9784 | 0.0361 | ------ | ||
| NS | 0.0300 | −0.6806 | −0.7045 | −0.6963 | −0.6892 | 0.0163 | 0.0579 | 1.0000 |
| 0.0140 | 0.0000 | 0.0000 | 0.0000 | 0.0000 | 0.1796 | 0.0000 | ------ |
References
- Necadova, M. Changes in economic sentiment indicators before and after economic crisis (position of Visegrad group and Germany in EU). Cent. Eur. Bus. Rev. 2019, 8, 55–85. [Google Scholar] [CrossRef] [Green Version]
- Corr, P.; Plagnol, A. Behavioral Economics. The Basics-Second Edition; Routledge: London, UK, 2023; ISBN 978-0-367-76434-0. [Google Scholar]
- Dumiter, F.C.; Turcaș, F.M. Theoretical and empirical underpinnings regarding stock market forecasts and predictions. Studia Universitatis “Vasile Goldis” Arad. Econ. Ser. 2022, 32, 1–19. [Google Scholar] [CrossRef]
- Dumiter, F.C.; Turcaș, F.M. Technical Analysis Applications: A Practical and Empirical Stock Market Guide, 1st ed.; Palgrave Macmillan: London, UK, 2023; ISBN 978-3031274152. [Google Scholar]
- Daxhammer, R.J.; Facsar, M.; Papp, Z. Behavioral Finance Limited Rationality in Financial Markets, 3rd ed.; UVK Verlag: München, Germany, 2023; ISBN 978-3-7398-3119-0. [Google Scholar]
- Krishnamoorthy, S. Sentiment analysis of financial news articles using performance indicators. Knowl. Inf. Syst. 2018, 56, 373–394. [Google Scholar] [CrossRef] [Green Version]
- Kräussl, R.; Mirgorodskaya, E. Media, sentiment and market performance in the long run. Eur. J. Financ. 2017, 23, 1059–1082. [Google Scholar] [CrossRef] [Green Version]
- Gao, C.; Martin, I.W.R. Volatility, Valuation Ratios, and Bubbles: An Empirical Measure of Market Sentiment. J. Financ. 2021, LXXVI, 3211–3254. [Google Scholar] [CrossRef]
- Galariotis, E.C.; Holmes, P.; Kallinterakis, V.; Ma, X.S. Market states, expectations, sentiment and momentum: How naive are investors? Int. Rev. Financ. Anal. 2014, 32, 1–12. [Google Scholar] [CrossRef]
- Zhang, L.; Fu, S.; Li, B. Research on Stock Price Forecast Based on News Sentiment Analysis—A Case Study of Alibaba; ICCS 2018; LNCS 10861; Shi, Y., Fu, H., Tian, Y., Krzhizhnovskaya, V.V., Lees, M.H., Dongarra, J., Sloot, P.M.A., Eds.; Springer International Publishing: Berlin/Heidelberg, Germany, 2018; pp. 429–442. [Google Scholar] [CrossRef]
- Kabiri, A.; James, H.; Landon-Lane, J.; Tuckett, S.; Nyman, R. The role of sentiment in the US economy: 1920 to 1934. Econ. Hist. Rev. 2023, 76, 3–30. [Google Scholar] [CrossRef]
- Nakhli, M.S.; Dhaoui, A.; Chevallier, J. Bootstrap rolling-window Granger causality dynamics between momentum and sentiment: Implications for investors. Ann. Financ. 2022, 18, 267–283. [Google Scholar] [CrossRef]
- Prasad, S.; Sabyasachi, M.; Rahman, M.R.; Puniyani, A. Investor Sentiment Index: A Systematic Review. Int. J. Financ. Stud. 2023, 11, 6. [Google Scholar] [CrossRef]
- Han, Z.; Sakkas, N.; Danbolt, J.; Eshraghi, A. Persistence of investor sentiment and market mispricing. Financ. Rev. 2022, 57, 617–640. [Google Scholar] [CrossRef]
- Yen, M.F.; Huang, Y.P.; Yu, L.C.; Chen, Y.L. A Two-Dimensional Sentiment Analysis of Online Public Opinion and Future Financial Performance of Publicly Listed Companies. Comput. Econ. 2022, 59, 1677–1698. [Google Scholar] [CrossRef]
- Li, M.; Li, W.; Wang, F.; Jia, X.; Rui, G. Applying BERT to analyze investor sentiment in stock market. Neural Comput. Appl. 2021, 33, 4663–4676. [Google Scholar] [CrossRef]
- Valle-Cruz, D.; Fernandez-Cortez, V.; López-Chau, A.; Sandoval-Almazán, R. Does Twitter Affect Stock Market Decisions? Financial Sentiment Analysis During Pandemics: A Comparative Study of the H1N1 and the COVID-19 Periods. Cogn. Comput. 2022, 14, 372–387. [Google Scholar] [CrossRef]
- Figà-Talamanca, G.; Patacca, M. An explorative analysis of sentiment impact on S&P 500 components returns, volatility and downside risk. Annal. Op. Res. 2022. [Google Scholar] [CrossRef]
- Smith, S.; O’Hare, A. Comparing traditional news and social media with stock price movements; which comes first, the news or the price change? J. Big Data 2022, 9, 47. [Google Scholar] [CrossRef]
- Maghyereh, A.; Abdoh, H. Can news-based economic sentiment predict bubbles in precious metal markets? Maghyereh Abdoh Financ. Innov. 2022, 8, 35. [Google Scholar] [CrossRef]
- Wojarnik, G. Sentiment Analysis As A Factor Included In The Forecasts Of Price Changes In The Stock Exchange. Procedia Comput. Sci. 2021, 192, 3176–3183. [Google Scholar] [CrossRef]
- Xu, Q.; Chang, V.; Hsu, C.H. Event Study and Principal Component Analysis Based on Sentiment Analysis—A Combined Methodology to Study the Stock Market with an Empirical Study. Inf. Syst. Front. 2020, 22, 1021–1037. [Google Scholar] [CrossRef]
- McGurk, Z.; Nowak, A.; Hall, J.C. Stock returns and investor sentiment: Textual analysis and social media. J. Econ. Financ. 2020, 44, 458–485. [Google Scholar] [CrossRef] [Green Version]
- Chamberlain, B.; Liu, Z.; Smales, L.A. Short interest and the stock market relation with news sentiment from traditional and social media sources. Aust Econ Pap. 2023, 62, 321–334. [Google Scholar] [CrossRef]
- Chen, M.; Guo, Z.; Abbass, K.; Huang, W. Analysis of the impact of investor sentiment on stock price using the latent Dirichlet allocation topic model. Front. Environ. Sci. 2022, 10, 1068398. [Google Scholar] [CrossRef]
- Mendoza-Urdiales, R.A.; Núñez-Mora, J.A.; Santillán-Salgado, R.J.; Valencia-Herrera, H. Twitter Sentiment Analysis and Influence on Stock Performance Using Transfer Entropy and EGARCH Methods. Entropy 2022, 24, 874. [Google Scholar] [CrossRef] [PubMed]
- Sun, Y.; Zeng, X.; Zhou, S.; Zhao, H.; Thomas, P.; Hu, H. What investors say is what the market says: Measuring China’s real investor sentiment. Pers. Ubiquitous Comput. 2021, 25, 587–599. [Google Scholar] [CrossRef] [PubMed]
- Shi, J.; Ausloos, M.; Zhu, T. If global or local investor sentiments are prone to developing an impact on stock returns, is there an industry effect? Int. J. Fin. Econ. 2022, 27, 1309–1320. [Google Scholar] [CrossRef]
- Cevik, E.; Altinkeski, B.K.; Cevik, E.I.; Dibooglu, S. Investor sentiments and stock markets during the COVID-19 pandemic. Cevik et al. Financ. Innov. 2022, 8, 69. [Google Scholar] [CrossRef]
- P H, H.; Rishad, A. An empirical examination of investor sentiment and stock market volatility: Evidence from India. Financ. Innov. 2020, 6, 34. [Google Scholar] [CrossRef]
- Li, X.; Liang, C.; Ma, F. Forecasting stock market volatility with a large number of predictors: New evidence from the MS-MIDAS-LASSO model. Ann. Op. Res. 2022. [Google Scholar] [CrossRef]
- Khan, W.; Ghazanfar, M.A.; Azam, M.A.; Karami, A.; Alyoubi, K.H.; Alfakeeh, A.S. Stock market prediction using machine learning classifiers and social media, news. J. Ambient Intell. Humaniz. Comput. 2022, 13, 3433–3456. [Google Scholar] [CrossRef]
- Hsu, Y.J.; Lu, Y.C.; Yang, J.J. News sentiment and stock market volatility. Rev. Quant. Financ. Account. 2021, 57, 1093–1122. [Google Scholar] [CrossRef]
- Gao, Y.; Zhao, C.; Sun, B.; Zhao, W. Effects of investor sentiment on stock volatility: New evidences from multi-source data in China’s green stock markets. Financ. Innov. 2022, 8, 77. [Google Scholar] [CrossRef]
- Yang, J.; Wang, Y.; Li, X. Prediction of stock price direction using the LASSO-LSTM model combines technical indicators and financial sentiment analysis. PeerJ Comput. Sci. 2022, 8, 1148. [Google Scholar] [CrossRef]
- Sharaf, M.; El-Din Hemdan, E.; El-Sayed, A.; El-Bahnasawy, N.A. An efficient hybrid stock trend prediction system during COVID-19 pandemic based on stacked-LSTM and news sentiment analysis. Multimed. Tools Appl. 2022. [CrossRef]
- Wang, Z.; Hu, Z.; Li, F.; Ho, S.B.; Cambria, E. Learning-Based Stock Trending Prediction by Incorporating Technical Indicators and Social Media Sentiment. Cognit. Comput. 2023. [Google Scholar] [CrossRef]
- Ji, Z.; Wu, P.; Ling, C.; Zhu, P. Exploring the impact of investor’s sentiment tendency in varying input window length for stock price prediction. Multimed. Tools Appl. 2023. [Google Scholar] [CrossRef]
- Qiu, Y.; Song, Z.; Chen, Z. Short-term stock trends prediction based on sentiment analysis and machine learning. Soft Comput. 2022, 26, 2209–2224. [Google Scholar] [CrossRef]
- Das, N.; Sadhukhan, B.; Chatterjee, T.; Chakrabarti, S. Effect of public sentiment on stock market movement prediction during the COVID-19 outbreak. Soc. Netw. Anal. Min. 2022, 12, 92. [Google Scholar] [CrossRef] [PubMed]
- Shapiro, A.H.; Sudhof, M.; Wilson, D.J. Measuring News Sentiment; FRBSF Working Paper 2017-01; Elsevier: Amsterdam, The Netherlands, 2020. [Google Scholar] [CrossRef]
- Buckman, S.R.; Shapiro, A.H.; Sudhof, M.; Wilson, D.J. News sentiment in the time of COVID-19. FRBSF Econ. Lett. 2020, 8, 5–10. [Google Scholar]
- Evans, R.H. An analysis of the criterion reliability in conjoint analysis. Percept. Mot. Ski. 1996, 82, 988–990. [Google Scholar] [CrossRef]
- Muhammad, A.U.R. The impact of investor sentiment on returns, cash flows, discount rates, and performance. Borsa Istanb. Rev. 2022, 22-2, 352–362. [Google Scholar] [CrossRef]
- Karavias, Y.; Spilioti, S.; Tzavalis, E. Investor sentiment effects on share price deviations from their intrinsic values based on accounting fundamentals. Rev. Quant. Financ. Account. 2021, 56, 1593–1621. [Google Scholar] [CrossRef]
- Bilel, H.; Mondher, K. What Can explain catering of dividend? Environment information and investor sentiment. J. Econ. Financ. 2021, 45, 428–450. [Google Scholar] [CrossRef]
- Wu, S.; Liu, Y.; Zou, Z.; Weng, T.H. S_I_LSTM: Stock price prediction based on multiple data sources and sentiment analysis. Connect. Sci. 2022, 34, 44–62. [Google Scholar] [CrossRef]
- Amin, K.; Harris, E. The Effect of Investor Sentiment on Nonprofit Donations. J. Bus. Ethics 2022, 175, 427–450. [Google Scholar] [CrossRef]
- Swathi, T.; Kasiviswanath, N.; Rao, A.A. An optimal deep learning-based LSTM for stock price prediction using Twitter sentiment analysis. Appl. Intell. 2022, 52, 13675–13688. [Google Scholar] [CrossRef]
- Khan, W.; Malik, U.; Ghazanfar, M.A.; Azam, M.A.; Alyoubi, K.H.; Alfakeeh, A.S. Predicting stock market trends using machine learning algorithms via public sentiment and political situation analysis. Soft Comput. 2020, 24, 1019–11043. [Google Scholar] [CrossRef]
- Kaplan, H.; Weichselbraun, A.; Braşoveanu, A.M.P. Integrating Economic Theory, Domain Knowledge, and Social Knowledge into Hybrid Sentiment Models for Predicting Crude Oil Markets. Cognit. Comput. 2023. [Google Scholar] [CrossRef]
- Qi, X.Z.; Ning, Z.; Qin, M. Economic policy uncertainty, investor sentiment and financial stability—An empirical study based on the time-varying parameter-vector autoregression model. J. Econ. Interact. Coord. 2022, 17, 779–799. [Google Scholar] [CrossRef]
- Wang, S.; Yi, X.; Song, M. The interrelationship of air quality, investor sentiment, and stock market liquidity: A review of China. Environ. Dev. Sustain. 2022. [Google Scholar] [CrossRef]
- Naisbitt, J. Megatrends: Ten New Directions Transforming Our Lives; Grand Central Publishing Standard Edition: New York, NY, USA, 1988. [Google Scholar]


| Author | Research Purpose | Methodology | Sample | Conclusion |
|---|---|---|---|---|
| McGurk et al. (2020) [23] | The relationship between investor sentiment and stock returns. | Ordinary least squares (OLS), forecasting model. | NYSE—Russell 5000 Index. | Investor sentiment has a positive and significant effect on abnormal stock returns. |
| Yang et al. (2022) [35] | Forecasting stock direction using technical analysis and sentiment analysis. | Machine learning models—LASSO-LSTM model. | Shares of AAPL, MNST, and BAC on the NYSE and NASDAQ. | The sentiment analysis and technical analysis can improve prediction accuracy. |
| Li et al. (2022) [31] | The role of economic policy uncertainty indicators, market sentiment indicators, and financial stress indices in predicting volatility. | Machine learning models—MS-MIDAS- LASSO model. | S&P500 Index. | The forecasting accuracy is better expressed by economic policy uncertainty indicators, than mmarket sentiment indicators and financial stress indices. |
| Nakhli et al. (2022) [12] | Examining the Granger causality between investors’ sentiment and momentum strategies. | Granger causality test, the rolling-window bootstrap. Approach, probit model. | Stocks listed on NYSE, NASDAQ, and AMEX. | Bidirectional Granger causality is manifesting between investor sentiment and momentum strategy. |
| Figà-Talamanca and Patacca (2022) [18] | The effect of investor sentiment on the mean returns and the variance of financial stocks. | GARCH family augmented. | S&P500 Index. | There is a positive impact of news and Twitter feeds on stock prices. |
| Valle-Cruz et al. (2022) [17] | The influence of Twitter posts on the behavior of financial indices during pandemics. | Machine learning models. | Stock market indices: IPC; S&P 500; NASDAQ 100; Dow Jones; FTSE 100; BOVESPA; CAC 40; DAX; Hang Seng; Nikkei 225; SSE Composite. | The markets react to the information shared on Twitter in 0 to 10 days during the COVID-19 pandemic. |
| Smith and O’Hare (2022) [19] | The influence of daily news sentiment and Twitter sentiment from CEOs on the market performance of companies. | Time-lagged cross-correlations. | 23 companies included in S&P 500 Index. | Non-financial news sources have little influence on price movements, but financial news sentiment determines stock price movements. |
| Khan et al. (2022) [32] | The impact of social media and financial news on stock market prediction accuracy. | Machine learning algorithms. | S&P500 Index. | Using social media and financial news increases the accuracy of stock market predictions by 80.53% and 75.16%. |
| Maghyereh and Abdoh (2022) [20] | The role of market sentiment in predicting price bubbles. | SADF and GSADF approaches, probit approach. | US gold, silver, palladium, and platinum markets. | Including sentiment in the model improves the predictions of price bubbles of precious metals. |
| Han et al. (2022) [14] | Analysis of changes in US market sentiment. | Regression equations. | US. | Changes in sentiment persistence affect equity anomalies. |
| Sharaf et al. (2022) [36] | Analysis of stock news headlines in predicting the trend of stock during COVID-19. | Machine learning algorithms—Random Forest Classifier. | TSLA, AMZ, and GOOG stocks. | The accuracy for the prediction of TSLA, AMZ, and GOOG stocks increases by including the news sentiment. |
| Cevik et al. (2022) [29] | The relationship between investor sentiments and stock market returns and volatility. | Panel regression with fixed effects, panel quantile regressions, panel vector autoregression (PVAR) model. | G20 stock markets. | There is a significant relationship between investor sentiments and the stock market returns and volatility. |
| Wang et al. (2023) [37] | Investigating the stock trending prediction using technical indicators and social media sentiments. | Machine learning algorithms. | Shares GOOG, AMZN, AAPL, EBAY, C, and DJIA Index. | The stock market trending analysis is enhanced by integrating social opinions with technical indicators. |
| Chamberlain et al. (2023) [24] | Relationship between the stock market and news sentiment. | Fixed-effects panel regression. | S&P500 Index. | News sources are positively related to stock returns. |
| Kabiri et al. (2023) [11] | The role of sentiment in the US economy from 1920 to 1934. | Vector error correction model. | US. | The large role of sentiment was noted in the spread of industrial production, S&P 500, bank loans, and credit risk. |
| Type | 5 min | 15 min | Hourly | Daily | Monthly |
|---|---|---|---|---|---|
| Moving Averages | Strong Buy | Strong Buy | Strong Buy | Strong Buy | Buy |
| Technical Indicators | Strong Buy | Buy | Strong Buy | Strong Buy | Sell |
| Summary | Strong Buy | Strong Buy | Strong Buy | Strong Buy | Neutral |
| Variables | Construction | Sources |
|---|---|---|
| Dependent variables | ||
| News Sentiment (NS) | The methodology of construction of this index is based on Shapiro et al. (2020) [41] and the database is based on Buckman et al. (2020) [42]. | https://www.frbsf.org/economic-research/indicators-data/daily-news-sentiment-index/, accessed on 16 May 2023 |
| Independent variables | ||
| DJI Open Price (DJI_op) | The open price for all the stock market indices: DJI, GOOGL, AMZN, APPL, C, VIX. | www.stooq.com, accessed on 16 May 2023 |
| Google Open Price (GOOGL_op) | ||
| Amazon Open Price (AMZN_op) | ||
| Apple Open Price (AAPL_op) | ||
| C Open Price (C_op) | ||
| VIX Open Price (VIX_op) | ||
| DJI High Price (DJI_hi) | The high price for all the stock market indices: DJI, GOOGL, AMZN, APPL, C, VIX. | www.stooq.com, accessed on 16 May 2023 |
| Google High Price (GOOGL_hi) | ||
| Amazon High Price (AMZN_hi) | ||
| Apple High Price (AAPL_hi) | ||
| C High Price (C_hi) | ||
| VIX High Price (VIX_hi) | ||
| DJI Low Price (DJI_low) | The low price for all the stock market indices: DJI, GOOGL, AMZN, APPL, C, VIX. | www.stooq.com, accessed on 16 May 2023 |
| Google Low Price (GOOGL_low) | ||
| Amazon Low Price (AMZN_low) | ||
| Apple Low Price (AAPL_low) | ||
| C Low Price (C_low) | ||
| VIX Low Price (VIX_low) | ||
| DJI Close Price (DJI_cl) | The close price for all the stock market indices: DJI, GOOGL, AMZN, APPL, C, VIX. | www.stooq.com, accessed on 16 May 2023 |
| Google Close Price (GOOGL_cl) | ||
| Amazon Close Price (AMZN_cl) | ||
| Apple Close Price (AAPL_cl) | ||
| C Close Price (C_cl) | ||
| VIX Price (VIX_p) | ||
| DJI Volume Price (DJI_vol) | The volume price for all the stock market indices: DJI, GOOGL, AMZN, APPL, C, VIX. | www.stooq.com, accessed on 16 May 2023 |
| Google Volume Price (GOOGL_vol) | ||
| Amazon Volume Price (AMZN_vol) | ||
| Apple Volume Price (AAPL_vol) | ||
| C Volume Price (C_vol) | ||
| DJI Return (DJI_r) | Return = (close price − close price from the previous day)/open price | Own calculation. |
| Google Return (GOOGL_r) | ||
| Amazon Return (AMZN_r) | ||
| Apple Return (AAPL_r) | Change price for VIX. | |
| C Return (C_r) | ||
| VIX Change Price (VIX_ch) | ||
| Explanatory variables | ||
| Federal Funds Rate Variation (FFR_var) | Variation = (value n − value n0)/value n0 | Federal Reserve database. |
| Percentage points. | ||
| Inflation (INF) | Consumer Price Index. | Federal Reserve database. |
| Year-over-year percent change. | ||
| VAR Estimates | Bayesian VAR Estimates | ||||
|---|---|---|---|---|---|
| Variables | Coefficient | Std. Error | t-Statistic | Coefficient | Std. Error |
| NS (−1) | 1.163652 | 0.01202 | 96.8304 | 1.152396 | 0.01161 |
| NS (−2) | −0.168819 | 0.01198 | −14.0914 | −0.157583 | 0.01157 |
| C | −5.30 × 10⁻⁵ | 0.00039 | −0.13460 | −5.23 × 10⁻⁵ | 0.00039 |
| DJI_op | −3.47 × 10⁻⁶ | 2.6 × 10⁻⁶ | −1.33814 | −3.46 × 10⁻⁶ | 2.6 × 10⁻⁶ |
| DJI_hi | −4.43 × 10⁻⁶ | 2.2 × 10⁻⁶ | −1.97925 | −4.51 × 10⁻⁶ | 2.2 × 10⁻⁶ |
| DJI_low | 1.46 × 10⁻⁵ | 1.9 × 10⁻⁶ | 7.49530 | 1.47 × 10⁻⁵ | 1.9 × 10⁻⁶ |
| DJI_cl | −6.59 × 10⁻⁶ | 2.4 × 10⁻⁶ | −2.80213 | −6.64 × 10⁻⁶ | 2.4 × 10⁻⁶ |
| DJI_vol | 3.06 × 10⁻¹³ | 1.2 × 10⁻¹² | 0.24469 | 2.95 × 10⁻¹³ | 1.2 × 10⁻¹² |
| DJI_r | 0.049099 | 0.02728 | 1.80001 | 0.049626 | 0.02728 |
| FFR_var | 0.003169 | 0.00155 | 2.03804 | 0.003155 | 0.00155 |
| INF | 7.97 × 10⁻⁶ | 8.4 × 10⁻⁶ | 0.09524 | 7.46 × 10⁻⁶ | 8.4 × 10⁻⁵ |
| R-Squared: 0.996462 | R-Squared: 0.996461 | ||||
| Adjusted R-squared: 0.996457 | Adjusted R-squared: 0.996456 | ||||
| Prob (F-statistic): 188,550.8 | Prob (F-statistic): 188,550.8 | ||||
| Akaike AIC: −6.006387 | |||||
| Schwarz SC: −5.995215 | |||||
| VAR Estimates | Bayesian VAR Estimates | ||||
|---|---|---|---|---|---|
| Variables | Coefficient | Std. Error | t-Statistic | Coefficient | Std. Error |
| NS (−1) | 1.177690 | 0.01200 | 98.1611 | 1.165622 | 0.01159 |
| NS (−2) | −0.180663 | 0.01199 | −15.0631 | −0.168584 | 0.01158 |
| C | −0.000273 | 0.00032 | −0.86115 | −0.000271 | 0.00032 |
| GOOGL_op | 0.000353 | 0.00048 | 0.74041 | 0.000350 | 0.00048 |
| GOOGL_hi | −0.000968 | 0.00051 | −1.90429 | −0.000973 | 0.00051 |
| GOOGL_low | 0.001340 | 0.00049 | 2.70961 | 0.001354 | 0.00049 |
| GOOGL_cl | −0.000695 | 0.00048 | −1.44860 | −0.000701 | 0.00048 |
| GOOGL_vol | 1.12 × 10⁻¹² | 1.2 × 10⁻¹² | 0.93199 | 1.11 × 10⁻¹² | 1.2 × 10⁻¹² |
| GOOGL_r | 0.026976 | 0.00848 | 3.18019 | 0.027071 | 0.00848 |
| FFR_var | 0.003747 | 0.00156 | 2.39793 | 0.003738 | 0.00156 |
| INF | −7.68 × 10⁻⁵ | 9.6 × 10⁻⁵ | −0.79964 | −7.84 × 10⁻⁵ | 9.6 × 10⁻⁵ |
| R-Squared: 0.996416 | R-Squared: 0.996415 | ||||
| Adjusted R-squared: 0.996411 | Adjusted R-squared: 0.996410 | ||||
| Prob (F-statistic): 186,042.9 | Prob (F-statistic): 186,014.6 | ||||
| Akaike AIC: −5.993464 | |||||
| Schwarz SC: −5.982288 | |||||
| VAR Estimates | Bayesian VAR Estimates | ||||
|---|---|---|---|---|---|
| Variables | Coefficient | Std. Error | t-Statistic | Coefficient | Std. Error |
| NS (−1) | 1.178937 | 0.01202 | 98.1205 | 1.166783 | 0.01161 |
| NS (−2) | −0.181313 | 0.01201 | −15.0930 | −0.169147 | 0.01160 |
| C | 0.000257 | 0.00033 | 0.79134 | 0.000264 | 0.00033 |
| AMZN_op | 0.000708 | 0.00031 | 2.28082 | 0.000714 | 0.00031 |
| AMZN_hi | −0.000593 | 0.00035 | −1.71727 | −0.000598 | 0.00035 |
| AMZN_low | −0.000145 | 0.00029 | −0.49574 | −0.000144 | 0.00029 |
| AMZN_cl | 3.60 × 10⁻⁵ | 0.00030 | 0.11915 | 3.33 × 10⁻⁵ | 0.00030 |
| AMZN_vol | −1.32 × 10⁻¹² | 1.7 × 10⁻¹² | −0.78926 | −1.36 × 10⁻¹² | 1.7 × 10⁻¹² |
| AMZN_r | 0.004738 | 0.00641 | 0.73879 | 0.004861 | 0.00641 |
| FFR_var | 0.003586 | 0.00156 | 2.29168 | 0.003576 | 0.00156 |
| INF | −8.43 × 10⁻⁵ | 8.4 × 10⁻⁵ | −1.00724 | −8.61 × 10⁻⁵ | 8.4 × 10⁻⁵ |
| R-Squared: 0.996406 | R-Squared: 0.996405 | ||||
| Adjusted R-squared: 0.996400 | Adjusted R-squared: 0.996400 | ||||
| Prob (F-statistic): 185,573.4 | Prob (F-statistic): 185,544.9 | ||||
| Akaike AIC: −5.990582 | |||||
| Schwarz SC: −5.979409 | |||||
| VAR Estimates | Bayesian VAR Estimates | ||||
|---|---|---|---|---|---|
| Variables | Coefficient | Std. Error | t-Statistic | Coefficient | Std. Error |
| NS (−1) | 1.175910 | 0.01200 | 97.9977 | 1.163969 | 0.01159 |
| NS (−2) | −0.178680 | 0.01200 | −14.8933 | −0.166725 | 0.01159 |
| C | 0.000205 | 0.00032 | 0.63402 | 0.000208 | 0.00032 |
| APPL_op | 0.001176 | 0.00038 | 3.09220 | 0.001184 | 0.00038 |
| APPL_hi | −0.001714 | 0.00042 | −4.12533 | −0.001727 | 0.00042 |
| APPL_low | 0.00232 | 0.00036 | 0.64637 | 0.000236 | 0.00036 |
| APPL_cl | 0.000328 | 0.00036 | 0.90507 | 0.000330 | 0.00036 |
| APPL_vol | −4.13 × 10⁻¹³ | 4.3 × 10⁻¹³ | −0.96770 | −4.16 × 10⁻¹³ | 4.3 × 10⁻¹³ |
| APPL_r | 0.023721 | 0.00820 | 2.89151 | 0.024024 | 0.00820 |
| FFR_var | 0.003787 | 0.00156 | 2.42305 | 0.003780 | 0.00156 |
| INF | −5.85 × 10⁻⁵ | 0.00010 | −0.57768 | −6.11 × 10⁻⁵ | 0.00010 |
| R-Squared: 0.996421 | R-Squared: 0.996420 | ||||
| Adjusted R-squared: 0.996415 | Adjusted R-squared: 0.996415 | ||||
| Prob (F-statistic): 186,380.7 | Prob (F-statistic): 186,352.9 | ||||
| Akaike AIC: −5.994852 | |||||
| Schwarz SC: −5.983681 | |||||
| VAR Estimates | Bayesian VAR Estimates | ||||
|---|---|---|---|---|---|
| Variables | Coefficient | Std. Error | t-Statistic | Coefficient | Std. Error |
| NS (−1) | 1.179314 | 0.01201 | 98.2134 | 1.167135 | 0.01160 |
| NS (−2) | −0.181969 | 0.01200 | −15.1597 | −0.169780 | 0.01159 |
| C | −0.000379 | 0.00050 | −0.76087 | −0.000385 | 0.00050 |
| EBAY_op | −0.000813 | 0.00072 | −1.12230 | −0.000809 | 0.00072 |
| EBAY_hi | −0.000506 | 0.00076 | −0.66517 | −0.000516 | 0.00076 |
| EBAY_low | 0.001933 | 0.00082 | 2.36813 | 0.001941 | 0.00082 |
| EBAY_cl | −0.000567 | 0.00079 | −0.71527 | −0.000568 | 0.00079 |
| EBAY_vol | 5.51 × 10⁻¹² | 8.7 × 10⁻¹² | 0.63066 | 5.62 × 10⁻¹² | 8.7 × 10⁻¹² |
| EBAY_r | −0.002245 | 0.00909 | −0.24686 | −0.002243 | 0.00909 |
| FFR_var | 0.003529 | 0.00156 | 2.25650 | 0.003520 | 0.00156 |
| INF | −0.000107 | 8.4 × 10⁻⁵ | −1.28489 | −0.000110 | 8.4 × 10⁻⁵ |
| R-Squared: 0.996406 | R-Squared: 0.996406 | ||||
| Adjusted R-squared: 0.996401 | Adjusted R-squared: 0.996401 | ||||
| Prob (F-statistic): 185,609.4 | Prob (F-statistic): 185,580.7 | ||||
| Akaike AIC: −5.990758 | |||||
| Schwarz SC: −5.979585 | |||||
| VAR Estimates | Bayesian VAR Estimates | ||||
|---|---|---|---|---|---|
| Variables | Coefficient | Std. Error | t-Statistic | Coefficient | Std. Error |
| NS (−1) | 1.177807 | 0.01201 | 98.0878 | 1.165644 | 0.01160 |
| NS (−2) | −0.182348 | 0.01200 | −15.2018 | −0.170175 | 0.01159 |
| C | 0.000581 | 0.00038 | 1.52706 | 0.000592 | 0.00038 |
| C_op | 0.000135 | 0.00012 | 1.16126 | 0.000134 | 0.00012 |
| C_hi | −0.000237 | 0.00011 | −2.13100 | −0.000237 | 0.00011 |
| C_low | 0.000215 | 0.00012 | 1.78050 | 0.000217 | 0.00012 |
| C_cl | −0.000108 | 0.00013 | −0.83254 | −0.000109 | 0.00013 |
| C_vol | −1.43 × 10⁻¹¹ | 7.0 × 10⁻¹¹ | −2.03519 | −1.44 × 10⁻¹¹ | 7.0 × 10⁻¹² |
| C_r | 0.001564 | 0.00563 | 0.27797 | 0.001597 | 0.00563 |
| FFR_var | 0.003672 | 0.00156 | 2.34806 | 0.003662 | 0.00156 |
| INF | −0.000129 | 7.8 × 10⁻⁵ | −1.65558 | −0.000131 | 7.8 × 10⁻⁵ |
| R-Squared: 0.996416 | R-Squared: 0.996415 | ||||
| Adjusted R-squared: 0.996411 | Adjusted R-squared: 0.996410 | ||||
| Prob (F-statistic): 185,962.4 | Prob (F-statistic): 185,933.7 | ||||
| Akaike AIC: −5.992932 | |||||
| Schwarz SC: −5.981751 | |||||
| VAR Estimates | Bayesian VAR Estimates | ||||
|---|---|---|---|---|---|
| Variables | Coefficient | Std. Error | t-Statistic | Coefficient | Std. Error |
| NS (−1) | 1.67224 | 0.01200 | 97.2460 | 1.155662 | 0.01160 |
| NS (−2) | −0.174427 | 0.01196 | −14.5820 | −0.162878 | 0.01156 |
| C | 0.002945 | 0.00051 | 5.76590 | 0.002962 | 0.00051 |
| VIX_p | 0.000459 | 0.000222 | 2.11569 | 0.000455 | 0.00022 |
| VIX_op | −0.000191 | 0.00019 | −0.98205 | −0.000189 | 0.00019 |
| VIX_hi | −0.000673 | 0.00016 | −4.18861 | −0.000680 | 0.00016 |
| VIX_low | 0.000306 | 0.00021 | 1.43700 | 0.000314 | 0.00021 |
| VIX_ch | −0.006745 | 0.00294 | −2.29529 | −0.006635 | 0.00294 |
| FFR_var | 0.002796 | 0.00156 | 1.79824 | 0.002782 | 0.002782 |
| INF | −5.71 × 10⁻⁵ | 7.5 × 10⁻⁵ | −0.76489 | −5.85 × 10⁻⁵ | 7.5 × 10⁻⁵ |
| R-Squared: 0.996460 | R-Squared: 0.996460 | ||||
| Adjusted R-squared: 0.996455 | Adjusted R-squared: 0.996455 | ||||
| Prob (F-statistic): 209,369.0 | Prob (F-statistic): 209,339.8 | ||||
| Akaike AIC: −6.005934 | |||||
| Schwarz SC: −5.995775 | |||||
Disclaimer/Publisher’s Note: The statements, opinions and data contained in all publications are solely those of the individual author(s) and contributor(s) and not of MDPI and/or the editor(s). MDPI and/or the editor(s) disclaim responsibility for any injury to people or property resulting from any ideas, methods, instructions or products referred to in the content. |
© 2023 by the authors. Licensee MDPI, Basel, Switzerland. This article is an open access article distributed under the terms and conditions of the Creative Commons Attribution (CC BY) license (https://creativecommons.org/licenses/by/4.0/).
Share and Cite
Dumiter, F.C.; Turcaș, F.; Nicoară, Ș.A.; Bențe, C.; Boiță, M. The Impact of Sentiment Indices on the Stock Exchange—The Connections between Quantitative Sentiment Indicators, Technical Analysis, and Stock Market. Mathematics 2023, 11, 3128. https://doi.org/10.3390/math11143128
Dumiter FC, Turcaș F, Nicoară ȘA, Bențe C, Boiță M. The Impact of Sentiment Indices on the Stock Exchange—The Connections between Quantitative Sentiment Indicators, Technical Analysis, and Stock Market. Mathematics. 2023; 11(14):3128. https://doi.org/10.3390/math11143128
Chicago/Turabian StyleDumiter, Florin Cornel, Florin Turcaș, Ștefania Amalia Nicoară, Cristian Bențe, and Marius Boiță. 2023. "The Impact of Sentiment Indices on the Stock Exchange—The Connections between Quantitative Sentiment Indicators, Technical Analysis, and Stock Market" Mathematics 11, no. 14: 3128. https://doi.org/10.3390/math11143128
APA StyleDumiter, F. C., Turcaș, F., Nicoară, Ș. A., Bențe, C., & Boiță, M. (2023). The Impact of Sentiment Indices on the Stock Exchange—The Connections between Quantitative Sentiment Indicators, Technical Analysis, and Stock Market. Mathematics, 11(14), 3128. https://doi.org/10.3390/math11143128