Article

Activities with BBC micro:bit as a Foundation for Statistical Reasoning of Lower-Secondary Students

1
Department of Mathematics, Faculty of Natural Sciences and Informatics, Constantine the Philosopher University in Nitra, Tr. A. Hlinku 1, 949 01 Nitra, Slovakia
2
Department of Informatics, Faculty of Natural Sciences and Informatics, Constantine the Philosopher University in Nitra, Tr. A. Hlinku 1, 949 01 Nitra, Slovakia
3
Department of Physics, Faculty of Natural Sciences and Informatics, Constantine the Philosopher University in Nitra, Tr. A. Hlinku 1, 949 01 Nitra, Slovakia
*
Authors to whom correspondence should be addressed.
Mathematics 2023, 11(14), 3206; https://doi.org/10.3390/math11143206
Submission received: 23 May 2023 / Revised: 17 July 2023 / Accepted: 19 July 2023 / Published: 21 July 2023
(This article belongs to the Section Mathematics and Computer Science)

Abstract

:
Computational thinking is considered a set of skills necessary for living and working in today’s society. It has recently become part of mathematics curricula in several European countries. In this study, we offer a glimpse into the informal classroom where statistical reasoning and computational thinking are developed simultaneously. The student–teacher discussion was analysed and categorised. The dialogue dealt with both statistical and computational thinking. Implying from the nature of the activity, sources of errors and variation in data were discussed and ways to overcome the errors were discussed. The discussions related to computational thinking mainly addressed the work with BBC micro:bit, whether with the manipulation and hardware of the coding. A variable was used from both perspectives, as a mathematical concept and as an entity used to store the information. We identified the notion of a variable as the intersection between statistics and computational thinking.

1. Introduction

Over the past three decades, computers have become an everyday part of our lives. There is a lot of controversy about how much time students should spend with computers and technology. However, in addition to the amount of time, the nature of the activities that students do with computers, tablets or other technologies is also important. Very often they are playing computer games or passively watching videos on different platforms, while at the same time not being able to use the computing power of the devices in a productive way, e.g., to solve different problems [1,2]. This fact may be one of the reasons why Jeannette M. Wing’s [3] brief appeal that the use of computers in problem-solving should not be the prerogative of programmers only and that in today’s world it should be considered a literacy as important as reading, writing or mathematics has been accepted in various communities dedicated to teaching, especially mathematics teaching. Lessner [4] introduced the concept of computational thinking as “the ability to think like a computer scientist when solving problems.” (p. 72). Computational thinking was first defined by Papert [5]. His pioneering contributions have been seminal in establishing computational thinking as an essential component of education. Papert elaborated on the profound effect of computational thinking on cognitive development. Drawing on constructivist theories and Piagetian psychology, Papert argued that engagement with computational tools enables learners to actively construct mental models, fostering creativity, problem-solving skills and conceptual understanding. Learners could embody mathematical and logical concepts, enabling a deep and intuitive understanding of abstract ideas. Cuny, Snyder and Wing [6] define computational thinking as the ability to solve problems using computers; more specifically, computational thinking is “the thought processes involved in formulating problems and solving them in such a way as to enable that solution to be performed efficiently by information processing agents” (as cited in [3], p. 1). The information processing agent may or may not be a computer. In many cases, it is necessary to split the problem into smaller ones or to reformulate it in order to solve it. The fundamental skills associated with computational thinking include the ability to understand which aspects of a problem are machine-solvable, to evaluate the fit between the problem and the computational means, to understand the capabilities and limitations of the computational means, to apply or to proactively adapt the computational means (technical means or abstract procedures and theoretical results) in a new way or in a new situation and to apply the computational strategies to a different domain.
However, computational thinking is neither pure computer science nor programming [7]. Although computational thinking is derived from computer science because it also focuses on transferring computer science approaches for solving non-programming tasks [8]. Barcelos and Silveira [9] identified three sets of skills that can be developed when carrying out activities involving both mathematical and computational thinking. The first group is the choice of an appropriate representation and its semiotic relation to algorithms. The second set of skills relates to the ability to recognise relationships and patterns. The third group involves working with descriptive and representational models that are based on mathematical models of the situation. Bocconi et al. [10] analysed the works of several authors, from which they selected six basic computational thinking skills: (1) abstraction; (2) algorithmic thinking (algorithmisation); (3) automation; (4) decomposition; (5) debugging; (6) generalization.
Particular attention should be paid to the use of hardware in activities that develop computational thinking. The BBC micro:bit is a pocket-sized computer operated by the program coded mainly using the block-coding system or Micropython. One of the main features of this tool is that it encapsulates several physical inputs based on light and sound intensity, acceleration and temperature (built-in sensors) and physical outputs, such as display and sound. Using the antenna, micro:bits could be remotely connected to each other on the same ‘frequency’. This makes the micro:bit tangible and easy to use to engage the students in the physical computing [11]. It is also possible to link it to the Scratch environment to remotely control the sprites.

1.1. Identifying Errors and Sources of Variation

American researcher in statistics education Milo Schield [12] defines statistical literacy as the ability to think critically about numbers and about statistics in reasoning. According to the OECD (2013), statistical literacy is the ability to read and interpret statistical data, to use basic statistical concepts and understand their meaning but also to think critically when dealing with different representations of statistical information placed in different contexts. It is an individual’s ability to recognise and understand the role of statistics in the world, to use statistics and to engage with them in ways that meet the needs of living as a constructive and reflective citizen in an information society. One of the popular methods of teaching statistics, which is also recommended by the national curriculum, is the statistical survey carried out by students. A statistical survey, whether a student survey or a scientific paper, consists of four steps (asking a question, collecting data, analysing data and drawing conclusions). Although the process is modelled as linear, there is often a need to backtrack one step during the process [13]. Several studies [14] have confirmed that when students perform their own statistical investigations and, therefore, are actively engaged in data collection, this serves as intrinsic motivation for further work with the data. In this paper, we will focus on sources of variation and measurement errors in statistics education at the secondary level and explore ways to teach these concepts effectively. Sources of variation refer to the different factors that can influence the outcome of an experiment or study. These factors can include random variation, systematic variation and environmental variation. Understanding sources of variation is important because it helps students to recognize that not all variation is significant and that some variation is expected and unavoidable [15,16].
Measurement errors are another important topic in statistics education. These errors can occur when there are inaccuracies or inconsistencies in the measurement process. There are two types of measurement errors: systematic errors and random errors. Systematic errors occur when there is a consistent bias in the measurements, while random errors occur when there is a random component to the errors. To teach students about measurement errors, teachers should provide examples and hands-on activities that illustrate how errors can occur in real-world situations. They should also teach students about the different types of measurement errors and how to identify and correct them.

1.2. Computational Thinking in Mathematics Education

Computational thinking is very much related to mathematical and statistical thinking and including activities to develop computational thinking in mathematics and statistics education can be beneficial for the development of both computational and mathematical thinking. The algorithmic approach to solving mathematical problems will provide students with a new set of strategies and methods for solving mathematical problems and vice versa, mathematical problems provide a suitable context for learning the concepts of computational thinking [17]. Coding in mathematics classes not only fosters a deeper understanding of mathematical concepts but also cultivates creativity and computational thinking. Furthermore, programming allows for the exploration of complex mathematical problems that might be challenging to solve manually [18]. The relationship between mathematical and computational thinking is of utmost importance, particularly in the context of statistics. Statistical analysis involves not only the manipulation and interpretation of data but also the utilization of computational tools and algorithms to derive meaningful insights [19]. Mathematical thinking provides the foundation for understanding statistical concepts and reasoning, enabling students to formulate hypotheses, design experiments and make inferences [20,21]. Computational thinking, on the other hand, equips students with the necessary skills to effectively collect, organize, and analyse data using computational tools and programming languages [18]. By integrating mathematical and computational thinking in statistics education, students can develop a holistic understanding of statistical concepts, enhance their problem-solving abilities and gain proficiency in data analysis, ultimately preparing them for the increasingly data-driven world we live in [18,22,23].
According to Kallia et al. [24], the relationship between mathematical and computational thinking can be studied in two ways: by comparing their contextualization process in mathematical and computational problem solving and by examining their interaction in mathematical problem solving. Weintrop and colleagues [19] described the components of computational thinking directly with an emphasis on its use in mathematics and science teaching. They defined four categories: working with data; modelling and simulation; computational problem solving; a systems approach. The component working with data related to statistical literacy consists of five parts: (1) data collection, i.e., use of data collection tools (design of collection method, data registration and data storage); (2) data generation, generation of data with given properties (probability distribution) for simulations; (3) data manipulation, working with large and complex datasets: sorting, filtering, cleaning, normalising and merging different datasets; (4) data analysis, analysing data for use in mathematics or various sciences: finding patterns and anomalies, categorising data, identifying trends and co-relationships; (5) data visualization, i.e., communicating results, designing and implementing visual outputs. All of these components are related to statistical literacy.
In conclusion, teaching students about sources of variation and measurement error is crucial for their statistical literacy. By understanding these concepts, lower-secondary students can better analyse and interpret data and make informed decisions in their personal and professional lives. Teachers should use a variety of methods to teach these concepts, including examples, hands-on activities and statistical models. By doing so, they can help their students develop the skills and knowledge they need to succeed in the modern world.
There are only a few intervention studies combining the focus on developing computational thinking and the focus on mathematical knowledge in statistics education. In this study, we sought to answer the following research questions:
  • What aspects of the activities are addressed by lower-secondary students while working on statistical investigations with the BBC micro:bit?
  • What sources of variation and what errors in measurement are lower-secondary students able to identify while engaging in the activities?
  • What suggestions for eliminating errors can lower-secondary students identify from their activities?

2. Materials and Methods

The reported study is part of a larger design-based research project aimed at designing interventions to support the development of scientific thinking in lower-secondary school students. The participants attend the university once a week in the form of an out-of-school club and participate in various STEM activities. The session presented is one of a series of 6 activities using the BBC micro:bit. All the BBC micro:bit sessions followed the same structure: introduction, devolution, independent student work and institutionalisation of new knowledge. The sessions were facilitated by two teachers. The expert in computational thinking activities, experienced teacher and teacher educator (Teacher 1) co-taught the session with the pre-service teacher of mathematics and informatics (Teacher 2). The agency for the sessions belonged to Teacher 1; the role of Teacher 2 was to support, observe and contribute with his suggestions when necessary.
The three cognitive objectives were defined for each session: (1) hardware: the parts and the control of the device; (2) computational thinking: one or more aspects of computational thinking according to Bocconi et al. [10] were chosen in order to shape the design of the activity; (3) mathematics: the mathematical knowledge developed through the activity. In this study, we will focus on the analysis of a specific session of the out-of-school club described above.

2.1. Description of the Activity

The activity analysed in this study was initially designed as an activity for the development of computational thinking of lower-secondary students and was piloted with 81 participants of grade 7 in June 2021 during an event Teaching informatics with the support of hardware devices. In the pilot round, the whiteboard was used to store the information during the pedometer test. Although the initial aim of the activity was to teach programming, in particular the concept of variables, during the pilot we realised that creating the table provides affordances for statistical reasoning, discussing the correctness of the code and debugging. The second pilot was held during the summer camp in August 2021 (40 participants, grades 5 to 9). On this occasion, the BBC micro:bit pedometer activity included the creation of the table with the steps counted by the participants and the subsequent identification of the different types of errors that occurred during the data collection. In the analysed session, we decided to build on previous experience and use an Excel file to collect data from participants. The set of questions to stimulate the discussion about errors was prepared in advance.
The analysed session aimed at developing statistical literacy, in particular dealing with measurement errors using computational thinking skills such as abstraction, automation or debugging. We started with the counting problem. The students had to think of a way to count the people in the room. We discussed that if a certain number of people come in, we have to add that number and if a certain number of people leave the room, we have to subtract that number. We then discussed that on the BBC micro:bit. We can add one at a time on the BBC micro:bit, using button A, we can subtract one at a time, using button B, we can display the number of people using both buttons A + B at the same time. The previous discussion led us to the problem that in order to add to the number of people, subtract from the number of people or display the number of people in the room, we need to store this information/data somewhere.
Using the metaphor of a piggy bank, we explained to the students the concept of a variable, that it is a place where we keep the information about the number of something stored over the course of time. After introducing the variable, we discussed what the code should look like and worked on it together. When the code was finished, the students uploaded it to the BBC micro:bit device and tested it. When the code worked, they were given another task.
The next task was to construct a pedometer. The students were asked to design a BBC micro:bit device as a pedometer. As part of this task, we discussed which commands to use and when to add the steps. We also explained what an accelerometer is and that the BBC micro:bit device has one implemented as standard so we could use it for this task. Next, we discussed where to attach the BBC micro:bit device. We agreed that the best place was on the foot. We then took the students into the corridor where they were asked to attach the pedometer to their leg using office rubber bands. Once they had the pedometer attached to their foot, they were asked to switch it on and count their steps in their heads, and the pedometer counted them as well. We wrote this data down in a table and compared it. We found that in most cases the data were quite different. We had a discussion about the factors that might have influenced these results. We came up with some such as: stride length, speed of movement of the leg, whether the students only counted the leg on which they had the BBC micro:bit device, etc. However, from the discussion, we found that the majority counted both feet, so the number of steps counted by the BBC micro:bit device was about half of what the students counted. The students were then asked to correct the code so that it counted both feet. After a short while, the students realised that they needed to multiply the number by two. They then went back to check their corrected code again.

2.2. Participants

The activity was implemented as part of an intervention programme for the development of scientific thinking, which involved a group of 13 students aged 10–14 years during the school year 2022/2023. They are students from grades 5–9 from different lower-secondary schools in Nitra, four girls and nine boys. The participating students were of different grades and were included in the programme based on their interest. They were not chosen by their results in mathematics and/or science, so their abilities differ not only because of the effect of schooling. The activity took part after the lessons devoted to mathematics, geography and biology in the block of six lessons focused on computational thinking using the BBC micro:bit device. The described activity was the second one, following the introductory lesson where BBC micro:bit was introduced. Informed consent was obtained from the participants and their parents. They agreed to the recording, processing and publication of the sessions.

2.3. Data and Analysis

The session was videotaped, fully transcribed and analysed using grounded theory. Grounded theory is an approach to qualitative data analysis that enables the search for and conceptualisation of the latent social patterns and structures of an area of interest through a process of constant comparison. Grounded theory methods are essentially a set of flexible analytical directions that allow researchers to focus on data collection and inductive theory building through sequential data analysis and conceptual development.
Grounded theory is a strategic research method that provides tools for understanding how individuals, organisations or communities experience and respond to upcoming events. Theory is generated during the research process through the gradual interplay between data collection and analysis [25]. In the first step of data analysis, an inductive approach is used to generate factual codes from the data; later, the developing theory emerges from how to proceed with data collection and what more specific questions to ask. This is the deductive phase of the grounded theory process.
The purpose of grounded theory is to find out from the participants “what is going on” in a chosen important area. The researcher should give the participants space to identify what their basic needs are. The participants themselves should use their needs to tell the researcher what to study. Once the researcher understands the basic needs of the participants in the area, the researcher begins and over the next period of time explores how they can meet these needs. Such a theory is called grounded theory because it is a theory based on data [26].
Coding in grounded theory is the process of analysing data. As a process within grounded theory, data analysis involves the researcher as an actor in the process. They are the people who intervene, manipulate, act, conceptualise and use specific techniques to create or discover the theory. They engage in a process of intervention that follows the stages or procedures of extracting theory from the raw data. In grounded theory, the primary intervention in the data is coding, and although both Glaser and Strauss [27] use the word coding, they present it differently [28].
The process of grounded theory research begins with an analysis of the original data collected (open coding). The researcher should then begin a process of examining the data collected, looking for similarities and differences and forming categories based on the data. As the codes begin to accumulate, the researcher should begin to perceive relationships between them (axial coding). Concepts are reduced and abstracted to a higher level and then combined into larger categories. This is followed by the selection of a core category into which all other major categories can be placed (selective coding). The sampling process continues until theoretical saturation is reached, a point at which no new emergent concepts can be developed [25].
The lesson transcript was broken down into meaningful units (not necessarily sentences) and initial codes were assigned to them (open coding). Some initial codes included data, step size, charging, leg count, micro:bit, etc. Once the open coding process was complete, we began to explore the relationships between the codes and identify broader themes or categories. This step involved making connections between the initial codes and finding patterns within the data. For instance, in a category labelled as ‘Statistics’ themes data collection methods, factors affecting dependence and leg count variations were identified. The final step, selective coding, focused on refining and integrating the identified themes. The most relevant themes were identified and their significance to the data was considered. The codes and themes were organized in a meaningful and coherent manner and a framework was developed.

3. Results and Discussion

Based on the ground theory analysis, the individual utterances in the open coding were grouped according to their relationship to the information addressed, resulting in six categories. We further grouped these into three domains: statistics, working with the BBC micro:bit, and, at the intersection of the domains, categories for working with the variable (Figure 1).

3.1. Statistics

The first two subcategories deal with statistics. The first deals with sources of error that may have affected the measurement results as seen by the students. The following vignette illustrates a dialogue between teacher 2 and a student in the domain of statistics. After conducting the pedometer test, the data were collaboratively recorded in a table and projected. The students always dictated their names, how many steps they counted and how many steps the BBC micro:bit device counted and Teacher 2 put the information into the prepared table. Then, based on the teacher’s question, one of the students realised that two approaches to step-counting could be used (Table 1).
A few students raised their hands, and the teachers marked them on the board. They then asked further questions of the students, focusing on other sources of error (Table 2).
The teachers decided to concentrate on other sources of error and come back to this one later because we thought it was the easiest one to eliminate. So, we moved on to other questions. Some of the students changed the size (length) of their feet, so we focused on that (Table 3).
The session continued with suggestions to the students by illustrating what could affect the number of steps recorded (Table 4).
In doing so, the teachers have checked most of the sources of error that could have affected the number of steps counted by the pedometer in the form of the BBC micro:bit device.

3.2. Handling Variables

In the domain of handling variables, at the intersection of mathematical and computational thinking, we observed two types of students’ comments. The first one was related to the variable from a mathematical perspective. We present an excerpt from a conversation between the teacher and students that followed immediately after the introductory action–activity. The students did not program the device themselves but worked in a “use-modify-create” style. In the first step, the students were shown the program from the last lesson, when the students had learned to work with buttons but had not yet worked with a variable. Handling the variable was conducted after programming the BBC micro:bit device, so that when the A button was pressed, the value of the variable would increase by one and when the B button was pressed, it would decrease (Table 5).
Teacher 1 tried to check whether the students understood what the finished program was supposed to look like and how the values of the variable changed for each button event. Then, Teacher 1 asked the students whether they knew the concept of a variable. The students were not familiar with the term, so Teacher 1 began to explain it to them (Table 6).
The teacher checked that they could see how the value of the variable changed for each event.
The second type of student comments is about the variable from the programming point of view of the BBC micro:bit device. After explaining the concept, Teacher 1 continued by demonstrating how to create a variable and then work with it in the block programming language of the BBC micro:bit device (Table 7).
The intention of the discussion was not only to assure that the students knew how to work with the variable but that they knew how to name it correctly, which is very important in programming. Teacher 2 showed the students how to connect the variable to the impulses/events from outside (from the hardware), besides the correct way to work with the variable (Table 8).
The discussion was not just about how to increase or decrease the variable but also how to reset the variable, which Teacher 1 later checked to see if the students knew how to do when testing the pedometer.
After programming the counter, the teacher progresses only when they see students know how to work with the variable. Even though the following discussion addresses the handling of variables, the point of view is different (Table 9).
The question was whether or not the students would realise that they would only have a sensor on one leg and, therefore, I would only count half of their steps. At this point, they had not realised that yet.

3.3. Manipulation with BBC micro:bit

The next category of issues raised during the session was manipulation of the BBC micro:bit device. There were two sub-categories in this category, one related to the hardware of the BBC micro:bit device and the other related to the coding of the device. The following vignette illustrates the dialogue around the hardware issues.
Teacher 1 asked the students, as a refresher from the previous lesson, how to work with the counter on the BBC micro:bit device, i.e., to increment the counter, decrement the counter and display the current value on the screen (Table 10).
After solving this problem, another problem became apparent to the teachers. Namely, that although the students knew what they were adding/increasing, subtracting/decreasing and displaying, they still did not have a procedure to store the value and manipulate it (as discussed in the subsection about handling variables). Teacher 1 pointed out not only the programming aspect but also the correct way to enter instructions with his example (Table 11).
Teacher 1 wanted the students to understand that incorrect manipulation of the hardware could lead to incorrect results, regardless of the correctness of the software. In the analysed session, the software also had to be adjusted.
Having understood how to work with variables as such, the students needed to understand how to work with them at a programming level. The teacher used prior knowledge to help the students answer their questions (Table 12).
Teacher 1 then checked that the students had completed this correctly. The teacher then moved on to the hardware side of the BBC micro:bit device. He used real-life examples, including a demonstration, to remind the students what a gesture is (Table 13).
In the present study, we focused on the type of discussion that took place in the informal classroom while implementing the activity, which focused simultaneously on two objectives: developing mathematical skills in statistics, in particular identifying and overcoming sources of error, and computational thinking skills, in particular automation and debugging. Both mathematical and computational issues were discussed during the activity. We perceived the discussion on variable handling as being at the intersection of the two main domains. The paper analyses the discussion that took place during the implementation of the pedometer activity. The aim of the activity was to show the students the different errors that can occur when collecting data. Students created a pedometer using a BBC micro:bit and worked out the length of a given distance in steps. Students were able to successfully identify different types of errors that can occur when collecting data (maths) and suggest ways to eliminate the identified errors.
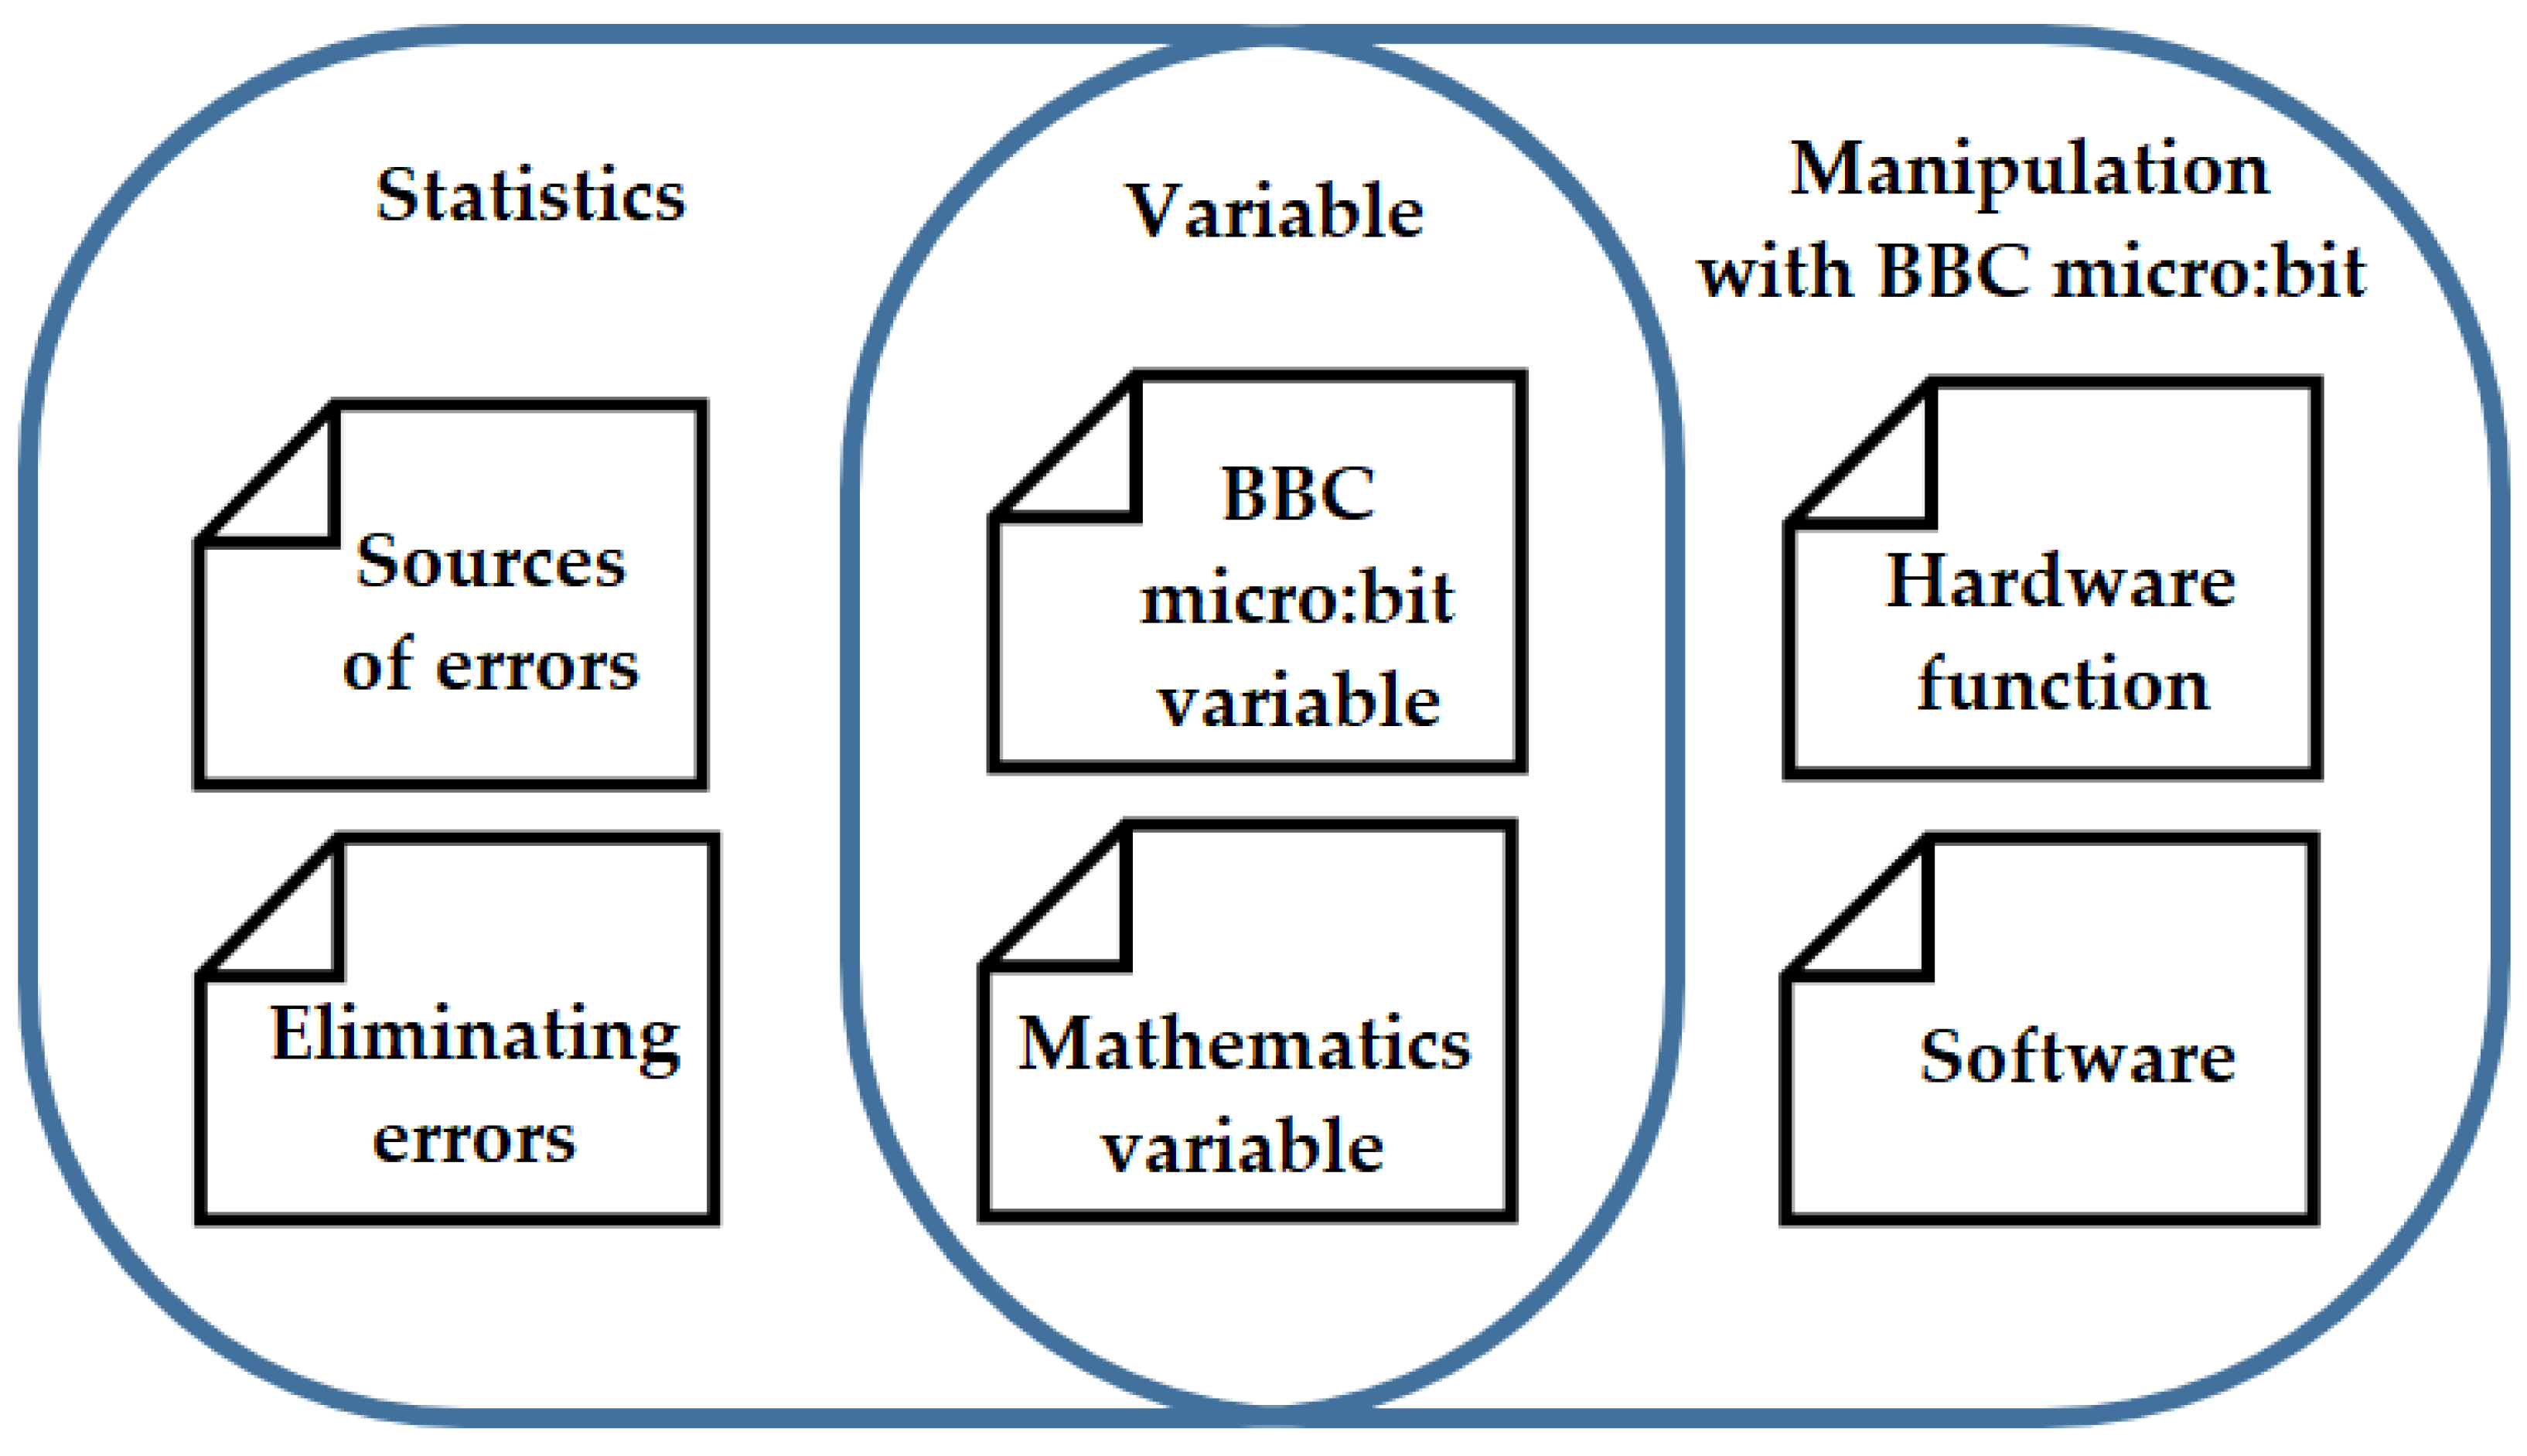
The data collection in our case was counting steps on a given route, using a pedometer made from a BBC micro:bit and manipulating a variable at the same time (computing). From the implementation of this activity, we analysed selected samples of student–teacher interviews illustrating different aspects of the implementation of the activity: mathematics teaching and computational thinking. We identified three main categories, each of which consisted of two subcategories. The statistics category contained the subcategories error sources and error removal, and the variable category contained the subcategories variable in the BBC micro:bit and variable—mathematics and talk in the last subcategory. Working with the BBC micro:bit, we divided into questions related to software and hardware and manipulations.
Our findings illustrate the introduction and understanding of variables in the context of mathematical and computational thinking. The analogy of a piggy bank and the concept of a variable as a container for storing and manipulating values is consistent with research on the introduction of variables in programming education. Studies highlight the importance of effective strategies for teaching variables, including providing relevant and relatable examples and facilitating students’ understanding of how variables store and change values [29,30].
Students and teachers during the analysed lesson mentioned potential sources of error in the pedometer activity, such as variations in step counting due to counting one leg or both legs and differences in step length. These sources of error align with the concept of measurement error, which refers to the variability between the measured values and the true values of a quantity. Research on measurement error emphasizes the importance of identifying and addressing sources of error to improve the accuracy and reliability of measurements [31]. Allowing students to do their own mistaken code increasing the step counter only once in two steps made by the left and right leg, offering the opportunity to discuss automation of data collections, identifying the measurement error and debugging the provided code.
In the activity, the students dealt with several parts of components working with data as defined by Weintrop et al. [19]. Pupils first collected the data using the BBC micro:bit, then their findings were put together in a table to share their results. Whole-class discussion was facilitated in the way allowing the analysis of collected, particularly focusing on finding patterns and anomalies which led to identifying the error when counting steps, debugging the BBC micro:bit code and repeating the process again. This iterative process of problem-solving and reusing the code is very typical for computer science and is considered a practice typical for computational thinking [32].
The discussions also touched upon programming the device to increment or decrement a counter using buttons, displaying values on the micro:bit’s screen, and responding to gestures such as shaking. These findings align with research on physical computing and tangible interfaces, where learners engage with programmable devices to create interactive experiences by manipulating hardware components and writing code [33,34]. Based on our study, it appears that students perceive several limitations with the hardware. We can summarize that all expected limitations of hardware (e.g., sensor accuracy and sensitivity and principle of gestures) and limitations of software (e.g., updating the value of variables) for this activity were completely recognized by the students during the debugging process. In addition to identifying limitations with the hardware, BBC micro:bit, our study also found that students were able to develop solutions to address some of the limitations they identified and they were able to modify the device’s program to improve its accuracy. The hardware limitations in education are challenging not only for using the BBC micro:bit [35,36], but also for using other microcontroller [37] or different platforms.
Furthermore, the computational thinking skills as defined by Bocconi et al. [10] are not restricted for manipulation with BBC micro:bit, but they can be found in each of the described categories of the students’ speeches during the activity. The abstraction revealed with the work of variable, algorithmic thinking in coding the device, automation started in mathematics and continued to code. The problem was decomposed into smaller ones to count the steps using the BBC micro:bit device and to collect the counted number of steps to the shared table which was followed by debugging and generalisation of results.
Besides the finding about students, our data provided some interesting insights into instructional strategies employed by the teachers, such as using analogies, involving students in decision-making (naming variables) and encouraging exploration and modification of code. These strategies align with research on effective pedagogy in both computer science education and mathematics education, emphasising student engagement, hands-on activities and scaffolding learning experiences to develop computational thinking skills [38,39,40].

3.4. Limitations of the Study

We are aware of the fact that the study describes one particular activity of a group of 13 students in informal, out-of-school settings. Given the nature of qualitative research, it is clear that although the conclusions formulated are based on the data collected and where possible situations and statements are directly quoted, the conclusions and findings formulated are our interpretation of reality [41] and we need to be cautious in generalising the results.
The findings of the presented research are a description of processes taking place in practice and in a specific life situation. On the other hand, they offer an unusual instance where the activity covered two usually separated areas and the work of teachers and students was analysed. Our findings provide the reader with a mediated experience of how the implementation of the approach under investigation took place in specific settings. In this way, it broadens the reader’s experience base, the repertoire of possible actions and enhances his or her ability to assess what he or she might do in a similar situation in his or her own practice.

4. Conclusions

The developed activities for non-formal education were aimed at developing and enabling the acquisition of mathematical knowledge (mathematical content of the activities or hidden mathematics behind the computer activities) and developing computational thinking skills (using algorithmic thinking, generalization, etc.). The teachers and students engaged in a dialogue about the sources of error in the measurement results obtained from the pedometer test. They discussed factors such as foot size, leg counting methods and step length variability that could have affected the accuracy of the recorded steps. By addressing these sources of error, the students had the opportunity to learn how to eliminate potential inaccuracies and improve the reliability of the measurements. In addition, the work with variables was involved in order to help students understand how variables could be increased, decreased and reset, and they were requested to apply this knowledge in programming tasks about automation of the data collection. The importance of correctly manipulating both the hardware and software components to obtain accurate results was emphasised. Participating students were able to distinguish between natural variability and errors in measurement. They found their mistake in the counting process when they counted only one step instead of two and they needed to modify the code, to debug it and to prevent this error.
Our findings demonstrate that computational thinking skills were needed not only in manipulation with hardware and coding but also in the mathematical/statistical part of the activity. We suggest that when adopting the problem to be (at least partially) solved by the means of computers, a special kind of mathematical knowledge is needed as, unlike humans, computers and/or processing agents have limited sets of instructions. The nature of this knowledge, its affordances and constraints as well as the possible way to its development needs to be further studied.
The study highlights the importance of addressing sources of error in measurements, effective strategies for teaching variables, the integration of hardware and coding in educational contexts and pedagogical approaches that promote student engagement and understanding. By drawing upon relevant research, educators can enhance their instructional practices and promote effective learning experiences in these domains.

Author Contributions

Conceptualization, M.F., M.C. and J.M.; methodology, J.M.; software, M.F. and M.C.; validation, Ľ.V.; formal analysis, M.F. and J.M.; investigation, M.C. and M.F.; resources, Ľ.V.; data curation, Ľ.V.; writing—original draft preparation, M.F. and J.M.; writing—review and editing, M.C. and J.M.; visualization, M.F.; supervision, J.M.; project administration, Ľ.V.; funding acquisition, J.M. and Ľ.V. All authors have read and agreed to the published version of the manuscript.

Funding

This research was partially funded by Slovak Research and Development Agency, grant number APVV-20-0599, by the Ministry of Education, Science, Research and Sport of the Slovak Republic, grant number 015UKF-4/2021 and by Erasmus+ 2020-1-DE03-KA201-077363.

Data Availability Statement

The transcripts are available upon request from J.M.

Conflicts of Interest

The authors declare no conflict of interest.

References

  1. Valovičová, Ľ.; Ondruška, J.; Zelenický, Ľ.; Chytrý, V.; Medová, J. Enhancing computational thinking through interdisciplinary steam activities using tablets. Mathematics 2020, 8, 2128. [Google Scholar] [CrossRef]
  2. Crompton, H. Contextualizing stem learning: Frameworks & strategies. In Research on Outdoor STEM Education in the Digital Age; Springer: Berlin/Heidelberg, Germany, 2020; Volume 13. [Google Scholar]
  3. Wing, J. Research notebook: Computational thinking—What and why. Link Mag. 2011, 6, 20–23. [Google Scholar]
  4. Lessner, D. Analýza významu pojmu “computational thinking”. J. Technol. Inf. Educ. 2014, 6, 71–88. [Google Scholar]
  5. Papert, S. Children, Computers, and Powerful Ideas; Harvester: London, UK, 1980. [Google Scholar]
  6. Cuny, J.; Snyder, L.; Wing, J.M. Demystifying Computational Thinking for Non-Computer Scientists. Unpublished Manuscript in Progress. 2010. Available online: http://www.cs.cmu.edu/~CompThink/resources/TheLinkWing.pdf (accessed on 1 May 2023).
  7. Shute, V.J.; Sun, C.; Asbell-Clarke, J. Demystifying computational thinking. Educ. Res. Rev. 2017, 22, 142–158. [Google Scholar] [CrossRef]
  8. Berland, M.; Wilensky, U. Comparing virtual and physical robotics environments for supporting complex systems and computational thinking. J. Sci. Educ. Technol. 2015, 24, 628–647. [Google Scholar] [CrossRef]
  9. Barcelos, T.S.; Silveira, I.F. Teaching computational thinking in initial series an analysis of the confluence among mathematics and computer sciences in elementary education and its implications for higher education. In Proceedings of the 2012 XXXVIII Conferencia Latinoamericana En Informatica (CLEI), Medellin, Colombia, 1–5 October 2012; pp. 1–8. [Google Scholar]
  10. Bocconi, S.; Chioccariello, A.; Dettori, G.; Ferrari, A.; Engelhardt, K. Developing Computational Thinking in Compulsory Education; European Commission, Joint Research Centre: Luxembourg, 2016. [Google Scholar]
  11. Cápay, M.; Klimová, N. Engage your students via physical computing! In Proceedings of the 2019 IEEE Global Engineering Education Conference (EDUCON), Dubai, United Arab Emirates, 8–11 April 2019; pp. 1216–1223. [Google Scholar]
  12. Schield, M. Statistical Literacy: Thinking Critically about Statistics; Association of Public Data Users, Augsburg College: Minneapolis, MN, USA, 1999. [Google Scholar]
  13. Konold, C.; Higgins, T.L. Reasoning about data. In A Research Companion to Principles and Standards for School Mathematics; Kilpatrick, J., Martin, W.G., Schifter, D., Eds.; NTCM: Reston, VA, USA, 2003; pp. 193–215. [Google Scholar]
  14. Melušová, J.; Vidermanová, K. Matematická štatistika v interdisciplinárnych projektoch žiakov základných a stredných škôl [Mathematical Statistics in Interdisciplinary Projects of Secondary-School Students]. Forum Stat. Slovacum. 2012, 8, 97–102. [Google Scholar]
  15. Watson, J. Variation and expectation for six-year-olds. In Statistics in Early Childhood and Primary Education: Supporting Early Statistical and Probabilistic Thinking; Leavy, A., Meletiou-Mavrotheris, M., Paparistodemou, E., Eds.; Springer: Singapore, 2018; pp. 55–73. [Google Scholar]
  16. Watson, J.; Fitzallen, N.; English, L.; Wright, S. Introducing statistical variation in year 3 in a stem context: Manufacturing licorice. Int. J. Math. Educ. Sci. Technol. 2020, 51, 354–387. [Google Scholar] [CrossRef]
  17. Kortenkamp, U. Algorithmics in Arithmetic: Revealing Algorithmic Activities in a First-Year Arithmetic Course for Preservice Teachers. In Proceedings of the Twelfth Congress of the European Society for Research in Mathematics Education (CERME12), Bozen-Bolzano, Italy, 2–5 February 2022; p. hal-03748444. [Google Scholar]
  18. Gadanidis, G.; Javaroni, S.L.; Santos, S.C.d.; Silva, E.C.D. Computing in mathematics education: Past, present, and future. In Handbook of Cognitive Mathematics; Springer: Berlin/Heidelberg, Germany, 2021; pp. 1–38. [Google Scholar]
  19. Weintrop, D.; Beheshti, E.; Horn, M.; Orton, K.; Jona, K.; Trouille, L.; Wilensky, U. Defining computational thinking for mathematics and science classrooms. J. Sci. Educ. Technol. 2016, 25, 127–147. [Google Scholar] [CrossRef]
  20. English, L.D.; Watson, J. Modelling with authentic data in sixth grade. ZDM 2018, 50, 103–115. [Google Scholar] [CrossRef] [Green Version]
  21. Watson, J.M.; English, L.D. Statistical problem posing, problem refining, and further reflection in grade 6. Can. J. Sci. Math. Technol. Educ. 2017, 17, 347–365. [Google Scholar] [CrossRef]
  22. Mike, K.; Ragonis, N.; Rosenberg-Kima, R.B.; Hazzan, O. Computational thinking in the era of data science. Commun. ACM 2022, 65, 33–35. [Google Scholar] [CrossRef]
  23. Villa-Ochoa, J.A.; Suárez-Téllez, L. Computer algebra systems and dynamic geometry for mathematical thinking. In Handbook of Cognitive Mathematics; Springer: Berlin/Heidelberg, Germany, 2021; pp. 1–27. [Google Scholar]
  24. Kallia, M.; van Borkulo, S.P.; Drijvers, P.; Barendsen, E.; Tolboom, J. Characterising computational thinking in mathematics education: A literature-informed delphi study. Res. Math. Educ. 2021, 23, 159–187. [Google Scholar] [CrossRef]
  25. Aloudat, A.S. Grounded theory. In Encyclopedia of Tourism; Jafari, J., Xiao, H., Eds.; Springer International Publishing: Cham, Switzerland, 2016; pp. 407–408. [Google Scholar]
  26. Saliya, C.A. Grounded theory. In Doing Social Research and Publishing Results: A Guide to Non-Native English Speakers; Springer Nature: Singapore, 2022; pp. 291–298. [Google Scholar]
  27. Glaser, B.G.; Strauss, A.L.; Strutzel, E. The discovery of grounded theory; strategies for qualitative research. Nurs. Res. 1968, 17, 364. [Google Scholar] [CrossRef] [Green Version]
  28. Walker, D.; Myrick, F. Grounded theory: An exploration of process and procedure. Qual. Health Res. 2006, 16, 547–559. [Google Scholar] [CrossRef]
  29. Hermans, F.; Swidan, A.; Aivaloglou, E.; Smit, M. Thinking out of the box: Comparing metaphors for variables in programming education. In Proceedings of the 13th Workshop in Primary and Secondary Computing Education, New York, NY, USA, 4–6 October 2018; pp. 1–8. [Google Scholar]
  30. Kilhamn, C.; Bråting, K. Algebraic Thinking in the Shadow of Programming. In Eleventh Congress of the European Society for Research in Mathematics Education; Utrecht University: Utrecht, The Netherlands, 2019; p. hal-02416356. [Google Scholar]
  31. Carroll, R.J.; Ruppert, D.; Stefanski, L.A.; Crainiceanu, C.M. Measurement Error in Nonlinear Models: A Modern Perspective; Chapman and Hall/CRC: Boca Raton, FL, USA, 2006. [Google Scholar]
  32. Brennan, K.; Resnick, M. New frameworks for studying and assessing the development of computational thinking. In Proceedings of the 2012 Annual Meeting of the American Educational Research Association, Vancouver, BC, Canada, 22 July 2012; p. 25. [Google Scholar]
  33. Hodges, S.; Sentance, S.; Finney, J.; Ball, T. Physical computing: A key element of modern computer science education. Computer 2020, 53, 20–30. [Google Scholar] [CrossRef] [Green Version]
  34. Przybylla, M.; Romeike, R. Physical computing and its scope–towards a constructionist computer science curriculum with physical computing. Inform. Educ. 2014, 13, 241–254. [Google Scholar] [CrossRef]
  35. Richardson, J.; Adamo-Villani, N.; Carpenter, E.; Moore, G. Designing and implementing a virtual 3d microcontroller laboratory environment. In Proceedings of the Frontiers in Education, 36th Annual Conference, San Diego, CA, USA, 27–31 October 2006; pp. 1–5. [Google Scholar]
  36. Kondaveeti, H.K.; Kumaravelu, N.K.; Vanambathina, S.D.; Mathe, S.E.; Vappangi, S. A systematic literature review on prototyping with arduino: Applications, challenges, advantages, and limitations. Comput. Sci. Rev. 2021, 40, 100364. [Google Scholar] [CrossRef]
  37. Shahin, M.; Gonsalvez, C.; Whittle, J.; Chen, C.; Li, L.; Xia, X. How secondary school girls perceive computational thinking practices through collaborative programming with the micro:Bit. J. Syst. Softw. 2022, 183, 111107. [Google Scholar] [CrossRef]
  38. Guzdial, M. Learner-centered design of computing education: Research on computing for everyone. Synth. Lect. Hum. Centered Inform. 2015, 8, 1–165. [Google Scholar]
  39. Engeln, K.; Euler, M.; Maass, K. Inquiry-based learning in mathematics and science: A comparative baseline study of teachers’ beliefs and practices across 12 european countries. ZDM 2013, 45, 823–836. [Google Scholar] [CrossRef]
  40. Samková, L.; Hošpesová, A.; Roubíček, F.; Tichá, M. Badatelsky orientované vyučování matematice. Sci. Educ. 2015, 6, 91–122. [Google Scholar] [CrossRef] [Green Version]
  41. Creswell, J.W. Qualitative Inquiry & Research Desing: Choosing among Five Approaches; SAGE Publications: Thousand Oaks, CA, USA, 2007. [Google Scholar]
Figure 1. The categories of speeches of students.
Mathematics 11 03206 g001
Table 1. Excerpt 1 from the implementation of the activity.
Teacher 2:Look at the board. This is the data you dictated to me. And what did you guys say it could depend on? I heard something that it might depend on how big your foot is. What else could it have depended on how much we charged?
Student:It depended on whether we counted only one step for one leg or one step for two legs.
Teacher 2:Okay were there some people who only counted the leg they had the micro:bit on?
Table 2. Excerpt 2 from the implementation of the activity.
Teacher 2:It could have depended on this, what else could it have depended on?
Student:I counted 60 when I counted one leg, the micro:bit counted 50 and if I counted both legs, …
Teacher 2:So you’d have something like 120.
Teacher 1:Okay and why is there that difference, why is there 50 and 120? Explain.
Student:I don’t know, I don’t understand.
Table 3. Excerpt 3 from the implementation of the activity.
Teacher 2:Okay the length of the leg affects what? Because you all walked the same distance.
Student:But each step is different.
Teacher 2:Yes, even different step length can affect it.
Table 4. Excerpt 4 from the implementation of the activity.
Teacher 1:Watch me and tell me what the difference is.
Students:You clump.
Teacher 1:What is the difference?
Student:You lifted your legs more when you did one a time.
Teacher 1:Exactly, so what is the sensor like? Isn’t it broken?
Teacher 2:Well, what does that sensor do when we lift our legs more versus one where we’re shuffling?
Students:It shakes more.
Teacher 2:Well, it shakes more and what does that mean?
Student:It sounds better.
Teacher 2:Exactly, the more it is exposed to shaking at that one moment the more it registers. Okay, and what’s the difference in what I’m doing?
Student:Some steps are short and others are long.
Teacher 2:So what does that affect?
Student:The number of steps.
Teacher 2:Exactly. Because we have walked the same distance. So the number of steps can also affect the length of the steps.
Table 5. Excerpt 5 from the implementation of the activity.
Teacher 1:This is Teacher 2 standing by the door holding a device and counting how many people came in and how many left. I mean, if I came in now, what would he do, plus or minus?
Students:Plus.
Teacher 1:Plus one, and if I left so?
Students:Minus one.
Table 6. Excerpt 6 from the implementation of the activity.
Teacher 1:Let’s try to explain it like this. You go home to save money. You get a piggy bank. It can be a box or a piggy bank. It doesn’t matter. When you get it, what’s inside?
Student:It’s empty.
Teacher 1:Try expressing it with a number. If it’s empty, then how many are there?
Students:Zero.
Teacher 1:Zero, well. So when you start working with the counter, it has to be set to zero. Now I’m going to give you two euros, and you’re going to put them in the piggy bank.
Student:It will be plus two.
Teacher 1:You’re going to buy an ice cream.
Student:That will be minus one.
Teacher 1:Grandma will give you 5 euros.
Students:That’s plus 5.
Teacher 1:Grandpa will give you 18 euros, and we’re getting lost.
Student:So we have 24 euros.
Teacher 1:Okay once in a while we can look in that piggy bank and count the money we have in there but all my money are stored there.
Table 7. Excerpt 7 from the implementation of the activity.
Teacher 1:We can see that the memory of the micro:bit has no such place to store anything yet. I’ll create one. We have to give it a name. What shall we call it?
Students:Bank.
Teacher 1:Bank? We’re going to count people.
Student A:People.
Teacher 1:People?
Student B:Counter.
Teacher 1:To make it so democratic, so who would vote for the variable name ‘counter’? More people seemed to vote for ‘count’. Because it’s good to name those variables according to what they tell us. So we’ll create a variable named ‘counter’.
Table 8. Excerpt 8 from the implementation of the activity.
Teacher 1:Okay, let’s not click a few people and have them display them. Now your job the next morning is to reset the counter. How will you do that?
Student:I’m going to use B to decrease by one.
Teacher 1:You could do it any way you want but if you have 248 people there it would take quite a long time to reset the counter. How would you reset the number of people? Notice that I’m going to show you again because this is such a, no not that tricky question but how do you program it, tell me when do you reset it?
Student A:When I turn it off and on.
Teacher 1:Great but in practice that means how do you reset it? You can turn it off and on or computers have that special mode that they reset. And do you remember from last week where the reset button is?
Student B:Here, on the other side.
Teacher 1:Teacher: exactly, so every time you hit the reset button it goes all the way back to the beginning, whatever settings were there always goes all the way back to the beginning. There are three buttons on the micro:bit, two on the front and one on the back.
Table 9. Excerpt 9 from the implementation of the activity.
Teacher 1:My question now is when you shake your leg, what do you do with that value?
Student:It increases.
Teacher 1:I’ll leave that solution up to you. When the micro:bit registers that you shake, the value is supposed to increase. Then we would still need the micro:bit to display that value, the number of steps. We wouldn’t decrease, however. So our pedometer is only going to have one functionality. When the pedometer is shaken the value will increase. And when we press button B, it’ll display the value.
Now you have time to rewrite the code. You can modify this code and take another look here that where I pulled this code from. It’s in the input section. When it’s shaken, that’s going to be our gesture, and now when I shake it the value should increase.
Student:So we’re going to have the variable increased by one.
Teacher 1:I’ll leave that up to you. Okay, what do we need next? We probably won’t need A + B, so I’m going to throw that out. Just modify the code so that the value is displayed when we press the B button. So when I shake the microbit, the value is magnified, and when I press B, the value
Table 10. Excerpt 10 from the implementation of the activity.
Teacher 1:Let’s suggest if he [Teacher 2 standing at the door] had a BBC micro:bit device in his hands, what could he use to add and what could he use to take away?
Students A:Using the buttons A and B.
Teacher 1:Excellent, using the buttons A and B. What will the A do?
Student A:A adds one and B subtracts one.
Teacher 1:Great, and I’d like to see that how many people are in the room at the moment. You know it could be 150 people. How would you find that out?
Student B:By pressing A + B.
Table 11. Excerpt 11 from the implementation of the activity.
Teacher 1:Do you know what you are going to do? You’re going to reset your micro:bit, reset it just before, and then you’re going to walk down this hallway.
Finally, after reaching the first door, you will turn back, and using the other side, after that other door, and you’re going to go back.
And all the time you will count the number of steps you’ve taken. So you reset your micro:bit before you go, and now Teacher 2 is going to show you what that looks like. You see he’s counting the steps.
Table 12. Excerpt 12 from the implementation of the activity..
Teacher 1:We want to show this on the display. Which part of these commands did we go to when we wanted to show something on the display?
Student A:Basic.
Teacher 1:So let’s go to ‘basic’. And let’s try to find in ‘basic’ what we could use.
Student B:Display a number.
Teacher 1:Well, we could display a number. So let’s take the command ‘display number’. And that’s what was said, that command can connect nicely to that. I mean, I can take that variable and that’s how it can relate to that.
Table 13. Excerpt 13 from the implementation of the activity.
Teacher 1:For example, a gesture is when we tilt the micro:bit. Zooming is also a gesture. Now it’s off and when I pick it up it turns on, that’s also a gesture. Those gestures are something that is recognised by the device. Our micro:bit, look, recognizes these gestures. Do you remember? We used this gesture during previous lesson. When you shake it, and then we programmed what it’s supposed to do when you shake it. It can lean, it can go log up. Now imagine you’re doing a pedometer, that is, you’ve got a micro:bit on your foot and you’re walking with it. Which gesture would you use to count the steps?
Student A:Shaking, because the whole leg is shaking.
Student B:Acceleration.
Teacher 1:Okay, but we need to choose a gesture. From these you have here you probably won’t be tilting your leg to the right or left, you probably won’t be twisting your leg to have the screen tipped but you’ll probably be shaking that leg. Cool.
Disclaimer/Publisher’s Note: The statements, opinions and data contained in all publications are solely those of the individual author(s) and contributor(s) and not of MDPI and/or the editor(s). MDPI and/or the editor(s) disclaim responsibility for any injury to people or property resulting from any ideas, methods, instructions or products referred to in the content.

