Abstract
Dunnett’s procedure has been frequently used for multiple comparisons of group means of several treatments with a control, in drug development and other areas. However, in practice, researchers usually face missing observations when performing Dunnett’s procedure. This paper presents an improved Dunnett’s procedure that can construct unique ensemble confidence intervals for comparing group means of several treatments with a control, in the presence of missing observations, using a derived multivariate t distribution under the framework of Rubin’s rule. This procedure fills the current research gap that Rubin’s repeated-imputation inferences cannot adjust for multiplicity and, thereby, cannot give a unified confidence interval to control the family-wise error rate (FWER) when dealing with this problem. Simulation results show that the constructed pooled confidence intervals archive nominal joint coverage and the interval estimations preserve comparable precision to Rubin’s repeated-imputation inference as the missing rate increases. The proposed procedure with propensity-score imputation method is shown to produce more accurate interval estimations and control the FWER well.
Keywords:
Dunnett’s procedure; many-to-one comparisons; missing data; simultaneous confidence interval MSC:
62F30
1. Introduction
Comparisons of drug effect at different dosage levels with a control (many-to-one comparisons) is a common technique used in modern clinical trials for drug development. Since the pioneering work of Dunnett (1955) on many-to-one comparisons with normally distributed data [1], this problem has gained wide attention from methodologists in recent decades.
Dunnett’s comparison was applied to dichotomous data by Passing in terms of comparing individual treatment proportions against the control proportions simultaneously [2]. Alternatively, Piegorsch [3] pointed out that the Bonferroni-based intervals for pairwise contrasts of multinomial proportions (Goodman, 1964) [4] could be applied for constructing pooled confidence intervals for multiple comparisons to a control with the difference of dichotomous proportions. However, the conservativeness of the Bonferroni adjustment is widely known, since it ignores the correlation structure among the comparisons. Bonferroni-based intervals have poor power in many-to-one comparisons, particularly when the number of comparisons becomes large and when comparisons are highly correlated [5]. An application of analogous method to construct simultaneous intervals for many-to-one comparisons of proportions was proposed by Piegorsch [3], by adapting the Jeffreys–Perks (JP) reformulation to Bonferroni-based intervals and Dunnett-style intervals. Simulation results demonstrated that JP results are superior to Bonferroni-based intervals and Dunnett-style intervals. Klingenberg discussed several methods for construction of asymptotic simultaneous confidence limits of relative risks for comparing several treatments to a control, and a method inverting the minimum of score statistics, together with estimating the correlation matrix of these statistics, proves to be most powerful [6]. Many-to-one comparisons have also been investigated for survival data. However, statistical procedures that developed for many-to-one comparisons on survival data have been less discussed in the literature [7]. Chakraborti and Desu proposed a class of linear rank tests for comparing several treatments with a control when data are subject to different censoring patterns [8,9]. Herberich and Hothorn described a many-to-one comparisons procedure in the frailty Cox model, allowing clustered survival data of several experimental treatments to be compared—overall and pairwise—with a control with adjustment for covariates [7]. Wu proposed a multiple comparison procedure for many-to-one treatment mean lifetimes with the control for exponential distributions under heteroscedasticity [10]. Later, Wu extended the procedure to doubly censored samples [11].
It is indicated that most of the procedures proposed for many-to-one comparisons are for inferential families containing hypotheses that are all either one-sided or two-sided [12]. However, when researchers have prior information that some of the treatments are better than the placebo while having no prior information for other treatments, an inferential family consisting of a mixture of one-sided and two-sided hypotheses may be desirable. This problem was discussed by Cheung [13] and Kwong [14]. They proposed a class of one-stage or two-stage procedures for many-to-one comparisons under the assumption of normality and unknown equal variances in direction-mixed families. After that, Chauhana proposed a procedure for this problem under the assumption of normality and unknown unequal variances [12]. Further, Chauhana proposed a procedure for many-to-one comparisons of the location parameters for exponential distributions in direction-mixed families [15].
In recent years, many-to-one comparisons have been discussed in a variety of innovative applications. Gao developed a response-adaptive treatment-allocation procedure to compare efficacy between two treatments in trials with recurrent event data, which was shown to be superior to balanced treatment allocation [16]. Further, the procedure was improved for both pairwise comparisons and many-to-one comparisons [17]. As mentioned previously, many-to-one comparisons are often considered in dose response studies, especially in the early drug development process, where different dosage levels need to be compared with a control simultaneously. Liu proposed a method to construct simultaneous confidence lower bounds for the differences between the mean response of any active dose level and that of the control to identify the minimum effective dose, under a monotonicity assumption of dose response [18]. This method was shown to be more powerful than Dunnett’s procedure, since the preliminary assumption ruled out the possibility of data deviation from the monotonicity. Yang proposed a procedure to construct asymptotic simultaneous confidence intervals for many-to-one comparisons of proportional differences on correlated paired data, which could be applied for data collected from paired organs of patients [19]. Maharjan proposed a new multiple comparison procedure to study the significant dose–response association with skew-normal response [20].
Missing observations is a problem which often appears in scientific research. In these studies, variables representing the effects of treatments or control might be missing due to multiple reasons, e.g., sample loss, instrument failure, subject dropouts, etc. The missing values lead to less efficient estimates because of the reduced sample size. In addition, standard complete-data methods usually cannot be directly used to analyze the incomplete data [21]. Naive case deletion handling causes information loss. It was pointed out that discarding incomplete cases and ignoring possible systematic differences between the complete cases and the incomplete cases could lead to underestimation of uncertainty in inferences [21,22,23]. The missing observations are problematic to the Dunnett’s procedure likewise. Firstly, in practice, many researchers are even unaware of the case deletion handling in Dunnett’s procedure because major statistical software packages automatically omit missing values in default set. Secondly, researchers usually adopt either the single imputation or the multiple imputation techniques, such as the group arithmetic mean or the predicted value from a regression with associated variables, to impute the missing data, and then conduct regular Dunnett’s procedure. There are obvious disadvantages of the single imputation method, arising from the fact that the one imputed value cannot itself represent any uncertainty, the actual confidence coverage using single imputation might be less than the nominal coverage, and the rejection rate for a true null hypothesis might be higher than nominal [24]. For Dunnett’s procedure with the multiple imputation technique, a major challenge comes from combining the confidence intervals obtained from each imputation to produce a unique confidence interval. In practice, a unique confidence interval is much easier for making statistical inference and decision. Currently, the standard approach for combining univariate or multivariate estimations from multiple imputed datasets, i.e., Rubin’s repeated-imputation inferences [21], only gives combined point estimates for multiple comparisons, along with unadjusted confidence intervals, leading to the inflation of family-wise error rate (FWER) for many-to-one comparisons. A new procedure is needed to solve this challenge, giving a unique confidence interval that accounts for the multiplicity and can, thereby, control the FWER at a prespecified confidence level. In addition, rather than constructing simultaneous confidence intervals, researchers may consider some basic FWER control approaches on results of t tests for each comparison based on multiple imputed datasets, e.g., Bonferroni adjustment [25] and Step-down Bonferroni adjustment (Holm’s procedure) [26]. However, these approaches are often used as the last resort for multiple comparisons, as they may yield overly conservative adjustments in the case of high dependence among comparisons or when there are many comparisons to perform [5,27,28]
The purpose of this article is to advocate a new procedure to compare group means of several treatments with a control, using multiple imputation. Our work starts with notations of the problem in Section 2 and a brief introduction to Dunnett’s Procedure in Section 3. In Section 4, the improved Dunnett’s procedure to make simultaneous statistical inferences for comparing means of several treatments with a control group based on multiple imputation is proposed, to fill the aforementioned research gap. In Section 5, we discuss the statistical properties of the proposed procedure by performing two simulation studies, comparing its coverage, average length of the confidence intervals, and two types of error with those from their methodological counterparts; impact on performance by the difference imputation methods is also studied. In Section 6, an application using the proposed procedure is illustrated with a real-data example. Section 7 and Section 8 conclude this article with brief discussions.
2. Notations
Denote the number of observations in the control group by and the numbers of observations in k treatment groups by , , ⋯, . Denote these observations by , where indicates is observable; otherwise, it is missing. Assume that all are independent and normally distributed with variances and means . The research aim is to obtain a unique confidence interval for the test of many-to-one comparisons , simultaneously, adjusting for multiplicity. The joint confidence coefficient, i.e., the probability P that all k confidence intervals will contain the corresponding is equal to value , where is a preassigned significance level to control FWER of k comparisons. To put this in another way, the problem is to test simultaneous null hypotheses : vs. : , .
3. Brief Review of Dunnett’s Test
If all observations are completely observed, that is, , then the classic Dunnett’s procedure [1], also called Dunnett’s multiple comparison, can be used for this many-to-one comparison. A preliminary assumption of Dunnett’s procedure is that all share a common variance, that is, . Denote the observed group means by . Therefore, is an available estimate of , which is based on n degrees of freedom, where . Dunnett extended the two-sample t test assuming equal variances to a general case and gave the solution. Let
and , ; the lower bounds of the confidence limits for k comparisons are given by
where s are constants satisfying . Similarly, the upper bounds of the confidence limits are given by
The two-sided confidence limits for k comparisons are given by
where the constants s satisfy . To find the constants and , Dunnett took the correlations between the test statistics into account by using a multivariate t-distribution. The joint distribution of the s is a multivariate t-distribution with means 0 and correlation matrix , where
4. Improved Dunnett’s Procedure for Many-to-One Comparisons with Missing Data
In this section, we introduce an improved Dunnett’s procedure that can be applied for the scenario with missing observations in . We first assume the missing data mechanism is missing at random (MAR), as defined by Rubin [29]: missing data values carry no information about probabilities of missingness and depend on the observed values. Without loss of generality, we do not make any assumption of equal variance among groups, that is, s are independent and normally distributed with variance and means .
Let , a k-dimensional row vector, be the quantity of interest. Assume that, with complete data, inference for Q would be based on the statement that , where is the estimate of Q and is the k-variate normal distribution with mean 0 and variance U. Based on the theory of normal distribution, the estimate of Q has the form
and its covariance matrix U is as follows:
Because of the presence of missing observations, cannot be obtained directly. Hence, we impute the incomplete dataset m times by replacing the missing observations with multiple plausible values to create m imputed complete datasets. The following three imputation methods can be used for one-way data with a simple monotonic missing data pattern.
(1) Regression method, in which each missing value is replaced by a predicted value with simulated normal deviation from the regression model [21];
(2) Predictive mean matching method, which imputes a value randomly from a set of observed values whose predicted values are closest to the predicted value for the missing value from the simulated regression model [30,31];
(3) Propensity-score method, in which an approximate Bayesian bootstrap imputation [21] is applied to observation groups divided by propensity scores, estimating the probability that the observations are missing [32,33].
Denote the observed values and the replacement of missing values in the yth imputed complete dataset by , ; ; . We can calculate the mean and standard deviation of each group based on the yth complete dataset as and . Then, we obtain a set of estimated parameters
where , , , . Putting these estimates into Formulas (5) and (6), we obtain a set which comprises m draws of estimates of Q, , and m draws of estimates of U, , from m imputed complete datasets i.e., .
Let be the average of the m estimates from imputed complete datasets, be the average of the m variances from imputed complete datasets, and be the variance between (among) the m estimates from imputed complete datasets. Then, the total variance of can be denoted by .
Based on Rubin’s theory, the conditional distribution of Q given can be expressed as a multivariate t distribution approximation as follows:
where the degree of freedom of the t distribution is , in which . The ratio is called the relative increase in variance due to nonresponse. Then, we construct the simultaneous unique confidence interval for this many-to-one comparisons problem as follows.
Denote the mean of multivariate t distribution in (8) by , and its covariance matrix by . To construct the confidence intervals, we need a t statistic to standardize the multivariate t distribution [34]. Let
then, we have , which is based on the statement , where is a matrix, i.e.,
Denote the probability density function of the standardized t distribution by . The lower confidence limits for k comparisons are given by
where the constants s satisfy
where the probability P equals and is the significance level to control FWER of all k comparisons.
Similarly, the upper confidence limits are given by
The two-sided confidence limits for k comparisons are given by
where the constants s satisfy
In our work, the constants and are calculated as the equicoordinate quantiles of the multivariate t distribution with R package ‘mvtnorm’ [35], using a stochastic root-finding algorithm [36].
Apparently, the proposed method above produces the same point estimates, but with unique and adjusted confidence interval, compared to Rubin’s repeated-imputation inferences by pooling estimates of group differences from k two-sample t tests between each treatment and the control. In a special case of , that is, there is only one treatment group, and therefore there is only one comparison, the multivariate t distribution in Equation (8) reduces to a univariate t distribution with the same degrees of freedom. In this case, the point estimate and its confidence intervals from the proposed procedure are exactly the same with Rubin’s repeated-imputation inferences by pooling estimates of group difference from a single two-sample t test between the treatment and the control.
The proposed procedure is started with the assumption of heterogeneity of variance. It can be also adapted to the assumption of homogeneity of variance by replacing the form of U in Equation (6) with the following:
When estimating U with the form in Equation (16), we replace the aforementioned with the mean squared error from One-way Analysis of Variance based on each of the completed datasets, as an estimate of the common variance .
A summary of the proposed procedure is presented in Algorithm 1.
| Algorithm 1 Main algorithm |
Input: with missing observations.
Output: Point estimates and pooled confidence intervals for comparisons . |
5. Simulation Study
5.1. Simulation I
The first simulation study investigated the trends of changes in accuracy and precision of estimates due to many-to-one adjustment and increasing missing rate. We calculated coverage and average length of the confidence intervals given by the proposed procedure and compared them with existing statistical methods correspondingly. The following Table 1 includes the statistical methods used in the first simulation study. In this study, the performance of three imputation methods, described in Section 4, are compared in one-way data simulations with a simple monotonic missing data pattern.

Table 1.
Statistical methods used in the first simulation study.
We let , that is, there were two treatment groups and one control group, and, therefore, there were two comparisons against the control to perform. We denoted the name of the control group by and the names of treatment groups by and . The responses to be compared were normally distributed independently in two scenarios: in the first scenario, , , , and common variance ; in the second scenario, , , , and common variance . The sample sizes in the three treatment groups were = 50, = 50, = 50. We first created an original complete dataset based on the above setup. Then, the missing observations were generated using an MAR mechanism at missing rate 10%, 20%, 30%, and 40%. Each of the incomplete datasets was imputed times from three aforementioned imputation methods to create the imputed complete datasets. The number of times m was set to 40 to ensure the relative efficiency (RE) in units of variance was always higher than 99% of the fully efficient imputation using an infinite imputation time. RE is calculated with the following formula [21]:
The two-sided 95% confidence intervals were calculated using appropriate methods in Table 1 based on these datasets.
5.1.1. Coverage of Confidence Interval
The coverage of the confidence interval is calculated as the proportion of times that the obtained confidence interval contains the difference of group means based on the true parameters [37]. In addition to the coverage of the interval for vs. and vs. , we also calculated the joint coverage ofthe two comparisons, which refers to the proportion of times that the two confidence intervals contain corresponding true differences simultaneously. The results based on 10,000 independent simulations are summarized in Table 2.
Table 2.
Coverage (%) of 95% CIs varying with missing rate.
From the results in Table 2, at first glance the predictive mean matching method has poor performance in covering true difference, suggesting that it is not an appropriate method for one-way data imputation. From its algorithm, we know that, as the missing rate increases, more missing values are randomly replaced with identical observed values in the same treatment groups, leading to underestimation of uncertainty and biased estimations. Hence, the results from the predictive mean matching method are not provided and interpreted hereinafter. Additionally, the predictive mean matching method was not applied in the later work in this article.
The portion of none adjustment in Table 2 indicates that, although the coverages of single comparison are very close to their nominal coverage (95%), the joint coverages shrink to around 90%. This suggests the necessity of adjustment when performing multiple comparisons. It also implies the rationale of an adjustment for multiple comparisons, which is to expand the coverage of separate confidence intervals more conservatively than without adjustment, so that the joint coverage can reach a prespecified confidence coefficient. The portion of many-to-one adjustment indicates that the joint coverage from the proposed procedure on incomplete datasets is very close to the overall nominal coverage (95%) from its complete-data counterpart, Dunnett’s procedure. These numbers suggest that the proposed procedure produces separate confidence intervals for each of the comparisons, which generally well covers the true differences simultaneously, at a prespecified joint confidence coefficient. In addition, this good property is not shown to be affected by the increasing missing rate.
5.1.2. Average Length of Confidence Interval
Based on methods without adjustment and with many-to-one adjustment, we calculated the average length of the 95% confidence interval of group difference at each missing rate level. The average lengths of the confidence intervals of 10,000 simulations in Simulation I are tabulated in Table 3. The average lengths from methods for incomplete datasets are compared with their complete-data counterparts, and the expansion rates are also given in the parentheses.
Table 3.
Average lengths of 95% CIs varying with missing rate.
According to the results in Table 3, when there is no adjustment for multiple comparisons, the confidence interval expands as the missing rate increases, indicating the variability due to uncertainty by imputing values grows. This association also holds when performing an adjustment for many-to-one comparisons using the proposed procedure. The expansion rates at each missing rate via the same imputation method for each of the specific comparisons between no adjustment and many-to-one adjustment are very close. This indicates that, as the missing rate increases, the interval estimations from the proposed procedure preserve comparable precision as Rubin’s repeated-imputation inferences, as they have close expansion rates of interval length. It is worth noting that the propensity-score method produces longer confidence intervals than the regression method, suggesting that the propensity-score method is a relatively more conservative method for multiple imputation when performing many-to-one comparisons.
5.2. Simulation II
The second simulation study compared the proposed procedure with case deletion method, single imputation method, Bonferroni adjustment, and Holm’s procedure on incomplete datasets, specifically, from the type-I error and type-II error perspectives. The five methods are detailed as follows:
(1) Naive deletion method: Delete the observations with missing data, and then perform Dunnett’s test based on the data remaining;
(2) Single imputation method: First, impute missing observations with the mean of observed values in the same group; then, perform Dunnett’s procedure on the imputed dataset;
(3) Multiple imputation with Bonferroni adjustment: First, perform multiple imputation on the incomplete data via regression method or propensity-score method; then, obtain the unadjusted p-values from two-sample t tests for k comparisons based on multiple imputed datasets; finally, apply a Bonferroni adjustment to obtain the adjusted p-values for inferences;
(4) Multiple imputation with Holm’s procedure: First, perform multiple imputation on the incomplete data data via regression method or propensity-score method; then, obtain the unadjusted p-values from two-sample t tests for k comparisons based on multiple imputed datasets; finally, apply Holm’s procedure to obtain the adjusted p-values for inferences;
(5) Multiple imputation with the proposed procedure: First, perform multiple imputation on the incomplete data via regression method or propensity-score method; then, use the proposed procedure (equal variances assumption) to produce simultaneous statistical inferences based on multiple imputed datasets.
The data generation process and multiple imputation process for (3), (4) and (5) were similar to the first simulation study, except that the missing rate was fixed at 30% and sample size in each group was varied, i.e., = = , = 80 or 120, . FWER in the first scenario and power in the second scenario from 15,000 simulations at group sample size 80 and 120 are tabulated in Table 4. The FWER is calculated as the proportion of times that there is at least one false rejection. The power is calculated as the proportion of times in which a separate null hypothesis of no difference is rejected and in which both null hypotheses of no difference are simultaneously rejected [37].
Table 4.
Rejection rates of null hypothesis using different correction or adjustment methods.
Table 4 indicates that FWER by single imputation method is much large than the pre-specified , which implies that the method is much more prone to detect significant results incorrectly. The poor performance suggest that single imputation method is not an appropriate solution for this problem at all. Hence, the high test power of the single imputation method is not worth discussing.
In Scenario I, the case deletion method and multiple imputation via propensity-score method with three adjustment approaches (Bonferroni adjustment, Holm’s procedure, and the proposed procedure) can control the FWER well under nominal (5%), while the latter generates more conservative interval estimations. Multiple imputation via regression method with three adjustment approaches provides interval estimations which are neither conservative nor overconfident, as the empirical FWER is very close to the nominal level, while FWER from adjustment by the new procedure is the closest.
In Scenario II, the multiple imputation via regression method with three adjustment approaches has similar test power with the case deletion method, while the multiple imputation via propensity-score method performs a little worse than case deletion and multiple imputation via propensity-score method. Among the three adjustment approaches for multiple imputation, Holm’s procedure has a sightly advantage in test power than the other two. One possible reason is that k in this simulation study is too small to demonstrate the new procedure’s superiority in accounting for correlations between (among) comparisons. Envisage a scenario when it is desired to strictly control the FWER under a pre-specified level, the proposed procedure via propensity-score method for multiple imputation can be considered; however, the interval estimations might be relatively conservative. Envisage another scenario when it is desired to simultaneously control FWER for those comparisons without difference and preserve test power for other comparisons with difference in a many-to-one comparison, especially when the number of comparisons k is large, the proposed procedure via regression method for multiple imputation is recommended.
6. Application
As an example, we considered the data from a randomized, double-blind, placebo-controlled Phase II dose-finding study described by Bretz et al. [38]. In this study, we included 100 patients who were equally allocated to either placebo (dose = 0) or one of four active dosages (dose = 0.05, 0.2, 0.6 and 1), and their responses to the drug were measured. The actual dosages in the original study design were scaled to lie within the [0, 1] interval to maintain confidentiality. The response variable was tested to be normally distributed, and larger response values indicated better outcome. In such a dose finding study, patients who receive placebo or lower dosages might drop out early due to poor efficacy, while patients who receive higher dosages might also drop out early due to adverse drug reaction. These patients did not show up again, causing missing observations in the response. In this case, the data are missing at random since there is a systematic relationship between the propensity of missing values and the treatment allocations. The total missing rate in data is approximately 30%. The missing values are identified with NA in the first section of Table 5. We imputed the incomplete dataset twenty times with the propensity-score method. We obtained 20 imputed complete datasets, and the plausible values in parentheses replacing the missing values are different each time; the first three imputed datasets are tabulated in Table 5.
Table 5.
The original and imputed complete dose response data.
To test the homogeneity of variance in the underlying distribution, we performed Levene’s test with squared residuals [39] on the incomplete data. Since the p-value of the test is 0.125, the null hypothesis of homogeneity of variance is not rejected under the significance level of 0.05. Using the proposed procedure under assumption of homogeneity of variance in Section 3, the point estimates and their 95% two-sided confidence intervals of this four-to-one comparison of group means were drawn from the 20 imputed complete datasets, as given in the first section of Table 6. Additionally, the point and interval estimations based on each imputed dataset by the standard Dunnett’s procedure and the pooled point and interval estimations based on 20 imputed datasets by the proposed procedure are illustrated in Figure 1. The pooled confidence intervals show that, based upon the incomplete dataset, an active drug dosage of 0.2, 0.6, or 1 has significantly better response than placebo. Compared to the proposed procedure, the lengths of confidence intervals by naive deletion Dunnett’s procedure, presented in the second section of Table 6, are wider, implying a significant improvement in interval estimations using the proposed method, while there is not much difference between the point estimates by the two procedures.
Table 6.
Simultaneous statistical inferences of mean differences in dose response.
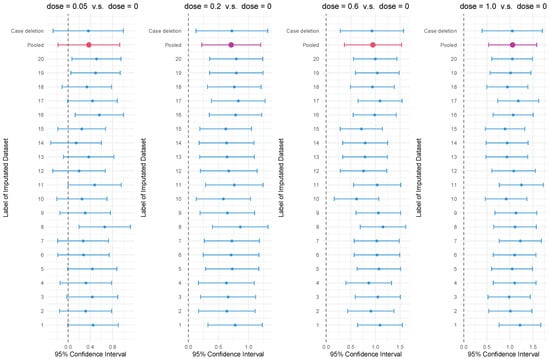
Figure 1.
Forest plot showing the point estimates and 95% confidence intervals with the multiple imputation dataset and the pooled 95% confidence intervals in many-to-one comparisons.
7. Discussion
In this article, we investigated comparing group means of several treatments against a control group in the presence of missing observations. By associating the group mean differences with a multivariate normal distributed quantity, we obtained their underlying conditional multivariate t distributions following Rubin’s derivation of the repeated-imputation inferences, thereby constructing the simultaneous statistical inferences for this problem. The proposed procedure is shown to possess good frequency properties in simulations. Specifically, as the missing rate rises higher, the joint coverages of confidence intervals can archive the nominal coverage generally, and the interval estimations can preserve comparable precision to Rubin’s repeated-imputation inferences, as they have close expansion rates of interval length. The proposed procedure with propensity-score method for imputation is shown to generate more conservative interval estimations and control the FWER well. The proposed procedure with regression method for imputation provides confidence intervals which are neither conservative nor overconfident, as the empirical FWER is very close to the nominal , while the test power can be persevered well.
The proposed procedure gives inferences both under assumption of homogeneity of variance and assumption of heterogeneity of variance. Unless the group variances are extremely different, the inference under assumption of homogeneity is relatively robust and superior, due to fewer degrees of freedom. Researchers are recommended to choose the assumption of variance based not only the homogeneity of variance test but also the features of data population. As Box notes, “To make the preliminary test on variances is rather like putting to sea in a rowing boat to find out whether conditions are sufficiently calm for an ocean liner to leave port!” (Box, 1953) [40]
Based on the same t distribution for references in Rubin’s derivation of the repeated-imputation inferences, the proposed procedure has exactly the same point estimates as repeated-imputation inferences from two-sample t tests between each treatment with the control, with adjusted interval estimations only. Therefore, it gives unbiased point estimates when the data are missing at random [21]. The proposed procedure might be invalid when the data are not missing at random. Therefore, researchers should scrutinize the reasons for missing data, to see if the assumption of missing at random holds before using the proposed procedure.
The proposed procedure does not give any derivation of p-values for testing simultaneous null hypotheses. The presentation of multiple comparison inference in terms of p-values is not recommended by Hsu [41], as the confidence intervals are always more informative [14]. When is rejected, the confidence interval gives additional information on the magnitude of the difference, which is not conveyed by the associated p-value. When is accepted, the associated p-value cannot differentiate between the possibility that the difference exists but the sample size is too small to detect the difference, and the possibility that the difference does not exist. In spite of these, it is often desirable to see the p-value, as it is more intuitive for inference. The derivation of p-values for the proposed procedure will be investigated in a future study.
The proposed procedure conducts many-to-one comparisons on the means, which might be adequate for comparing groups in one-way and approximately balanced designs. However, in unbalanced designs with more than one effect, the arithmetic mean might not accurately reflect the reality, and the least squares (LS) mean adjusted for other effects might be more appropriate [42]. Performing many-to-one comparisons with LS means from a linear model on multiple imputed datasets based on similar derivation in this article might be another subject of future research. In a liner model comparing LS means, the impact from systematic differences between the complete cases and the incomplete cases might be investigated deeply via simulations introducing other effects, and, thereby, the superiority of the multiple imputation method against a naive case deletion method might be significantly demonstrated.
8. Conclusions
In this paper, we propose an improved Dunnett’s procedure that can construct unique ensemble confidence interval for comparing group means of several treatments with a control in the presence of missing observations. This work fills the current research gap, that is, the lack of a standard approach for combining estimations of confidence intervals obtained from multiple imputed dataset.The proposed method extends Rubin’s rule of point estimation to a rule of interval combination.The effectiveness of the proposed procedure is demonstrated to be good through simulation studies with finite sample sizes. Compared to other methods, the confidence interval constructed using the proposed method controls the FWER better.
Author Contributions
Conceptualization, W.J. and B.L.; methodology, W.J., J.Z. and B.L.; software, W.J.; validation, W.J., J.Z. and B.L.; formal analysis, W.J. and B.L.; investigation, W.J., J.Z. and B.L.; resources, B.L.; data curation, B.L.; writing—original draft preparation, W.J. and B.L.; writing—review and editing, W.J., J.Z. and B.L.; visualization, W.J., J.Z. and B.L.; supervision, B.L.; project administration, B.L.; funding acquisition, B.L. All authors have read and agreed to the published version of the manuscript.
Funding
This research was supported by the National Natural Science Foundation of China (No.11901013), the Fundamental Research Funds for the Central Universities, and the Beijing Natural Science Foundation (No.1204031).
Data Availability Statement
The data presented in this study are available upon request from the corresponding author.
Conflicts of Interest
The authors declare no conflict of interest.
References
- Dunnett, C.W. A Multiple Comparison Procedure for Comparing Several Treatments with a Control. J. Am. Stat. Assoc. 1955, 50, 1096–1121. [Google Scholar] [CrossRef]
- Passing, H. Exact Simultaneous Comparisons with Control in an r × c Contingency Table. Biom. J. 1984, 26, 643–654. [Google Scholar] [CrossRef]
- Piegorsch, W.W. Multiple Comparisons for Analyzing Dichotomous Response. Biometrics 1991, 47, 45–52. [Google Scholar] [CrossRef]
- Goodman, L.A. Simultaneous confidence intervals for contrasts among multinomial proportions. Ann. Math. Stat. 1964, 35, 716–725. [Google Scholar] [CrossRef]
- Schaarschmidt, F.; Biesheuvel, E.; Hothorn, L.A. Asymptotic Simultaneous Confidence Intervals for Many-to-One Comparisons of Binary Proportions in Randomized Clinical Trials. J. Biopharm. Stat. 2009, 19, 292–310. [Google Scholar] [CrossRef] [PubMed]
- Klingenberg, B. Simultaneous confidence bounds for relative risks in multiple comparisons to control. Stat. Med. 2010, 29, 3232–3244. [Google Scholar] [CrossRef]
- Herberich, E.; Hothorn, T. Dunnett-type-Inference in the frailty Cox model with covariates. Stat. Med. 2012, 31, 45–55. [Google Scholar] [CrossRef]
- Chakraborti, S.; Desu, M.M. Linear rank tests for comparing treatments with a control when data are subject to unequal patterns of censorship. Stat. Neerl. 1991, 45, 227–254. [Google Scholar] [CrossRef]
- Chen, Y.I. Multiple comparisons in carcinogenesis study with right-censored survival data. Stat. Med. 2000, 19, 353–367. [Google Scholar] [CrossRef]
- Wu, S.F. One stage multiple comparisons of k-1 treatment mean lifetimes with the control for exponential distributions under heteroscedasticity. Commun. Stat. Simul. Comput. 2018, 47, 2968–2978. [Google Scholar] [CrossRef]
- Wu, S.F. One stage multiple comparisons with the control for exponential mean lifetimes based on doubly censored samples under heteroscedasticity. Commun. Stat. Simul. Comput. 2021, 50, 1473–1483. [Google Scholar] [CrossRef]
- Chauhan, R.S.; Singh, P.; Kumar, N. Multiple comparisons with a control in direction-mixed families of hypothesis under heteroscedasticity. Stat. Probab. Lett. 2013, 83, 2679–2687. [Google Scholar] [CrossRef]
- Cheung, S.H.; Kwong, K.S.; Chan, W.S.; Leung, S.P. Multiple comparisons with a control in families with both one-sided and two-sided hypotheses. Stat. Med. 2004, 23, 2975–2988. [Google Scholar] [CrossRef] [PubMed]
- Kwong, K.S.; Cheung, S.H.; Holl, B.; Wang, Y. Three p-value consistent procedures for multiple comparisons with a control in direction–mixed families. Stat. Med. 2007, 26, 4253–4272. [Google Scholar] [CrossRef]
- Chauhan, R.S.; Singh, P.; Kumar, N. Simultaneous confidence intervals for comparing several exponential location parameters with control in direction-mixed families. J. Stat. Manag. Syst. 2017, 20, 421–440. [Google Scholar] [CrossRef]
- Gao, J.; Su, F.; Hu, F.; Cheung, S.H. Adaptive treatment allocation for comparative clinical studies with recurrent events data. Biometrics 2020, 76, 183–196. [Google Scholar] [CrossRef]
- Gao, J.; Hu, F.; Cheung, S.H.; Su, P.F. Response-adaptive treatment randomization for multiple comparisons of treatments with recurrentevent responses. Stat. Methods Med. Res. 2022, 31, 1549–1565. [Google Scholar] [CrossRef]
- Liu, L.; Lee, C.-I.C.; Peng, J. Simultaneous confidence bounds in monotone dose–response studies. J. Stat. Plan. Inference 2014, 145, 113–124. [Google Scholar] [CrossRef]
- Yang, Z.; Tian, G.; Liu, X.; Ma, C. Simultaneous confidence interval construction for many-to-one comparisons of proportion differences based on correlated paired data. J. Appl. Stat. 2021, 48, 1442–1456. [Google Scholar] [CrossRef]
- Maharjan, R. Simultaneous Inference with Application to Dose-Response Study; Bowling Green State University: Bowling Green, OH, USA, 2022. [Google Scholar]
- Rubin, D.B. Multiple Imputation for Nonresponse in Surveys; John Wiley & Sons, Inc.: New York, NY, USA, 1987; pp. 11–18, 114, 117, 166–167. [Google Scholar]
- Schafer, J.L. Analysis of Incomplete Multivariate Data; Taylor and Francis: Washington, DC, USA; CRC Press: Boca Raton, FL, USA, 1997; Chapter 1. [Google Scholar]
- Schafer, J.L.; Yucel, R.M. Computational Strategies for Multivariate Linear Mixed-Effects Models with Missing Values. J. Comput. Graph. Stat. 2002, 11, 437–457. [Google Scholar] [CrossRef]
- Rubin, D.B. An overview of multiple imputation. In Proceedings of the Survey Research, Princeton, NJ, USA, 20–22 October 1988; pp. 79–84. [Google Scholar]
- Holland, B.S.; Copenhaver, M.D. Improved Bonferroni-type multiple testing procedures. Psychol. Bull. 1988, 104, 145–149. [Google Scholar] [CrossRef]
- Holm, S. A simple sequentially rejective multiple test procedure. Scand. J. Stat. 1979, 6, 65–70. [Google Scholar]
- Vasilopoulos, T.; Morey, T.E.; Dhatariya, K.; Rice, M.J. Limitations of Significance Testing in Clinical Research. Anesth. Analg. 2016, 122, 825–830. [Google Scholar] [CrossRef] [PubMed]
- Voelkl, B. Multiple testing: Correcting for alpha error inflation with false discovery rate (FDR) or family-wise error rate? Anim. Behav. 2019, 155, 173–177. [Google Scholar] [CrossRef]
- Rubin, D.B. Inference and Missing Data. Biometrika 1976, 63, 581–592. [Google Scholar] [CrossRef]
- Heitjan, D.F.; Little, R.J.A. Multiple Imputation for the Fatal Accident Reporting System. Appl. Stat. 1991, 40, 13–29. [Google Scholar] [CrossRef]
- Schenker, N.; Taylor, J.M.G. Partially parametric techniques for multiple imputation. Comput. Stat. Data Anal. 1996, 22, 425–446. [Google Scholar] [CrossRef]
- Lavori, P.W.; Dawson, R.; Shera, D. A multiple imputation strategy for clinical trials with truncation of patient data. Stat. Med. 1995, 14, 1913–1925. [Google Scholar] [CrossRef]
- Rosenbaum, P.R.; Rubin, D.B. The central role of the propensity score in observational studies for causal effects. Biometrika 1983, 70, 41–55. [Google Scholar] [CrossRef]
- Alan, G.; Bretz, F. Computation of Multivariate Normal and t Probabilities; Springer: Berlin/Heidelberg, Germany, 2009; Volume 195, pp. 2–4. [Google Scholar]
- Genz, A.; Bretz, F.; Miwa, T.; Mi, X.; Leisch, F.; Scheipl, F.; Hothorn, T. mvtnorm: Multivariate Normal and t Distributions, R package version 1.1-0. 2020.
- Bornkamp, B. Calculating quantiles of noisy distribution functions using local linear regressions. Comput. Stat. 2018, 33, 492–493. [Google Scholar] [CrossRef]
- Burton, A.; Altman, D.G.; Royston, P.; Holder, R.L. The design of simulation studies in medical statistics. Stat. Med. 2006, 25, 4287–4288. [Google Scholar] [CrossRef] [PubMed]
- Bretz, F.; Pinheiro, J.C.; Branson, M. Combining multiple comparisons and modeling techniques in dose-response studies. Biometrics 2005, 61, 738–748. [Google Scholar] [CrossRef] [PubMed]
- Levene, H. Robust tests for equality of variances. In Contributions to Probability and Statistics: Essays in Honor of Harold Hotelling; Olkin, I., Ghurye, S.G., Hoeffding, W., Madow, W.G., Mann, H.B., Eds.; Stanford University Press: Palo Alto, CA, USA, 1960; Volume 2, pp. 278–292. [Google Scholar]
- G. E. P. Box. Non-normality and tests on variance. Biometrika 1953, 4, 318–335. [Google Scholar]
- Hsu, J. Multiple Comparisons: Theory and Methods, 1st ed.; Chapman & Hall: London, UK, 1996; p. 4. [Google Scholar]
- Rosner, B. Fundamentals of Biostatistics, 7th ed.; Brooks Cole: Belmont, CA, USA, 2010; p. 546. [Google Scholar]

Disclaimer/Publisher’s Note: The statements, opinions and data contained in all publications are solely those of the individual author(s) and contributor(s) and not of MDPI and/or the editor(s). MDPI and/or the editor(s) disclaim responsibility for any injury to people or property resulting from any ideas, methods, instructions or products referred to in the content. |
© 2023 by the authors. Licensee MDPI, Basel, Switzerland. This article is an open access article distributed under the terms and conditions of the Creative Commons Attribution (CC BY) license (https://creativecommons.org/licenses/by/4.0/).