Article

New Physical–Mathematical Analysis of Cardiac Dynamics and Temperature for the Diagnosis of Infectious Disease

by
Leonardo Juan Ramirez Lopez
1,*,
Sandra Catalina Correa Herrera
2 and
José Arturo Lagos Sandoval
3
1
TIGUM Research Group, Universidad Militar Nueva Granada, Bogota 250247, Colombia
2
Hospital Universitario Nacional de Colombia, Bogota 250247, Colombia
3
INAMPE Research Group, Universidad Militar Nueva Granada, Bogota 250247, Colombia
*
Author to whom correspondence should be addressed.
Mathematics 2023, 11(15), 3374; https://doi.org/10.3390/math11153374
Submission received: 2 June 2023 / Revised: 25 July 2023 / Accepted: 31 July 2023 / Published: 2 August 2023

Abstract

:
Background: Physical and mathematical theories have made it possible to generate methods for the characterization and diagnosis of physiological variables such as cardiac dynamics. Therefore, it would be useful to implement them to evaluate the dynamic changes in human physiology during the development of COVID-19, which causes disease, severe respiratory and death. Objective: to establish a method for detecting possible alterations associated with COVID-19 through simulations of adult cardiac dynamics and body temperature using dynamic systems theory, probability, entropy and set theory. Methodology: simulations of cardiac dynamics were generated in subjects with 10 temperature ranges between 32 °C and 42 °C via numerical attractors after their evaluation using entropy proportions. Results: differences were observed in the proportions of entropy that differentiate normal cardiac dynamics and acute myocardial infarction towards progression to fever. Conclusion: the physical mathematical analysis of cardiac behavior in relation to body temperature in people with COVID-19 allowed the establishment of a possible surveillance method for detecting minor alterations.
MSC:
92C30

1. Introduction

Coronaviruses (CoVs) are one of the largest viral groups described so far that can cause disease in humans, and they mainly operate at the respiratory level [1]. SARS-CoV-2 is found among CoVs. This produces coronavirus-induced disease 2019 (COVID-19) and is the CoV that has had the most relevance in recent years due to its great impact on the population and its global spread. Indeed, it caused a pandemic from 11 March 2020 according to the World Health Organization [2,3].
Airborne transmission is key to SARS-CoV-2 since this mechanism sustains respiratory tract infection. However, other means of contagion have also been demonstrated, such as hand-to-hand contact or touching contaminated surfaces [4]. After infection, the virus incubates in humans for a period of 2 to 12 days [5]. This phase is usually asymptomatic and is key to facilitating viral dissemination since asymptomatic carriers can infect healthy people [6,7]. Additionally, studies have shown that carriers can remain asymptomatic or may develop mild symptoms that are indistinguishable from those of a common cold. Therefore, this population can easily be neglected [8,9,10,11,12].
Fever is one of the most relevant symptoms of COVID-19. This is because, although it is not an exclusive symptom, its presence can be used as a rapid screening clinical strategy to identify potential new cases. This explains why it has been used for this purpose in public and crowded places, such as airports or shopping centers [13,14]. Further, it has been documented that fever is often associated with increases in heart rate, which vary according to age and gender. However, it has been documented that each increase of 10 °C body temperature is associated with an increase of approximately 8.35 heartbeats per minute [15,16,17].
Heartrate increases can cause significant cardiovascular risk impact among patients with COVID-19 and other comorbidities since one of the risk factors that has been related to the greater severity of the disease is the presence of comorbidities, such as chronic heart disease or hypertension [12,18]. These may be exacerbated in this scenario and may contribute to the mortality of this population [12,18,19,20]. These reasons justify the development of detailed studies on the behavior of cardiac dynamics in relation to the increase in temperature in patients with COVID-19. This is because it has been established that body temperature can be a marker of disease severity among hospitalized patients [20].
However, there are currently no documented predictive models that simultaneously consider cardiac dynamics and body temperature to evaluate the evolution of the disease. For this reason, physical and mathematical theories, such as probability and set theories, as well as entropy and dynamical systems [21,22], could have promising roles in this context [23,24]. These systems have the foundations to relate multiple variables from an acausal perspective and evaluate their changes over time.
The probability theory was developed to evaluate phenomena that present pseudo-random behaviors that cannot be defined from completely deterministic patterns [25]. This is how probability establishes the possibility of an event occurring within a range of possibilities [26,27]. For its part, the theory of dynamic systems allows us to evaluate the evolution of natural phenomena and limit those that are apparently unpredictable [28] by means of specific mathematical spaces called phase spaces, where the figures that represent the evolution of the systems are predictable or unpredictable. They are called attractors and, for the latter case, chaotic attractors schematize this class of systems [28,29,30,31]. Their irregularity has been exploited by fractal geometry for its evaluation [30,31].
Entropy has received different interpretations [32,33,34,35]. However, one of the most important is related to Boltzmann. This defines entropy as an indirect measure of the number of microstates that characterize a system using a value proportional to the logarithm of the number of possible microstates [36,37], supporting the development of several physical models [38,39,40,41,42,43,44]. Finally, set theory evaluates properties such as relationships between sets of elements through basic notions such as membership, union, intersection, difference, complement, or symmetric difference [45].
From these mathematical theories, diagnostic and predictive methods of cardiac dynamics with clinical application have been developed. An example of this is a methodology based on the theories of dynamic systems and probability, as well as the concept of entropy. This works to quantify the proportional entropy of ordered pairs of heart rates through numerical attractors [46]. Similarly, from set algebra and probability theory, predictions of CD4 lymphocyte populations have been established with respect to other cell lines reported from the hemogram [47].
Based on the aforementioned problems and the physical–mathematical context, the purpose of this research is to establish a method for the simultaneous evaluation of adult cardiac dynamics and body temperature. The development of this will allow the detection of possible alterations associated with COVID-19 in the context of dynamical systems theory, probability, entropy, and set theory.

2. Materials and Methods

To start, it is important to present some definitions from the context of this study:
Delay map: defined as a geometric representation of the dynamics of a system, locating ordered pairs of values of a consecutive dynamic variable in time in a geometric space of two or more dimensions, thereby generating a type of specific attractor [46].
Ordered pair of heart rates: represents any combination of two consecutive heart rates in ranges of five beats/minute that are located, respectively, on the x axis and the y axis of the delay map [46].
Probability of consecutive ordered pairs in ranges of 5: division between the number of ordered pairs located in each range of 5 beats/minute, with respect to the total ordered pairs of the plot [46].
P X ,   Y = N u m b e r   o f   o r d e r e d   p a i r s   f o u n d   i n   t h e   r a n g e   X ,   Y T o t a l   o r d e r e d   p a i r s   o f   t h e   p l o t
Entropy of the cardiac attractor: the entropy of the numerical attractors is obtained from the Boltzmann/Gibbs formula [46].
S = k x = 1 n y = 1 n P X ,   Y × L n P X ,   Y
S is the entropy, k is the Boltzman constant (1.38 × 10⁻²³ Joules/Kelvin), and P (X, Y) corresponds to the probability for each rank (X, Y).
Proportions of the entropy of the cardiac attractor [46]: they are established based on the algebraic clearing of the constant k, following Equation (3).
S k = x = 1 n y = 1 n P X ,   Y × L n P X ,   Y
The summations of Equation (3) can be broken down as:
S k = U P U × L n P U               w h e r e   U = U n i t s   ( 1 9 ) D P D × L n P D             w h e r e   D = T e n s   ( 10 99 ) C P C × L n P C                 w h e r e   C = H u n d r e d s   ( 100 999 ) M P M × L n P M             w h e r e   M = M i l e s   ( 1000 9999 )
Equation (3) can be expressed in a simplified way according to Equation (4)
S k = T = U + D + C + M ;
The proportions between the parts (U, D, C, M) and the whole (T) are established as follows [47].
U T ; D T ; C T M ; M T ; C T   a n d   D C
Regions of the attractor [47]:
Region 1: encompasses all HR ranges that were shared by all the normal electrocardiographic recordings of the induction developed by Rodríguez et al.
Region 2: set of ranges occupied by any of the normal electrocardiographic records, except those of region 1.
Region 3: remaining region of the delay map, that is, the HR ranges that are not occupied by regions 1 and 2 [46].

Procedure: Analysis of the Cardiac Dynamics

Initially, simulations of the cardiac dynamics of the adult were carried out. For this, groups of 10 simulations were defined from variations of 8.35 beats/minute for each degree of temperature between 32 °C and 42 °C. This temperature variation was established from the information that what was reported by Broman et al. [17] in critically ill patients in the intensive care unit. Because one of the outcomes of interest among patients with COVID-19 is hospitalization in this unit, the experimental evidence reported was used as a reference with which to perform the simulations.
Subsequently, the record of each simulation was evaluated. To do so, we used a previously developed methodology [46] to establish the physical–mathematical characteristics of each of the established groups. For this, a numerical attractor was built on a delay map in which the ordered pairs that make up the sequence of the heart rates of each of the dynamics, which were themselves grouped into ranges of five beats/minute, were plotted.
Next, the probability of each frequency against the totality of each of the regions (see definitions) was calculated using Equation (1). Based on these values, the entropy of each attractor was established using Equation (2). Then, from this, the constant k was cleared to obtain Equation (3). Then, we calculated the proportions between each addend and the totality, as well as the proportions of hundreds with respect to thousands, and tens with respect to hundreds, for each region, following Equation (4).
Subsequently, we established whether the state was normal or abnormal via the diagnostic parameters methodology [46]. This involved evaluating if at least two of the proportions of entropy in any of the three regions evaluated were outside the limit normality, which is equivalent to a state of abnormality. In the event that there was only a proportion outside these values, or none at all, a state of normality was established.
In order to assess the level of severity of pathological cases, the upper and lower limit values of the entropy proportions of the normal attractors that had previously been established for each region were taken [46]. For the values of the entropy proportions that present a value higher than these limits, the upper limit of normality, which is exceeded, was subtracted. Conversely, the values lower than the minimum value of normality were subtracted. The results of these subtractions were added by groups according to their orders of magnitude, whether of units, tens, hundreds and thousands. Based on these values, we determined how far the dynamics are from a state of normality, in which higher values are associated with more acute pathologies and lower values are associated with milder pathologies.

3. Results

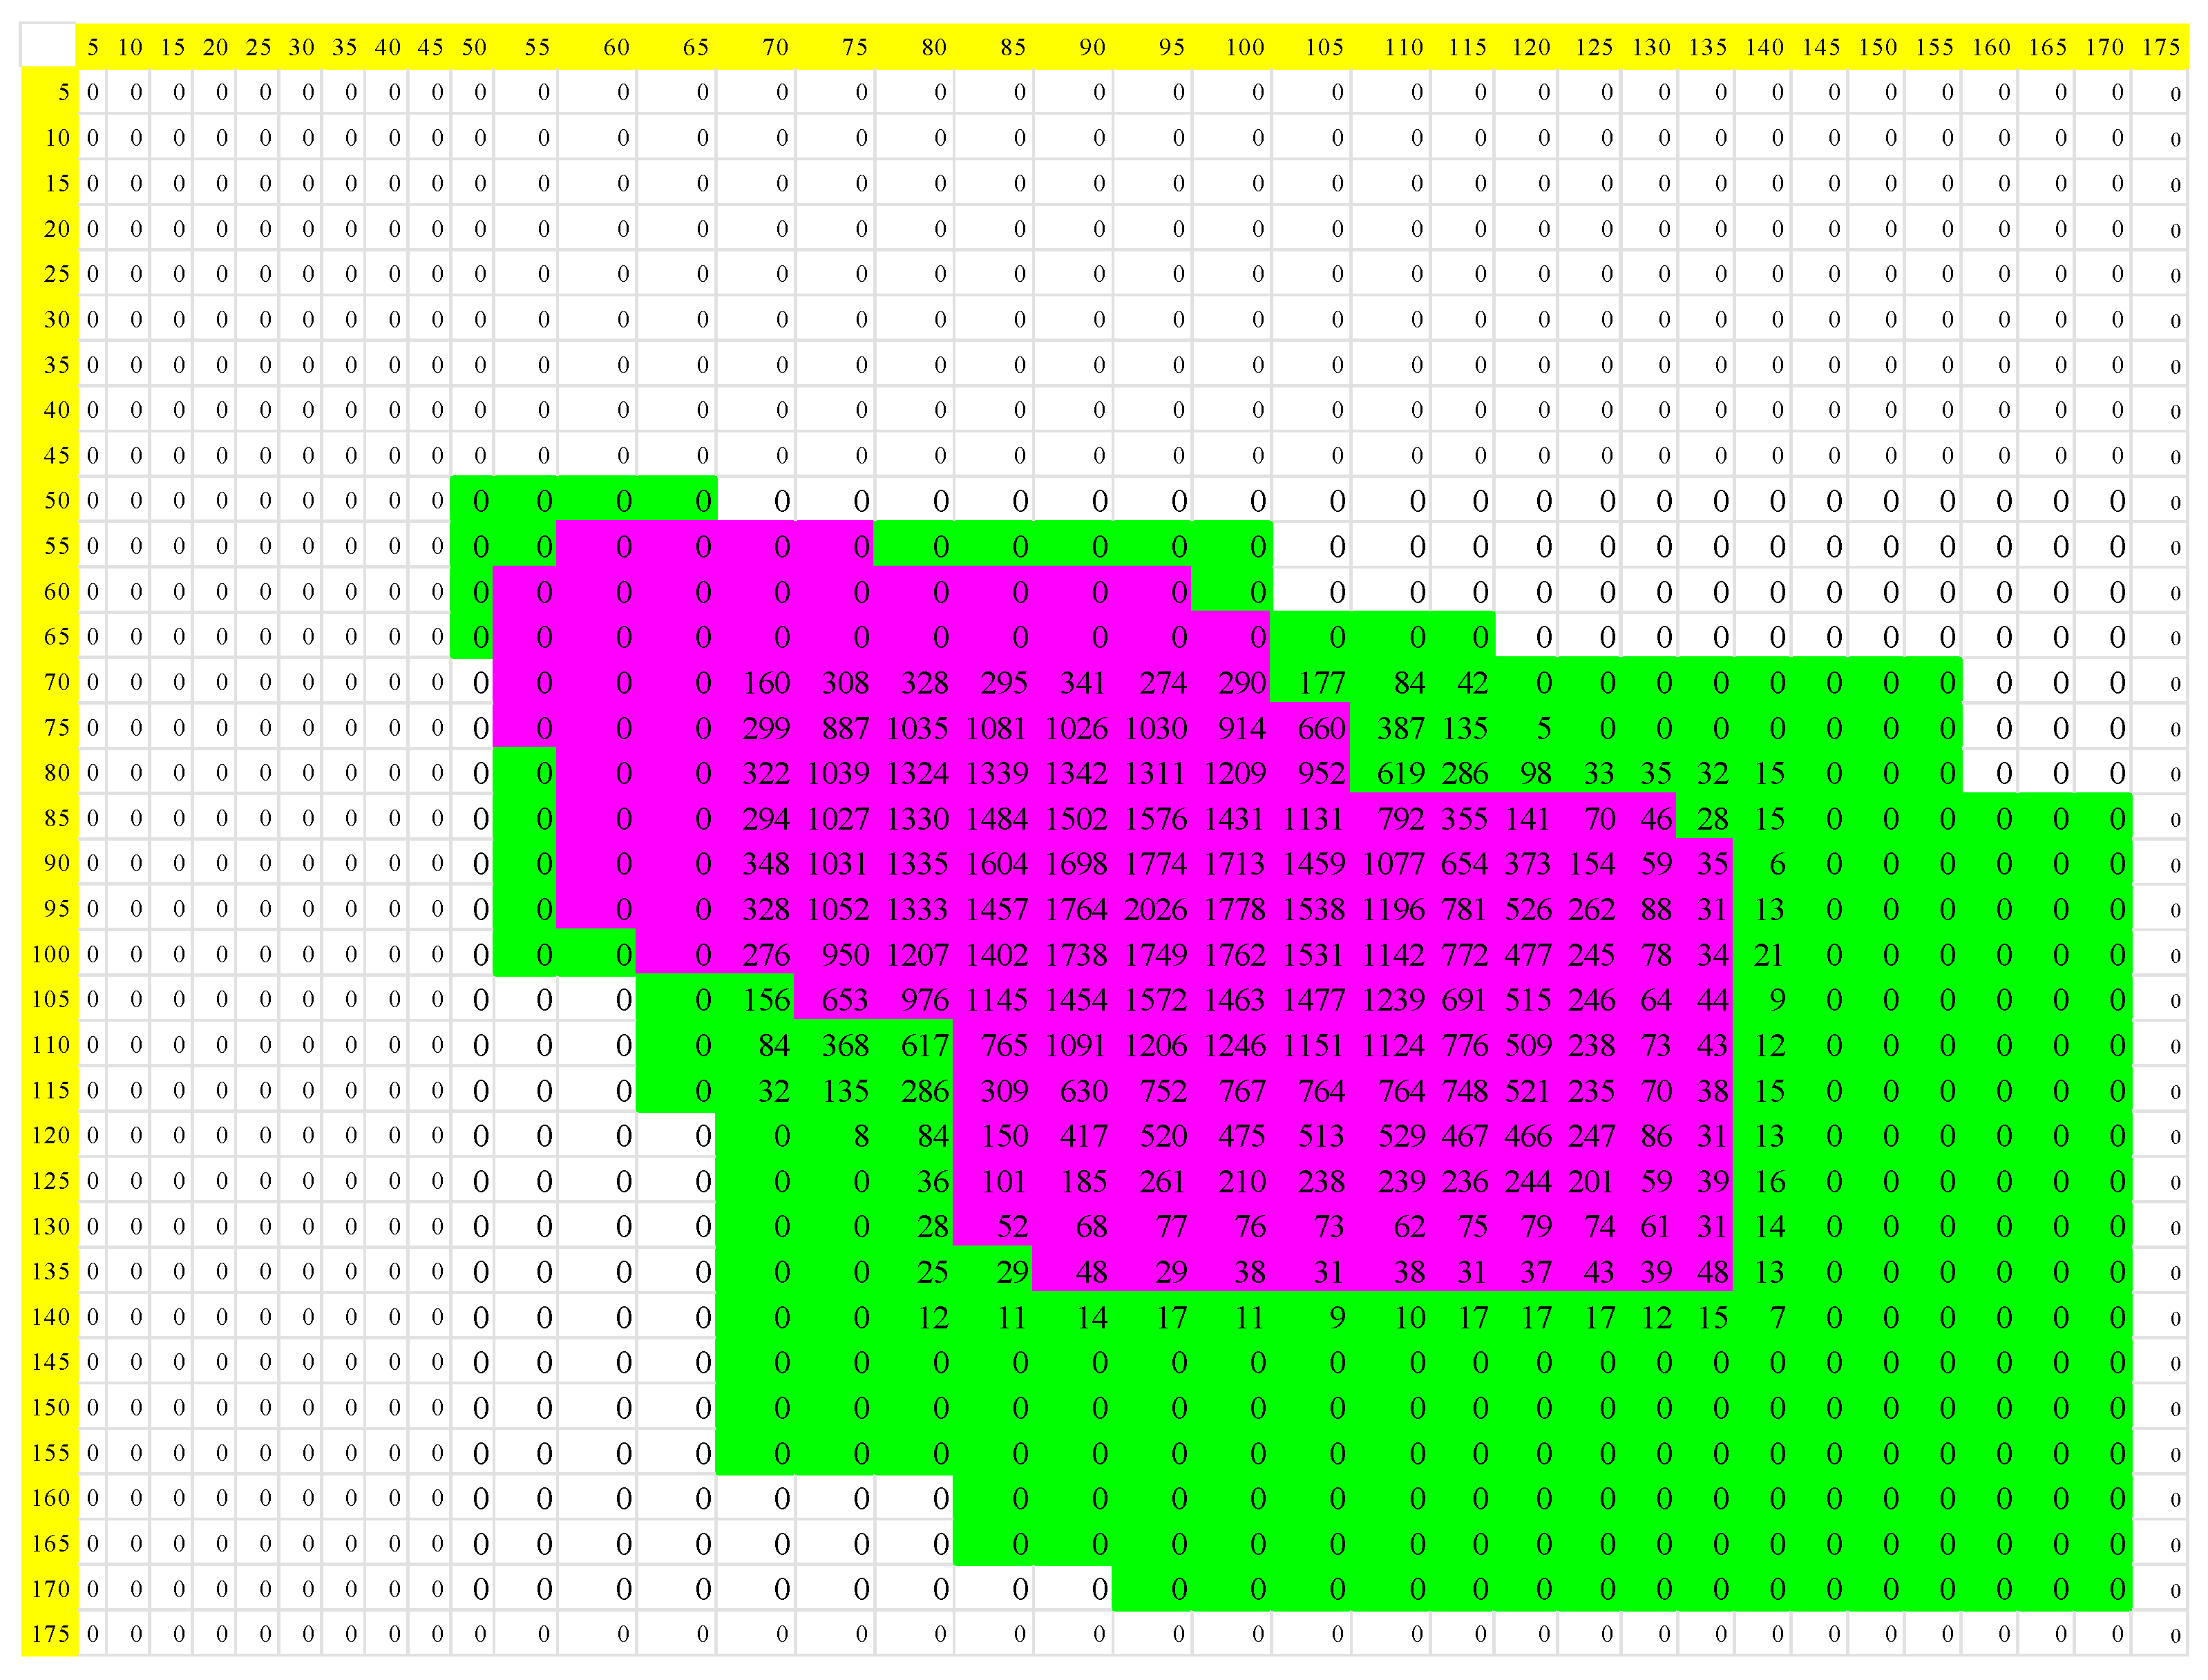
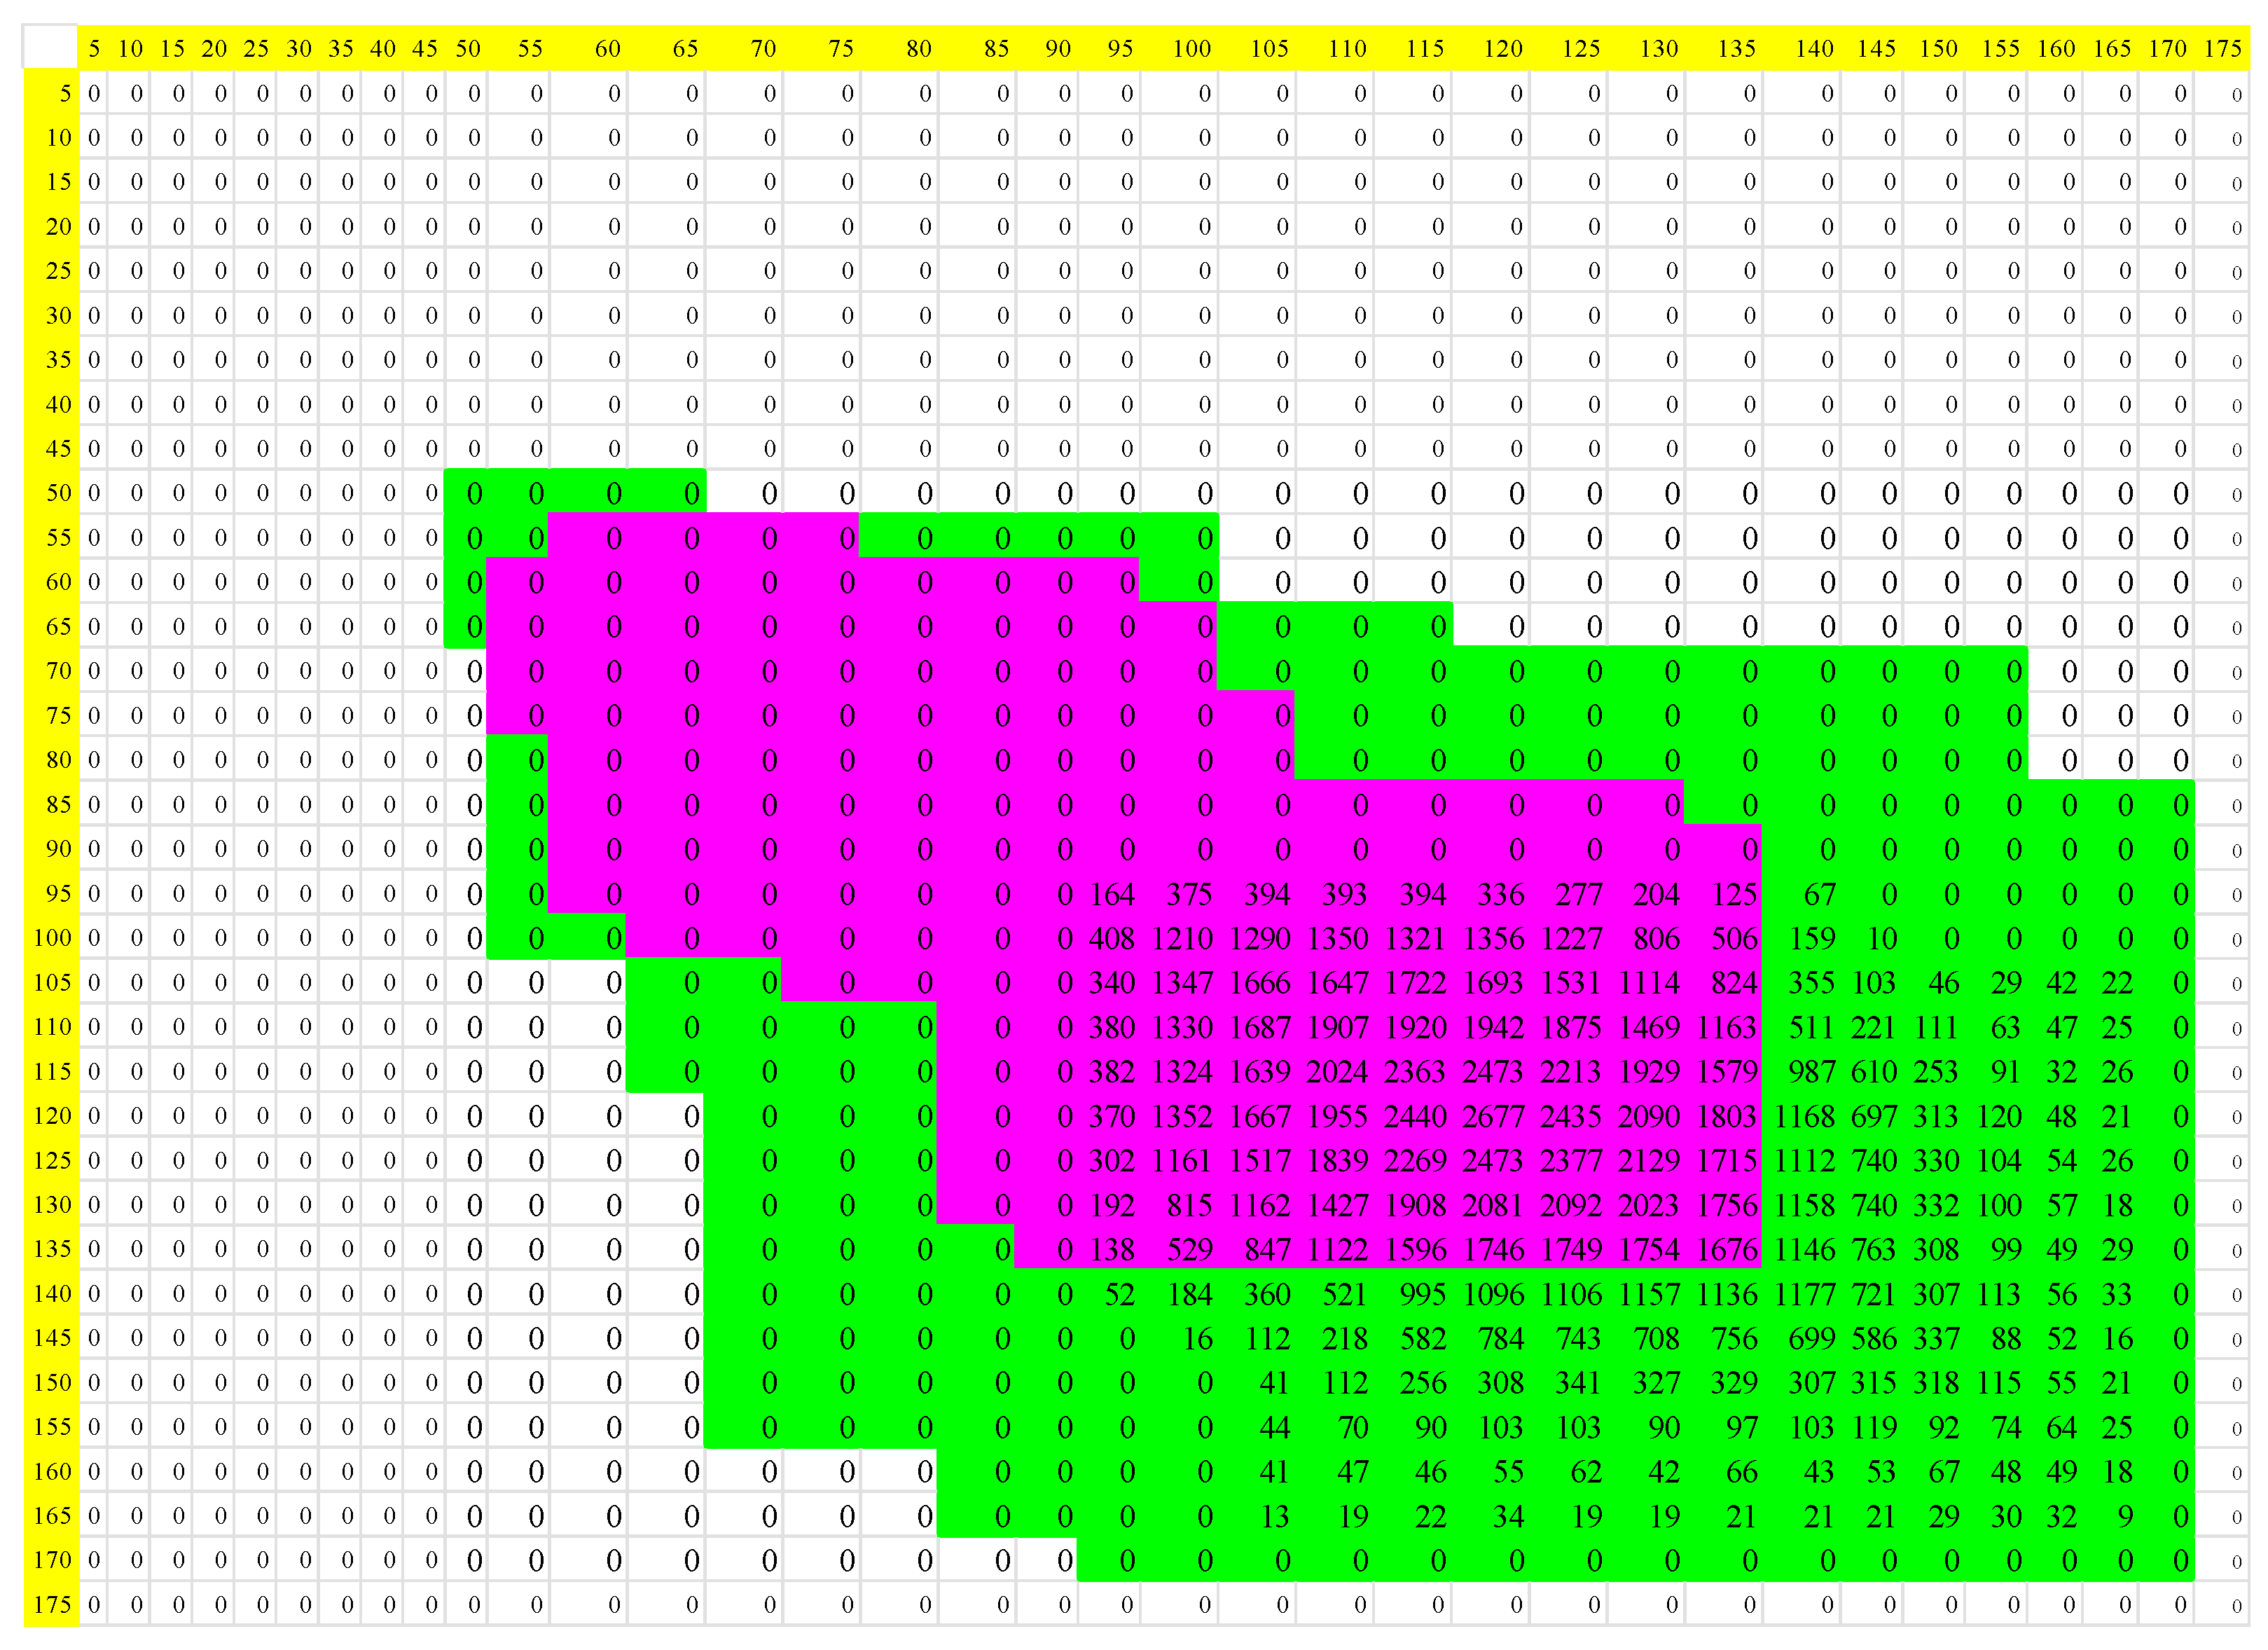
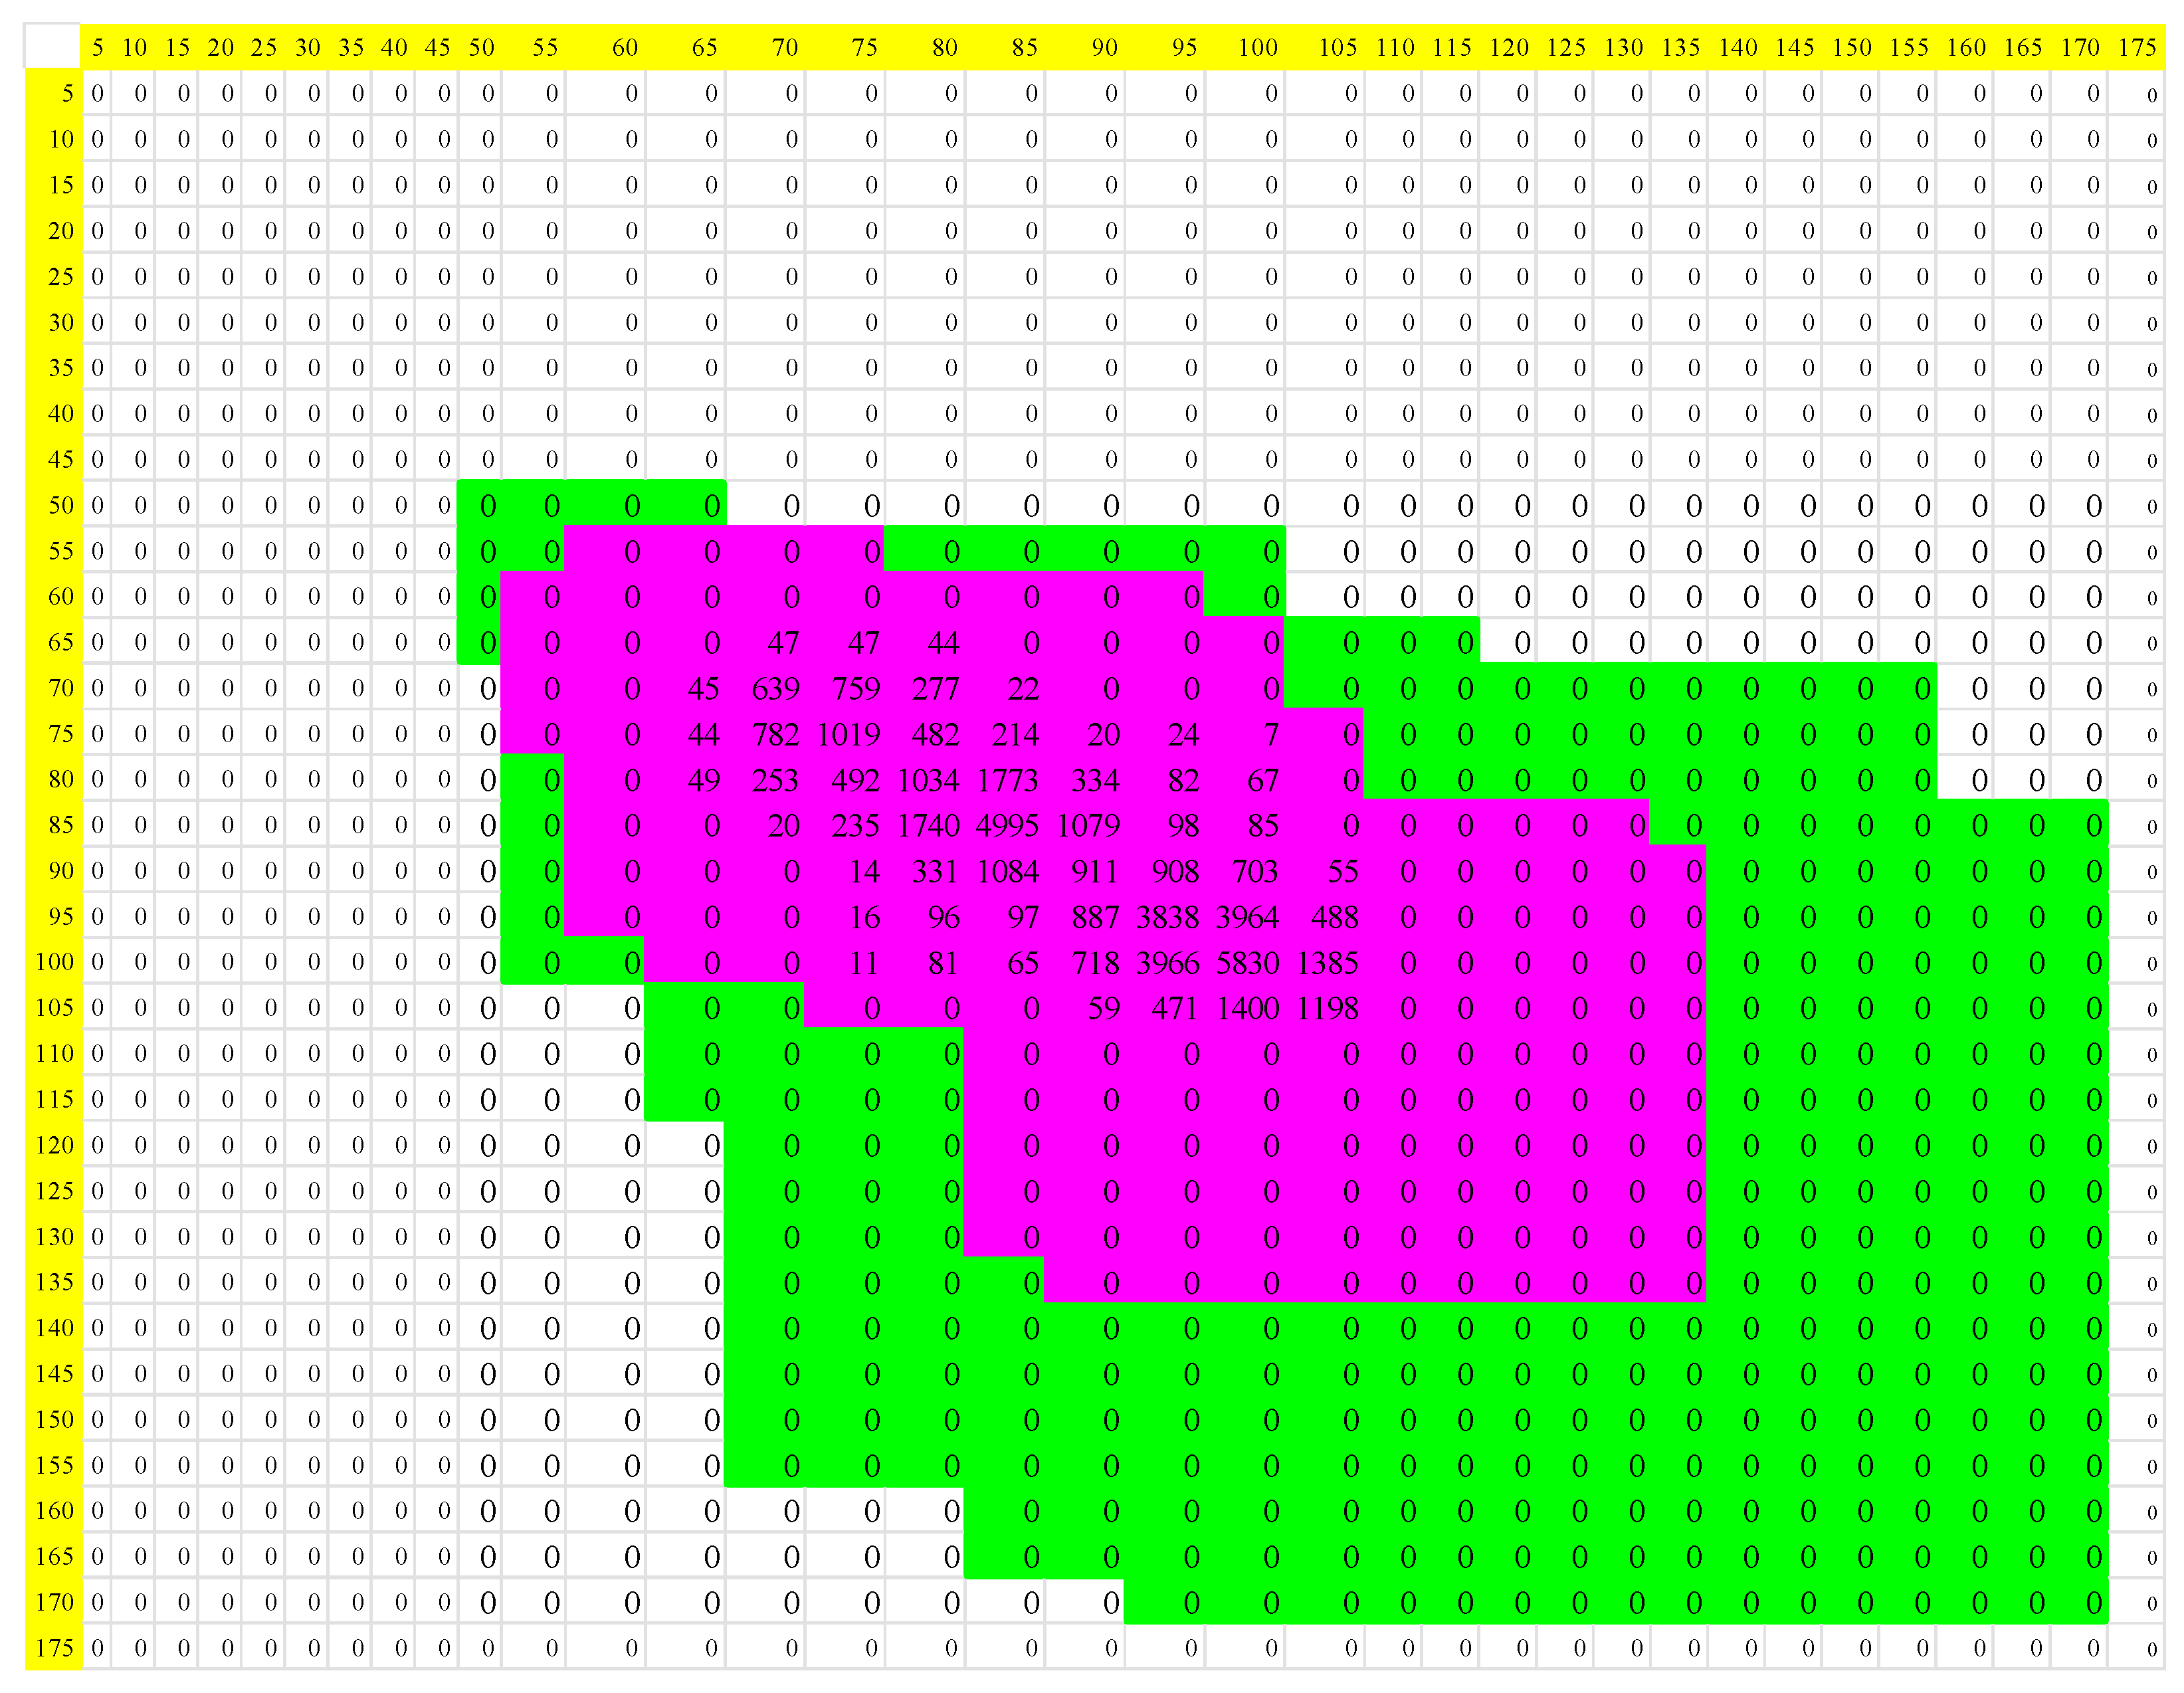
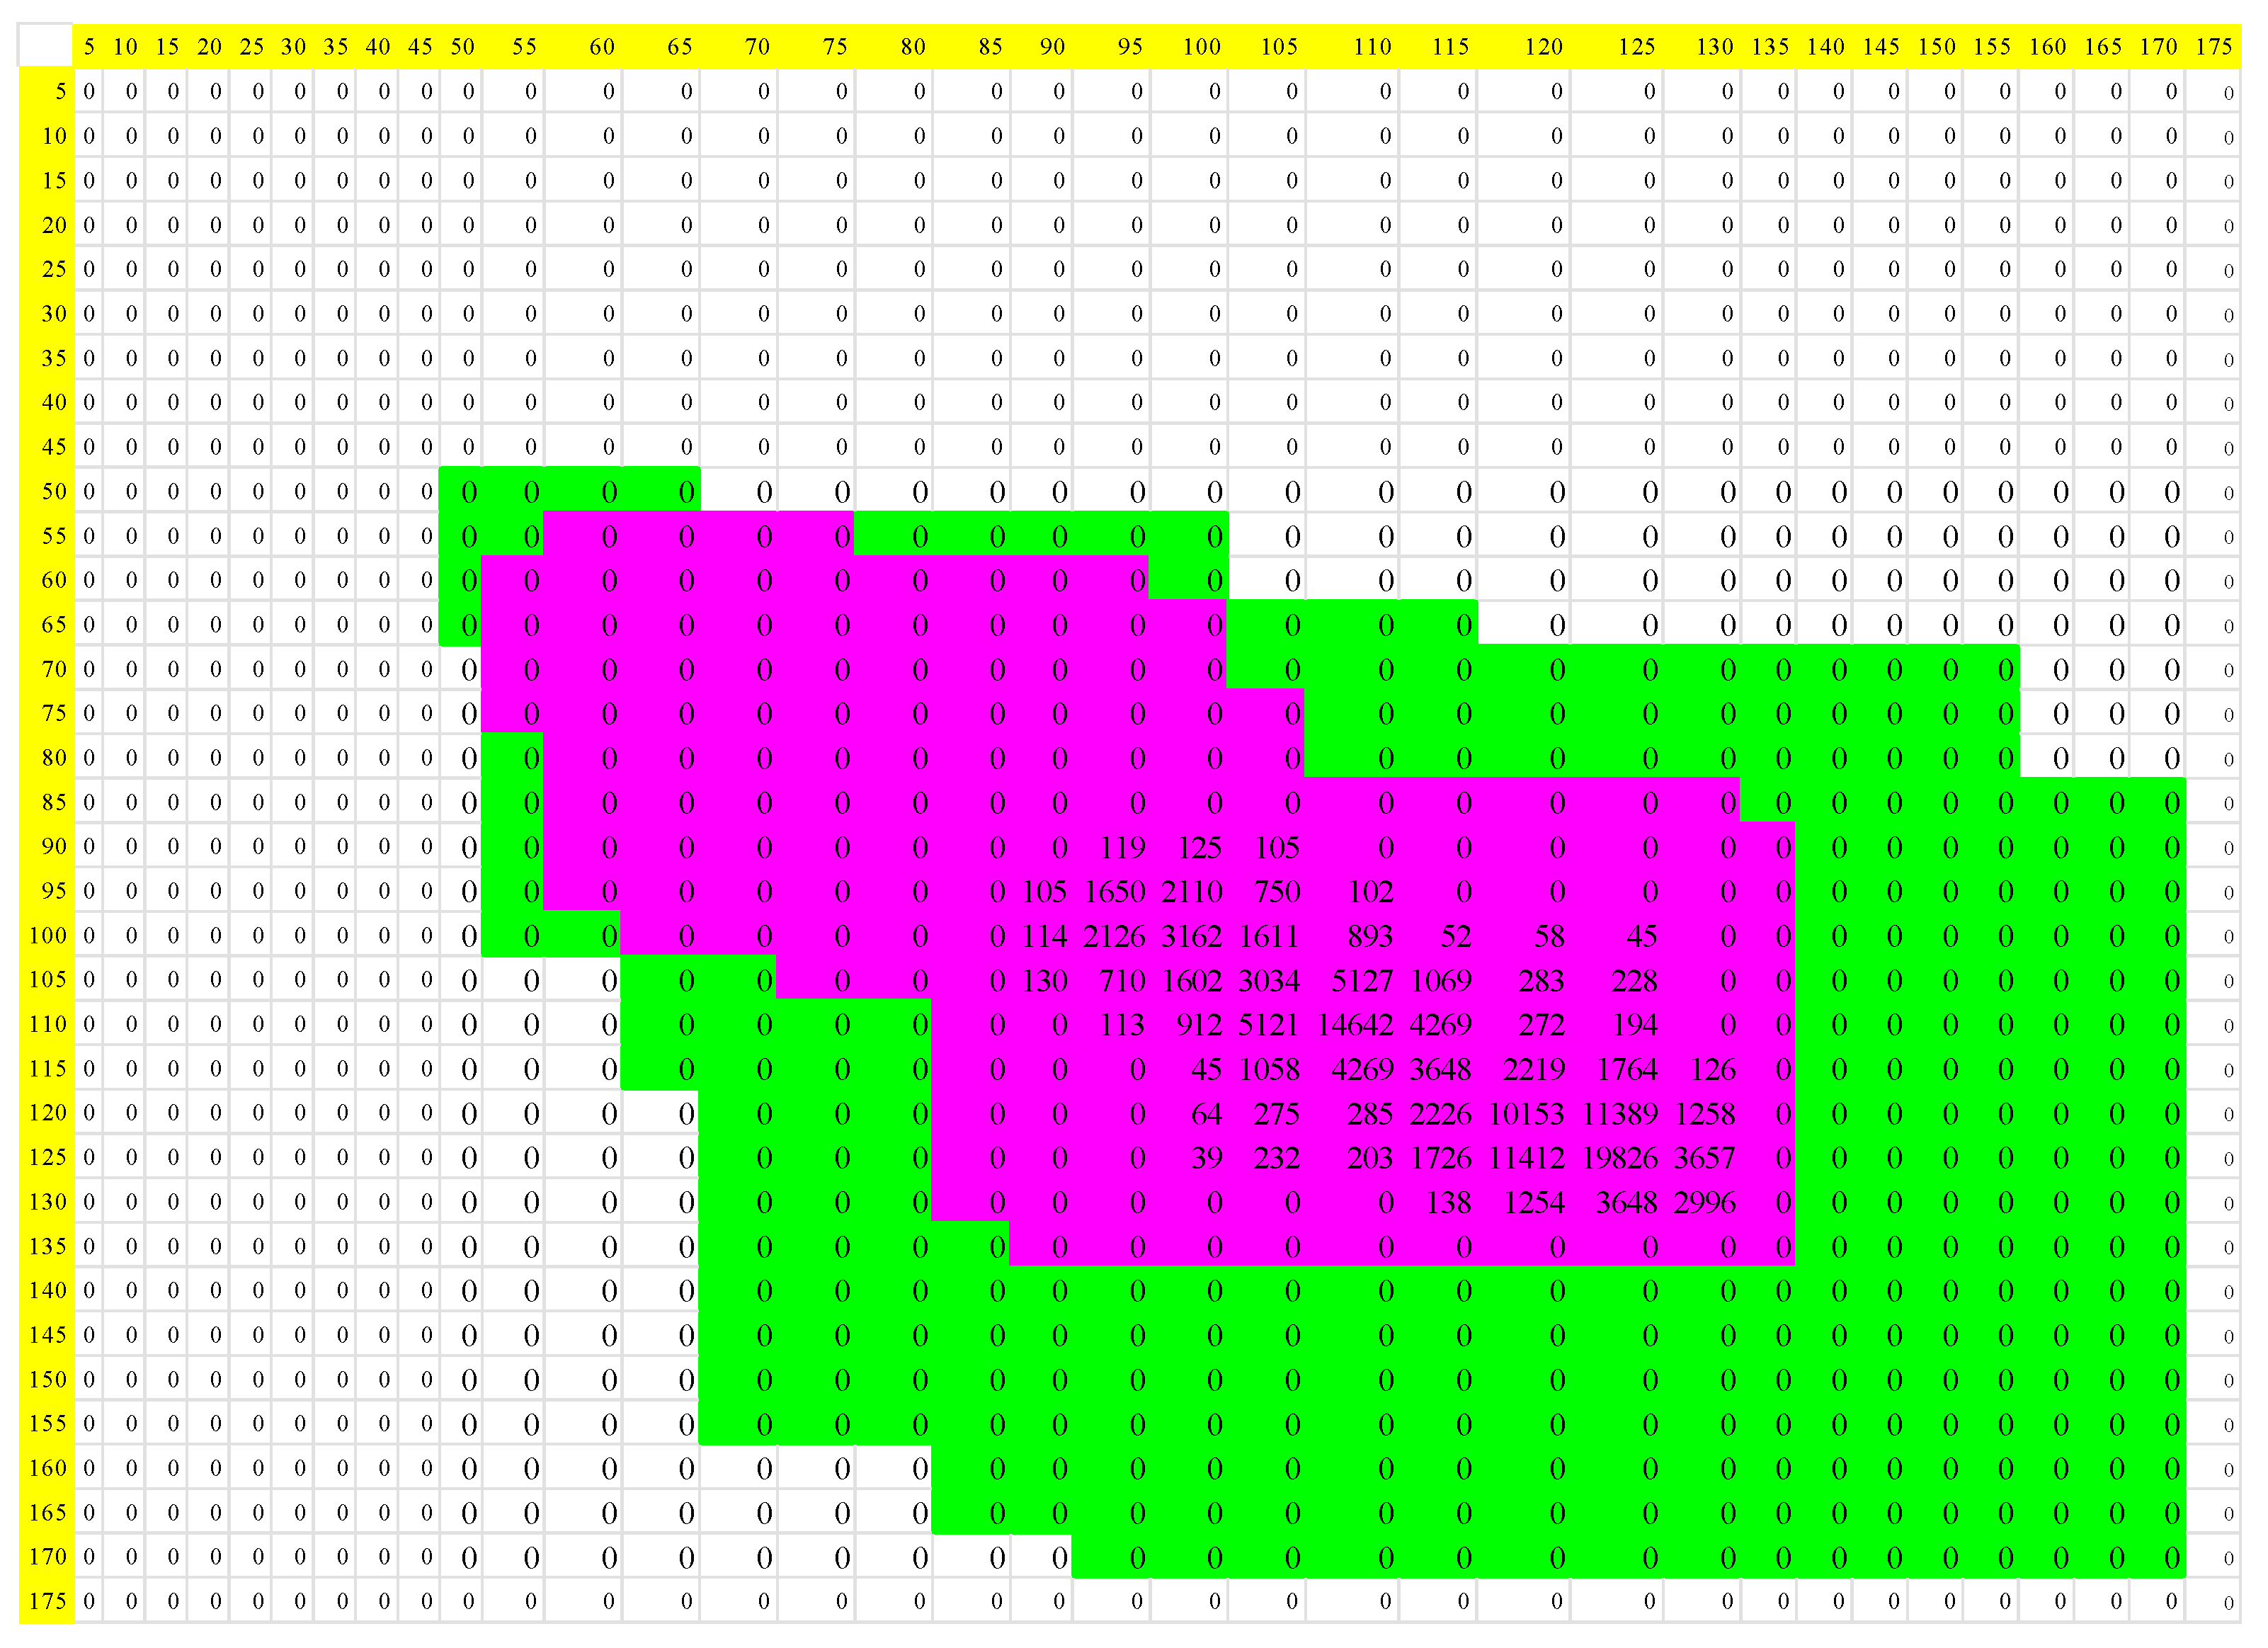
Simulations of Cardiac Dynamics

To perform mathematical evaluation, clinically normal cases with a history of acute myocardial infarction were taken. These were used to simulate cardiac dynamics, ranging from normal dynamics to those characteristic of cardiac water disease. Of the 8 patients, 2 being normal and 6 displaying acute myocardial infarction, Holter recordings were taken at 37 °C. From there, simulations of an increase or decrease in heart rate were generated from the increase or decrease of 1 °C in body temperature, respectively. According to the literature, the average heart rate variation is 8.35 heartbeats/minute between 32 °C and 42 °C. Nine simulations were established from a real Holter record, with this variation kept constant in terms of records per hour. Subsequently, these simulations were divided according to the medical classification of temperature. That is, temperatures at or below 35 °C indicate hypothermia; those from 35 °C to 37 °C were considered normal; and fever occurs at or above 38 °C. We chose to run the simulations in temperature ranges between 32 °C and 42 °C because higher or lower temperatures are highly unlikely to occur and are usually associated with death or extreme medical conditions, such as severe brain damage or coma.
From the above, the procedure described [46] was applied and the following calculations were obtained:
The entropy values of the dynamics evaluated in 18 h varied between 2.82 × 10⁻²³ and 6.28 × 10⁻²³; the values of the attractors of the Holter recordings clinically diagnosed as normal and their simulations ranged between 6.53 × 10⁻²³ and 6.58 × 10⁻²³; while the abnormal cases presented values between 2.82 × 10⁻²³ and 6.05 × 10⁻²³. When analyzing these results with respect to previous research [46], it is observed that they are consistent with the previously established parameters and with the observation that the decrease in entropy values is associated with heart disease. This confirms the capacity of the methodology to differentiate between normality and acute disease with a sensitivity and specificity of 100%.
An example of a normal numerical attractor is listed in Figure 1.
The entropy variations with respect to temperature are outlined in the following Table 1.
The proportions of the entropy of the attractors of the Holter recordings, evaluated between the normality limits, were found for normalities 0 and 0.0074, 0 and 0.0717, 0 and 0.7919, 0 and 0.7506, 0 and 13.6037, and 0 and 3.0694 for U/T, D/T, C/T, M/T, C/M and D/C, respectively. In parallel, for the cases of acute myocardial infarction, the previous proportions had values from 0 to 0.1260, 0 to 0.2042, 0 to 0.5932, 0 to 0.9257, 0 to 30.1756, and 0 to 9.4917, respectively. The values of the entropy proportions were organized according to the clinical definitions of temperature, as discriminated in Table 2.
As outlined by the previous classification, it is important to highlight that the proportions reveal magnitudes that differentiate cardiac dynamics. For example, it should be noted that the maximum value of the U/T ratios of normal patients was 0.0074. Conversely, in patients with acute myocardial infarction, the values presented were 0.1260, 0.0894 and 0 to 0.445 for hypothermia, normality, and fever, respectively (Table 2).
Having observed that there are differences between this and other proportions of entropy between normality and acute myocardial infarction, we proceeded to observe if there are differences in the development of fever. When resuming the U/T ratio, healthy patients presented values of 0.0010 for this magnitude, while those with acute myocardial infarction presented values of 0.0445.
Similar observations were obtained when reviewing the progressions of the other proportions. For example, the D/T ratio in normal temperature and fever for healthy patients had values of 0.0717 and 0.0656, respectively. Conversely, in patients with infarction, these were 0.2043 and 0.0851. This difference is maintained in all proportions, as patients with fever present higher values in the same proportions than healthy subjects. According to what is established in the diagnostic method [44] in which the higher magnitudes are indicative of greater severity, the progression towards fever can be a deleterious process in the context of COVID-19 that can be quantified using this methodology. Figure 1, Figure 2, Figure 3 and Figure 4 show attractors from a healthy subject and another with an acute myocardial infarction and show dynamic changes as a function of the absence and presence of fever.

4. Discussion

This is the first investigation in which, through simulations with the proportions of entropy and the theories of probability and dynamical systems, a methodology was developed that simultaneously evaluates the cardiac dynamics and the temperature variations of subjects with COVID-19 in order to detect possible alterations associated with COVID-19 at the cardiovascular level. The results of this research suggest that there are mathematical orders between cardiac dynamics and body temperature that allow them to be assessed and quantified with clinical utility.
Previously, it has been established that the methodology that evaluates the entropy relationships applied to cardiac dynamics not only allows for an objective evaluation of the state of normality, chronic disease or acute disease, but that it also quantifies the evolution between these states from the mildest to the most severe cardiac alterations [46]. In this context, this methodology makes it possible to establish the presence of potentially abnormal dynamics that have been underdiagnosed in patients with COVID-19 since it allows for the early detection of alterations in cardiac dynamics that can compromise people’s lives.
Likewise, since it has been observed among hospitalized patients with COVID-19 that in most cases fever has a worse outcome in terms of a higher mortality [20], the analysis of the variation in body temperature could offer an alternative with which to quantitatively understand the progression of the disease. In this sense, given that there is an increase in heart rate with body temperature [17], the development of this method is based on the simultaneous evaluation of the variation in body temperature with respect to cardiac dynamics to effectively detect mild alterations. These changes have the potential to increase the morbidity and mortality of people with COVID-19, even in asymptomatic cases.
Additionally, this method could be automated and incorporated into technological devices to carry out safer and more precise follow-ups of cases at high risk of contagion due to continuous exposure, such as health professionals who attend to cases or caregivers at home. This should be conducted on patients with a high risk of developing more severe disease even if they are asymptomatic, such as people with chronic diseases and adults over 65 years of age [48].
It is important to note that the theories that support this research have great applicability in science. For example, probability theory, in addition to being one of the foundations of statistics, is one of the most widespread theories in clinical [49] and investigative [50] medicine. Similarly, entropy has supported analysis models of the multifractal type [51,52,53], Lyapunov exponents and Poincaré diagrams [54,55,56,57,58] of cardiac dynamics. In this research, these theories are used for the purpose of developing strict physical–mathematical methods that are applicable to each individual case, independently of statistical, population, or causal considerations.
From this research perspective based on physical and mathematical theories, predictive methods have been developed regarding the binding of peptides to HLA class II [59] and CD4+ lymphocyte counts in people living with HIV [60]. Similarly, with this same approach, diagnostic methods have been established in critical care [61] and oncology [62]. Likewise, different mathematical concepts are used every day to develop models and simulations of dynamics as diverse as the COVID-19 pandemic [63], the HIV-TB coinfection [64] or zooplankton–phytoplankton system [65], which reinforces the applicability of theoretical efforts to analyze and predict phenomena of biomedical and biological interest.

5. Conclusions

The physical mathematical simulations of cardiac behavior in relation to body temperature allowed the establishment of a better understanding of cardiac dynamics in the presence of fever. It is not only evident that heart rate increases, but also that the self-organization of the dynamic cardiac system changes in both normal and pathological cases.
This is especially significant for the proper follow-up of patients with COVID-19 since it is important to detect potentially serious variations in cardiac dynamics, especially in patients who do not present other symptoms, or who present comorbidities associated with the cardiovascular system, as these are some of the most affected. In this way, the proposed methodology could be established as a risk stratification method by objectively quantifying the state of cardiac dynamics, achieving early detection of mild underdiagnosed alterations. In the same way, its continuous application would allow for a quantitative evaluation of the evolution of the dynamics, potentially contributing to the reduction of deaths associated with COVID-19.
Since this research is based on mathematical simulations with a small population, it is important to carry out future research to compare the results with a significant number of real cases, and to evaluate population groups with different comorbidities and ages to obtain more specific information. In this way, it will be possible to develop automated monitoring and surveillance methods, which will contribute to an increasingly adequate management of patients.

Author Contributions

The contributions of each author: L.J.R.L.: Conceptualization, methodology, software Phyton 3.10.8, validation process, formal analysis, writing—review and editing, and supervision of projects. S.C.C.H.: Conceptualization, methodology, software, formal analysis, writing—original draft preparation and visualization. J.A.L.S.: Validation, data curation, writing—original draft preparation and supervision. All authors have read and agreed to the published version of the manuscript.

Funding

This research was funded by Research Vice-Rectory of Universidad Militar Nueva Granada, grant number INV-ING-3492 and The APC no was funded.

Data Availability Statement

Data is unavailable due to privacy or ethical restrictions; a statement is still required.

Acknowledgments

We thank to the Universidad Militar Nueva Granada for their support to our research with project INV-ING-3492. We also extend our thanks to the Hospital Universitario Nacional de Colombia, especially Giancarlo Buitrago, “Instituto de Investigaciones Clínicas” at Universidad Nacional de Colombia-Hospital Universitario Nacional de Colombia and Rubén Caycedo, Surgery department of the Faculty of Medicine at Universidad Nacional de Colombia-Hospital Universitario Nacional de Colombia, for their support to our research.

Conflicts of Interest

The authors declare no conflict of interest. The funders had no role in the design of the study; in the collection, analyses, or interpretation of data; in the writing of the manuscript; or in the decision to publish the results.

References

  1. Pascarella, G.; Strumia, A.; Piliego, C.; Bruno, F.; Del Buono, R.; Costa, F.; Scarlata, S.; Agrò, F.E. COVID-19 diagnosis and management: A comprehensive review. J. Intern. Med. 2020, 288, 192–206. [Google Scholar] [CrossRef]
  2. World Health Organization. In Proceedings of the Virtual Press Conference on COVID-19, Virtual, 20 April 2020. Available online: https://www.who.int/docs/default-source/coronaviruse/transcripts/who-audio-emergencies-coronavirus-press-conference-20apr2020.pdf (accessed on 26 April 2020).
  3. Johns Hopkins Coronavirus Resource Center (CRC). COVID-19 Data in Motion. Available online: https://coronavirus.jhu.edu/ (accessed on 2 June 2020).
  4. Adhikari, S.P.; Meng, S.; Wu, Y.-J.; Mao, Y.-P.; Ye, R.-X.; Wang, Q.-Z.; Sun, C.; Sylvia, S.; Rozelle, S.; Raat, H.; et al. Epidemiology, causes, clinical manifestation and diagnosis, prevention and control of coronavirus disease (COVID-19) during the early outbreak period: A scoping review. Infect. Dis. Poverty 2020, 9, 29. [Google Scholar] [CrossRef] [Green Version]
  5. Lauer, S.A.; Grantz, K.H.; Bi, Q.; Jones, F.K.; Zheng, Q.; Meredith, H.R.; Azman, A.S.; Reich, N.G.; Lessler, J. The incubation period of coronavirus disease 2019 (COVID-19) from publicly reported confirmed cases: Estimation and application. Ann. Intern. Med. 2020, 172, 577. [Google Scholar] [CrossRef] [Green Version]
  6. Bai, Y.; Yao, L.; Wei, T.; Tian, F.; Jih, D.Y.; Chen, L. Presumed asymptomatic carrier transmission of COVID-19. J. Am. Med. Assoc. 2020, 323, 1406–1407. [Google Scholar] [CrossRef] [Green Version]
  7. Rothe, C.; Schunk, M.; Sothmann, P.; Bretzel, G.; Froeschl, G.; Wallrauch, C.; Zimmer, T.; Thiel, V.; Janke, C.; Guggemos, W.; et al. Transmission of 2019-nCoV Infection from an Asymptomatic Contact in Germany. N. Engl. J. Med. 2020, 382, 970–971. [Google Scholar] [CrossRef] [Green Version]
  8. The Novel Coronavirus Pneumonia Emergency Response Epidemiology Team. The epidemiological characteristics of an outbreak of 2019 novel coronavirus disease (COVID-19)—China. China CDC Wkly. 2020, 41, 145–151. [Google Scholar]
  9. Chang, D.; Xu, H.; Rebaza, A.; Sharma, L.; Dela Cruz, C.S. Protecting health-care workers from subclinical coronavirus infection. Lancet Respir Med. 2020, 8, e13. [Google Scholar] [CrossRef] [Green Version]
  10. Yu, P.; Zhu, J.; Zhang, Z.; Han, Y. A Familial cluster of infection associated with the 2019 novel coronavirus indicating possible person-to-person transmission during the incubation period. J. Infect. Dis. 2020, 221, 1457–1761. [Google Scholar] [CrossRef] [Green Version]
  11. Yu, X.; Yang, R. COVID-19 transmission through asymptomatic carriers is a challenge to containment. Influenza Other Respir. Viruses 2020, 14, 474–475. [Google Scholar] [CrossRef] [Green Version]
  12. Zhang, X.-Y.; Huang, H.-J.; Zhuang, D.-L.; Nasser, M.I.; Yang, M.-H.; Zhu, P.; Zhao, M.-Y. Biological, clinical and epidemiological features of COVID-19, SARS and MERS and AutoDock simulation of ACE2. Infect. Dis. Poverty 2020, 9, 99. [Google Scholar] [CrossRef]
  13. Testo SE & Co. KGaA. Instruments. Set FeverDetection testo. Available online: https://www.testo.com/es-CO/set-feverdetection-testo-890/p/0563-0890-X7 (accessed on 21 August 2020).
  14. EL TIEMPO Casa Editorial. New. COVID-19: Uno de cada ocho pacientes sufre síntomas prolongados. Available online: https://www.eltiempo.com/salud/covid-19-uno-de-cada-ocho-pacientes-sufre-sintomas-prolongados-692666 (accessed on 5 August 2022).
  15. Jensen, M.M.; Kellett, J.G.; Hallas, P.; Brabrand, M. Fever increases heart rate and respiratory rate; a prospective observational study of acutely admitted medical patients. Acute Med. 2019, 18, 141–143. [Google Scholar] [CrossRef] [PubMed]
  16. Jensen, M.M.; Brabrand, M. The relationship between body temperature, heart rate, and respiratory rate in acute patients on admission to a medical care unit. Scand. J. Trauma Resusc. Emerg. Med. 2015, 23 (Suppl. 1), A12. [Google Scholar] [CrossRef] [Green Version]
  17. Broman, M.E.; Vincent, J.L.; Ronco, C.; Hansson, F.; Bell, M. The Relationship between Heart Rate and Body Temperature in Critically Ill Patients. Crit. Care Med. 2021, 49, e327–e331. [Google Scholar] [CrossRef]
  18. Angelidis, G.; Bratsas, C.; Makris, G.; Ioannidis, E.; Varsakelis, N.C.; Antoniou, I.E. Global Value Chains of COVID-19 Materials: A Weighted Directed Network Analysis. Mathematics 2021, 9, 3202. [Google Scholar] [CrossRef]
  19. Kalayjian, B.C.; Conner, K.; Butler, R.; Myers, L.; Telleria, C.; Panchang, D. Race, Heart Rate, and Temperature Are Strongly Associated with COVID-19 at Community-based Clinic in New Orleans. Mayo Clin. Proc. Innov. Qual. Outcomes 2020, 4, 683–686. [Google Scholar] [CrossRef]
  20. Tharakan, S.; Nomoto, K.; Miyashita, S.; Ishikawa, K. Body temperature correlates with mortality in COVID-19 patients. Crit. Care 2020, 24, 298. [Google Scholar] [CrossRef]
  21. Bajić, D.; Đajić, V.; Milovanović, B. Entropy Analysis of COVID-19 Cardiovascular Signals. Entropy 2021, 23, 87. [Google Scholar] [CrossRef]
  22. Kowalski, A.M.; Portesi, M.; Vampa, V.; Losada, M.; Holik, F. Entropy-Based Informational Study of the COVID-19 Series of Data. Mathematics 2022, 10, 4590. [Google Scholar] [CrossRef]
  23. Martínez-Fernández, P.; Fernández-Muñiz, Z.; Cernea, A.; Fernández-Martínez, J.L.; Kloczkowski, A. Three Mathematical Models for COVID-19 Prediction. Mathematics 2023, 11, 506. [Google Scholar] [CrossRef]
  24. Alghamdi, A.S.; Abd El-Raouf, M.M. Exploring the Dynamics of COVID-19 with a Novel Family of Models. Mathematics 2023, 11, 1641. [Google Scholar] [CrossRef]
  25. Feynman, R.P.; Leighton, R.B.; Sands, M. Probability. In Physics Vol 1: Mechanics, Radiation, and Heat; Addison Wesley Iberoamericana: Wilmington, NC, USA, 1964; pp. 1–11. [Google Scholar]
  26. Suarez, J.F. Introduction to Probability Theory; Department of Mathematics and Statistics, National University of Colombia: Manizales, Colombia, 2002. [Google Scholar]
  27. Mood, A.M.; Graybill, F.A.; Boes, D.C. Introduction to the Theory of Statistics, 3rd ed.; McGraw-Hill: Singapore, 1974. [Google Scholar]
  28. Hirsch, M.W.; Devaney, R.L.; Smale, S. Nonlinear Systems. In Differential Equations, Dynamical Systems, and an Introduction to Chaos, 3rd ed.; Academic Press: Waltham, MA, USA, 2013; pp. 139–157. ISBN 978-0-12-382010-5. [Google Scholar]
  29. Grebogi, C.; Ott, E.; Yorke, J.A. Chaos, strange attractors, and fractal basin boundaries in nonlinear dynamics. Science 1987, 238, 632–638. Available online: http://www.jstor.org/stable/1700479?origin=JSTOR-pdf (accessed on 26 April 2020). [CrossRef] [Green Version]
  30. Ott, E.; Grebogi, C.; Yorke, J.A. Controlling chaos. Phys. Rev. Lett. APS 1990, 64, 1196. [Google Scholar] [CrossRef]
  31. Strogatz, S.H. Nonlinear Dynamics and Chaos: With Applications to Physics, Biology, Chemistry, and Engineering; Westview Press: Boulder, CO, USA, 2014; ISBN 13:978-0-8133-4910-7. [Google Scholar]
  32. The Entropy Law as Law of Disorder (Boltzmann’s Interpretation: The Statistical View) [Internet]. Foundations of Physics, Life and Cognition: Basic Texts, Reviews, Research Material. Available online: http://www.entropylaw.com/entropydisorder.html (accessed on 4 July 2017).
  33. Shannon, C. A mathematical theory of communication. Bell Syst. Tech. J. 1948, 27, 379–423, 623–656. Available online: https://people.math.harvard.edu/~ctm/home/text/others/shannon/entropy/entropy.pdf (accessed on 26 April 2020). [CrossRef] [Green Version]
  34. Machta, J. Entropy, information, and computation. Am. J. Phys. AAPT 1999, 67, 1074–1077. [Google Scholar] [CrossRef]
  35. Rodríguez Velásquez, J.; Prieto Bohórquez, S.; Ramírez López, L.J. Armonía del Caos: Fractales, Sistemas Dinámicos y Dinámica Cardiaca; Editorial Neogranadina: Cajicá, Colombia, 2021. [Google Scholar] [CrossRef]
  36. Tolman, R. Principles of Statistical Mechanics, 1st ed.; Dover Publications: New York, NY, USA, 1979; 662p. [Google Scholar]
  37. Matveev, A.N. Molecular Physics; MIR: Moscow, Russia, 1987. [Google Scholar]
  38. Bekenstein, J.D. Information in the holographic Universe. I investigated Cienc. Sci. Am. 2003, 289, 58–65. [Google Scholar] [CrossRef]
  39. Costa, M.D.; Goldberger, A.L. Generalized multiscale entropy analysis: Application to quantifying the complex volatility of human heartbeat time series. Entropy 2015, 17, 1197–1203. [Google Scholar] [CrossRef]
  40. Huo, Z.; Zhang, Y.; Shu, L. A short survey on fault diagnosis of rotating machinery using entropy techniques. In Proceedings of the 3rd EAI International Conference on Industrial Networks and Intelligent Systems, Ho Chi Minh City, Vietnam, 4 September 2017; Available online: https://eudl.eu/pdf/10.1007/978-3-319-74176-5_24 (accessed on 10 September 2022).
  41. Pincus, S.M. Approximate entropy as a measure of system complexity. Proc. Natl. Acad. Sci. USA 1991, 88, 2297–2301. [Google Scholar] [CrossRef] [PubMed]
  42. Baumert, M.; Baier, V.; Voss, A.; Brechtel, L.; Haueisen, J. Estimating the complexity of heart rate fluctuations—An approach based on compression entropy. Fluct. Noise Lett. World Sci. 2005, 5, L557–L563. [Google Scholar] [CrossRef]
  43. Baumert, M.; Baier, V.; Haueisen, J.; Wessel, N.; Meyerfeldt, U.; Schirdewan, A.; Voss, A. Forecasting of life threatening arrhythmias using the compression entropy of heart rate. Methods Inf. Med. Inf. Med. 2004, 43, 202. [Google Scholar] [CrossRef] [Green Version]
  44. Richman, J.S.; Moorman, J.R. Physiological time-series analysis using approximate entropy and sample entropy. Am. J. Phys. Circ. Phys. 2000, 278, H2039–H2049. [Google Scholar] [CrossRef] [Green Version]
  45. Hrbacek, K.; Jech, T. Introduction to Set Theory, 3rd ed.; Marcel Dekker, Inc.: New York, NY, USA, 1999. [Google Scholar]
  46. Rodríguez, J.; Prieto, S.; Ramirez, L.J. A novel heart rate attractor for the prediction of cardiovascular disease. Inf. Med. Unlocked 2019, 15, 100174. [Google Scholar] [CrossRef]
  47. Rodríguez, J.; Prieto, S.; Melo, M.; Domínguez, D.; Correa, C.; Soracipa, Y.; Mejía, M.; Valero, L.; Salamanca, A. Prediction of the number of CD4 T lymphocytes in peripheral blood from set theory and probability in patients with HIV/AIDS. Immunology 2014, 33, 113–120. [Google Scholar]
  48. Mayo Clinic. COVID-19: Who’s at Higher Risk of Serious Symptoms? Available online: https://www.mayoclinic.org/coronavirus-who-is-at-risk/art-20483301 (accessed on 22 December 2020).
  49. Upshur, R.E.G. A short note on probability in clinical medicine. J. Eval. Clin. Prac. 2013, 19, 463–466. [Google Scholar] [CrossRef] [PubMed]
  50. Fatovich, D.M.; Phillips, M. The probability of probability and research truths. Emerg. Med. Australas. 2017, 29, 242–244. [Google Scholar] [CrossRef] [PubMed]
  51. Perkiomaki, J.S.; Zareba, W.; Badilini, F.; Moss, A.J. Influence of atropine on fractal and complexity measures of heart rate variability. Ann. Noninvasive Electr. 2002, 7, 326–331. [Google Scholar] [CrossRef]
  52. Norris, P.R.; Anderson, S.M.; Jenkins, J.M.; Williams, A.E.; Morris Jr, J.A. Heart rate multiscale entropy at three hours predicts hospital mortality in 3154 trauma patients. Shock LWW 2008, 30, 17–22. [Google Scholar] [CrossRef]
  53. Eckmann, J.P.; Ruelle, D. Ergodic theory of chaos and strange attractors. Rev. Mod. Phys. 1985, 57, 617. [Google Scholar] [CrossRef]
  54. Zhang, L.; Guo, T.; Xi, B.; Fan, Y.; Wang, K.; Bi, J.; Wang, Y. Automatic recognition of cardiac arrhythmias based on the geometric patterns of Poincare plots. Physiol. Meas. 2015, 36, 283–301. [Google Scholar] [CrossRef]
  55. Kamen, P.W.; Tonkin, A.M. Application of the Poincare plot to heart rate variability: A new measure of functional status in heart failure. Aust. N. Z. J. Med. 1995, 25, 18–26. [Google Scholar] [CrossRef]
  56. Kamen, P.W.; Krum, H.; Tonkin, A.M. Poincare plot of heart rate variability allows quantitative display of parasympathetic nervous activity in humans. Clin. Sci. 1996, 91, 201–208. [Google Scholar] [CrossRef] [Green Version]
  57. Goshvarpour, A.; Goshvarpour, A. Poincare indices for analyzing meditative heart rate signals. Biomed. J. 2015, 38, 229–234. [Google Scholar] [CrossRef] [PubMed]
  58. Fishman, M.; Jacono, F.J.; Park, S.; Jamasebi, R.; Thungtong, A.; Loparo, K.A.; Dick, T.E. A method for analyzing temporal patterns of variability of a time series from Poincare plots. J. Appl. Physiol. 2012, 113, 297–306. [Google Scholar] [CrossRef] [PubMed] [Green Version]
  59. Rodríguez, J. Binding to Class II HLA Theory: Probability, Combinatory and Entropy Applied to Peptide Sequences. Immunology 2008, 27, 151–166. [Google Scholar] [CrossRef]
  60. Rodriguez, J.; Prieto, S.; Correa, C.; Melo, M.; Dominguez, D.; Olarte, N.; Suárez, D.; Aragón, L.; Torres, F.; Santacruz, F. Prediction of CD4+ Cells Counts in HIV/AIDS Patients based on Sets and Probability Theories. Curr. HIV Res. 2018, 6, 416–424. [Google Scholar] [CrossRef]
  61. Rodríguez, J. Dynamical systems applied to dynamic variables of patients from the intensive care unit (ICU): Physical and mathematical mortality predictions on ICU. J. Med. Med. Sci. 2015, 6, 209–220. [Google Scholar]
  62. Prieto Bohórquez, S.E.; Velásquez, J.O.R.; Correa Herrera, S.C.; Soracipa Muñoz, M.Y. Diagnosis of cervical cells based on fractal and Euclidian geometrical measurements: Intrinsic Geometric Cellular Organization. BMC Med. Phys. 2014, 14, 2. [Google Scholar] [CrossRef] [Green Version]
  63. Xu, C.; Liu, Z.; Pang, Y.; Akgül, A. Stochastic analysis of a COVID-19 model with effects of vaccination and different transition rates: Real data approach. Chaos Solitons Fractals 2023, 170, 113395. [Google Scholar] [CrossRef]
  64. Xu, C.; Liu, Z.; Pang, Y.; Akgül, A.; Baleanu, D. Dynamics of HIV-TB coinfection model using classical and Caputo piecewise operator: A dynamic approach with real data from South-East Asia, European and American regions. Chaos Solitons Fractals 2022, 165, 112879. [Google Scholar] [CrossRef]
  65. Li, P.; Gao, R.; Xu, C.; Li, Y.; Akgül, A.; Baleanu, D. Dynamics exploration for a fractional-order delayed zooplankton–phytoplankton system. Chaos Solitons Fractals 2023, 166, 112975. [Google Scholar] [CrossRef]
Figure 1. Numerical attractor of a previously healthy patient with normal temperature. This delay map allows ordered pairs that make up the sequence of heart rates of the dynamics grouped in ranges of five beats/minute to be plotted. The pink, green and white areas correspond to regions 1, 2 and 3, respectively, as described above in Section 2 (Materials and Methods). The yellow area corresponds to the axes. The axes correspond to the heart rate ranges every five beats per minute. The abscissa (X) axis corresponds to the entire sequence of heart rates (HR). The axis of the ordinates (Y) corresponds to the entire sequence of heart rates displaced in a range (HR-1).
Mathematics 11 03374 g001
Figure 2. An attractor to a healthy patient in the temperature range from 40 °C to 41 °C. When comparing the attractors of normal cases without fever to those with fever, it is observed that the ordered pairs of heart rate tend to occupy region 2, evidencing the increase in heart rate.
Mathematics 11 03374 g002
Figure 3. Attractor of a patient diagnosed with acute myocardial infarction and normal temperature. In cases of acute disease like this, the number of spaces that present some value of ordered pairs of HR is much smaller than seen in normal cases, and the number of times that specific ordered pairs occur tends to be much higher. For example, the highest value reported in the attractor in Figure 1 is 2026, while in this one it is 4995. The analysis of the distribution of these values is performed by calculating entropy proportions for each region.
Mathematics 11 03374 g003
Figure 4. Attractor with acute myocardial infarction and fever. In cases of acute illness and fever, the distribution of ordered HR pairs tends to shift downwards and to the right compared to cases with acute illness without fever, evidencing the general increase in heart rate. Additionally, the frequency in which these ordered pairs occur is much higher. For example, while the highest values of the attractors in Figure 1, Figure 2 and Figure 3 were 2026, 2677 and 4995, respectively, in this one case the highest value was 19,826.
Mathematics 11 03374 g004
Table 1. Entropy values related to normality and evolution to acute disease.
NormalAcute Myocardial Infarction
HypothermiaNormalFeverHypothermiaNormalFever
Minimum6.19 × 10−236.15 × 10−236.17 × 10−232.82 × 10−232.83 × 10−232.82 × 10⁻²³
Maximum6.58 × 10−236.56 × 10−236.57 × 10−235.95 × 10−236.02 × 10−236.05 × 10⁻²³
Table 2. Distribution of entropy proportions with respect to temperature variations.
NormalAcute Myocardial Infarction
HypothermiaNormalFeverHypothermiaNormalFever
U/TMinimum0.00000.00000.00000.00000.00000.0000
Maximum0.00300.00740.00100.12600.08940.0445
D/TMinimum0.00000.00000.00000.00000.00000.0000
Maximum0.05400.07170.06560.15610.20430.0851
C/TMinimum0.00000.00000.00000.00000.00000.0000
Maximum0.79190.51210.34220.59330.55940.3558
M/TMinimum0.00000.00000.00000.00000.00000.0000
Maximum0.39480.61700.75060.86890.90740.9257
C/MMinimum0.00000.00000.00000.00000.00000.0802
Maximum13.60371.47493.169330.17576.06893.9159
D/CMinimum0.00000.00000.00000.00000.00000.0000
Maximum0.58503.06942.40033.53228.02889.4918
Disclaimer/Publisher’s Note: The statements, opinions and data contained in all publications are solely those of the individual author(s) and contributor(s) and not of MDPI and/or the editor(s). MDPI and/or the editor(s) disclaim responsibility for any injury to people or property resulting from any ideas, methods, instructions or products referred to in the content.

