Article

Spatial Demo-Genetic Predator–Prey Model for Studying Natural Selection of Traits Enhancing Consumer Motility

by
Yuri V. Tyutyunov
Southern Scientific Centre of the Russian Academy of Sciences (SSC RAS), 344006 Rostov-on-Don, Russia
Mathematics 2023, 11(15), 3378; https://doi.org/10.3390/math11153378
Submission received: 29 June 2023 / Revised: 29 July 2023 / Accepted: 31 July 2023 / Published: 2 August 2023
(This article belongs to the Special Issue Mathematical Modeling of Evolutionary Dynamics)

Abstract

:
Combining explicit modelling of predator movements with the Kostitzin demo-genetic equations, we study conditions promoting natural selection of consumer motility. The model is a system of partial differential equations describing spatial movements of predators pursuing the diffusing prey. Local predator–prey interactions are described by the classical Rosenzweig–MacArthur model, which additionally accounts for the Allee effect affecting reproduction of predators. Spatial activity of predators is determined by the coefficients of diffusion and indirect prey-taxis. The latter characterizes the predator ability to move directionally up the gradient of taxis stimulus (odor, pheromone, exometabolite) continuously emitted by prey. Assuming that the consumer movement ability is governed by a single diallelic locus with recessive ‘mobile’ and dominant ‘settled’ alleles, the predator population in the model consists of three competing genotypes differing by diffusion and taxis coefficients; other parameters characterizing the genotypes are assumed to be equal. Numerical simulations with different spatial patterns imitating habitat deterioration demonstrate that the direction of selection among the consumer genotypes alternates, depending on the degree of habitat deterioration affecting the overall production of the prey population. Theoretical implications of the results are discussed in relation with problems of biological control, predator interference, and evolution of animal motility.

1. Introduction

The ability of animals to move directionally in response to spatial heterogeneity of their food objects is one of the most important properties of consumer organisms. However, there are many evolutionarily successful animals, including predatory species, which do not pursue their prey actively. From the evolutionary point of view, it is not quite clear under what conditions the movement ability of consumers is advantageous and when natural selection could act against traits that enhance their spatial activity. Besides morphological/functional analysis of fossils that helps understanding long-term evolution of animal motility during Phanerozoic time (see, e.g., [1]), mathematical modelling provides researchers with highly effective tools for checking and confronting various theoretical hypotheses about population dynamics and/or evolutionary mechanisms [2,3,4,5,6,7,8].
Studies of spatial predator–prey models incorporating explicit description of animal movements have revealed a variety of spatiotemporal dynamics that emerge in trophic systems consisting of populations related by consumer–resource interactions. Moreover, taking into account the spatial behavior of species changes the model dynamics qualitatively, making mathematical description of species interactions more realistic. Spatially explicit models of animal motility help in understanding such phenomena as mutual interference of predators, emergence of stationary and dynamic patterns, and, in particular, small-scale heterogeneity in trophic systems. Spatial models explain mechanisms ensuring the successful invasion of alien species and durable biological control of pests and weeds by natural enemies [9,10,11,12,13,14,15,16,17,18,19]. Some of these results indicate that the spatial activity of consumers can be viewed as an evolutionarily advantageous strategy [9,12,13].
More closely related evolutionary processes should be considered in frameworks of population-genetic models. If the first classical genetic models based on the Fisher–Haldane–Wright equations dealt with the dynamics of allele and genotype frequencies, operating at the evolutionary timescale (see, e.g., [20,21,22]), models that describe both the evolution of the genetic structure and growth of the population allow us to solve more complex problems of interrelation between selection processes occurring on a short timescale and temporal or even spatiotemporal population dynamics. Emphasizing the extension of their applicability, such synthetic models are often called eco-evolutionary, ecological–genetic, or demo-genetic models [23,24,25,26,27,28]. The first classical demo-genetic models were formulated by Vladimir A. Kostitzin [29,30,31,32], who proposed applying the competition theory by Vito Volterra to describe interactions between genotypes.
In this study, basing on the Kostitzin equations, we present a demo-genetic extension of the spatially explicit prey-taxis model that was studied in detail earlier [10,12,33,34,35]. The considered model accounts for the genetic structure of the diploid predator population, assuming that predator genotypes differ by their ability to perform spatial movements. In order to demonstrate the efficiency of this demo-genetic approach, we present the results of numerical simulations with different spatial patterns that imitate habitat deterioration, which affects prey reproduction in the modelled predator–prey system. We show that depending on the degree of habitat deterioration, either increasing or decreasing mobility of the predator can be advantageous, driving the predator population to either a homozygous or heterozygous state. The obtained results are discussed in the broad context of theoretical problems relating to biological control, predator interference, natural selection, and evolution of traits associated with motility and feeding migrations of animals.

2. The Model and Simulation Scenarios

Extending the classical non-spatial Rosenzweig–MacArthur (RMA) predator–prey system [36], which assumes logistic reproduction of prey, the Holling type II functional response, and constant natural mortality of the predator, we build a spatial demo-genetic model that takes into account genetic structure of the predator population consisting of three competing genotypes, P m m , P m s , P s s , determined by ‘mobile’ and ‘settled’ alleles m and s conferring the ability of the consumers to perform indirect prey-taxis—directional movements along spatial gradient of a feeding stimulus S. The prey-taxis stimulus is a diffuse and decaying substance (odor, pheromone, exometabolite) continuously emitted by prey.
Thus, the model is the following system of partial differential equations (PDEs):
(1a) N t = N ( r ( x ) c N ) P · a N 1 + a h N + δ N Δ N ; (1b) P m m t = a N 1 + a h N · 1 P + θ · f m m μ m m P m m · ( κ m m P m m S ) + δ m m Δ P m m ; (1c) P m s t = a N 1 + a h N · 1 P + θ · f m s μ m s P m s · ( κ m s P m s S ) + δ m s Δ P m s ; (1d) P s s t = a N 1 + a h N · 1 P + θ · f s s μ s s P s s · ( κ s s P s s S ) + δ s s Δ P s s ; (1e) S t = N η S + δ S Δ S ,
In (1), N = N ( t , x ) , P m m = P m m ( t , x ) , P m s = P m s ( t , x ) , P s s = P s s ( t , x ) , and S = S ( t , x ) are, respectively, the densities of the prey population, three predator genotypes, and prey-taxis stimulus, defined at time t and spatial point x Ω , where Ω = L x × L y is a closed rectangular domain inhabited by the prey and predator populations. At each point within the spatial habitat, the total density of the predator population is P = P m m + P m s + P s s . Following the assumptions of the demo-genetic model first formulated by V. A. Kostitzin [29,30,31,32], reproduction terms f m m , f m s and f s s in (1) account for the Mendellian inheritance, being the following functions of the predator genotype densities:
(2a) f m m P m m , P m s , P s s = ϵ m m m m P m m 2 + ϵ m m m s + ϵ m s m m P m m P m s / 2 + ϵ m s m s P m s 2 / 4 ; (2b) f m s P m s , P m s , P s s = ϵ m m m s + ϵ m s m m P m m P m s / 2 + ϵ m s m s P m s 2 / 2 + (2c) + ϵ m m s s + ϵ s s m m P m m P s s + ϵ m s s s + ϵ s s m s P m s P s s / 2 ; (2d) f s s P m m , P m s , P s s = ϵ s s s s P s s 2 + ϵ m s s s + ϵ s s m s P m s P s s / 2 + ϵ m s m s P m s 2 / 4 .
The reproduction functions (2) implicitly assume that predator genotypes are represented by males and females with a constant (1:1) sex ratio. Furthermore, in the general case, fecundity (conversion coefficient) ϵ i j of a couple constituted by a male and female having, respectively, genotypes i and j, i , j = m m , m s , s s can differ from fecundity ϵ j i of a couple consisting of a male with genotype j and female with genotype i. To simplify the model, we further consider the case of autosomal inheritance, i.e., ϵ i j = ϵ j i , i , j = m m , m s , s s , reducing Formula (2) to
(3a) f m m P m m , P m s , P s s = ϵ m m m m P m m 2 + ϵ m m m s P m m P m s + ϵ m s m s P m s 2 / 4 ; (3b) f m s P m s , P m s , P s s = ϵ m m m s P m m P m s + ϵ m s m s P m s 2 / 2 + 2 ϵ m m s s P m m P s s + ϵ m s s s P m s P s s ; (3c) f s s P m m , P m s , P s s = ϵ s s s s P s s 2 + ϵ m s s s P m s P s s + ϵ m s m s P m s 2 / 4 .
It is supposed that the growth of the predator population is subject to the Allee effect [37,38]. The Allee coefficient θ characterizes the decline in the consumer birth rate with lowering population density [12,17,39].
The growth rate of the prey population in System (1) depends on the spatial coordinate r = r ( x ) . This allows us to consider the spatial heterogeneity of the habitat by setting some strictly positive value of the growth coefficient r over the whole habitat Ω , excepting deteriorated areas marked as unsuitable for prey reproduction, where r ( x ) = 0 (see examples of spatial patterns in Figure 1). Parameter c is the intraspecific competition coefficient of the prey; a and h are, respectively, the searching efficiency and the handling time parameters of the prey-dependent Holling type II trophic function of the predator g ( N ) = a N / ( 1 + a h N ) ; μ m m , μ m s , and μ s s are the natural mortality of the respective genotypes; δ m m , δ m s , δ s s , and δ S are the diffusion coefficients of the genotype densities and of the prey-taxis stimulus, respectively. The prey-taxis stimulus S, emitted by prey, decays at a constant rate η . Without loss of generality, the emission coefficient can be set to unity. The advective terms in the balance Equation (1b–d) describe prey-taxis movements of the predator genotype densities along the gradient of S. The ability of predator genotypes to perform directional movements is characterized by the corresponding prey-taxis coefficient: κ m m , κ m s , and κ s s .
System (1) is supplemented with a non-negative initial distribution of variables and the Neumann boundary conditions
N · n = P m m · n = P m s · n = P s s · n = S · n = 0 , x Ω ,
where n is the external normal to the boundary Ω of the considered habitat.
Notice that the demo-genetic Kostitzin model does not associate population fitness with some particular parameters. The genotypes (phenotypes) can differ in any parameter affecting their feeding, demography, or behavior, and as a result, their competitive ability against other genotypes constituting the population. Since our primer objective consists in studying the effect of habitat disturbance and fragmentation on the natural selection of traits enhancing the spatial activity of the consumer, we further simplify the model, assuming that genotypes differ by their taxis and diffusion coefficients only, having all other parameters equal. Moreover, we will assume that the mobility allele is recessive, i.e., the heterozygotic and homozygotic predators P m s and P s s belong to the same ‘settled’ (i.e., having lower ability to move than ‘mobile’) phenotype. The hypothesis that individual traits enhancing mobility are recessive and inherited by the predator in an autosomal manner is plausible and does not contradict observations. In particular, it is known that the flightless phenotype in some Coleoptera species can be controlled by a single recessive mutation, e.g., in the artificially selected flightless strain of harlequin ladybird Harmonia axyridis [40,41].
Earlier, we applied Models (1), (3), (4) to describe phenomena observed by O. V. Kovalev [42] upon the introduction of the ragweed leaf beetle Zygogramma suturalis F. from North America to the Old World in 1978 as a biological control agent against the common ragweed Ambrosia artemisiifolia L. It was shown (see [11]) that the model is capable of reproducing the formation and movement of the solitary population wave (SPW) of the leaf beetle [43], long-term control over the ragweed [44], and spectacularly rapid selection of the flight ability in the leaf beetle population, which lost the ability to fly in its homeland [45]. The model suggested that these three phenomena are interrelated and that the formation of the SPW is a key condition for the successful biological control and for rapid selection of traits enhancing the movement ability of the consumer. Computations with varying basal productivity of the modelled trophic system showed that lowering the production of the prey species does not allow the formation of SPW, weakening the efficiency of the predator to control the prey and giving no advance to the flying (i.e., more mobile) genotype of the predator [11]. These simulations were based on the numerical continuation method. However, overall production of the prey population can also be affected by local disturbances, making some areas unsuitable for prey reproduction. Thus, there is a remaining unsolved question regarding the effect of the deterioration of the habitat on the selection of traits related with the predator’s movement ability.
Concentrating on this problem, in the present study, we purposely borrow parameters of Models (1), (3), (4) from the study in [11], but the only biological meaning of this basic parameter set now is that in the case of undisturbed habitat, predators perfectly control the prey, having the evolutionary advantage of the mobile genotype over the settled ones. We demonstrate how different degrees of habitat fragmentation presented in Figure 1 can change the situation. Besides predator genotype densities, we observe spatiotemporal dynamics of the allele frequencies, defined as
n m = ( P m m + P m s / 2 ) / P m m + P m s + P s s = ( P m m + P m s / 2 ) / P ;
n s = ( P s s + P m s / 2 ) P m m + P m s + P s s = ( P s s + P m s / 2 ) / P .
The parameter values are as follows: L x = 4000 , L y = 3000 , r = 0.0117 , c = 0.01 , κ m m = 0.025 , κ m s = κ s s = 0.005 , δ m m = 15 , δ m s = δ s s = 3 , μ m m = μ m s = μ s s = 0.0114 , η m m = η m s = η s s = 0.01 , δ S = 0.05 , ϵ i j = 2625   i , j = m m , m s , s s , a = 0.6 × 10 4 , h = 35,700 , θ = 0.001 . Thus, both prey-taxis and diffusion coefficients of the ‘mobile’ genotype are five times higher than those parameters of the ‘settled’ genotype; all other parameters are equal.
Initial conditions correspond to homogeneous distribution of the prey with density R 0 , x = 1 and point invasion of 1500 predators in the spatial position marked with the cross in Figure 1. Initially there are no mobile predators P m m in the system. All the invaded predators are settled: 1400 homozygotic individuals P s s and only 100 heterozygotic individuals P m s possessing one copy of the ‘mobile’ allele. The initial frequency of the ‘mobile’ allele (5) in the predator population is quite small: n m = 1 / 300 300 . Hence, with the chosen parameter values, at initial moment t = 0 , System (1) corresponds to the reduced model, which was earlier studied in detail in [10,12,33,34,35]:
(7a) N t = N ( r ( x ) c N ) a N P 1 + a h N + δ N Δ N ; (7b) P t = ϵ a N P 1 + a h N · P P + θ μ P · ( κ P S ) + δ P Δ P ; (7c) S t = N η S + δ S Δ S .
The natural selection of traits that enhances predator’s mobility complicates the system, adding competing consumers capable of more active spatial behavior.

3. Results

Simulations with different patterns showed that the above-mentioned competition between genotypes strongly depends on the degree of spatial fragmentation.
For this, the continuous System (1) was approximated, using a regular spatial grid consisting of 200 nodes along the spatial coordinates x and y, approximating the spatial derivatives with the central differences and introducing dummy nodes on the boundaries, satisfying boundary Condition (4). The obtained system of 5 × 200 × 200 = 200,000 ODEs was then integrated by the fifth-order Runge–Kutta method with precision control and automatic time step selection. The accuracy of discretization was checked on a doubled grid.

3.1. Pattern A—Weak Fragmentation of the Habitat

Figure 2, Figure 3, Figure 4 and Figure 5 present the results obtained in the case of pattern A (Figure 1a). As we can see, when most of the habitat is suitable for prey reproduction with the possible exception of some small disconnected domains, after invasion of the predator, the system dynamics consists of four clearly distinguishable phases:
  • Local suppression of prey (Figure 2a) caused by outbreak of the predator density;
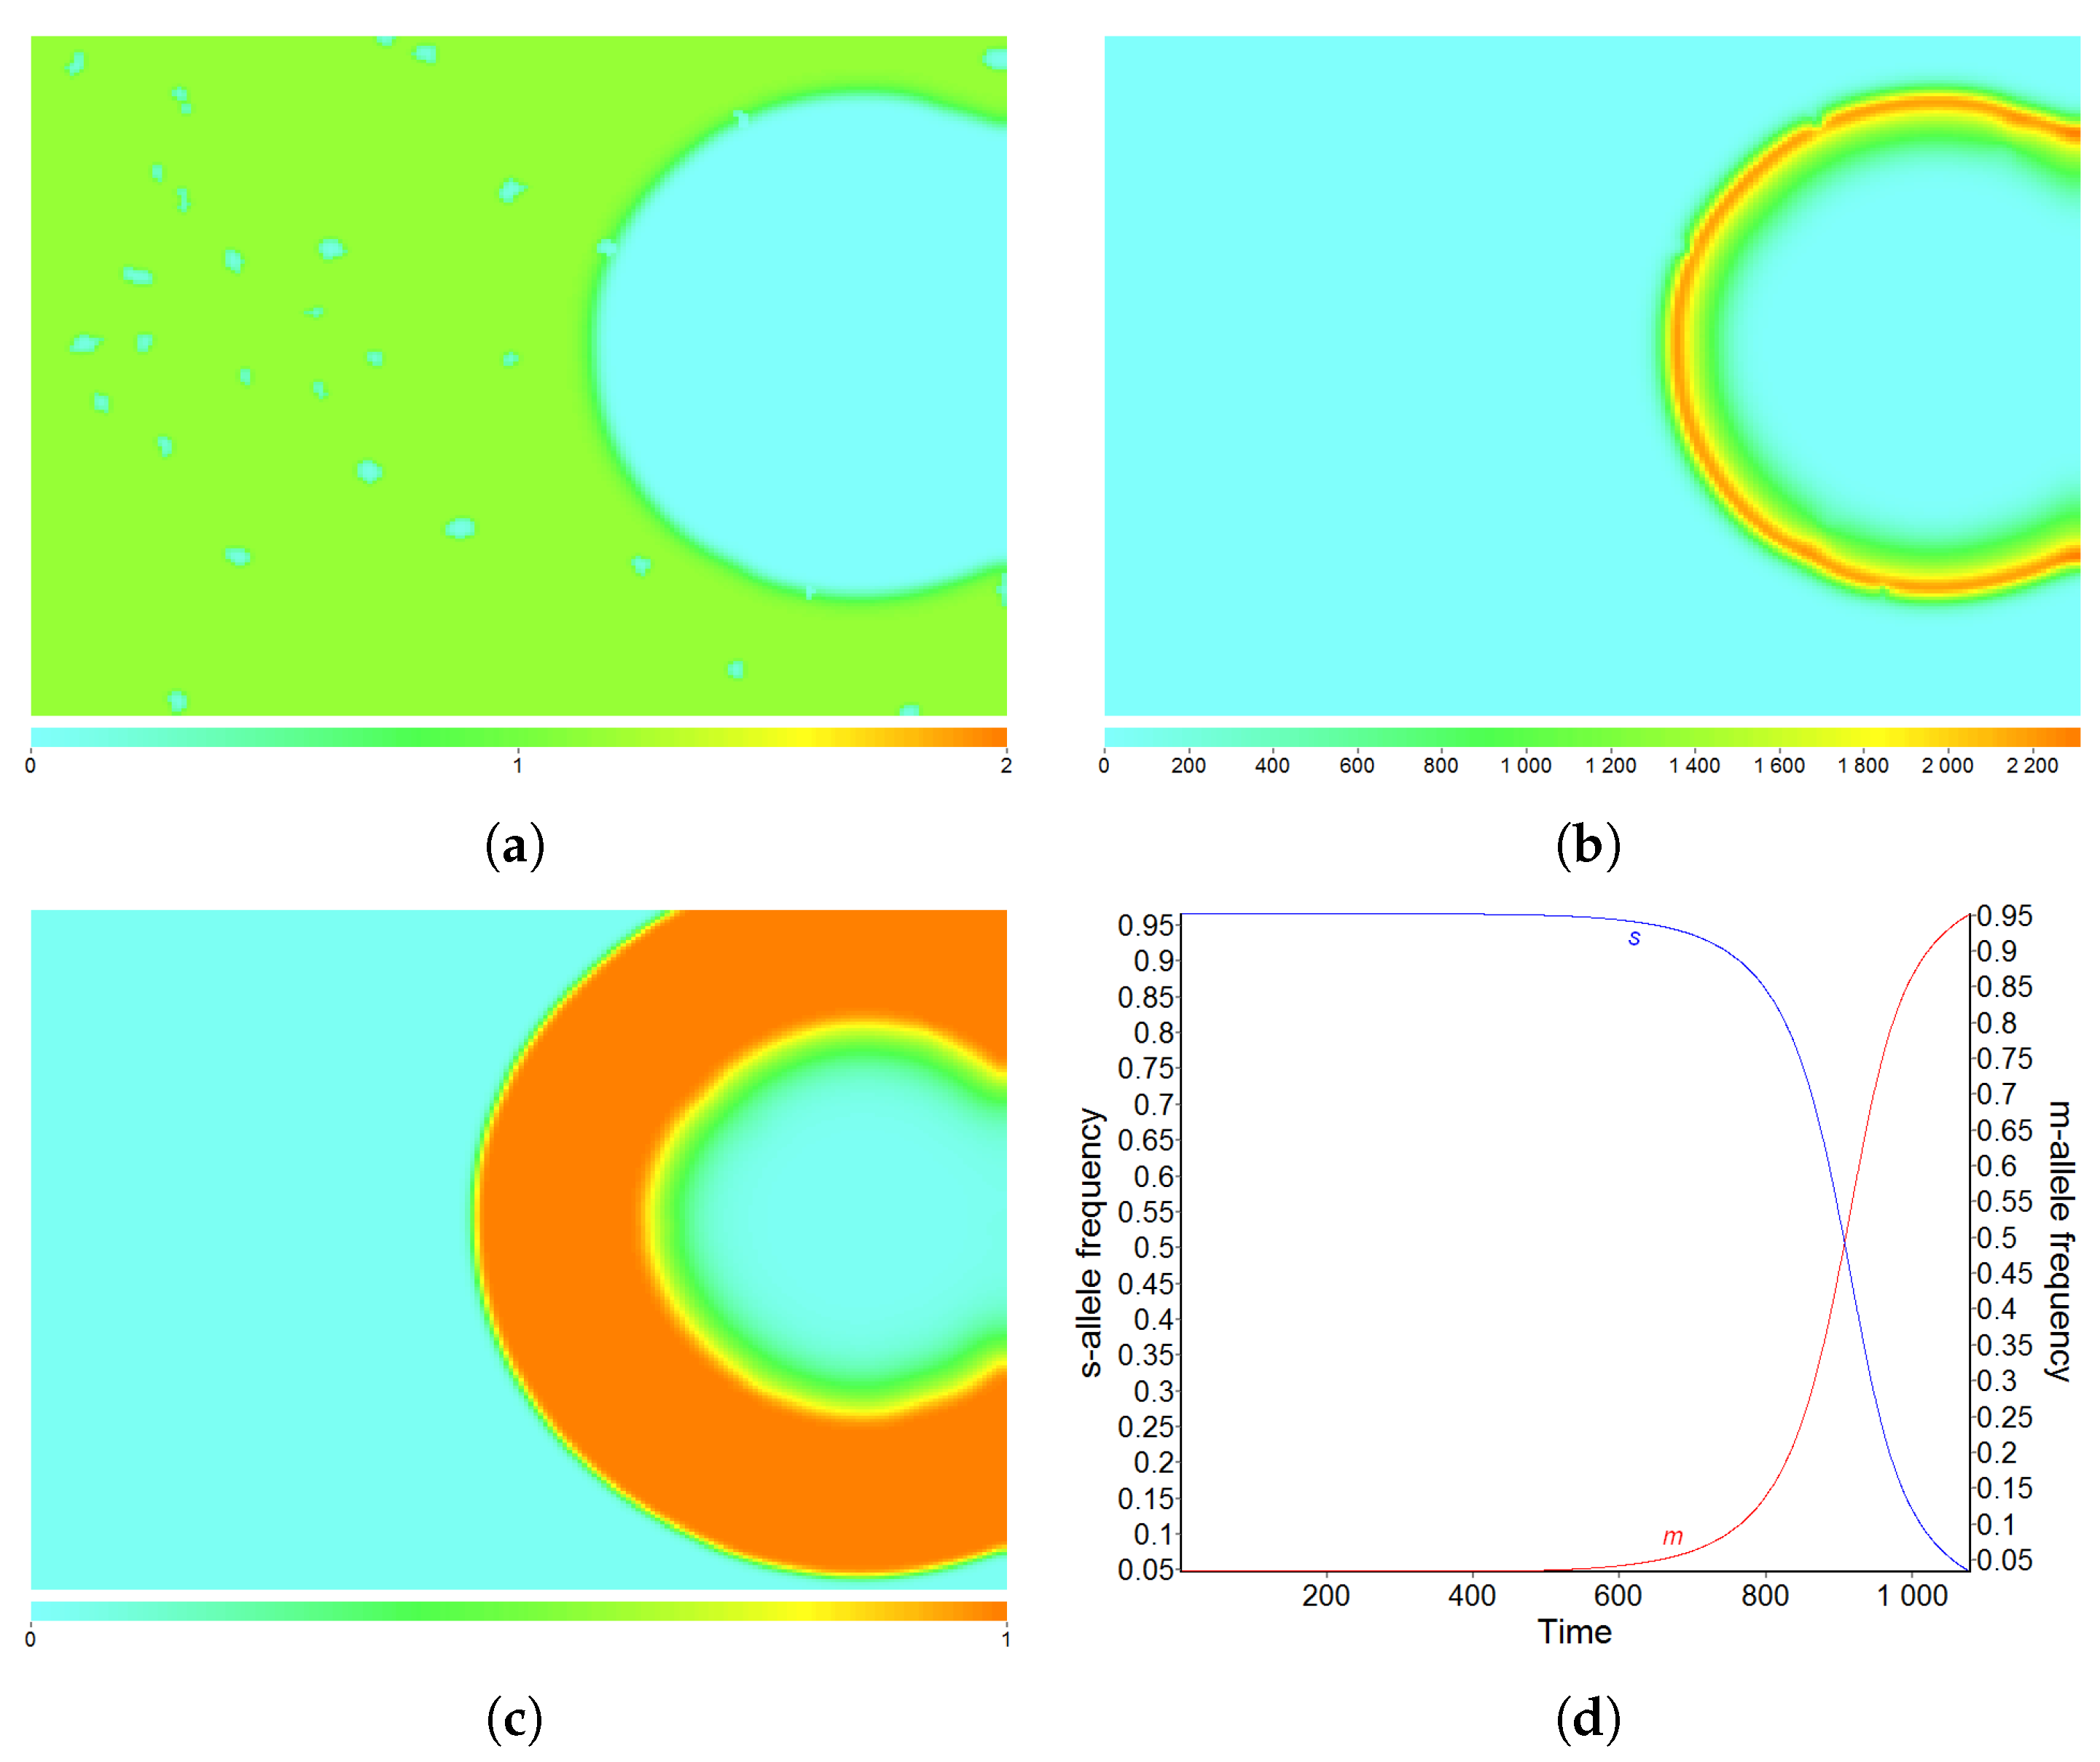
  • Formation of the solitary population wave (SPW) with very high density of (settled) predators in the wave front (Figure 2d), starting a gradual increase in the ‘mobile’ allele frequency n m (Figure 2);
  • Propagation of SPW (Figure 3a–c) and rapid transformation of the genetic structure of the invading predator population, supplanting virtually all ‘settled’ consumers with the ‘mobile’ phenotype m m (Figure 3d);
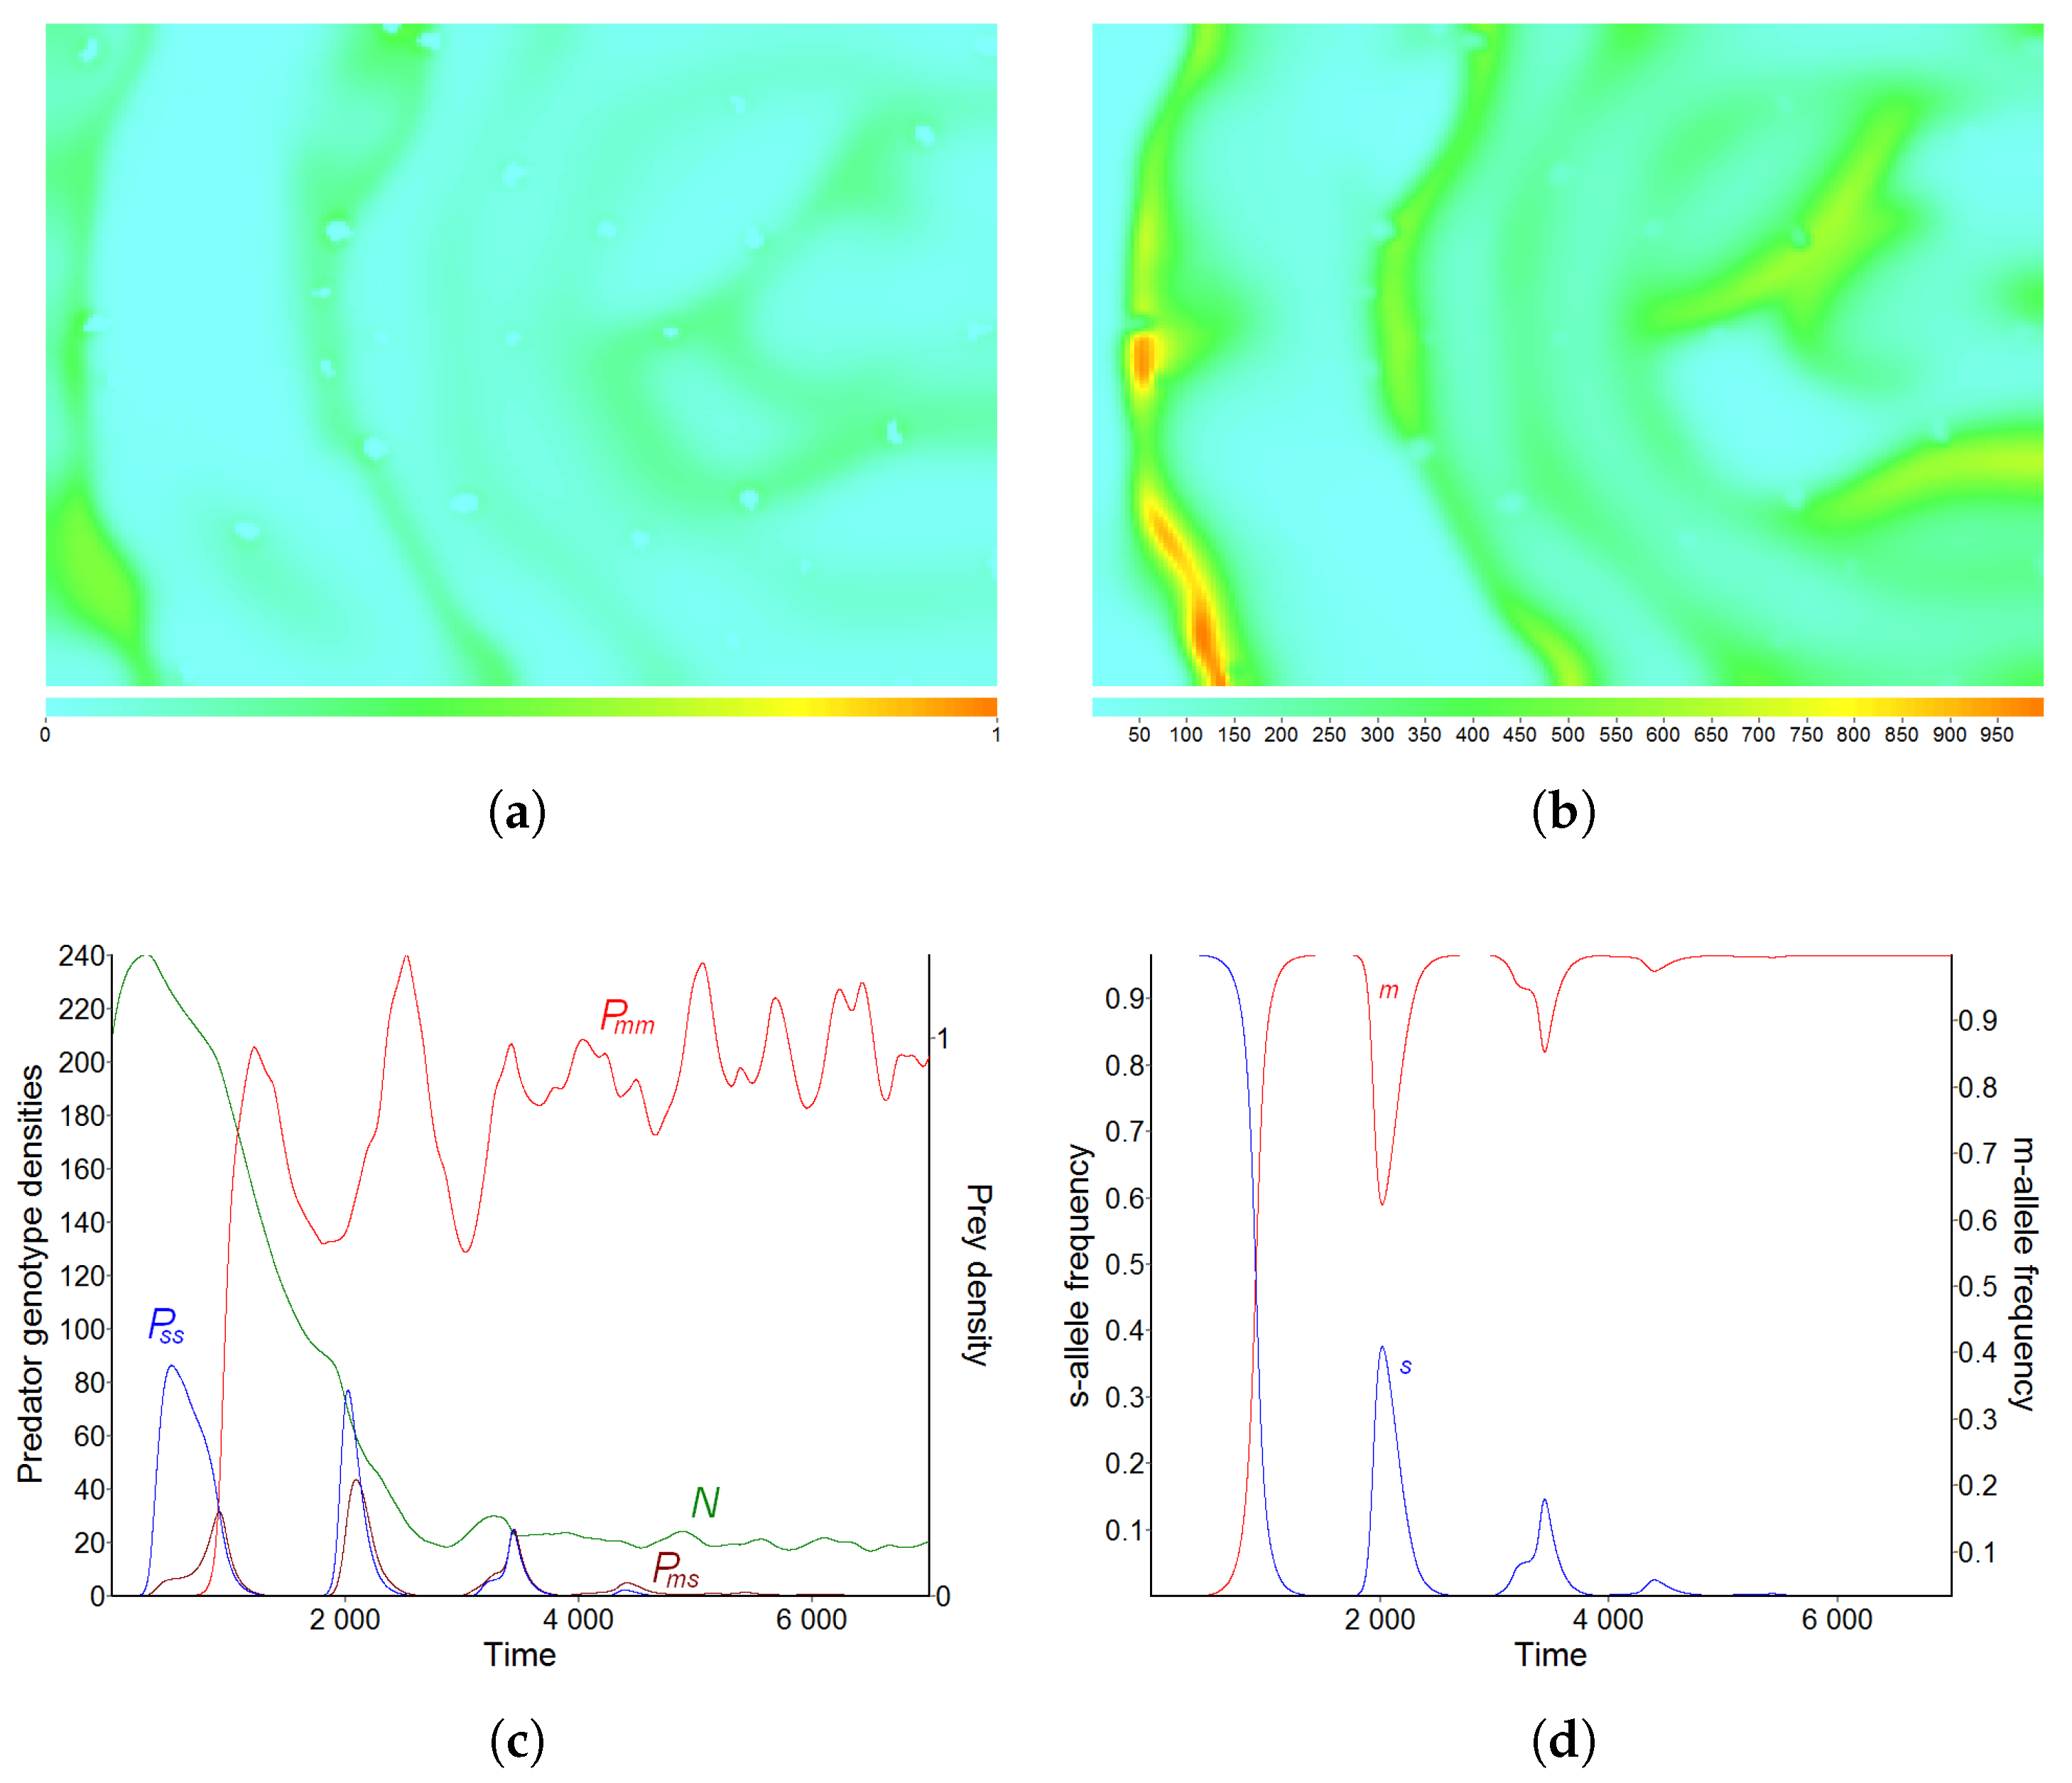
  • Stabilization of spatially heterogeneous wave regime with the appearance of secondary waves of prey and predator densities (Figure 4).
Interestingly, the evolution of the locomotion ability is not unidirectional (see Figure 4d). The frequency of the ‘mobile’ allele fluctuates even though the system dynamics approaches stabilization. The results suggest that ‘settled’ predators (those with lower values of diffusion and taxis coefficients) can have an advantage over the ‘mobile’ competitors during relatively short starvation periods due to a large-scale decrease in the prey density, i.e., when increasing mobility of the consumer cannot improve its fitness because an acute food shortage is everywhere. However, ultimately the ‘mobile’ genotype m m wins. The elimination of ‘settled’ genotypes s s and m s turns full System (1) into a reduced Model (7) with P = P m m and all genotype-dependent parameters corresponding to the ‘mobile’ predator.
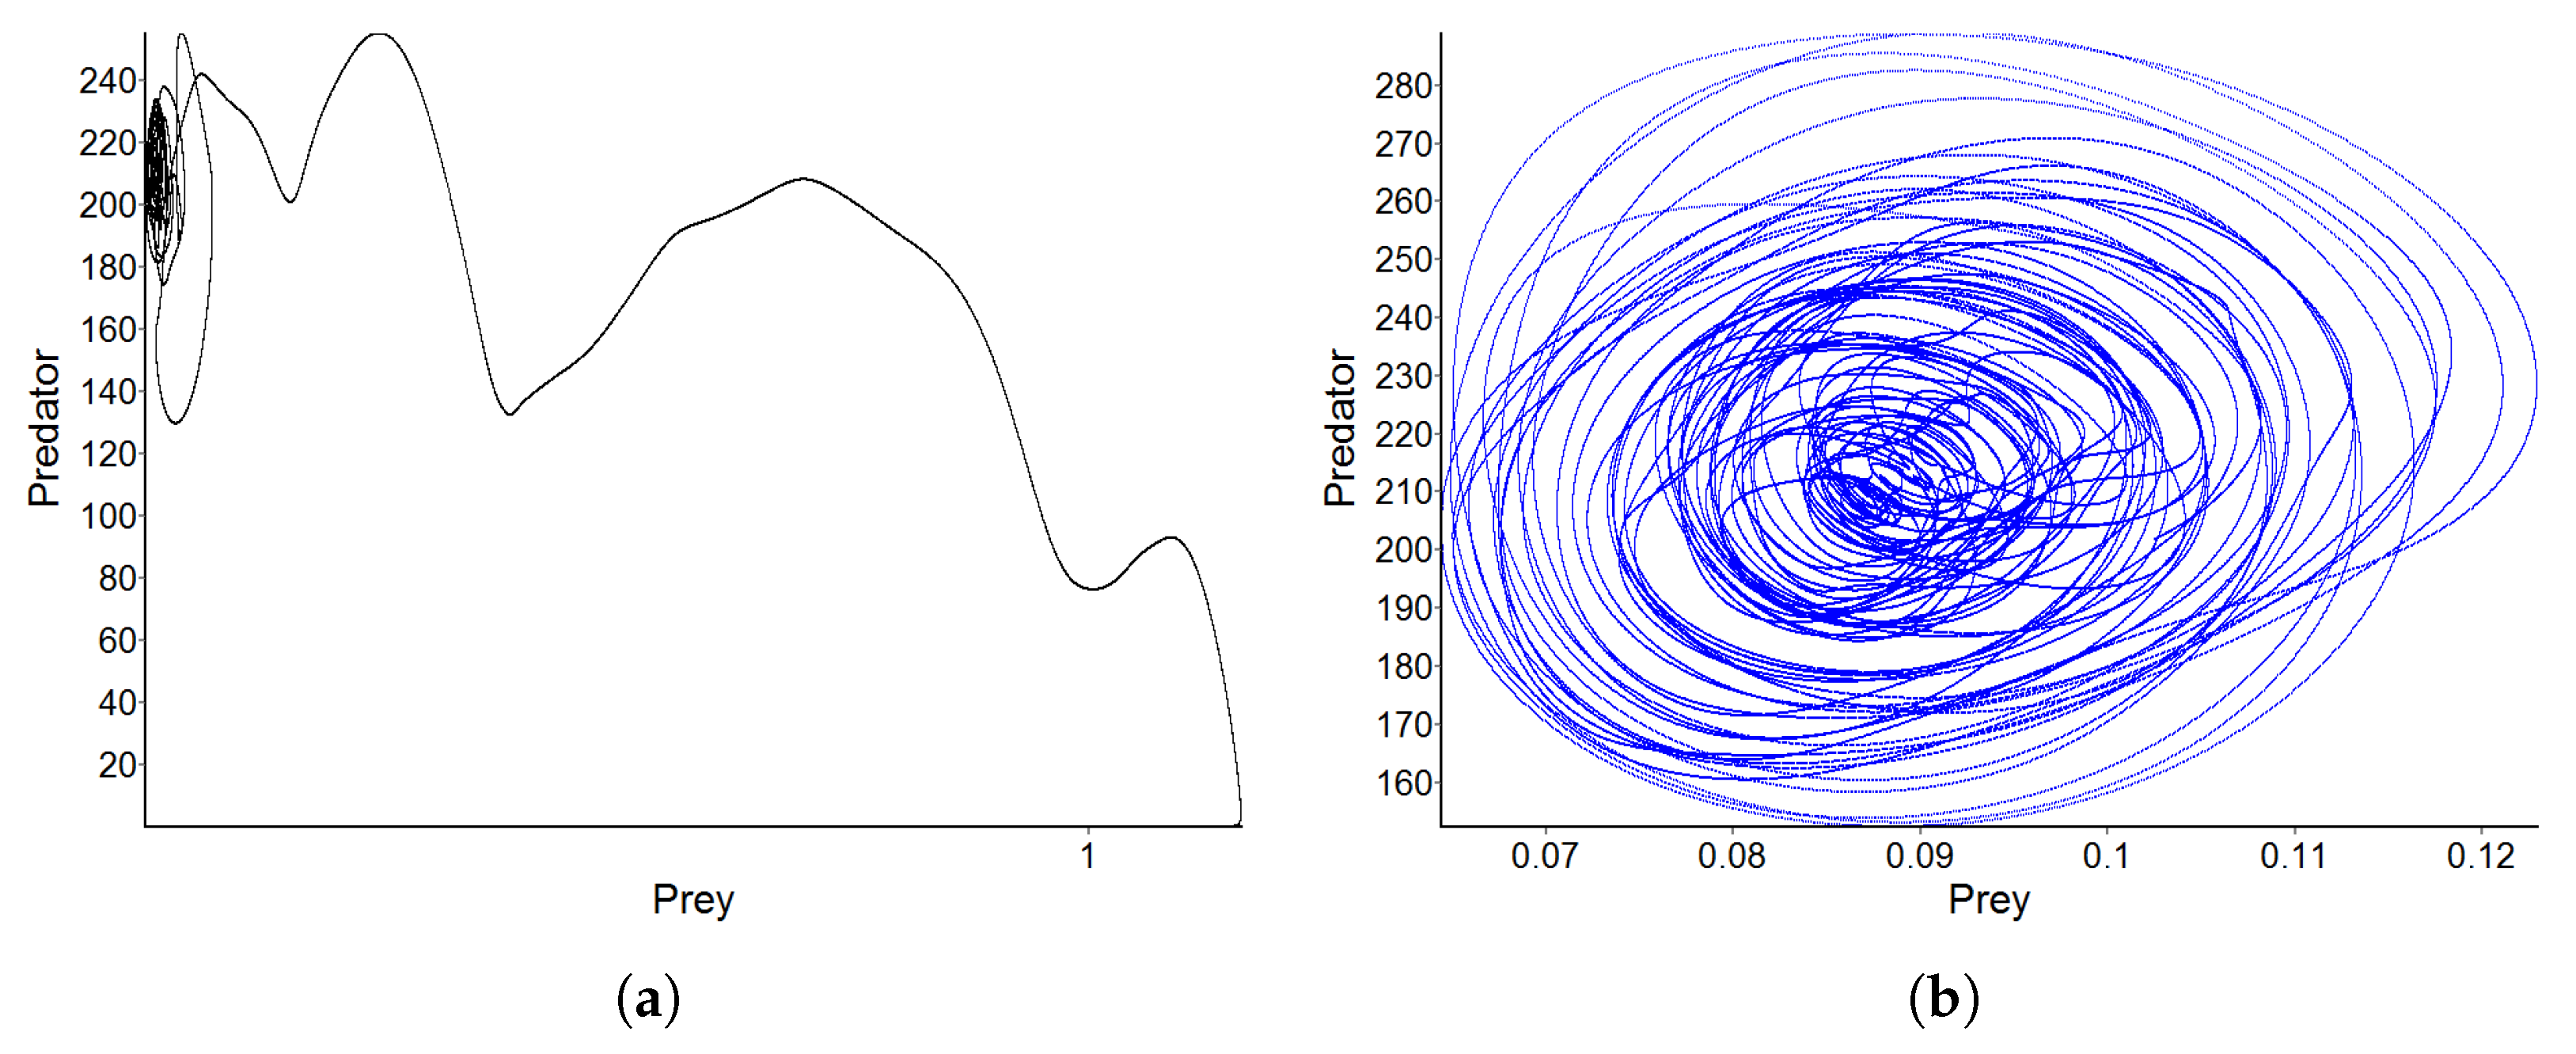
Figure 5 presents the transient and stabilized dynamics on the phase plane of spatially averaged prey and predator densities N , P . Notice small amplitudes of the stabilized dynamics in Figure 5b.

3.2. Pattern B—Moderate Fragmentation of the Habitat

First phases of the predator invasion simulated with pattern B (Figure 1b) look very similar to the previous case, including the formation and propagation of the predator SPW. However, the presence of relatively large domains unsuitable for reproduction of the prey provides refuges for the ‘settled’ predators where they are less exposed to the pressure of more mobile competitors. Our simulation shows that although the stabilized dynamics is heterogeneous in both space and time (Figure 6), these refuges are located at relatively stationary zones. These zones are well seen in Figure 7, which presents typical distributions of the allele frequencies within the domain Ω . Predators carrying the settled gene s (see Figure 7b) are concentrated near the borders of unsuitable black areas in Figure 1b, achieving local maximums inside the more isolated areas that look like islands and peninsulas.
Due to the refuge effect, the predator population has a heterogenetic structure, and all three genotypes m m , s s , and m s coexist; see Figure 8. Since only 15.79% of the habitat area does not allow the prey to reproduce, the natural selection of traits that enhance locomotion ability is advantageous for predators, allowing them to explore the area, actively searching for food. At that, there are regions where the fitness of the settled phenotype is higher, but these regions are not large. Thus, both phenotypes coexist and predators carrying the gene of mobility prevail over the settled consumers.

3.3. Pattern C—Essential Fragmentation of the Habitat

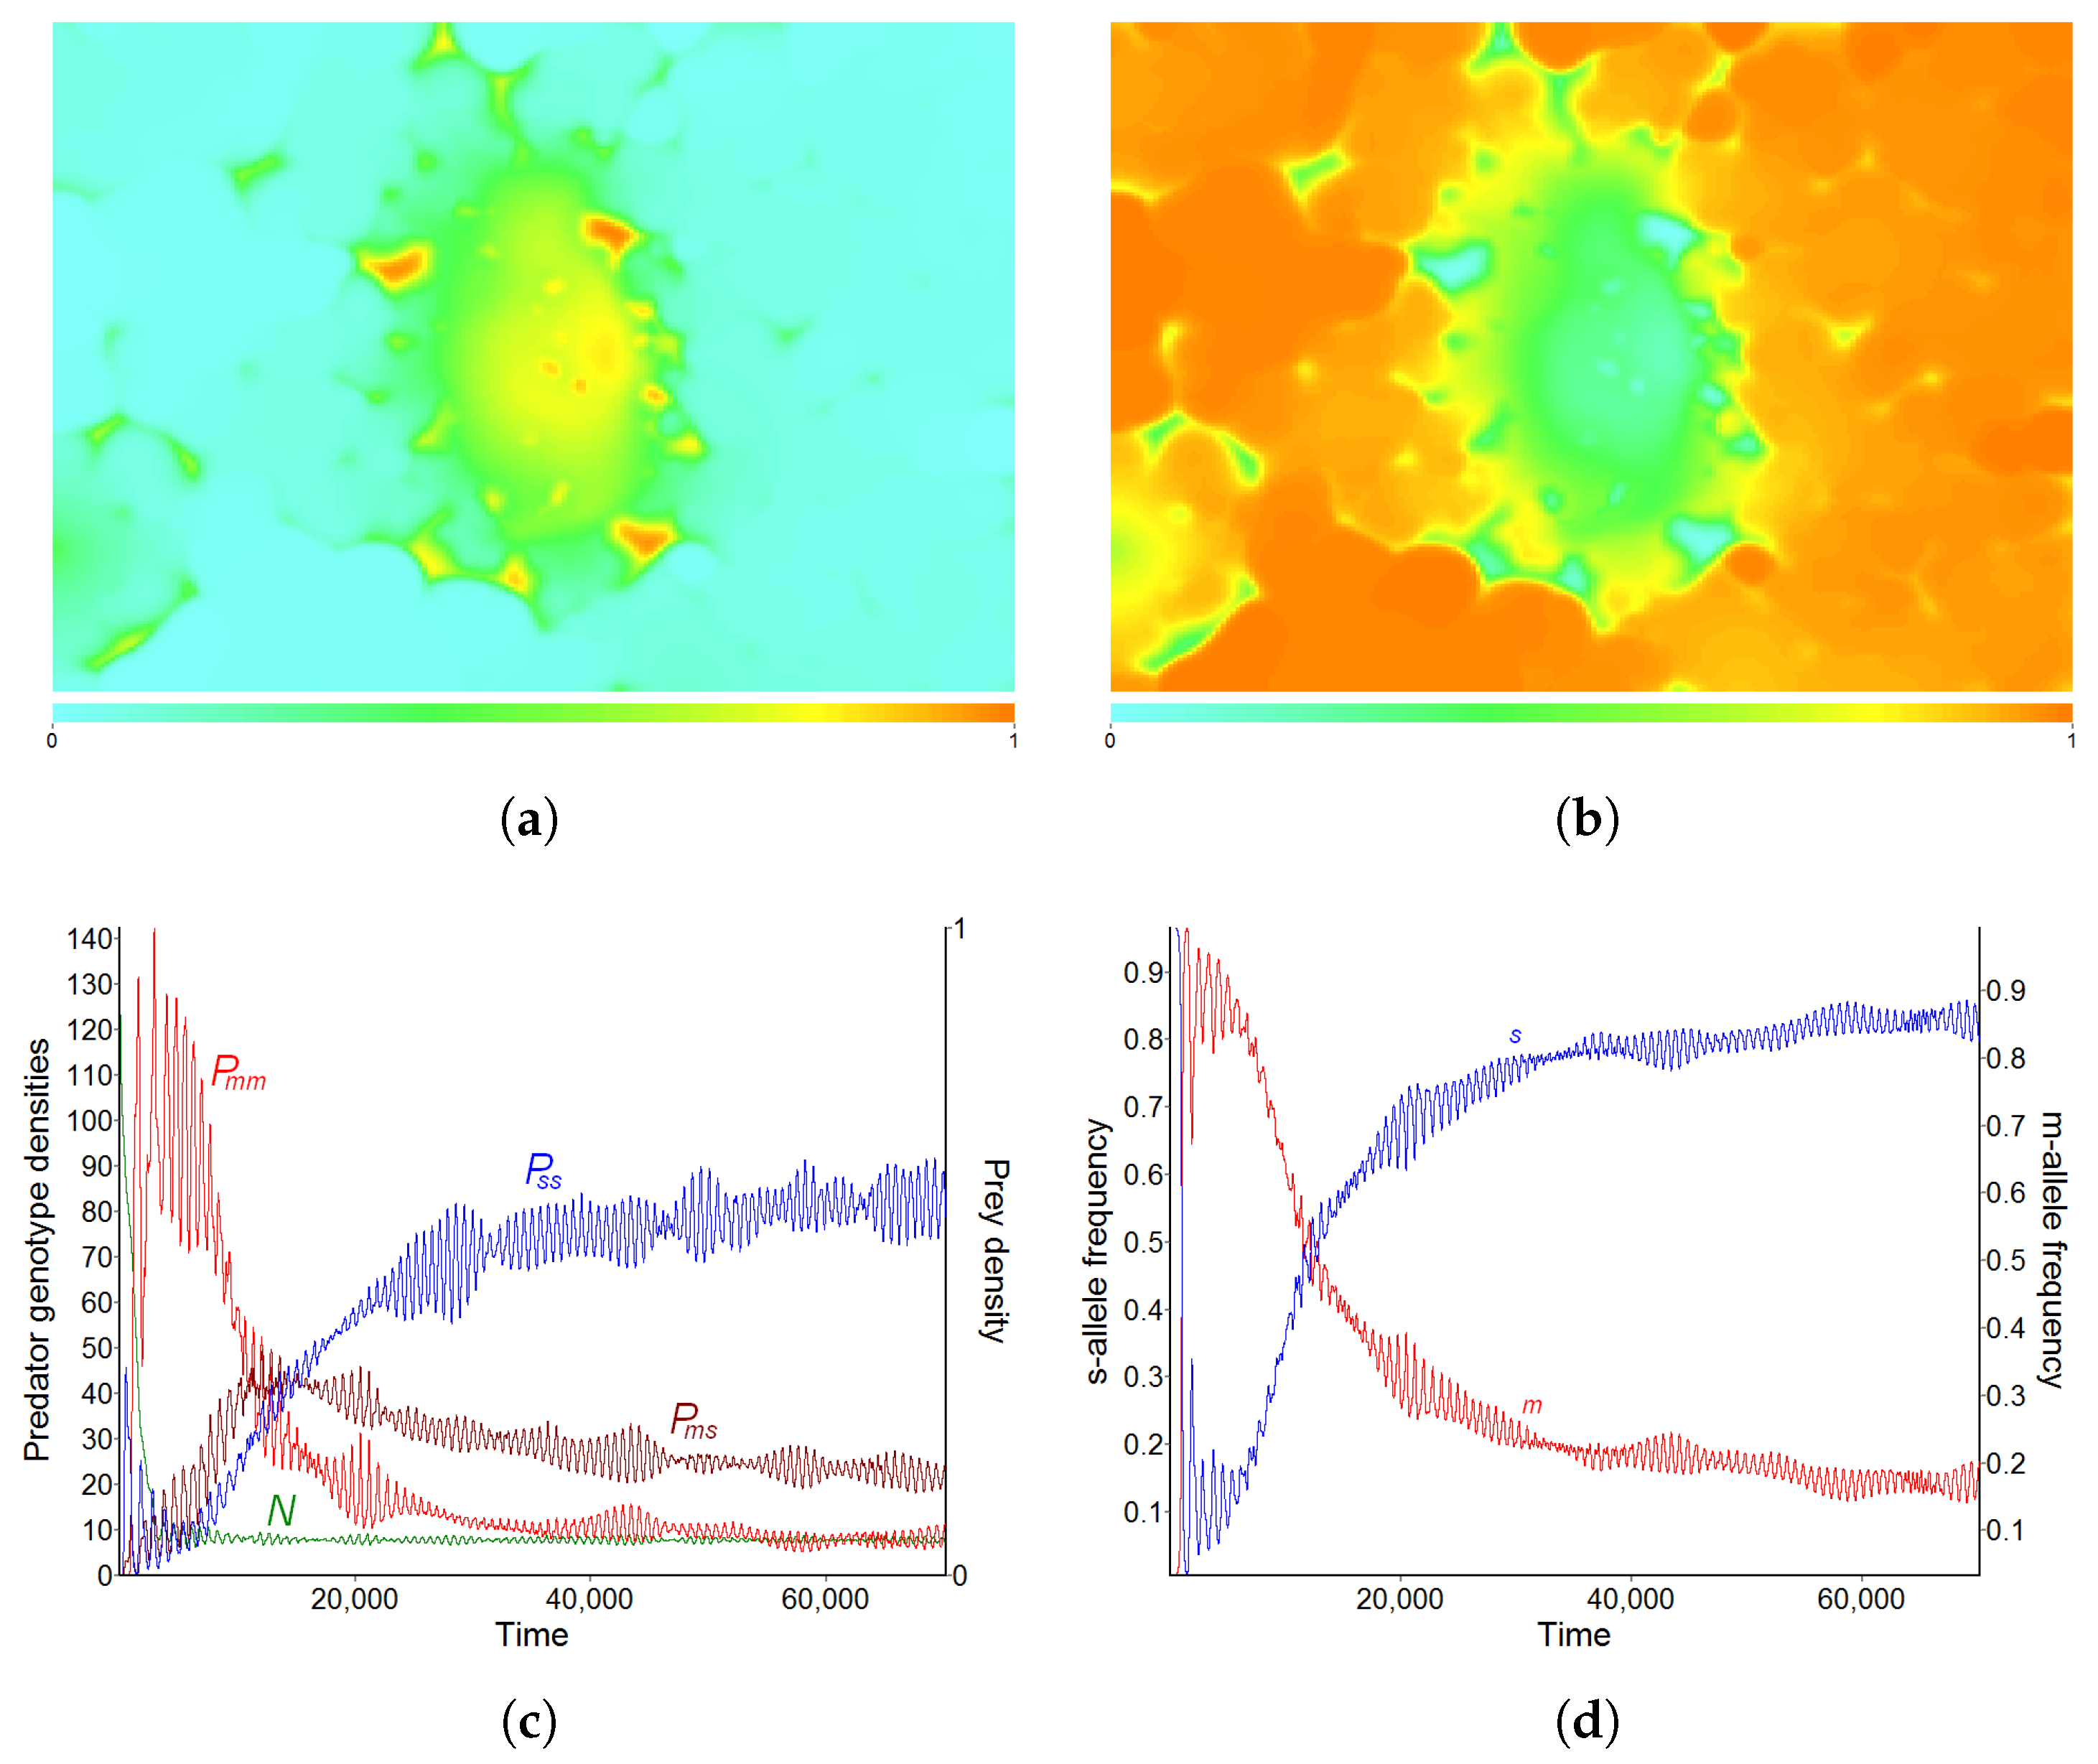
Pattern C, with a more pronounced fragmentation, changes the situation; see Figure 9. According to simulation results obtained with spatial pattern C, where prey cannot reproduce in more than half (52.80%) of the habitat area, the proportion of mobile predators in the population decreases significantly (Figure 9d). Nevertheless, all three genotypes still coexist in the stabilized complex spatiotemporal dynamics (Figure 9c). The mobile genotype P m m wins mainly in the well-connected central part of the habitat (see Figure 1c); elsewhere, frequency n s is higher than n m , and our observation reveals that like the previous case with pattern B, regions of maximum allele frequencies in Figure 9a,b have nearly stationary positions, primarily determined by characteristics of pattern C.
As was observed in the previous case of pattern B (Figure 8a), the modelled system clearly demonstrates three character shifts in adaptive landscape of the mobility trait selection (Figure 9c): (i) short increase in the settled genotypes’ density during the initial phase of the predator population outbreak; (ii) rapid transition to a new peak with maximum density of the mobile genotype; (iii) gradual change followed by the long-term stasis fluctuations in a peak corresponding to the coexistence of all three genotypes.

3.4. Pattern D—Strong Fragmentation of the Habitat

In the case of a very strong disturbance and fragmentation of the habitat when prey cannot reproduce in most of the spatial domain, traits enhancing the feeding migratory ability of predators predispose them to losing in competition with less active ‘settled’ genotypes. Figure 10 illustrates this situation in the simulation with pattern D, presented in Figure 1d.

3.5. Effect of Diffusion-Generated Pattern

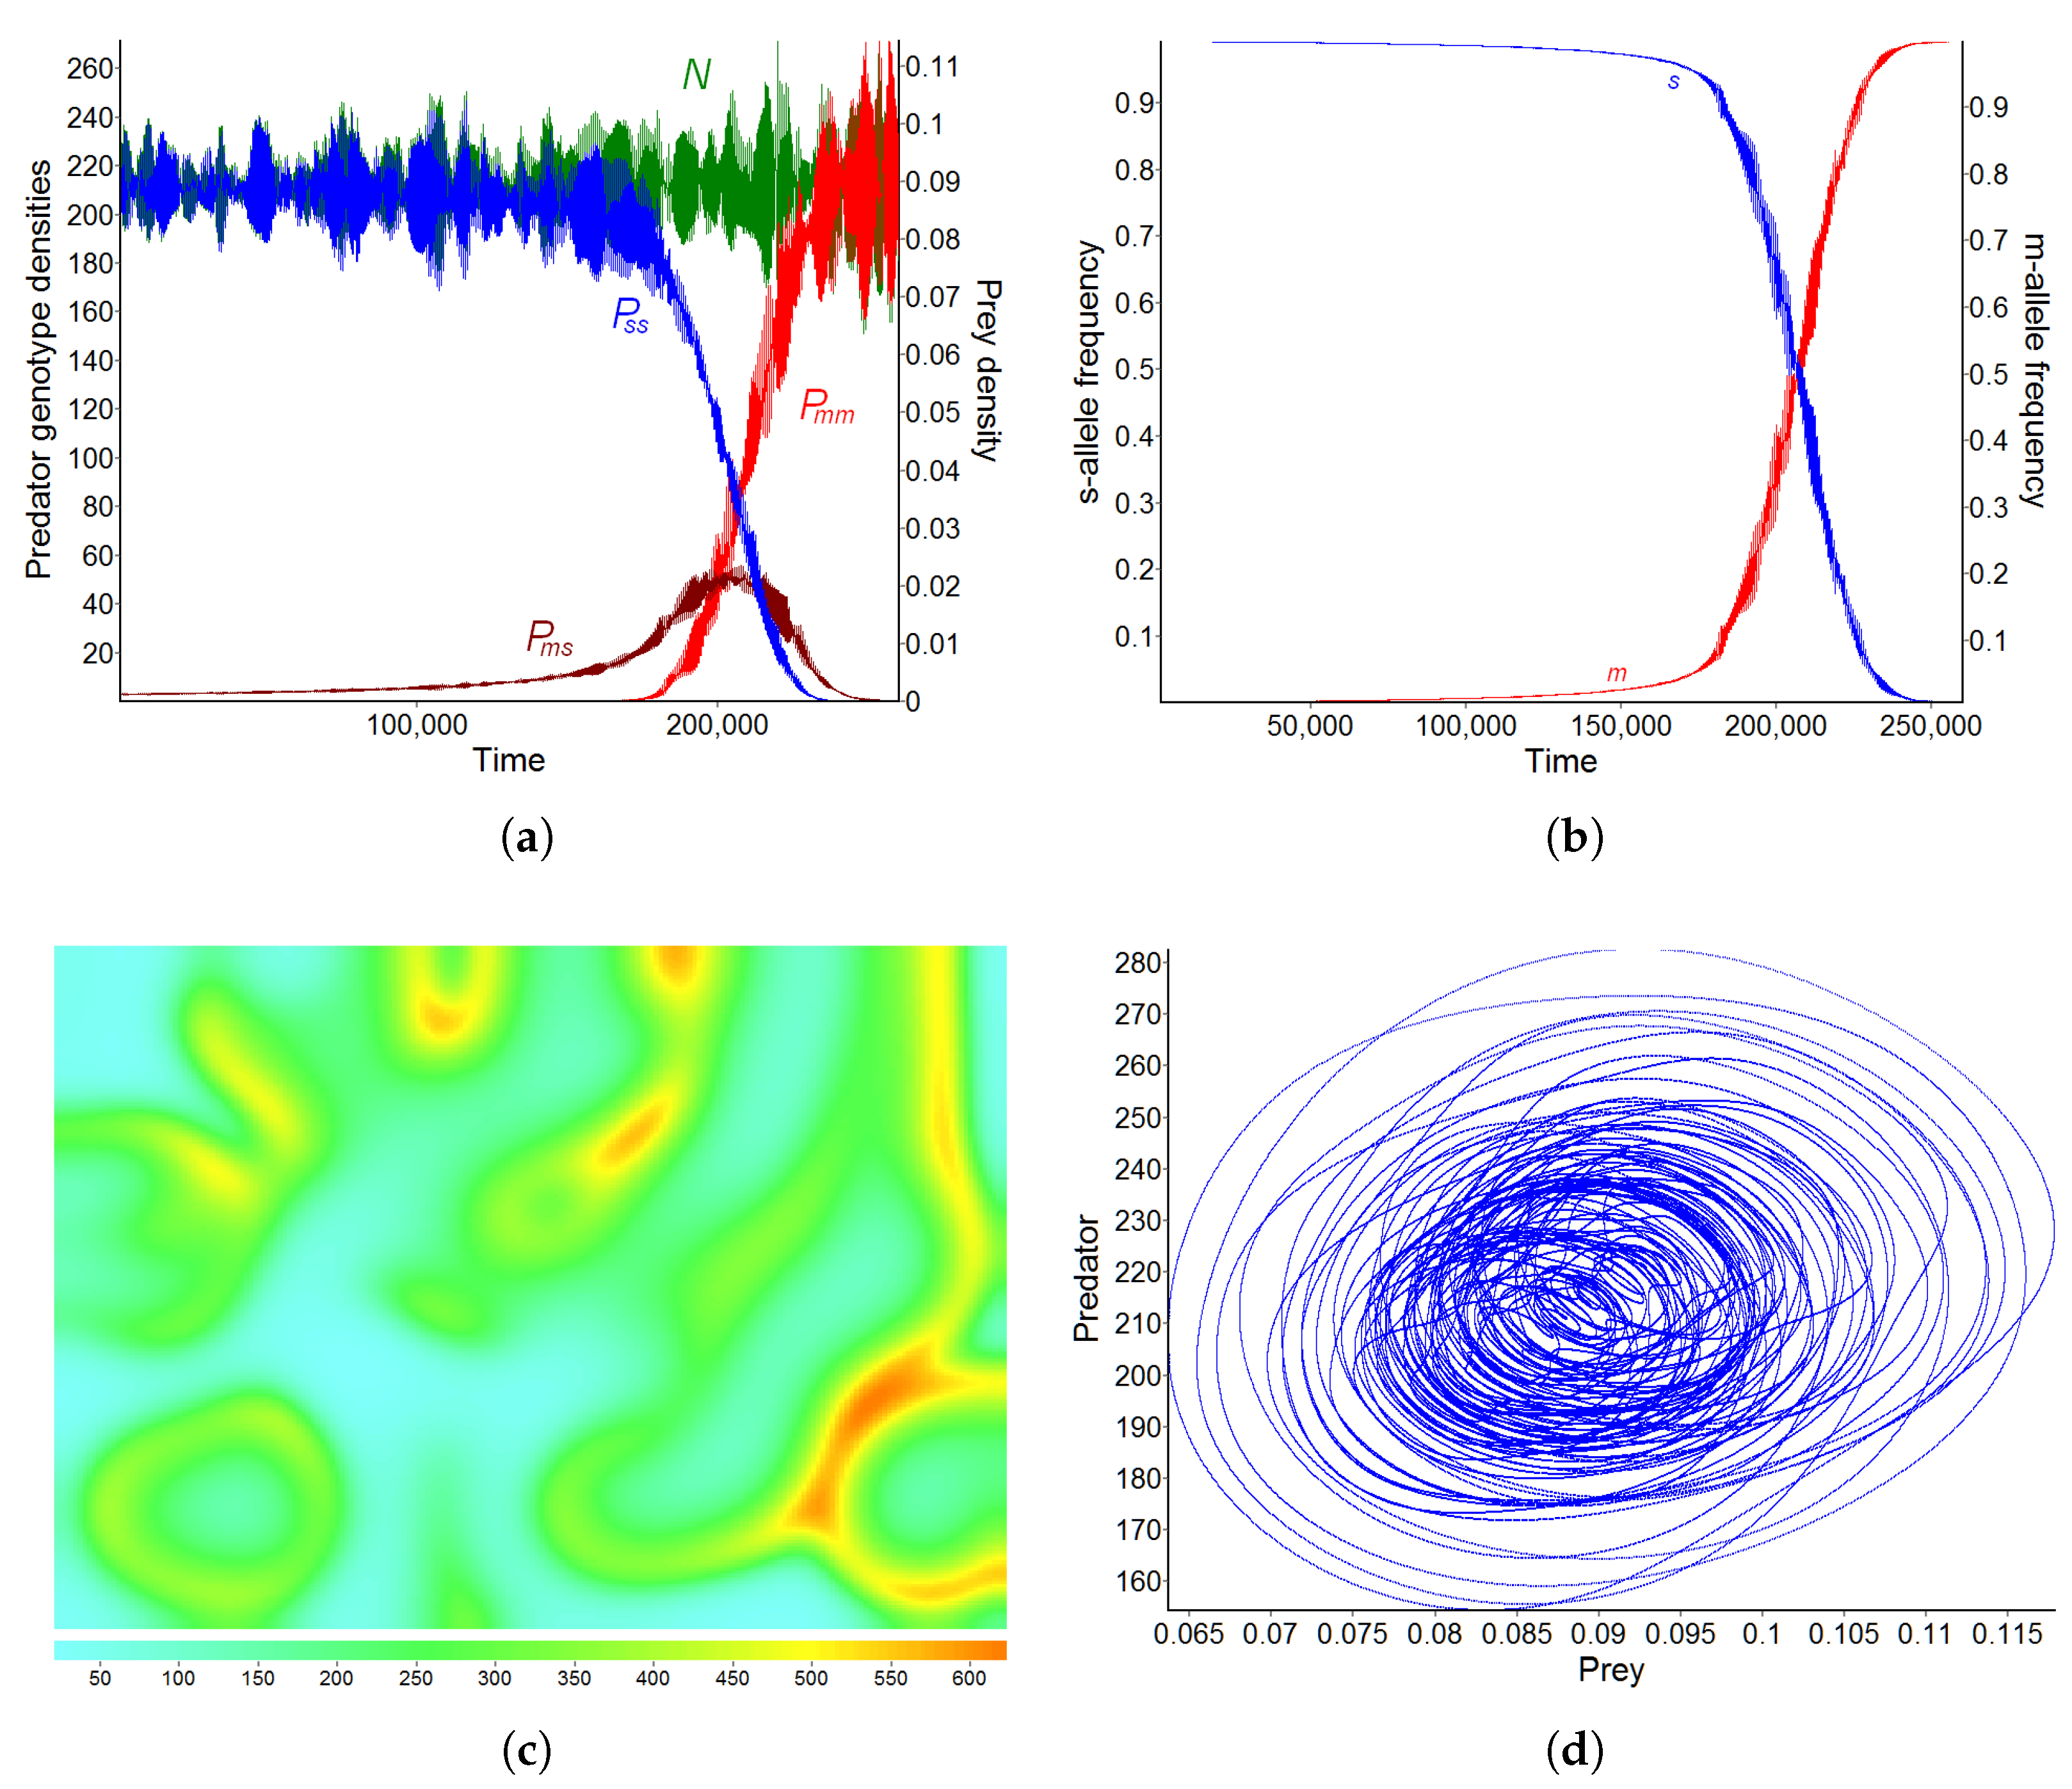
It is of interest to consider also a case when the settled genotypes of predator in Model (1) do not exhibit prey-taxis, κ s s = κ m s = 0 , but their diffusion destabilizes the homogeneous limit cycle of the non-spatial model, giving rise to the emergence of heterogeneous spatiotemporal dynamics, δ s s = δ m s = 3.0 . In addition to undirected diffusive movements, the mobile genotype is capable of moving directionally, exhibiting prey-taxis: δ m m = 3.0 , κ m m = 0.005 . Thus, the settled allele s is dominant and predators carrying this gene are purely diffusive consumers. The habitat in the considered scenario is not deteriorated, and the prey reproduces over the whole domain Ω , r ( x ) 0.0117. Other parameters are kept the same as in the earlier simulations.
Results in Figure 11 show that the initially dominating diffusive predator durably suppresses the prey, capturing almost all feeding resources for its own reproduction, and thus gives very little chance for the development of the mobile competitors.
In fact, in this case, the population of settled predators acts as a kind of ‘ecosystem engineer’ species [46] that modifies the environment, altering the ecosystem dynamics. As a result, the modelled trophic system for a very long period remains in some ‘quasi-stable’ spatially heterogenous regime, when neither ‘mobile’ nor ‘settled’ phenotype demonstrates an evident advantage. However, a slow increase in the mobile genotype density, which can be seen at the long timescale only, gradually passes to rapid transformation of the population-genetic structure, and finally all predators become capable of prey-taxis movements.

4. Discussion

While movements of the prey density in Systems (1) and (7) are modeled as passive diffusion, the spatial activity of the predator is represented by the advection terms, assuming that the predators can move directionally up the gradient of chemoattractant S, which is continuously emitted by the prey. Moreover, application of the gradient operator to the stimulus equations transforms the systems to equivalent models that describe inertial movements of the predators with taxis acceleration determined by the gradient of the prey density (see details in [47]). This broadens the domain of applicability of the approach, allowing us to model both inertial prey-taxis (e.g., [9,48]) and indirect prey-taxis (e.g., [12,35]). These kinds of consumers’ spatial behaviors are very common in nature. They are observed for various species, e.g., amoebas responding to chemicals produced by bacteria [49], entomophagous insects with chemosensory response to prey [50], harpacticoid copepods exhibiting satiety-stimulated prey-taxis [13], and marine carnivorous fish like sharks and tunas locating their prey through olfaction [51,52,53]. Further references and more examples of chemosensory detection of prey by predators can be found in [54].
From earlier studies, it is known that indirect/inertial prey-taxis induces spatially heterogeneous dynamics in System (7) with the Neumann zero-flux boundary conditions [10,12,35]. With sufficiently high values of the taxis coefficient κ , complex spatiotemporal solutions emerge, resulting from the destabilization of either homogeneous coexisting equilibrium or homogeneous limit cycle, irrespective of the Allee parameter θ and of the other parameter values. In the considered simulation scenarios, the ability to move directionally of both mobile and settled predator phenotypes was assumed to be high enough to cause patch dynamics. Thus, changing the proportion between the mobile and settled genotypes in the demogenetic Model (1) modifies its spatiotemporal regime. That is what we have observed in the above-presented numerical simulations with various spatial patterns of the habitat domain. Moreover, the results suggest that the selection of traits enhancing consumer mobility can have different directions, which depend on the spatial pattern affecting productivity and connectivity of the habitat.
The considered patterns A, B, C, and D specify spatial heterogeneity as stationary external conditions that directly affect productivity of the prey at both local and overall population scales. The predator population responds to spatial heterogeneity of the prey growth by adopting the balance between actively migrating and settled phenotypes to maximize fitness of the whole population. Little deterioration of the area inhabited by productive prey allows the mobile consumer to win the evolutionary competition; strong deterioration gives advantages to the less mobile (settled) genotype; intermediate deterioration leads to the coexistence of all three genotypes, with the prevailing of either mobile or settled predators, depending on the degree of deterioration. This spectrum of possible reactions of the model to deterioration of the habitat, including the intermediate cases ensuring survival of heterozygous predators, seems quite plausible and realistic. Earlier, the model explained the rapid selection of the flight ability in the ragweed leaf beetle Zygogramma suturalis F. population, observed after the introduction of this species in the South of Russia in 1978 [11]. The flight developed within 4 years (5–6 generations) due to the presence of large territories heavily infested by the ragweed before the introduction [45].
Being in qualitative agreement with observations (e.g., see surveys [5,6]), the model predictions coincide with conclusions of other theoretical studies on the selection of motility traits in a heterogeneous habitat. Using the adaptive dynamics theory [2], Mathias et al. [3] demonstrated divergency of the dispersal evolution in a heterogeneous landscape. Starting from a monomorphic population with small mutation in dispersal rate, their simulations reproduced convergence of the dispersal rate toward an evolutionarily unstable monomorphic point, followed by the branching and disruptive coevolution of two phenotypically distinctive dispersal strategies. The authors showed that although asynchronous temporal fluctuations of local carrying capacities select for dispersal, spatial fragmentation of the habitat selects against it, giving advantages to the low-dispersal phenotype. With another meta-population model simulating the spatiotemporal dynamics of a population consisting of 11 genotypes having different dispersal ability, Travis and Dytham [55] also demonstrated that low-dispersal phenotypes are advantaged in isolated local populations, whereas high-dispersal phenotypes are advantaged in clustered populations.
Both spatial and temporal heterogeneities of habitat quality in the above-mentioned studies are defined as external environmental factors, which can be either periodic or stochastic. In our model, even without taxis activity of the predator, i.e., with κ = 0 , Model (7) can exhibit spatially heterogeneous regimes emerging due to undirected (random) movements of animals. Namely, the spatially homogeneous periodic solution that exists in the classical Rosenzweig–MacArthur predator–prey model can be destabilized with the appropriate choice of the diffusion coefficient, e.g., see [56,57]. Furthermore, in the presence of the Allee effect in the predator population, i.e., with θ > 0 , the non-trivial homogeneous stationary state corresponding to equilibrium coexistence of prey and predator populations also can be destabilized, giving rise to the diffusion-induced stationary pattern [12], while the model ignoring the Allee effect, i.e., θ = 0 , cannot demonstrate the diffusion-driven formation of stationary patterns [58,59]. Accordingly, an additional experiment reproduced the gradual replacement of settled diffusive predators with mobile genotype capable of performing directed prey-taxis movements. Clearly, adding external spatial deterioration can further slow down or even alternate the modelled process. However, in this simulation, the habitat area was assumed to be untouched and entirely suitable for prey reproduction. Though the transformation of the genetic structure of the predator population took a comparatively long time, because of the strong suppression and spatial defragmentation of the prey population by the settled consumers that were initially dominating in the system, the outcome of the modelled natural selection was quite expected. Our previous studies demonstrated that prey-taxis behavior is an evolutionarily advantageous strategy, which allows prey and predator to coexist safely, avoiding the collapse of total overgrazing [13]. Another evolutionary advantage of the prey-taxis consists in overcoming the Allee effect in predator population growth, avoiding extinction that otherwise occurs in Model (7) with κ = 0 [12].
Notice that the demo-genetic Model (1) operates with parameters related to the macro level of population dynamics, while natural selection acts at the level of the individual. Correspondingly, the indirect prey-taxis movements at the population level do not require the ability of individual predators to sense the gradient of prey-taxis stimulus S, moving along its direction. The prey-taxis is a phenomenon that emerges at the level of the population due to random movements of individuals responding to local concentrations of stimulus; see the detailed explanation and derivation of the prey-taxis flux expression in [60]. Thus, at the level of the individual predator, variation in traits enhancing prey-taxis mobility consists in variation in a predator’s sensitivity to the local value of some substance or field S that stimulates the random replacing of the individual. This kind of individual response to stimulus could develop even in quite primitive consumers. At the population level, such individual behavior causes the directional movement of the population density along ∇S.
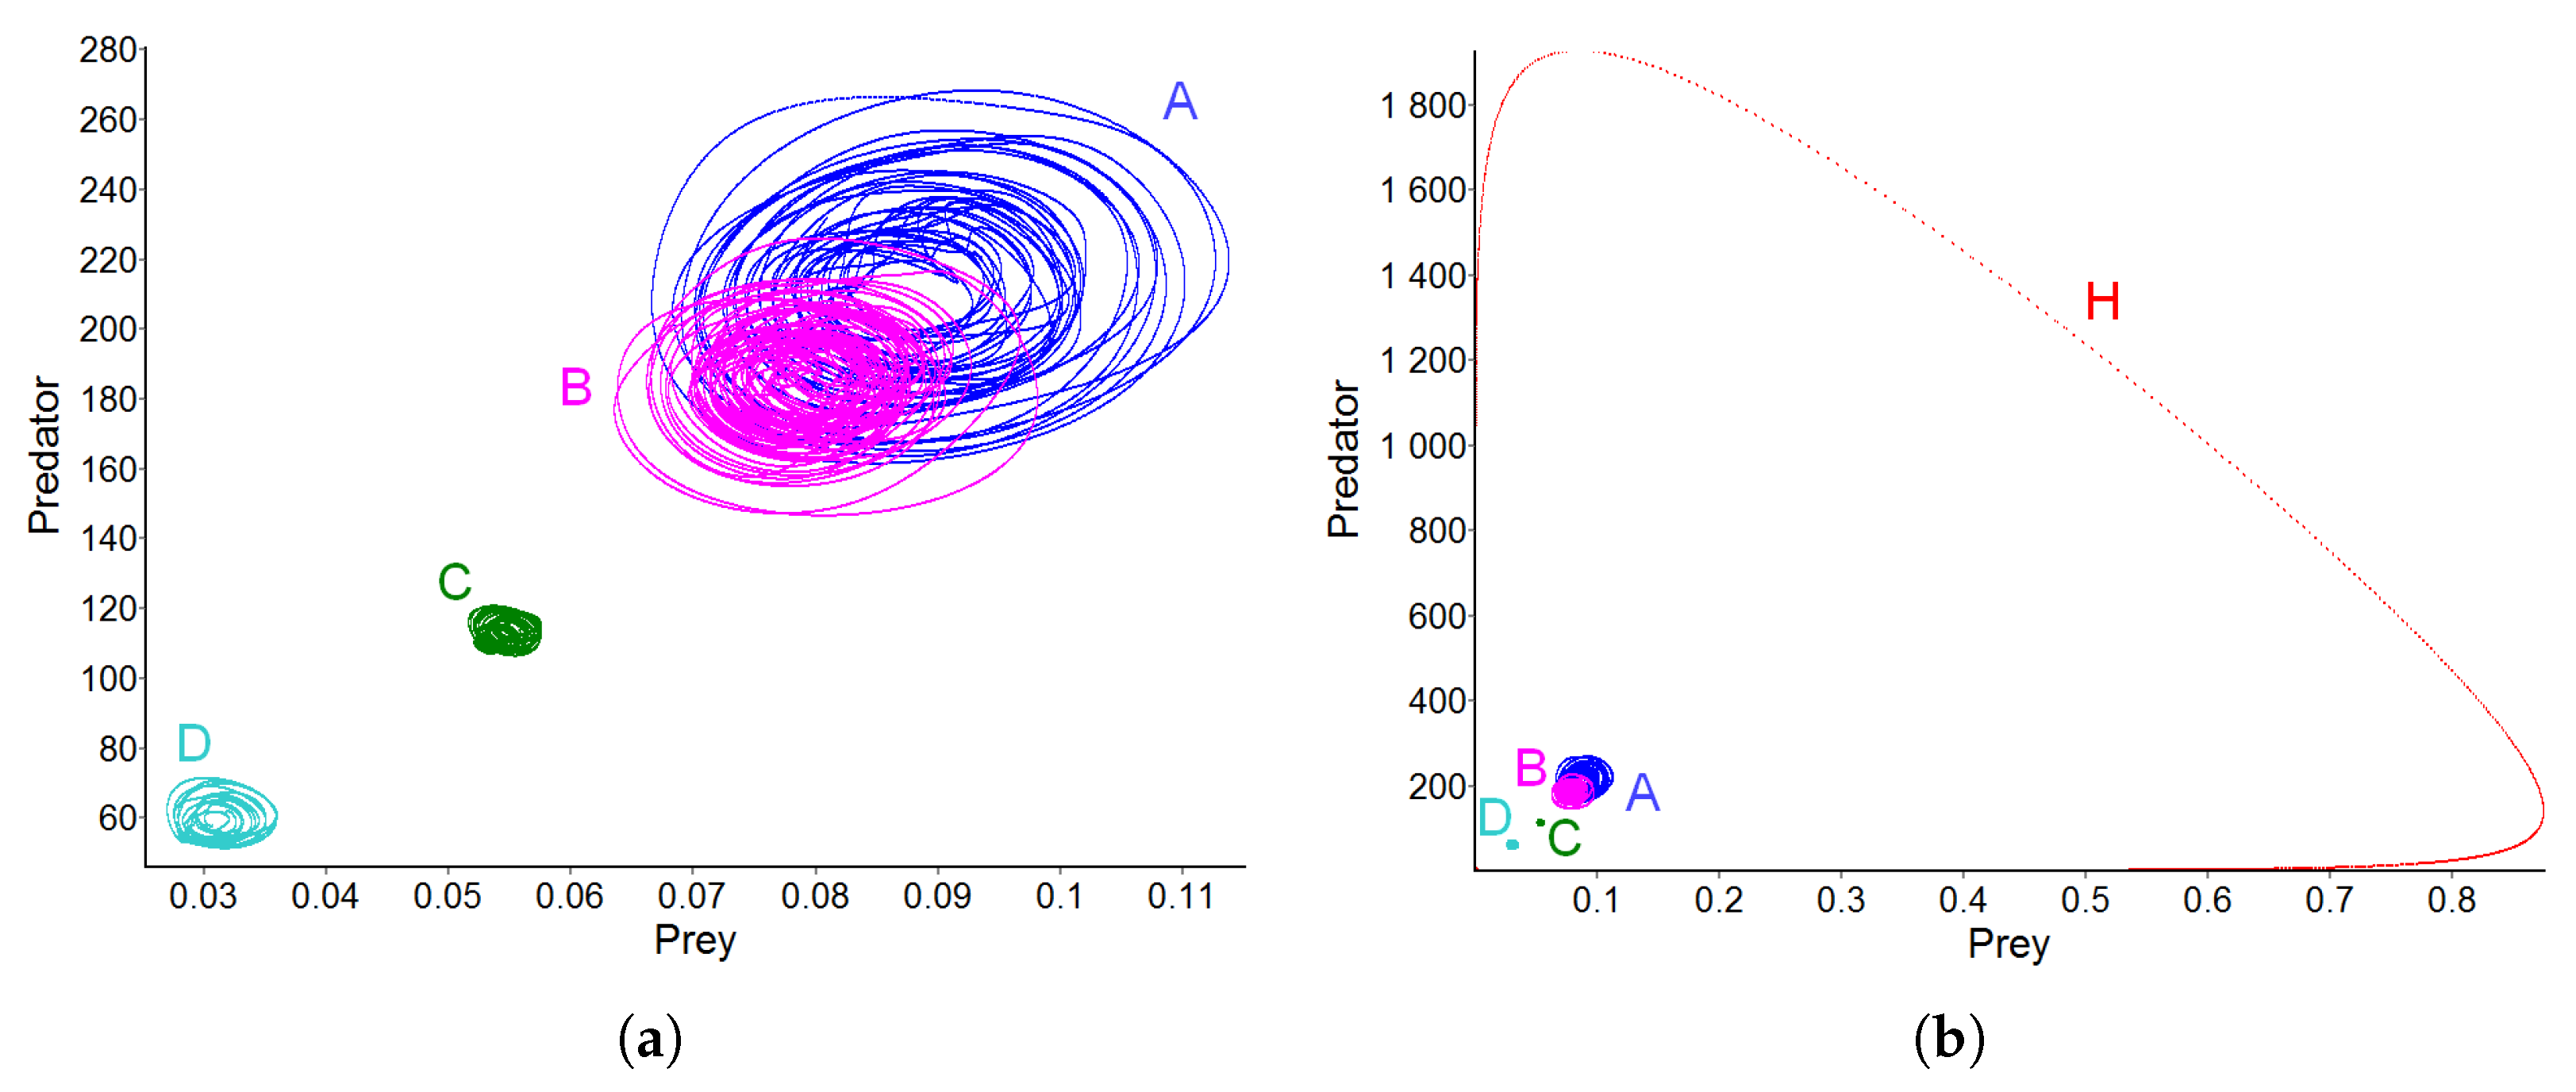
Mutual interference of predators is another phenomenon that emerges at the population level in large-scale trophic systems with spatially heterogeneous dynamics induced by prey-taxis [9,61,62,63,64]. It was demonstrated in [9,61] that although local interactions of prey and predator species in System (7) are described with prey-dependent trophic function g = g ( N ) , at large spatiotemporal scale, the model demonstrates properties typical for predator-dependent models. In this context, it is interesting to see how the demo-genetic Models (1), (3), (4) respond to variation in prey productivity in the modeled predator–prey system. Figure 12 presents phase trajectories corresponding to dynamics that stabilize in simulations with spatial patterns A, B, C, and D.
The applied patterns imitate different degrees of deterioration of the habitat, directly affecting the overall primary production of the system, which is highest in case of pattern A and lowest with pattern D. Figure 12a suggests that, averaged over space and time, densities of prey and predator populations change almost proportionally, responding to changes of habitat pattern. Such a response to enrichment (increase in primary production) is typical for non-spatial predator–prey models with a ratio-dependent trophic function—the simplest form of predator-dependent model that allows us to account for predator interference in predator–prey systems [62,64,65]. This result gives us one more mechanistic justification of the predator interference, prey and ratio dependence, based on spatiotemporal heterogeneity induced by the prey-taxis model. Presented in Figure 12a, results obtained with patterns A, B, C, and D can be interpreted differently in terms of predator adaption to variation in prey production through modifying spatial behavior. We see that the proportion of mobile predators capable of more active spatial activity increases with an increase in the overall prey production. With that, adapting their spatial activity, predators maintain a nearly constant ratio of prey to predator averaged densities.
Figure 12b displays the same trajectories as Figure 12a, overlaying them with the large-amplitude spatially homogeneous cycle H, which is similar to the homogeneous cycle that is a global attractor in the non-spatial RMA model without the Allee effect in predator growth ( θ = 0 ) . In classical predation theory, the homogeneous cycle serves as an illustration of the paradoxical instability of the RMA model induced by enrichment [36,66] or by the inability of the predator to control the growth of the prey population in prey-dependent models [67,68,69]. Simulations with spatial Models (1), (3), (4) give more realistic dynamic patterns; homogeneous cycle H is unstable, amplitudes of fluctuations are small, and the predator perfectly controls the prey population with all considered habitat patterns.
Thus, on the one hand, prey-taxis movements of predators stabilize the dynamics of spatially explicit Model (7); on the other hand, they cause the emergence of predator dependence at the population level, and it is no coincidence that replacement of the Holling type II functional response with a predator-dependent trophic function g = g ( N , P ) stabilizes the dynamics of the RMA model. In fact, the use of predator dependence provides a modeler with the possibility to implicitly account for various spatial effects in a non-spatial (point) model. This leads us to another issue relating to selection of the consumer mobility, but with non-adaptive selection acting at the level of the ecosystem [70]. According to the hypothesis of non-adaptive selection, trophic systems demonstrating large-amplitude fluctuations like cycle H in Figure 12b have an extremely high risk of extinction and can hardly be observed in nature. Such evolutionarily disadvantageous ecosystems should be replaced, due to both natural and non-adaptive selection, by more advantageous systems that include actively moving predators. Indirectly confirming this hypothetical scenario, the historical records of Phanerozoic evolutionary changes in taxa diversity presented by Bambach et al. [1] indicate a trend of stepwise increase in the proportion of motile predatory genera. Interestingly, some perturbations of the Earth’s ecosystem associated with mass extinctions gave a temporal advantage to passive taxa.
Additional simulations performed with Models (1), (3), (4) showed that despite the relatively small value of the Allee coefficient θ in the predator’s growth term, the Allee effect plays an important role in the evolution of the genetic structure of the predator population. Removing the Allee effect noticeably slows down the selection process. This observation is expected; the extinction of a maladapted genotype should accelerate the evolution, forcing the natural selection of traits that increase fitness. Notice, however, that the original Kostitzin model [29,30,31] does not include the Allee effect; it describes genotype competition in the spatially homogeneous case, and thus ignores gene fluxes caused by animal dispersal. Another interesting effect observed in our study is the so-called ‘gene surfing’ phenomenon that facilitates the dispersal of mutations arising in the wave front of an expanding invader population [71,72,73]. In all cases considered in the presented numerical experiments, including simulations with perceptibly deteriorated habitats, ‘mobile’ allele m wins during the initial phase of SPW propagation (Figure 3d, Figure 8b, Figure 9d and Figure 10b), due to the existence of patches with relatively high prey density that provide resources sufficient for predator reproduction. Combining Figure 3b with Figure 3c gives one more character feature of the spatial spread of the mobility gene, consisting in the fact that the wave of ‘mobile’ allele m passes ahead of the wave front of the genotype density m m . Thus, our results are in line with experimental, theoretical, and modelling outcomes demonstrating the importance of the Allee effect in promoting diversity in travelling waves of colonization and enhancing adaptation towards a range expansion phenotype [72,73,74]. We noticed also that in the presence of heterozygotic predators P m s , the stabilized regime is not stationary, and selection of the predator motility ability is not unidirectional. An exhausted prey population, represented by small weakly connected patches of low density, turns the selection process towards an increase in the proportion of the ‘settled’ predator genotypes.

5. Conclusions

We conclude with emphasizing the theoretical and applied efficiency of the demo-genetic approach, which allows us to combine models of the spatiotemporal dynamics of biological communities with the description of the genetic structure of interacting populations. Such models are a direct extension of classical population models, providing researchers with the possibility to reveal complex interrelations between population dynamics, natural selection, and micro-evolution. Operating with densities of genotypes [29,30,31], demo-genetic models can be helpful in studying the spread of genes and selection of a trait on a shifting adaptive landscape, adequately reproducing all specific modes of trait evolution: stasis, gradual change, and random walk [75]. In the presented research, the genetic structure of a diploid predator population was added into a prey-taxis predator–prey model that was earlier studied in [10,12,33,34,35]. For simplicity, we assumed that genotypes differ only by their ability to perform spatial movements, but acceptance of more complicated hypotheses about the genotype differences is also possible. Furthermore, despite its ability to generate complex spatiotemporal dynamics, the model is deterministic. Further developments of the model can include the incorporation of external random perturbations that cause local population extinction and/or habitat degradation, which will allow an ecological risk assessment. An interesting perspective would be combining the demo-genetic approach with alternative frameworks, including the adaptive dynamics theory [2,3], evolutionary game-theoretic setting [8], and stochastic ecological networks [7]. In particular, a top predator can be added to the system, the movements and demography of which are described by the stochastic algorithms of an agent-based model. While further extensions and investigations of the proposed demo-genetic model are challenging problems for future studies, the presented results of simulations with different patterns of habitat degradation have already led us to some interesting and stimulating outcomes about the role of spatial heterogeneity in the development of the predator ability to perform prey-taxis movements.

Funding

This research was funded by the State Allocation to the Southern Scientific Center of the Russian Academy of Sciences (SSC RAS) for 2023 on theme No. 122013100131-9.

Data Availability Statement

Not applicable.

Acknowledgments

The author is grateful to Efim Ya. Frisman and Oksana L. Zhdanova for inviting the manuscript, and to the two referees for their constructive comments and suggestions, which significantly contributed to improving the quality of the paper.

Conflicts of Interest

The author declares no conflict of interest.

Abbreviations

The following abbreviations are used in this manuscript:
RMARosenzweig–MacArthur
PDEPartial Differential Equation
ODEOrdinary Differential Equation
SPWSolitary Population Wave

References

  1. Bambach, R.K.; Knoll, A.H.; Sepkoski, J.J. Anatomical and ecological constraints on Phanerozoic animal diversity in the marine realm. Proc. Natl. Acad. Sci. USA 2002, 99, 6854–6859. [Google Scholar] [CrossRef] [PubMed]
  2. Geritz, S.A.H.; Metz, J.A.J.; Kisdi, E.; Meszena, G. Dynamics of adaptation and evolutionary branching. Phys. Rev. Lett. 1997, 78, 2024–2027. [Google Scholar] [CrossRef] [Green Version]
  3. Mathias, A.; Kisdi, E.; Olivieri, I. Divergent evolution of dispersal in a heterogeneous landscape. Evolution 2001, 55, 246–259. [Google Scholar] [CrossRef] [PubMed]
  4. Cosner, C. Reaction-diffusion-advection models for the effects and evolution of dispersal. Discret. Contin. Dyn. Syst. 2014, 34, 1701–1745. [Google Scholar] [CrossRef]
  5. Baguette, M.; Legrand, D.; Fréville, H.; Van Dyck, H.; Ducatez, S. Evolutionary ecology of dispersal in fragmented landscape. In Dispersal Ecology and Evolution; Clobert, J., Baguette, M., Benton, T.G., Bullock, J.M., Eds.; Oxford Academic: Oxford, UK, 2012; pp. 380–391. [Google Scholar] [CrossRef]
  6. Cheptou, P.-O.; Hargreaves, A.L.; Bonte, D.; Jacquemyn, H. Adaptation to fragmentation: Evolutionary dynamics driven by human influences. Phil. Trans. R. Soc. B 2017, 372, 20160037. [Google Scholar] [CrossRef] [Green Version]
  7. Dragicevic, A.; Gurtoo, A. Stochastic control of ecological networks. J. Math. Biol. 2022, 85, 7. [Google Scholar] [CrossRef]
  8. Lehtonen, J.; Otsuka, J. Evolutionary game theory of continuous traits from a causal perspective. Phil. Trans. R. Soc. 2023, 378, 20210507. [Google Scholar] [CrossRef]
  9. Arditi, R.; Tyutyunov, Y.; Morgulis, A.; Govorukhin, V.; Senina, I. Directed movement of predators and the emergence of density-dependence in predator-prey models. Theor. Popul. Biol. 2001, 59, 207–221. [Google Scholar] [CrossRef] [Green Version]
  10. Sapoukhina, N.; Tyutyunov, Y.; Arditi, R. The role of prey-taxis in biological control: A spatial theoretical model. Am. Nat. 2003, 162, 61–76. [Google Scholar] [CrossRef] [Green Version]
  11. Tyutyunov, Y.V.; Kovalev, O.V.; Titova, L.I. Spatial demogenetic model for studying phenomena observed upon introduction of the ragweed leaf beetle in the south of Russia. Math. Model. Nat. Phenom. 2013, 8, 80–95. [Google Scholar] [CrossRef] [Green Version]
  12. Tyutyunov, Y.V.; Sen, D.; Titova, L.I.; Banerjee, M. Predator overcomes the Allee effect due to indirect prey–taxis. Ecol. Complex. 2019, 39, 100772. [Google Scholar] [CrossRef]
  13. Tyutyunov, Y.V.; Zagrebneva, A.D.; Azovsky, A.I. Spatiotemporal pattern formation in a prey-predator system: The case study of short-term interactions between diatom microalgae and microcrustaceans. Mathematics 2020, 8, 1065. [Google Scholar] [CrossRef]
  14. Ha, D.; Tsybulin, V.; Zelenchuk, P. How to model the local interaction in the predator–prey system at slow diffusion in a heterogeneous environment? Ecol. Complex. 2022, 52, 101026. [Google Scholar] [CrossRef]
  15. Morgulis, A. Waves in a hyperbolic predator–prey system. Axioms 2022, 11, 187. [Google Scholar] [CrossRef]
  16. Ahmed, D.A.; Hudgins, E.J.; Cuthbert, R.N.; Kourantidou, M.; Diagne, C.; Haubrock, P.J.; Leung, B.; Liu, C.; Leroy, B.; Petrovskii, S.; et al. Managing biological invasions: The cost of inaction. Biol. Invasions 2022, 24, 1927–1946. [Google Scholar] [CrossRef]
  17. Sen, D.; Ghorai, S.; Banerjee, M.; Morozov, A. Bifurcation analysis of the predator–prey model with the Allee effect in the predator. J. Math. Biol. 2022, 84, 7. [Google Scholar] [CrossRef]
  18. Han, R.; Dey, S.; Banerjee, M. Spatio-temporal pattern selection in a prey-predator model with hunting cooperation and Allee effect in prey. Chaos Solitons Fractals 2023, 171, 113441. [Google Scholar] [CrossRef]
  19. Chowdhury, P.R.; Petrovskii, S.; Volpert, V.; Banerjee, M. Attractors and long transients in a spatio-temporal slow–fast Bazykin’s model. Commun. Nonlinear Sci. Numer. Simul. 2023, 118, 107014. [Google Scholar] [CrossRef]
  20. Ginzburg, L.R. Theory of Natural Selection and Population Growth; Benjamin/Cummings: Menlo Park, CA, USA, 1983; 160p. [Google Scholar]
  21. Hastings, A. Population Biology: Concepts and Models; Springer Science & Business Media: New York, NY, USA, 2013; 220p. [Google Scholar]
  22. Svirezhev, Y.M.; Passekov, V.P. Fundamentals of Mathematical Evolutionary Genetics; Kluwer Acad. Publ.: Dordrecht, The Netherlands, 2011; 412p. [Google Scholar]
  23. Nonaka, E.; Svanbäck, R.; Thibert-Plante, X.; Englund, G.; Brännström, Å. Mechanisms by which phenotypic plasticity affects adaptive divergence and ecological speciation. Am. Nat. 2015, 186, E126–E143. [Google Scholar] [CrossRef]
  24. Patel, S.; Schreiber, S.J. Evolutionarily driven shifts in communities with intraguild predation. Am. Nat. 2015, 186, E98–E110. [Google Scholar] [CrossRef] [Green Version]
  25. Goodsman, D.W.; Cooke, B.; Coltman, D.W.; Lewis, M.A. The genetic signature of rapid range expansions: How dispersal, growth and invasion speed impact heterozygosity and allele surfing. Theor. Popul. Biol. 2014, 98, 1–10. [Google Scholar] [CrossRef] [PubMed]
  26. Nathan, L.R.; Kanno, Y.; Vokoun, J.C. Population demographics influence genetic responses to fragmentation: A demogenetic assessment of the ‘one migrant per generation’ rule of thumb. Biol. Conserv. 2017, 210, 261–272. [Google Scholar] [CrossRef]
  27. Zhdanova, O.; Frisman, E. Alternative attractors in an ecological-genetic model of populations with non-overlapping generations. Ecol. Conplex. 2017, 31, 135–143. [Google Scholar] [CrossRef]
  28. Il’ichev, V.G.; Il’icheva, O.A. Spatial adaptation of populations in ecological models. Biophysics 2018, 63, 274–281. [Google Scholar] [CrossRef]
  29. Kostitzin, V.A. Sur les équations diffèrentielles du problè me de la sélection mendélienne. Comptes rendus de l’Académie des Sciences 1936, 203, 156–157. [Google Scholar]
  30. Kostitzin, V.A. Biologie Mathématique; Librairie Armand Colin: Paris, France, 1937; 223p. [Google Scholar]
  31. Kostitzin, V.A. Equations diffèrentielles générales du problème de sélection naturelle. CR Acad. Sci. 1938, 206, 570–572. [Google Scholar]
  32. Kostitzin, V.A. Sur les coefficients mendeliens d’hérédité. Comptes Rendus De L’acad. Des. Sci. 1938, 206, 883–885. [Google Scholar]
  33. Tyutyunov, Y.V.; Sapoukhina, N.Y.; Senina, I.N.; Arditi, R. Explicit model for searching behavior of predator. Zhurnal Obs. Biol. 2002, 63, 137–148. (In Russian) [Google Scholar]
  34. Tyutyunov, Y.V.; Sapoukhina, N.Y.; Senina, I.N.; Arditi, R. Taxis as a factor stabilizing trophic system. In Surveys of Applied and Industrial Mathematics; (Series “Mathematical Methods in Ecology”); Scientific Publisher “TVP”: Moscow, Russia, 2005; Volume 12, pp. 810–814. (In Russian) [Google Scholar]
  35. Tyutyunov, Y.V.; Titova, L.I.; Senina, I.N. Prey-taxis destabilizes homogeneous stationary state in spatial Gause–Kolmogorov-type model for predator-prey system. Ecol. Complex. 2017, 31, 170–180. [Google Scholar] [CrossRef]
  36. Rosenzweig, M.L.; MacArthur, R.H. Graphical representation and stability conditions of predator-prey interactions. Am. Nat. 1963, 97, 209–223. [Google Scholar] [CrossRef]
  37. Allee, W. Animal Aggregations: A Study in General Sociology; Chicago University Press: Chicago, IL, USA, 1931; 431p. [Google Scholar]
  38. Stephens, P.A.; Sutherland, W.J. Consequences of the Allee effect for behaviour, ecology and conservation. Trends Ecol. Evol. 1999, 14, 401–405. [Google Scholar] [CrossRef]
  39. Zhou, S.-R.; Liu, Y.-F.; Wang, G. The stability of predator-prey systems subject to the Allee effect. Theor. Popul. Biol. 2005, 67, 23–31. [Google Scholar] [CrossRef] [PubMed]
  40. Tourniaire, R.; Ferran, A.; Giuge, L.; Piotte, C.; Gambier, J. A natural flightless mutation in the ladybird. Harmon. Axyridis. Entomol. Exp. Appl. 2000, 96, 33–38. [Google Scholar] [CrossRef]
  41. Facon, B.; Crespin, L.; Loiseau, A.; Lombaert, E.; Magro, A.; Estoup, A. Can things get worse when an invasive species hybridizes? The harlequin ladybird Harmonia axyridis in France as a case study. Evol. Appl. 2011, 4, 71–88. [Google Scholar] [CrossRef]
  42. Kovalev, O.V. Spread of adventive plants of Ambrosieae tribe in Eurasia and methods of bilogical control of Ambrosia L. (Asteraceae). In Theoretical Principles of Biological Control of the Common Ragweed, Proceedings of the Zoological Institute; Kovalev, O.V., Belokobylsky, S.A., Eds.; “Nauka” Publishing House, Leningrad Branch: Leningrad, Russia, 1989; Volume 189, pp. 7–23. (In Russian) [Google Scholar]
  43. Kovalev, O.V. The solitary population wave, a physical phenomenon accompanying the introduction of a chrysomelid. In New Developments in the Biology of Chrysomelidae; Jolivet, P., Ed.; SPB Academic Publishing bv: The Hague, The Netherlands, 2004; pp. 91–601. [Google Scholar]
  44. Kovalev, O.V.; Tyutyunov, Y.V.; Arkhipova, O.E.; Kachalina, N.A.; Iljina, L.P.; Titova, L.I. On assessment of the large-scale effect of introduction of the ragweed leaf beetle Zygogramma suturalis F. (Coleoptera, Chrysomelidae) Phytocenoses South Russia. Entomol. Rev. 2015, 95, 1–14. [Google Scholar] [CrossRef]
  45. Kovalev, O.V. Microevolutional processes in population of Zygogramma suturalis F. (Coleoptera, Chrisomelidae) introduced from Nort America to the USSR. In Theoretical Principles of Biological Control of the Common Ragweed, Proceedings of the Zoological Institute; Kovalev, O.V., Belokobylsky, S.A., Eds.; “Nauka” Publishing House, Leningrad Branch: Leningrad, Russia, 1989; Volume 189, pp. 139–165. (In Russian) [Google Scholar]
  46. Hastings, A.; Byers, J.E.; Crooks, J.A.; Cuddington, K.; Jones, C.G.; Lambrinos, J.G.; Talley, T.S.; Wilson, W.G. Ecosystem engineering in space and time. Ecol. Lett. 2007, 10, 153–164. [Google Scholar] [CrossRef]
  47. Tyutyunov, Y.V.; Titova, L.I.; Arditi, R. A minimal model of pursuit-evasion in a predator–prey system. Math. Model. Nat. Phenom. 2007, 2, 122–738. [Google Scholar] [CrossRef]
  48. Morgulis, A.; Ilin, K. Indirect taxis on a fluctuating environment. Mathematics 2020, 8, 2052. [Google Scholar] [CrossRef]
  49. Schuster, F.L.; Levandowsky, M. Chemosensory responses of Acanthamoeba castellanii: Visual Analysis of Random Movement and Responses to Chemical Signals. J. Eukaryot. Microbiol. 1996, 43, 150–158. [Google Scholar] [CrossRef]
  50. Hoefler, C.D.; Taylor, M.; Jakob, E.M. Chemosensory response to prey in Phidippus audax (Araneae, Salticidae) Pardosa milvina (Araneae, Lycosidae). J. Arachnol. 2002, 30, 155–158. [Google Scholar] [CrossRef]
  51. Gardiner, J.M.; Atema, J. The function of bilateral odor arrival time differences in olfactory orientation of sharks. Curr. Biol. 2010, 20, 1187–1191. [Google Scholar] [CrossRef] [Green Version]
  52. Tyutyunov, Y.V.; Titova, L.I. Simple models for studying complex spatiotemporal patterns of animal behavior. Deep Sea Res. Part II Top. Stud. Oceanogr. 2017, 140, 193–202. [Google Scholar] [CrossRef]
  53. Senina, I.; Lehodey, P.; Sibert, J.; Hampton, J. Integrating tagging and fisheries data into a spatial population dynamics model to improve its predictive skills. Can. J. Fish. Aquat. Sci. 2019, 77, 576–593. [Google Scholar] [CrossRef] [Green Version]
  54. Ferrari, M.C.; Wisenden, B.D.; Chivers, D.P. Chemical ecology of predator-prey interactions in aquatic ecosystems: A review and prospectus. Canad. J. Zool. 2010, 33, 698–724. [Google Scholar] [CrossRef]
  55. Travis, J.M.J.; Dytham, C. Habitat persistence, habitat availability and the evolution of dispersal. Proc. R. Soc. B Biol. Sci. 1999, 266, 723–728. [Google Scholar] [CrossRef]
  56. Petrovskii, S.V.; Malchow, H. A minimal model of pattern formation in a prey-predator system. Math. Comput. Model. 1999, 29, 49–63. [Google Scholar] [CrossRef]
  57. Petrovskii, S.V.; Malchow, H. Wave of chaos: New mechanism of pattern formation in spatio-temporal population dynamics. Theor. Popul. Biol. 2001, 59, 157–174. [Google Scholar] [CrossRef] [Green Version]
  58. Banerjee, M. Turing and non-Turing patterns in two-dimensional prey-predator models. In Applications of Chaos and Nonlinear Dynamics in Science and Engineering—Volume 4. Understanding Complex Systems; Banerjee, S., Rondoni, L., Eds.; Springer: Cham, Switzerland, 2015; pp. 257–280. [Google Scholar] [CrossRef]
  59. Mukherjee, N.; Ghorai, S.; Banerjee, M. Cross-diffusion induced Turing and non-Turing patterns in Rosenzweig–MacArthur model. Lett. Biomath. 2019, 6, 1–22. [Google Scholar] [CrossRef]
  60. Tyutyunov, Y.V.; Zagrebneva, A.D.; Surkov, F.A.; Azovsky, A.I. Derivation of density flux equation for intermittently migrating population. Oceanology 2010, 50, 67–76. [Google Scholar] [CrossRef]
  61. Tyutyunov, Y.; Titova, L.; Arditi, R. Predator interference emerging from trophotaxis in predator-prey systems: An individual-based approach. Ecol. Complex. 2008, 5, 48–58. [Google Scholar] [CrossRef]
  62. Arditi, R.; Ginzburg, L. How Species Interact. Altering the Standard View on Trophic Ecology; Oxford University Press: Oxford, UK; New York, NY, USA, 2012; 170p. [Google Scholar]
  63. Tyutyunov, Y.V.; Titova, L.I.; Berdnikov, S.V. A mechanistic model for interference and Allee effect in the predator population. Biophysics 2013, 58, 258–264. [Google Scholar] [CrossRef]
  64. Tyutyunov, Y.V.; Titova, L.I. Ratio-dependence in predator-prey systems as an edge and basic minimal model of predator interference. Front. Ecol. Evol. 2021, 9, 725041. [Google Scholar] [CrossRef]
  65. Arditi, R.; Ginzburg, L.R. Coupling in predator-prey dynamics: Ratio-dependence. J. Theor. Biol. 1989, 139, 311–326. [Google Scholar] [CrossRef]
  66. Rosenzweig, M.L. Paradox of enrichment: Destabilization of exploitation ecosystem in ecological time. Science 1971, 171, 385–387. [Google Scholar] [CrossRef]
  67. Luck, R.F. Evaluation of natural enemies for biological control: A behavioral approach. Trends Ecol. Evol. 1990, 5, 196–199. [Google Scholar] [CrossRef]
  68. Arditi, R.; Berryman, A.A. The biological control paradox. Trends Ecol. Evol. 1991, 6, 32. [Google Scholar] [CrossRef]
  69. Berryman, A. The theoretical foundations of biological control. In Theoretical Approaches to Biological Control; Hawkins, B., Cornell, H.V., Eds.; Cambridge University Press: Cambridge, UK, 1999; pp. 3–21. [Google Scholar]
  70. Borrelli, J.J.; Allesina, S.; Amarasekare, P.; Arditi, R.; Chase, I.; Damuth, J.; Holt, R.D.; Logofet, D.O.; Novak, M.; Rohr, R.P.; et al. Selection on stability across ecological scales. Trends Ecol. Evol. 2015, 30, 417–425. [Google Scholar] [CrossRef] [Green Version]
  71. Edmonds, C.A.; Lillie, A.S.; Cavalli-Sforza, L.L. Mutations arising in the wave front of an expanding population. Proc. Natl. Acad. Sci. USA 2004, 101, 975–979. [Google Scholar] [CrossRef]
  72. Hallatschek, O.; Nelson, D.R. Gene surfing in expanding populations. Theor. Popul. Biol. 2008, 73, 158–170. [Google Scholar] [CrossRef] [Green Version]
  73. Lehe, R.; Hallatschek, O.; Peliti, L. The rate of beneficial mutations surfing on the wave of a range expansion. PLoS Comput. Biol. 2012, 8, e1002447. [Google Scholar] [CrossRef] [Green Version]
  74. Roques, L.; Garnier, J.; Hamel, F.; Klein, E.K. Allee effect promotes diversity in traveling waves of colonization. Proc. Natl. Acad. Sci. USA 2012, 109, 8828–8833. [Google Scholar] [CrossRef] [PubMed]
  75. Hunt, G.; Rabosky, D.L. Phenotypic evolution in fossil species: Pattern and process. Annu. Rev. Earth Planet Sci. 2014, 42, 421–441. [Google Scholar] [CrossRef]
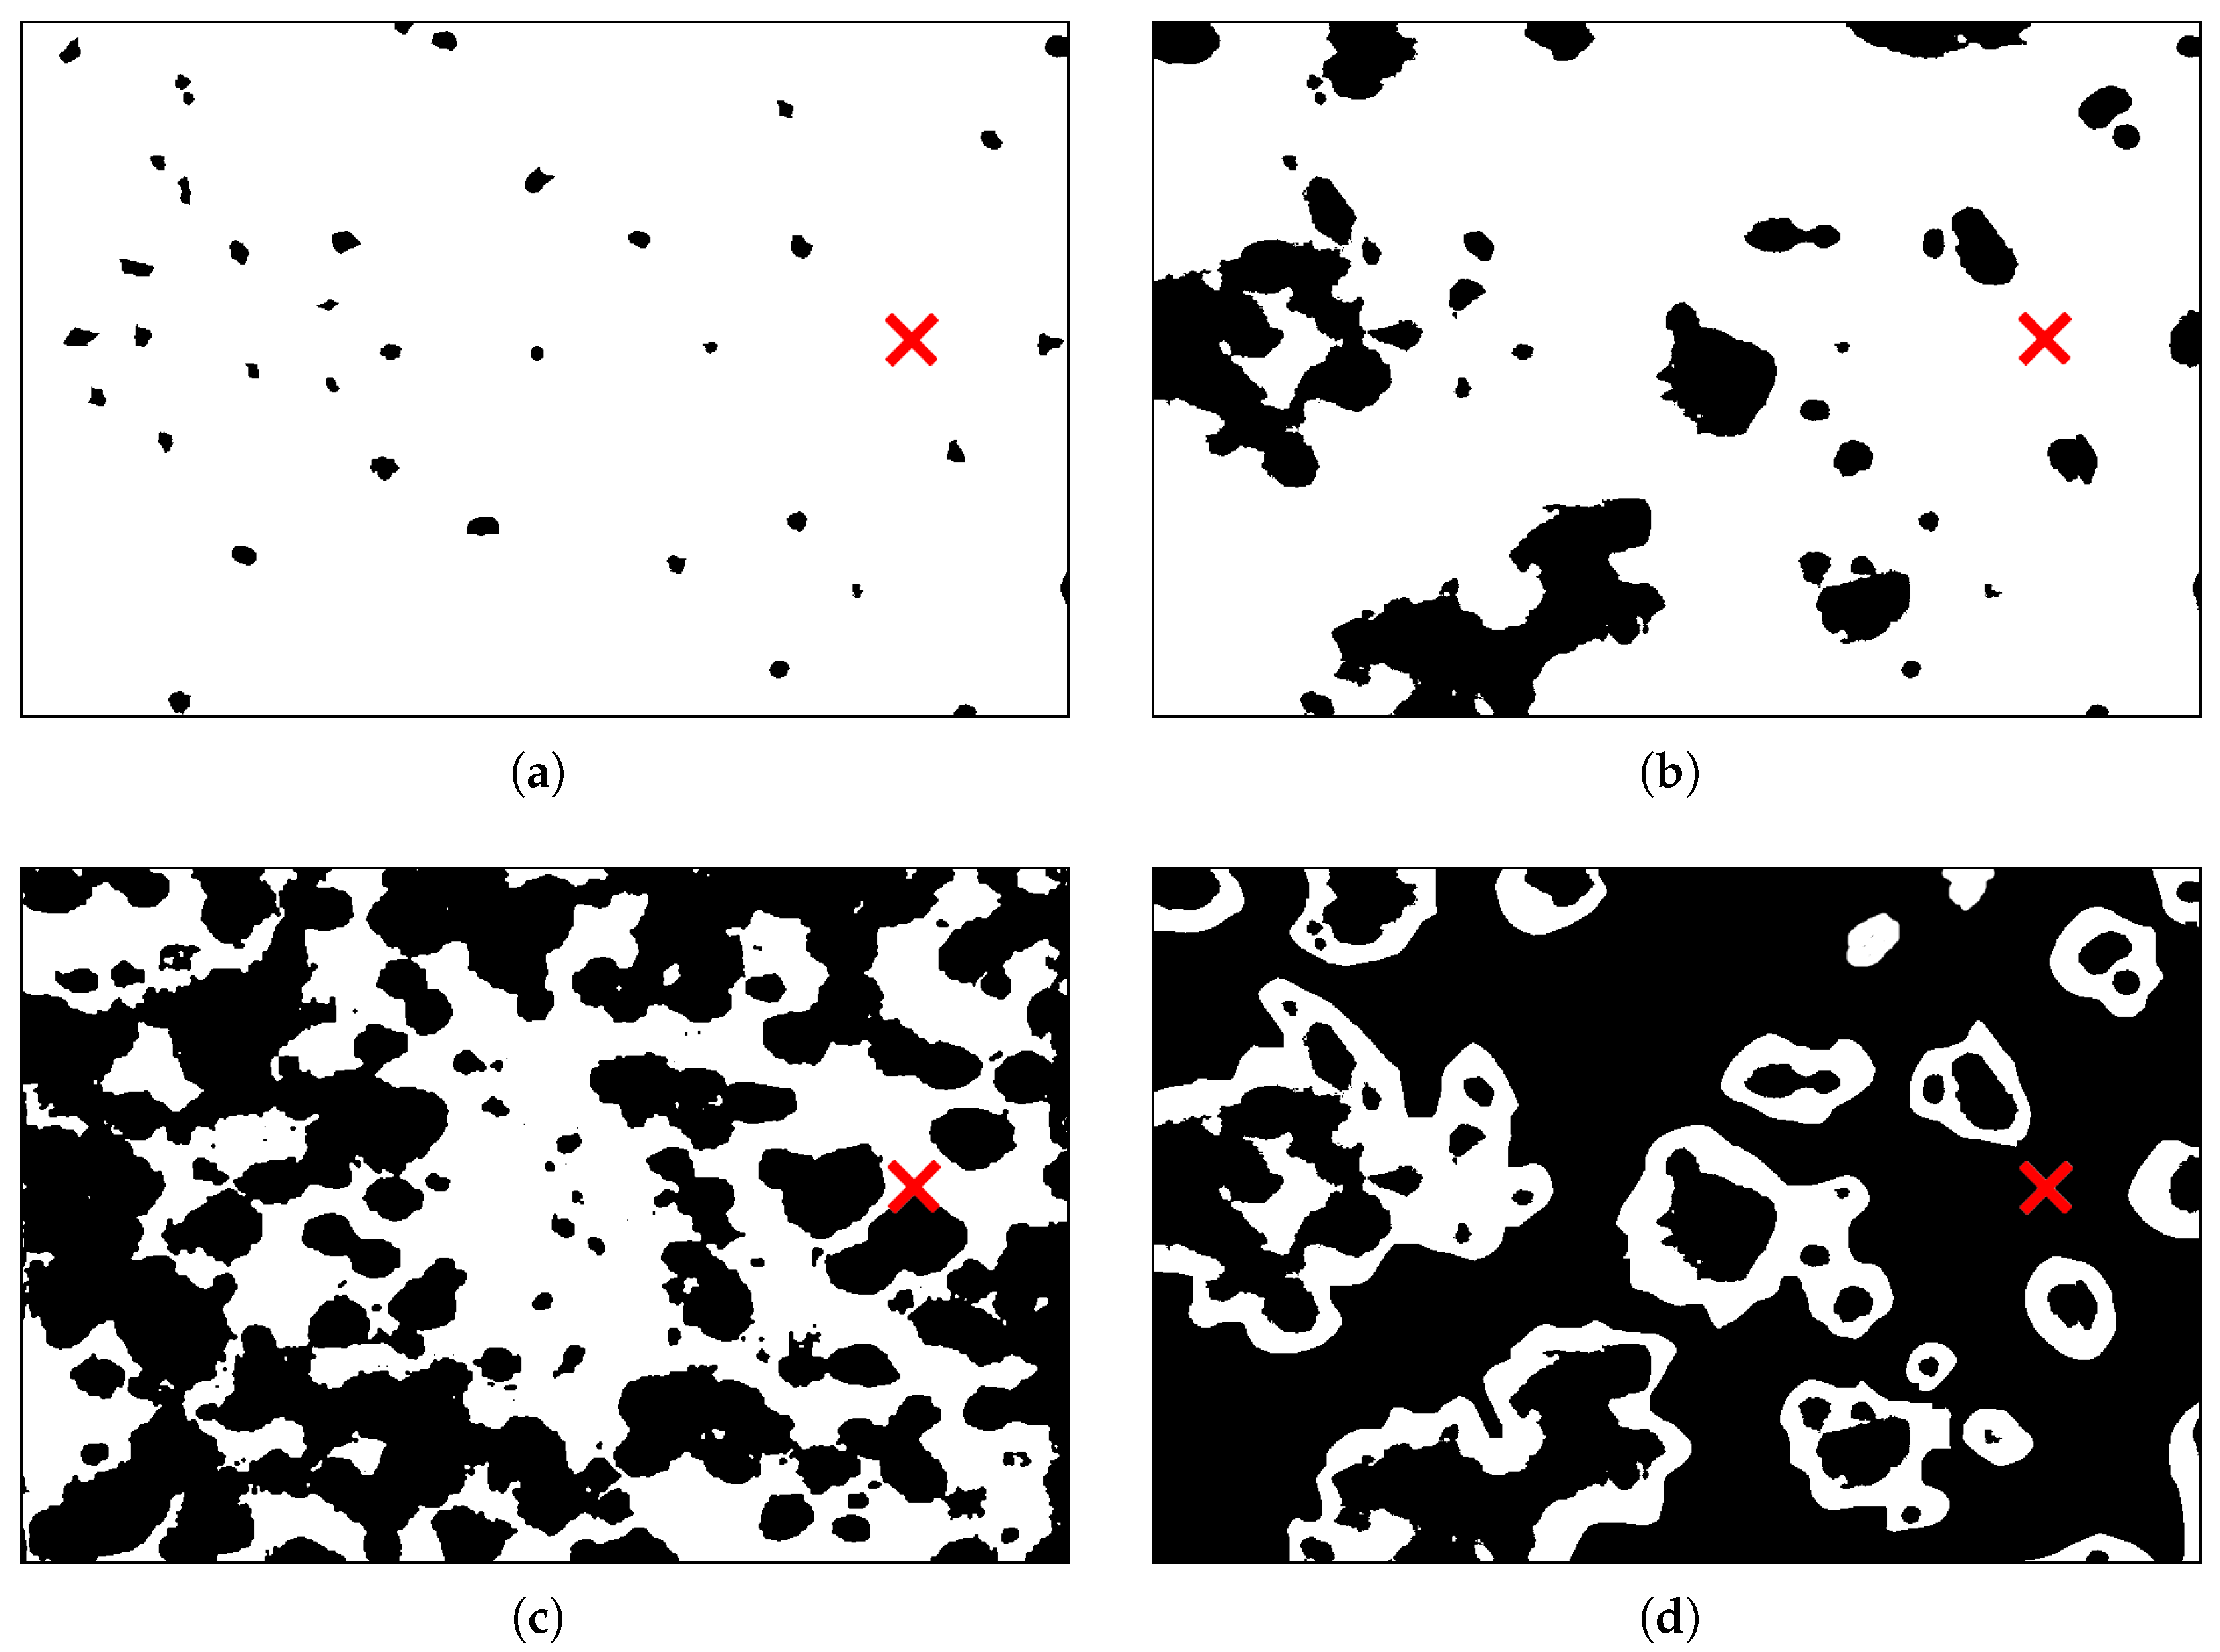
Figure 1. Spatial patterns of rectangular domain Ω = L x × L y used in simulations. Prey do not reproduce ( r ( x ) = 0 ) in black areas. The cross marks point to the predator invasion in simulations. (a) Pattern A, 95.57% suitable for prey growth. (b) Pattern B, 84.21% suitable for prey growth. (c) Pattern C, 47.20% suitable for prey growth. (d) Pattern D, 23.59% suitable for prey growth.
Mathematics 11 03378 g001
Figure 2. Spatial distribution of prey and predator genotype densities at t = 400 . (a) Prey. (b) Predator ‘mobile’ genotype m m . (c) Predator ‘settled’ heterozygous genotype m s . (d) Predator ‘settled’ homozygous genotype s s .
Mathematics 11 03378 g002
Figure 3. Model snapshot at t = 1000 , showing solitary waves of spatially propagating predator density and mobile allele m. (a) Prey distribution. (b) SPW of predator ‘mobile’ genotype m m . (c) Frequency of the ‘mobile’ allele m. (d) Evolution of the averaged allele frequencies.
Mathematics 11 03378 g003
Figure 4. Model snapshot at t = 7000 for spatial pattern A. (a) Prey distribution. (b) Predator ‘mobile’ genotype m m . (c) Time plot of spatially averaged variables. (d) Evolution of the averaged allele frequencies.
Mathematics 11 03378 g004
Figure 5. Projection of the phase trajectory onto the plane of spatially averaged population densities in simulation with spatial pattern A. (a) Transient process. (b) Stabilized dynamics.
Mathematics 11 03378 g005
Figure 6. Model snapshot at t = 35,000 in simulation with spatial pattern B. (a) Distribution of the ‘mobile’ genotype P m m . (b) Distribution of the ‘settled’ genotype P s s . (c) Distribution of the prey N. (d) Phase trajectory of stabilized dynamics.
Mathematics 11 03378 g006
Figure 7. Spatial distributions of the allele frequencies at t = 70,000 for spatial pattern B. (a) ‘Mobile’ allele, n m . (b) ‘Settled’ allele, n s .
Mathematics 11 03378 g007
Figure 8. Time plots of long-time simulation with pattern B, demonstrating convergence of the predator–prey system to inhomogeneous dynamics with heterogenetic predator population. (a) Spatially averaged model variables. (b) Spatially averaged allele frequencies.
Mathematics 11 03378 g008
Figure 9. Model snapshot at t = 70,000 in simulation with spatial pattern C. (a) Distribution of the mobile allele n m . (b) Distribution of the settled allele n s . (c) Spatially averaged variables. (d) Spatially averaged allele frequencies.
Mathematics 11 03378 g009
Figure 10. Time plots of spatially averaged variables and allele frequencies obtained in long-time simulation with strongly deteriorated pattern D. Settled genotypes win in competition with more actively moving consumers. (a) Spatially averaged model variables. (b) Spatially averaged allele frequencies.
Mathematics 11 03378 g010
Figure 11. Model snapshot at t = 260,000 in simulation with purely diffusive dominant ‘settled’ allele s and low initial density of predator carrying the recessive gene m enabling prey-taxis behaviour of the ‘mobile’ genotype P m m . (a) Time plot of spatially averaged densities. (b) Spatially averaged allele frequencies. (c) Distribution of the mobile genotype P m m . (d) Phase trajectory of stabilized dynamics.
Mathematics 11 03378 g011
Figure 12. Phase trajectories on the plane of spatially averaged prey and predator densities. Results obtained in simulations with spatial patterns A, B, C, and D are depicted with different colors. Notice the deference of attractors corresponding to heterogenous dynamics with large-amplitude homogenous cycle H, which stabilizes in the non-spatial case of the model with the chosen parameter values. (a) Dynamics stabilized in each simulation. (b) Same attractors superimposed with cycle H.
Mathematics 11 03378 g012
Disclaimer/Publisher’s Note: The statements, opinions and data contained in all publications are solely those of the individual author(s) and contributor(s) and not of MDPI and/or the editor(s). MDPI and/or the editor(s) disclaim responsibility for any injury to people or property resulting from any ideas, methods, instructions or products referred to in the content.