Article

Joint Optimization of Maintenance and Spare Parts Inventory Strategies for Emergency Engineering Equipment Considering Demand Priorities

School of E-Business and Logistics, Beijing Technology and Business University, Beijing 100048, China
*
Author to whom correspondence should be addressed.
Mathematics 2023, 11(17), 3688; https://doi.org/10.3390/math11173688
Submission received: 13 July 2023 / Revised: 12 August 2023 / Accepted: 17 August 2023 / Published: 27 August 2023
(This article belongs to the Special Issue System Reliability and Quality Management in Industrial Engineering)

Abstract

:
To respond to emergencies in a timely manner, emergency engineering equipment has been an important tool to implement emergency strategies. However, random failures of the equipment may occur during operation. Therefore, appropriate maintenance and spare parts inventory strategies are crucial to ensure the smooth operation of the equipment. Furthermore, the urgency degree of emergencies varies in practice. Nevertheless, existing studies rarely consider the impact of urgency degree and demand priorities on the service order of the equipment. To bridge the research gaps, this paper establishes a joint optimization model of maintenance and spare parts inventory strategies for emergency engineering equipment considering demand priorities. The proposed model includes two types of emergency engineering equipment with different service rates. The more urgent demand can be fulfilled by the equipment with a higher priority. Corrective maintenance and spare parts inventory policies are simultaneously performed for the equipment. The Markov process imbedding method is utilized to derive the probabilistic indexes of the system. To maximize the system availability, the number of maintenance engineers and the spare parts inventory strategy is optimized via the construction of the joint optimization model. The optimal solution for the optimization problem is obtained using the branch-and-bound method. Finally, this study presents practical examples to verify the effectiveness of the model and methods.

1. Introduction

In real-life situations, the occurrences of unexpected events are usually unavoidable. In order to minimize the losses caused by unexpected events, emergency engineering equipment has emerged. However, due to factors such as wear and natural erosion, the equipment may deteriorate or even break down. Hence, the maintenance strategy plays an essential role in the normal operation of emergency engineering equipment. Currently, there has been extensive research on maintenance strategies in the academic field. For instance, Wang et al. [1] designed a combined maintenance policy that included opportunistic, corrective and preventive maintenance activities for balanced systems vulnerable to shocks. Dui et al. [2] and Li et al. [3] explored desirable preventive maintenance strategies for manufacturing systems and specific highway mileage piles, respectively. Wang et al. [4] put forward a joint strategy involving preventive maintenance and component reassignment so as to keep the system balanced and enhance its reliability. With the purpose of enhancing the system availability, Dong et al. [5] and Li et al. [6] designed opportunistic maintenance policies for systems with failure dependence and offshore wind turbine systems, respectively. Broek et al. [7] investigated a dynamic condition-based maintenance and production policy to relieve the failure risk and reduce the cost of a single-unit system. Zheng and Makis [8] explored the condition-based maintenance strategy involving minimal and general repair for systems that may break down under two modes. A maintenance model considering imperfect repair was formulated by Shen et al. [9] for a system operating in dynamic environments. Liu et al. [10] put forward a new condition-based maintenance strategy incorporating multiple effects of maintenance for the systems influenced by shocks and degradation. With a focus on maintenance effectiveness based on the costs, Dui et al. [11] investigated the preventive maintenance of components.
The inventory of spare parts as the resource support for maintenance strategies is also an important factor related to emergency engineering equipment. If the supply of spare parts is limited, the maintenance efficiency of the equipment will be affected and maintenance activities will be delayed. Nevertheless, excessive inventory will lead to an increase in inventory costs and occupy a significant amount of working capital. Consequently, it is vital to find a balance between inventory holdings and system operational costs. Numerous studies have investigated the supply and ordering strategies for spare parts. For instance, Tusar and Sarker [12] analyzed some famous spare parts inventory models and discussed the applicability of the models. Based on the consideration of costly downtime due to the unavailability of spare parts, Dendauw et al. [13] put forward a new policy with a condition-based critical level to regulate the stock level scientifically. Taking the sulfur product supply chain as an example, Zhou et al. [14] conducted a detailed study on inventory control strategies for a two-stage inventory system. Considering the degradation of spare parts in inventory, Zhang et al. [15] contributed to achieving the optimal control policy of the spare inventory for the involved system.
Obviously, the above-mentioned studies have investigated maintenance and spare parts inventory strategies separately. Virtually, to balance the contradiction between the reliability and the operational cost of systems, the topic of deriving the joint optimum strategy of the spare parts inventory and maintenance is also significant and has received significant attention from scholars [16]. Plenty of research on the joint optimization of spare parts inventory and maintenance strategies has been explored, achieving the goal of improving system reliability while reducing costs. For a simple system with one unit degrading in a three-stage process, Zhao et al. [17] studied the inspection and spare ordering problems, where the execution of preventive or corrective maintenance and placing a normal or emergency order was associated with the inspection results. In addition, some research developments have primarily concentrated on multi-component systems in view of the engineering reality, and some illustrative studies are discussed as follows. Considering the hybrid-deteriorating process of spare parts, Zhang et al. [18] explored a model for optimizing the preventive maintenance and inventory policy simultaneously for standby systems. For a series system composed of two units, Cai et al. [19] considered the maintenance preparation threshold and spare part inventory management policy as decision variables to be optimized together for a multi-component system. For parallel production systems, two-unit parallel systems and serial-parallel manufacturing systems, the inventory control and maintenance strategies were investigated and optimized in the literature [20,21,22], respectively. The authors of [23,24,25,26] simultaneously optimized the spare parts inventory and condition-based maintenance policies for engineering systems with different characteristics. Liu et al. [27] integrated product replacement, maintenance and inventory control issues to raise the profits of use-oriented product service systems.
By reviewing the above research, it is evident that research on the optimization problems of spare parts inventory and maintenance policies for emergency engineering equipment has not received attention. However, along with the usage and aging of the equipment, random equipment failures may occur, and the equipment managers have to face the vital issues of carrying out maintenance and spare parts ordering strategies scientifically and economically. Furthermore, the urgency degree of emergencies influences the service order in practice, where the demand with a higher degree of urgency should be fulfilled preferentially. Nevertheless, few studies have taken the demand priority into consideration for the service system including two types of emergency engineering equipment with various service rates.
To fill these research gaps, this paper investigates the comprehensive operation process of the emergency engineering equipment used to satisfy the demands of diverse urgencies, including maintenance activities, as well as the provision and replenishment of spare parts. A model aimed at jointly optimizing the spare parts inventory policy and the number of engineers implementing corrective maintenance activities is formulated to achieve the maximization of system availability, innovatively considering the impact of demand priority. The Markov process imbedding method (MPIM) and the branch-and-bound method are used to formulate the system reliability indexes and solve the constructed optimization model to obtain the optimal inventory control strategy and maintenance engineer allocation, respectively. To clarify the differences between the illustrative previous studies and the proposed model, Table 1 presents comparisons between the prior studies and this study.
The necessity and advantage of using MPIM in this study can be demonstrated by its high effectiveness in depicting the complicated operation process of the proposed system, which includes equipment degradation, equipment maintenance, spare replenishment and service process with demand priority. By comparison, it becomes very difficult to conduct the reliability modeling and analysis for the proposed system by other mathematical methods due to the complexity of the system operation process. Additionally, MPIM serves efficiently to derive the reliability indicators of the system in an analytic and concise form, which makes this complex reliability problem solvable [28,29,30]. MPIM has been extensively employed to depict the running process of the engineering systems and evaluate their reliability quantities [31,32,33,34]. For instance, Wu et al. [35] and Wang et al. [36] adopted MPIM to characterize the degradation process of the balanced systems considering the performance-sharing mechanism and restricted rebalanced mechanism, respectively. By utilizing MPIM, Wang et al. [37] derived the formulas of subsystem reliability which are affected by degradation, shocks and protection from devices. Regarding the techniques for resolving the related optimization models, the prior literature has focused on the branch-and-bound method [30,38], grey wolf algorithm [39], genetic algorithm [40], particle swarm algorithm [41] and so on. The proposed optimization problem is an integer programming problem and the branch-and-bound method is commonly employed to solve the integer programming problems, which presents remarkable efficiency. However, when dealing with more complicated nonlinear integer programming models, it is suitable to utilize the heuristic methods, e.g., genetic algorithm, to attain optimal decisions.
The key contributions of this work can be summarized into four aspects.
(1)
Construct a joint optimization model of spare parts inventory and maintenance strategies for the service system comprising two types of emergency engineering equipment;
(2)
Consider the diverse priorities of the demands needed to be accomplished by emergency engineering equipment in accordance with the real situation;
(3)
Employ the Markov process imbedding approach efficiently to formulate a group of system reliability indexes, including the availability of spare parts, maintenance engineer and entire service system;
(4)
Apply the branch-and-bound method successfully to address the joint optimization model and derive the joint optimum decisions of spare part inventory strategy and maintenance engineer allocation.
The remainder of this paper is presented below. In Section 2, the operation process, maintenance activities and spare parts replenishment process of the proposed service system are depicted, and some basic assumptions are also put forward. The establishment of the Markov process as well as its transition rules are given in Section 3. Section 4 is devoted to formulating the probabilistic quantities of the proposed system, some cost indicators, as well as an optimization model of combinative decisions in maintenance and inventory strategies. Section 5 focuses on the illustrative examples combined with rich sensitivity analyses to achieve some analytical results and demonstrate the applicability of the developed model. A summary of this research is provided and promising research orientations are pointed out in Section 6.

2. Model Descriptions and Assumptions

2.1. System Description

Based on the engineering background of the service supply station including emergency engineering equipment, a new reliability model for the emergency engineering equipment is built. According to the priority of requirements, urgent and non-urgent demands are classified. Emergency engineering equipment is divided into two types, where type-I and type-II equipment provide express and regular processing service, respectively. Notably, the two types of emergency engineering equipment can realize the same service effect. Assume that the number of type-I and type-II emergency engineering equipment is u and v , respectively. The operation process of emergency engineering equipment under different situations is presented in the following.
(1)
If the urgent demands reach the service system, the operation situations are described as follows. Customers with urgent demands automatically choose the type-I emergency engineering systems to acquire the express service. If there is no available type-I emergency engineering equipment, the customer may leave the service system directly with a probability P 10 , or wait in the queue of type-I emergency engineering equipment with a probability P 11 , satisfying P 10 + P 11 = 1 .
(2)
When the non-urgent demands arrive at the service system, the operation scenarios are introduced as follows. The primary choice of customers with non-urgent demands is the type-II emergency engineering systems, owing to the less pressure of time. If no available type-II emergency engineering equipment exists upon the arrival of the demands, the customers may leave the system directly with a probability P 20 . Alternatively, they may continue waiting in the queue for the type-II emergency engineering equipment with a probability P 22 . Another possible choice is switching to the queue of type-I emergency engineering equipment with a probability P 21 , while the unsatisfied non-urgent demands may still wait to be served due to the fully occupied type-I emergency engineering equipment. Particularly, in the queue of type-I emergency engineering equipment, the customers with urgent demands take priority for service over those with non-urgent demands. It is obvious that P 20 + P 21 + P 22 = 1 .
The upper limits of the waiting quantity for two types of queuing systems are m and n , respectively. If the waiting capacity for any queue reaches the threshold, the customer who ultimately chooses to wait in that queue will leave the system. Based on the above descriptions, two queuing models are expressed as M / M / u / u + m / and M / M / v / v + n / to denote the queuing systems for type-I and type-II emergency engineering equipment, respectively.

2.2. Maintenance and Spare Parts Inventory Strategies

Along with the degradation of the emergency engineering equipment, their random malfunctions may happen and can be immediately detected. The failed equipment that is unable to provide services will be repaired and maintained with new spare parts by maintenance engineers if there are sufficient spares in inventory. The total number of hired maintenance engineers is k . On the premise of adequate spare parts, if the available maintenance engineers are insufficient to repair all broken-down equipment, a waiting period is required for some of them to get the repairs until available maintenance engineers appear in the system.
It is assumed that type-I and type-II emergency engineering equipment are composed of the same crucial components and share one common inventory of spare parts. The well-known ( s , S ) policy is selected as the inventory control strategy for the spare parts. ( s , S ) policy means that a spare parts replenishment order to the supplier is placed to ensure the inventory of spare parts reaches S after the replenishment when the quantity of spare parts is smaller than or equivalent to s . When the service system has abundant maintenance engineers but a shortage of spare parts to maintain all malfunctioned equipment, repairments and replacements can only be completed after the replenishment order is delivered. After one piece of failed equipment is completely repaired, the quantity of spare parts in stock is decreased by one; otherwise, the quantity of spare parts remains unchanged.

2.3. Basic Assumptions

(1)
The arrival of urgent and non-urgent demands follows the Poisson process with rates d 1 and d 2 , respectively.
(2)
Each piece of emergency engineering equipment functions independently. The service time of type-I and type-II emergency engineering equipment fulfilling the demands follows the exponential distribution with rates η 1 and η 2 , respectively. Obviously, η 1 > η 2 .
(3)
The lifetimes of type-I and type-II emergency engineering equipment are exponentially distributed with rates λ 1 and λ 2 , respectively.
(4)
The maintenance times of type-I and type-II emergency engineering equipment follow exponential distributions with parameters ω 1 and ω 2 , respectively.
(5)
The lead time of spare parts replenishment obeys an exponential distribution with a replenishment rate τ .
According to the above model descriptions and assumptions, Figure 1 is plotted to present the running process of the proposed service system comprehensively. In Figure 1, the information about the urgent and non-urgent demands is plotted in red and blue colors, respectively.

3. Markov Process Descriptions

In this paper, the Markov process imbedding approach is employed with the purpose of representing the running process of the proposed system and deriving the relevant re-liability indexes. Define a Markov process { X ( t ) , t 0 } in continuous time, represented as
X ( t ) = ( x ; y ; q ) ,
where x = ( o 1 , f 1 , c 1 j , c 1 f ) , y = ( o 2 , f 2 , c 2 ) . o 1 and o 2 represent the number of occupied type-I and type-II emergency engineering equipment, respectively. f 1 and f 2 denote the number of failed type-I and type-II emergency engineering equipment, respectively. c 1 j and c 1 f stand for the number of urgent and non-urgent demands waiting in the queuing system of type-I emergency engineering equipment, respectively. c 2 represents the number of non-urgent demands waiting in the queuing system of type-II emergency engineering equipment, and q is the real-time spare parts inventory level of the equipment. Therefore, the state space of the defined stochastic process for the concerned system is established as
Ω = { ( x ; y ; q ) : 0 o 1 u ,   0 f 1 u o 1 ,   0 c 1 j + c 1 f m , 0 o 2 v ,   0 f 2 v o 2 ,   0 c 2 n ,   0 q S } .
Subsequently, the transition rules of the established Markov process can be figured out in the following.
(1)
Condition: o 1 + f 1 < u ,   o 2 + f 2 v ,   c 1 j = 0 ,   c 1 f = 0 ,   0 c 2 n and 0 q S ;
Transition: ( o 1 , f 1 , c 1 j , c 1 f o 2 , f 2 , c 2 q ) ( o 1 + 1 , f 1 , c 1 j , c 1 f o 2 , f 2 , c 2 q ) ;
Transition rate: d 1 .
(2)
Condition: o 1 + f 1 = u ,   o 2 + f 2 v ,   0 c 1 j + c 1 f m 1 ,   0 c 2 n and 0 q S ;
Transition: ( o 1 , f 1 , c 1 j , c 1 f o 2 , f 2 , c 2 q ) ( o 1 , f 1 , c 1 j + 1 , c 1 f o 2 , f 2 , c 2 q ) ;
Transition rate: d 1 P 11 .
(3)
Condition: o 1 + f 1 u ,   o 2 + f 2 < v ,   0 c 1 j + c 1 f m ,   c 2 = 0 and 0 q S ;
Transition: ( o 1 , f 1 , c 1 j , c 1 f o 2 , f 2 , c 2 q ) ( o 1 , f 1 , c 1 j , c 1 f o 2 + 1 , f 2 , c 2 q ) ;
Transition rate: d 2 .
(4)
Condition: o 1 + f 1 < u ,   o 2 + f 2 = v ,   c 1 j = 0 ,   c 1 f = 0 ,   0 c 2 n and 0 q S ;
Transition: ( o 1 , f 1 , c 1 j , c 1 f o 2 , f 2 , c 2 q ) ( o 1 + 1 , f 1 , c 1 j , c 1 f o 2 , f 2 , c 2 q ) ;
Transition rate: d 2 P 21 .
(5)
Condition: o 1 + f 1 = u ,   o 2 + f 2 = v ,   0 c 1 j + c 1 f m 1 ,   0 c 2 n and 0 q S ;
Transition: ( o 1 , f 1 , c 1 j , c 1 f o 2 , f 2 , c 2 q ) ( o 1 , f 1 , c 1 j , c 1 f + 1 o 2 , f 2 , c 2 q ) ;
Transition rate: d 2 P 21 .
(6)
Condition: o 1 + f 1 u ,   o 2 + f 2 = v ,   0 c 1 j + c 1 f m ,   0 c 2 n 1 and 0 q S ;
Transition: ( o 1 , f 1 , c 1 j , c 1 f o 2 , f 2 , c 2 q ) ( o 1 , f 1 , c 1 j , c 1 f o 2 , f 2 , c 2 + 1 q ) ;
Transition rate: d 2 P 22 .
(7)
Condition: o 1 + f 1 < u ,   o 2 + f 2 v ,   c 1 j = 0 ,   c 1 f = 0 ,   0 c 2 n and 0 q S ;
Transition: ( o 1 , f 1 , c 1 j , c 1 f o 2 , f 2 , c 2 q ) ( o 1 , f 1 + 1 , c 1 j , c 1 f o 2 , f 2 , c 2 q ) ;
Transition rate: ( u o 1 f 1 ) λ 1 .
(8)
Condition: o 1 + f 1 u ,   o 2 + f 2 < v ,   0 c 1 j + c 1 f m ,   c 2 = 0 and 0 q S ;
Transition: ( o 1 , f 1 , c 1 j , c 1 f o 2 , f 2 , c 2 q ) ( o 1 , f 1 , c 1 j , c 1 f o 2 , f 2 + 1 , c 2 q ) ;
Transition rate: ( v o 2 f 2 ) λ 2 .
(9)
Condition: o 1 > 0 ,   o 1 + f 1 u ,   o 2 + f 2 v ,   c 1 j = 0 ,   c 1 f = 0 ,   0 c 2 n and 0 q S ;
Transition: ( o 1 , f 1 , c 1 j , c 1 f o 2 , f 2 , c 2 q ) ( o 1 1 , f 1 , c 1 j , c 1 f o 2 , f 2 , c 2 q ) ;
Transition rate: o 1 η 1 .
(10)
Condition: o 1 > 0 ,   o 1 + f 1 = u ,   o 2 + f 2 v ,   c 1 j > 0 ,   c 1 j + c 1 f m ,   0 c 2 n and 0 q S ;
Transition: ( o 1 , f 1 , c 1 j , c 1 f o 2 , f 2 , c 2 q ) ( o 1 , f 1 , c 1 j 1 , c 1 f o 2 , f 2 , c 2 q ) ;
Transition rate: o 1 η 1 .
(11)
Condition: o 1 > 0 ,   o 1 + f 1 = u ,   o 2 + f 2 v ,   c 1 j = 0 ,   0 < c 1 f m ,   0 c 2 n and 0 q S ;
Transition: ( o 1 , f 1 , c 1 j , c 1 f o 2 , f 2 , c 2 q ) ( o 1 , f 1 , c 1 j , c 1 f 1 o 2 , f 2 , c 2 q ) ;
Transition rate: o 1 η 1 .
(12)
Condition: o 2 > 0 ,   o 1 + f 1 u ,   o 2 + f 2 v ,   0 c 1 j + c 1 f m ,   c 2 = 0 and 0 q S ;
Transition: ( o 1 , f 1 , c 1 j , c 1 f o 2 , f 2 , c 2 q ) ( o 1 , f 1 , c 1 j , c 1 f o 2 1 , f 2 , c 2 q ) ;
Transition rate: o 2 η 2 .
(13)
Condition: o 2 > 0 ,   o 1 + f 1 u ,   o 2 + f 2 = v ,   0 c 1 j + c 1 f m ,   0 < c 2 n and 0 q S ;
Transition: ( o 1 , f 1 , c 1 j , c 1 f o 2 , f 2 , c 2 q ) ( o 1 , f 1 , c 1 j , c 1 f o 2 , f 2 , c 2 1 q ) ;
Transition rate: o 2 η 2 .
(14)
Condition: f 1 > 0 ,   o 1 + f 1 u ,   o 2 + f 2 v ,   c 1 j = 0 ,   c 1 f = 0 ,   0 c 2 n and q > 0 ;
Transition: ( o 1 , f 1 , c 1 j , c 1 f o 2 , f 2 , c 2 q ) ( o 1 , f 1 1 , c 1 j , c 1 f o 2 , f 2 , c 2 q 1 ) ;
Transition rate: min { f 1 , q , k } ω 1 .
(15)
Condition: f 1 > 0 ,   o 1 + f 1 = u ,   o 2 + f 2 v ,   c 1 j > 0 ,   c 1 j + c 1 f m ,   0 c 2 n and q > 0 ;
Transition: ( o 1 , f 1 , c 1 j , c 1 f o 2 , f 2 , c 2 q ) ( o 1 + 1 , f 1 1 , c 1 j 1 , c 1 f o 2 , f 2 , c 2 q 1 ) ;
Transition rate: min { f 1 , q , k } ω 1 .
(16)
Condition: f 1 > 0 ,   o 1 + f 1 = u ,   o 2 + f 2 v ,   c 1 j = 0 ,   0 < c 1 f m ,   0 c 2 n and q > 0 ;
Transition: ( o 1 , f 1 , c 1 j , c 1 f o 2 , f 2 , c 2 q ) ( o 1 + 1 , f 1 1 , c 1 j , c 1 f 1 o 2 , f 2 , c 2 q 1 ) ;
Transition rate: min { f 1 , q , k } ω 1 .
(17)
Condition: f 2 > 0 ,   o 1 + f 1 u ,   o 2 + f 2 v ,   0 c 1 j + c 1 f m ,   c 2 = 0 and q > 0 ;
Transition: ( o 1 , f 1 , c 1 j , c 1 f o 2 , f 2 , c 2 q ) ( o 1 , f 1 , c 1 j , c 1 f o 2 , f 2 1 , c 2 q 1 ) ;
Transition rate: min { f 2 , q , k } ω 2 .
(18)
Condition: f 2 > 0 ,   o 1 + f 1 u ,   o 2 + f 2 = v ,   0 c 1 j + c 1 f m ,   0 < c 2 n and q > 0 ;
Transition: ( o 1 , f 1 , c 1 j , c 1 f o 2 , f 2 , c 2 q ) ( o 1 , f 1 , c 1 j , c 1 f o 2 + 1 , f 2 1 , c 2 1 q 1 ) ;
Transition rate: min { f 2 , q , k } ω 2 .
(19)
Condition: o 1 + f 1 u ,   o 2 + f 2 v ,   0 c 1 j + c 1 f m ,   0 c 2 n and q s ;
Transition: ( o 1 , f 1 , c 1 j , c 1 f o 2 , f 2 , c 2 q ) ( o 1 , f 1 , c 1 j , c 1 f o 2 , f 2 , c 2 S ) ;
Transition rate: τ .
To facilitate the comprehension of the above rules, Table 2, Table 3 and Table 4 are listed to explain the triggering events and the distinctions of the transition rules by comparison. Specifically, transition rules (1–6) in Table 2 focus on the arrival process of the demands with different levels of urgency. The broken-down and service process of type-I and type-II emergency engineering equipment are depicted by rules (7–13) in Table 3. Table 4 with rules (14–18) is devoted to the maintenance and replacement process for emergency engineering equipment.
Using the defined Markov process and the above transition rules, the state transition rate matrix of the system Q ( x ; y ; q ) k , S , s can be formulated. For the system, its steady-state probability distribution is represented as ε ( x ; y ; q ) k , S , s , where k , S and s denotes the total number of maintenance engineers, the utmost value of spare parts stock level and the reorder point, respectively. Then, the following system of equations can be employed to compute the steady-state probability of the system staying in each Markov process state as
{ ε ( x ; y ; q ) k , S , s Q ( x ; y ; q ) k , S , s = 0 , ( x ; y ; q ) Ω ε ( x ; y ; q ) k , S , s = 1 .

4. Formulation of the Joint Optimization Model

This section presents the derivation of some important reliability indexes, the analysis of cost indicators and the construction of the optimization model as well as its solving algorithm. When calculating the reliability indexes, the computational complexity of employing MPIM is expressed as O ( | Ω | 2 ) , where | Ω | is the total number of states of the defined Markov process. The details are shown as follows.

4.1. Derivation of Reliability Indexes

Define the availability of the proposed service system as the likelihood that the system has available type-I and type-II emergency engineering equipment upon the arrival of the demands. The system availability is computed as
A s = ( x ; y ; q ) Ω s ε ( x ; y ; q ) k , S , s ,
where Ω s = { ( x ; y ; q ) : o 1 + f 1 < u ,   c 1 j = 0 ,   c 1 f = 0 ,   o 2 + f 2 < v ,   c 2 = 0 ,   0 q S } .
The availability of spare parts is expressed as the likelihood that the total number of failed emergency engineering equipment does not exceed the inventory level of spare parts. That is to say, the quantity of spare parts in stock can meet the maintenance needs of all failed equipment. The spare parts availability is obtained in the following,
A c = ( x ; y ; q ) Ω c ε ( x ; y ; q ) k , S , s ,
where Ω c = { ( x ; y ; q ) : f 1 + f 2 q S ,   0 o 1 u f 1 , 0 o 2 v f 2 ,   0 c 1 j + c 1 f m ,   0 c 2 n } .
The availability of maintenance engineers is defined as the probability that the available maintenance engineers are capable of repairing all failed emergency engineering equipment, which means that the number of available maintenance engineers is larger than the number of malfunctioned equipment. The availability of maintenance engineers is derived below,
A m = ( x ; y ; q ) Ω m ε ( x ; y ; q ) k , S , s ,
where Ω m = { ( x ; y ; q ) : f 1 + f 2 k ,   0 o 1 u f 1 ,   0 o 2 v f 2 , 0 c 1 j + c 1 f m ,   0 c 2 n ,   0 q S } .

4.2. Cost Analysis

The cost incurred by each maintenance activity for the emergency engineering equipment per unit time is represented by c m . The following formula denotes the expected maintenance cost incurred as the operating of the system per unit time,
E C M = c m ( x ; y ; q ) Ω ε ( x ; y ; q ) k , S , s min ( f 1 + f 2 , q , k ) .
c h is used to denote the holding cost of stocking a spare part per unit time. The expectation of the total inventory holding cost per unit time can be figured out as
E C H = c h ( x ; y ; q ) Ω ε ( x ; y ; q ) k , S , s [ q min ( f 1 + f 2 , q , k ) ] .
c b is the cost of purchasing an individual spare part from the suppliers. The expectation of the purchasing cost of spare parts per unit time can be calculated below,
E C B = c b ( x ; y ; q ) Ω b ε ( x ; y ; q ) k , S , s ( S q ) ,
where Ω b = { ( x ; y ; q ) : 0 o 1 u ,   0 f 1 u o 1 ,   0 c 1 j + c 1 f m , 0 o 2 v ,   0 f 2 v o 2 ,   0 c 2 n ,   0 q s } .
The employment cost of a maintenance engineer is c e . Therefore, the expected total cost of the system per unit time is gained as
E C = E C M + E C H + E C B + k c e .

4.3. Joint Optimization Model

The optimization model constructed in this section sets the objective function as the maximization of system availability and obtains the optimized number of maintenance engineers and spare parts inventory control strategy under some constraints. In such a model, the availability of spare parts and the maintenance engineer cannot be lower than the corresponding threshold A c * and A m * , respectively. Meanwhile, the expected total cost per unit time during the running process of the system should be no more than the budget E C * . Therefore, the establishment of a joint optimization model is presented as
max   A s s . t . { A c A c * , A m A m * , E C E C * .
The branch-and-bound technique serves the purpose of obtaining the optimum decisions of the above optimization model and Figure 2 provides the detailed solution flowchart via this methodology, which has the computational complexity O ( ( u + v ) ( u + v + 1 ) 2 ) . In Figure 2, A max is used to record the current maximum value of the system availability, and its initialization A 0 can be a relatively larger value, such as A 0 = 0.8 . According to the algorithm flowchart in Figure 2, if the system reliability indexes and expected total cost under a decision solution ( s , S , k ) satisfy all constraint conditions of the optimization model and the corresponding obtained system availability A s is greater than the current maximization of system availability A max , then let A s become the new current maximum value of system availability A max , i.e., let A max = A s .

5. Numerical Examples

The effectiveness of the constructed model is richly illustrated and verified by numerical examples with an actual engineering application charging equipment in this section. There are two types of emergency charging equipment, where type-I and type-II emergency charging equipment provide express and regular charging services, respectively. Assume that the service station is composed of three ( u = 3 ) type-I emergency charging equipment and two ( v = 2 ) type-II emergency charging equipment.
The urgent demands arrive the service system with an arrival rate of d 1 = 5 and are automatically to be fulfilled by the type-I emergency charging equipment. However, owing to the unavailability of the type-I emergency charging equipment, customers may leave the service station with a probability P 10 = 0.5 , or wait in line at the type-I emergency charging equipment service station with a probability P 11 = 0.5 . Non-urgent demands arrive with a rate d 2 = 4 and are prioritized to be satisfied by type-II emergency charging equipment. If the type-II emergency charging vehicle equipment is not available, the customers with non-urgent demands may make any one of the following choices: (1) leave the service station with a probability P 20 = 0.5 ; (2) transfer to the service station of the type-I emergency charging equipment with a probability P 21 = 0.25 ; and (3) wait in the queue of type-II emergency charging equipment with a probability P 22 = 0.25 . The maximum waiting capacity for both types of queuing systems is two customers ( m = 2 ,   n = 2 ) . Table 5 lists the relevant parameter settings.
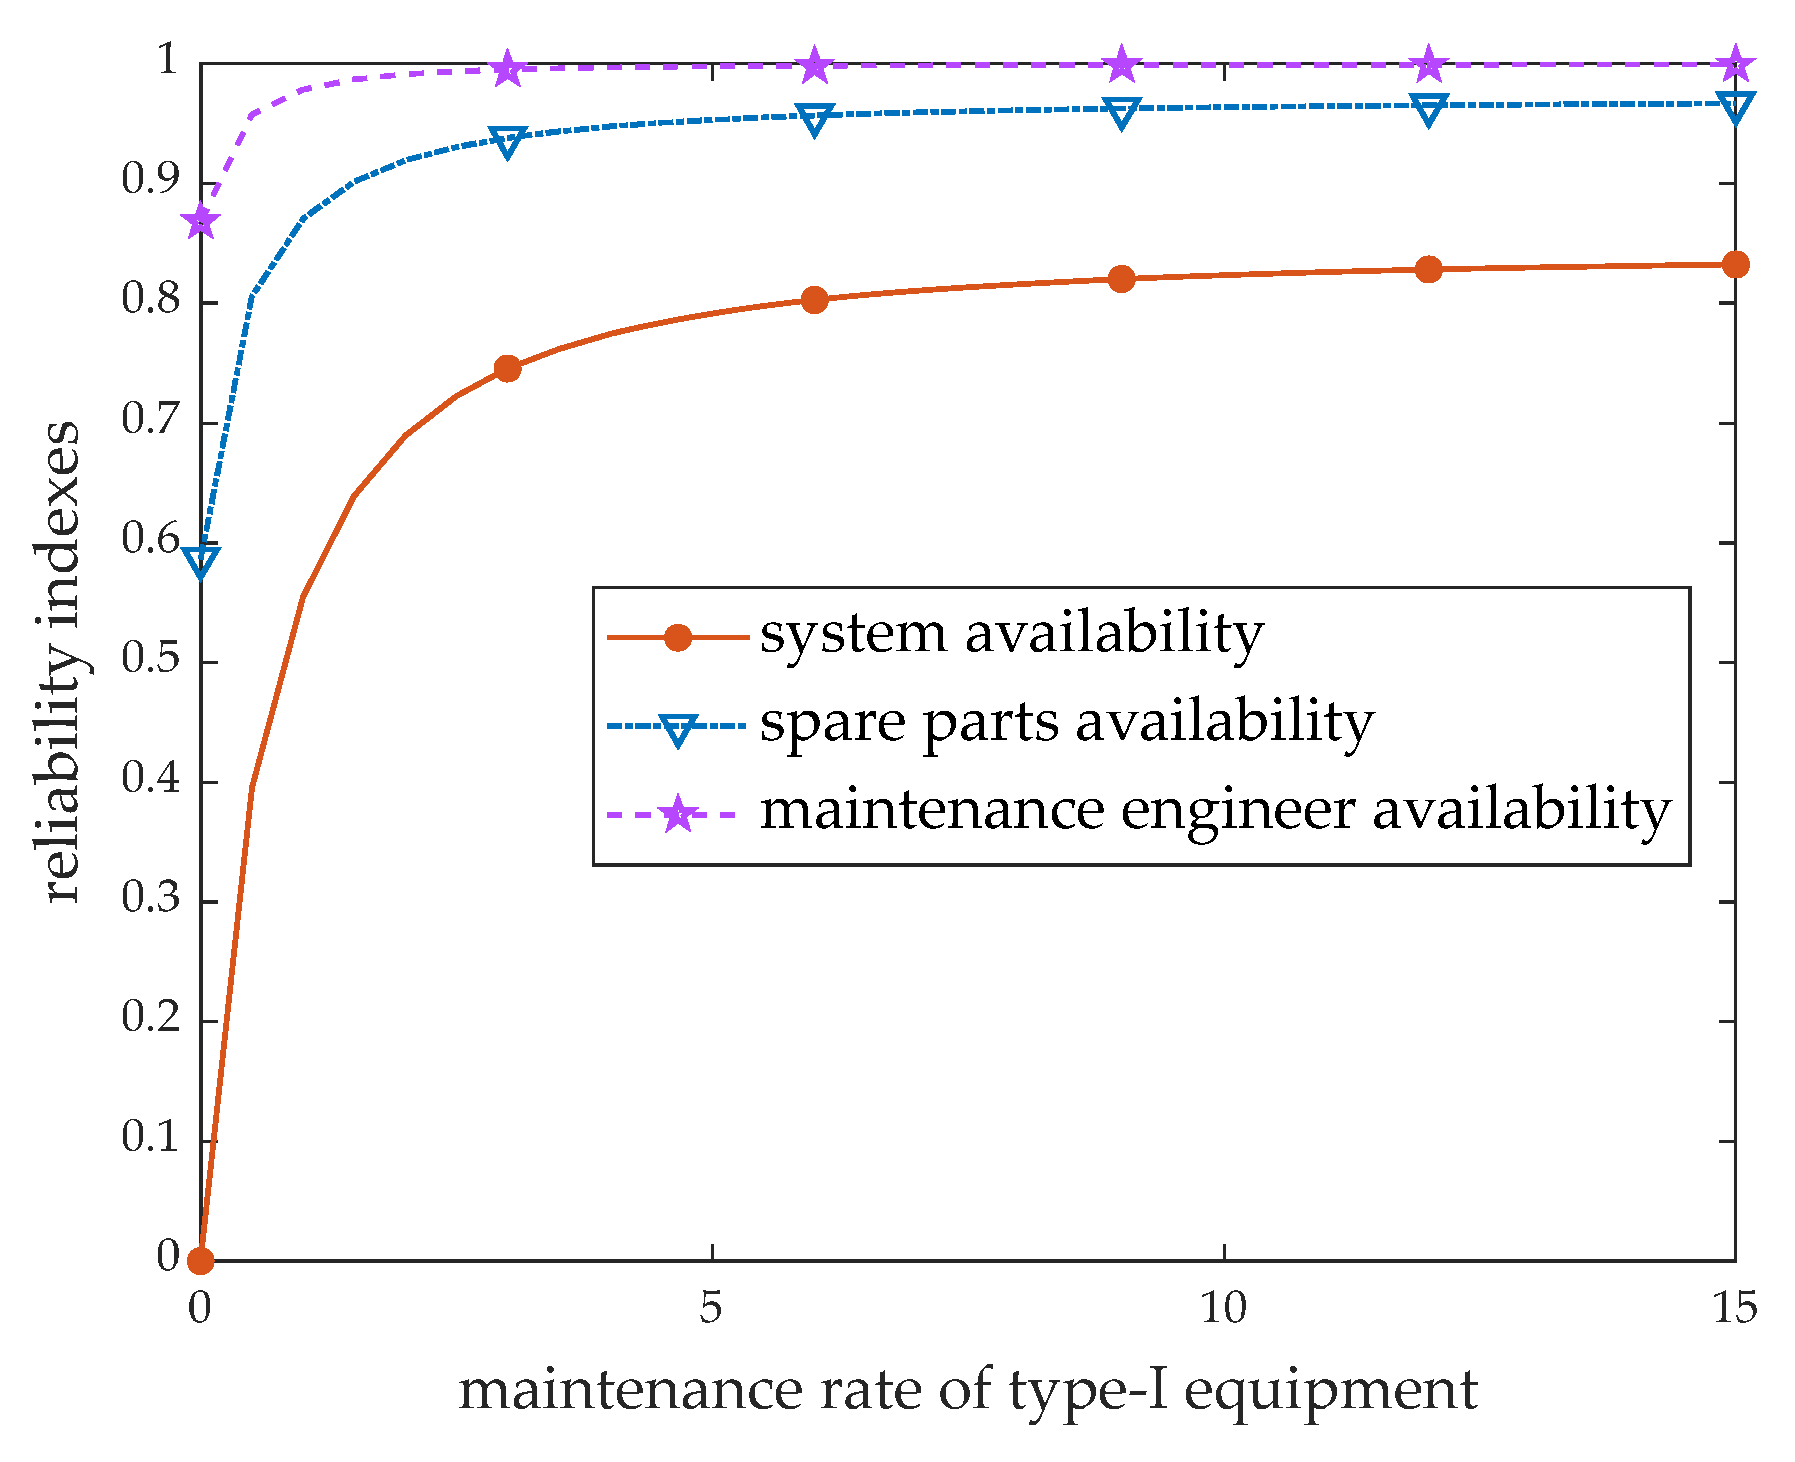
The following analyses of Figure 3, Figure 4, Figure 5, Figure 6 and Figure 7 are based on the preset values of ( s , S ) = ( 4 , 5 ) and k = 5 . The impact of maintenance rate exerting on system reliability indexes is shown in Figure 3. Due to the similar impact of ω 1 and ω 2 on the system reliability indexes, this section takes ω 1 as an example to explore. As shown in Figure 3, all availability values increase as ω 1 becomes larger. It is noticeable that both the spare parts availability and the system availability increase significantly with the increase of ω 1 . However, the increment rates of the spare parts availability and the system availability gradually become smaller. When ω 1 increases to 15, the maintenance engineer availability approaches 1 and the availability of system and spare parts can reach 0.83 and 0.97, respectively. As the maintenance rate increases, the working efficiency of maintenance engineers can be improved to complete the work of repairing the failed equipment, leading to a growth in the availability indicators.
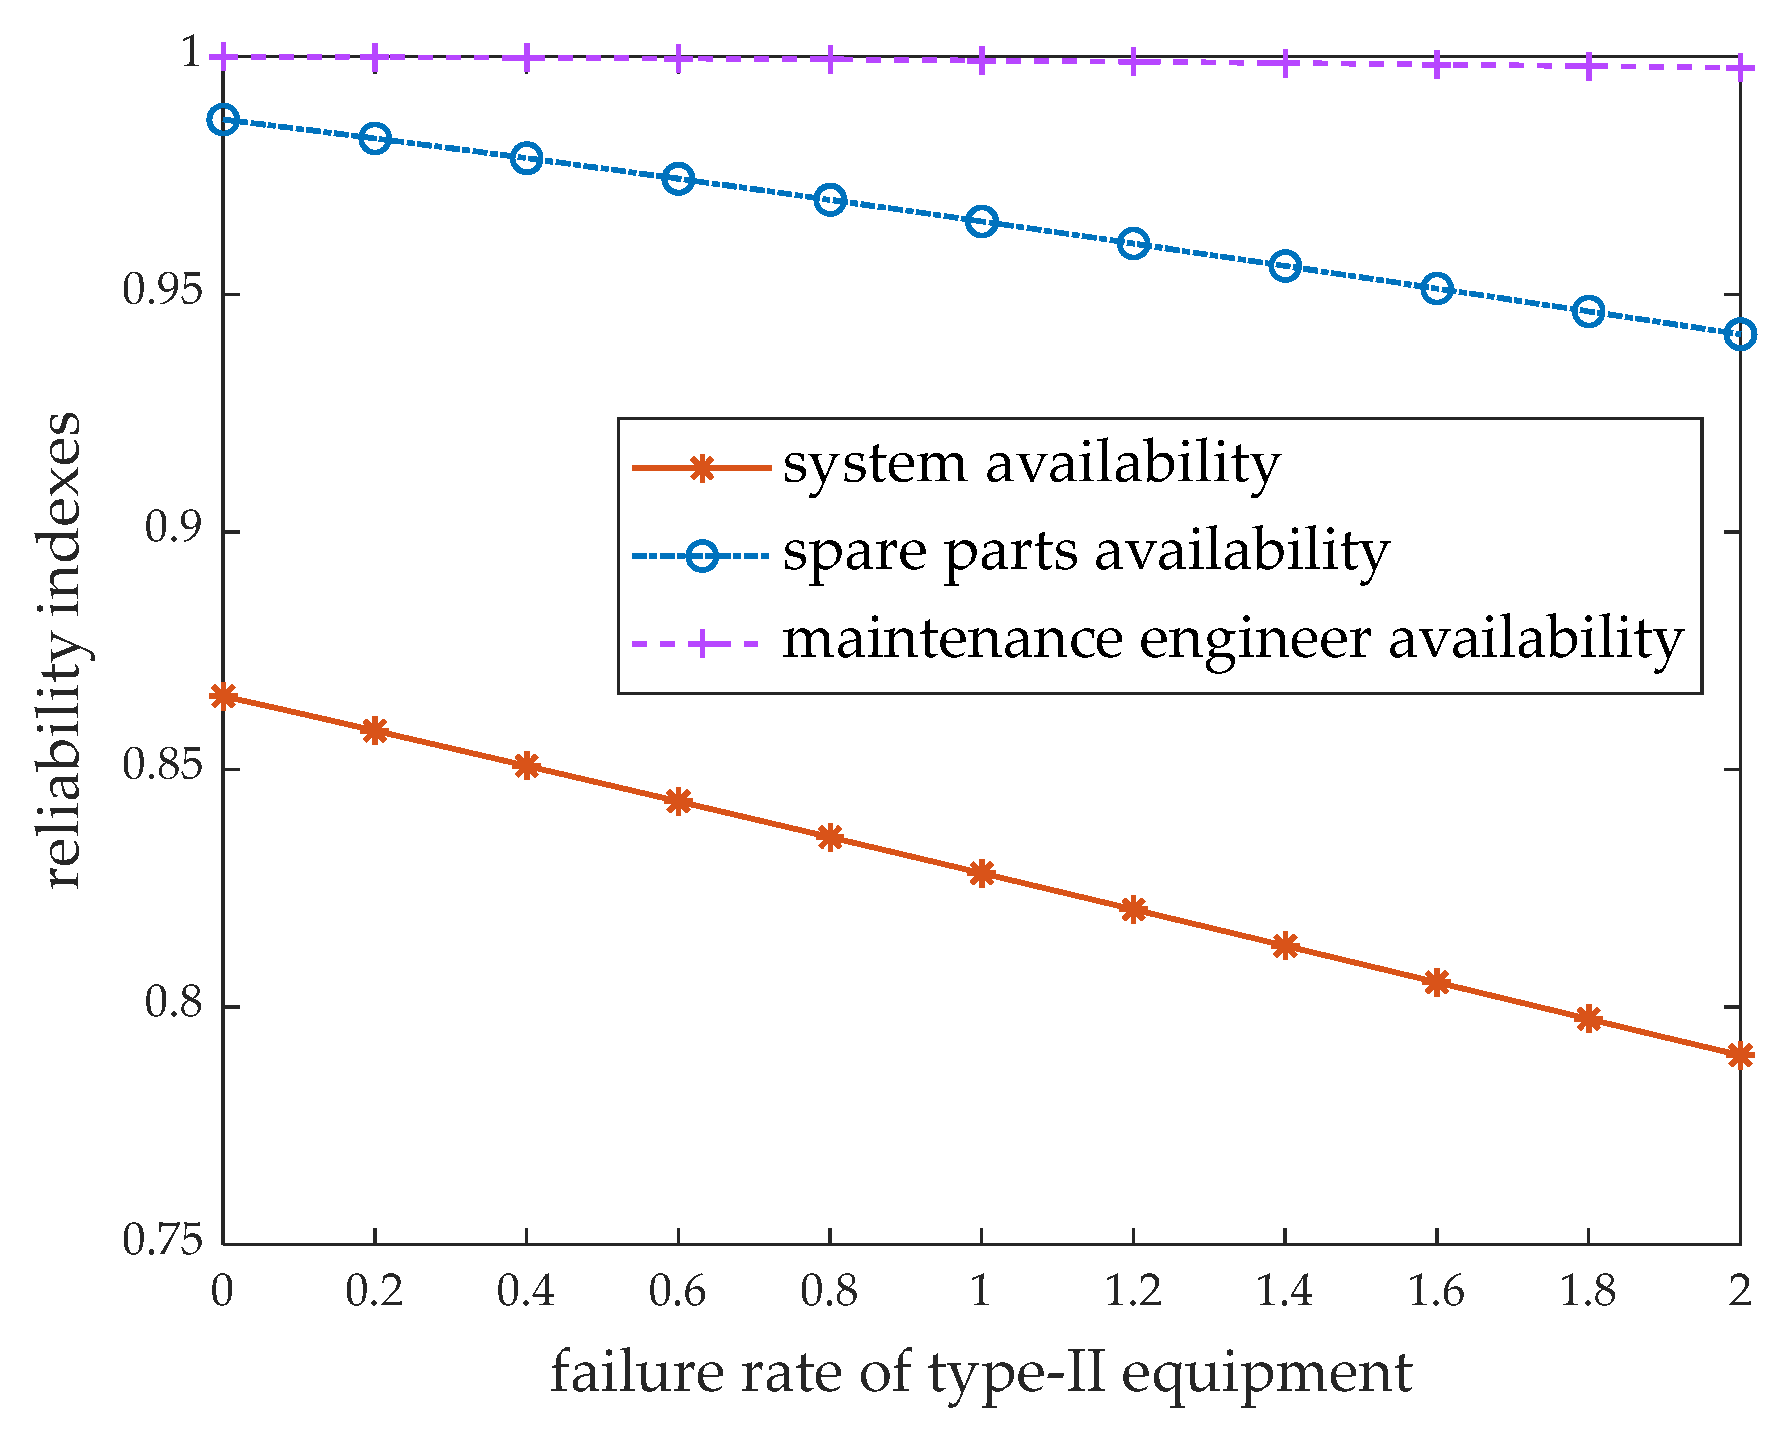
Taking the failure rate of type-II emergency charging equipment as an example, Figure 4 analyzes the impact of equipment failure rate on the system reliability indexes. In Figure 4, system availability, spare parts availability and maintenance engineer availability all decrease with an increasing failure rate. The variation of system availability is the most obvious because the emergency charging equipment cannot provide timely services to meet customers’ needs with the increasing number of unavailable emergency charging equipment due to the larger failure rate of the equipment. Additionally, the availability of maintenance engineers and spare parts slightly decreases when the failure rate of the equipment is raised, because of the reasonable rate of replenishing the spare parts and the adequate workforce of the engineers implementing the maintenance. Specifically, the inventory quantities of spare parts can increase timely and the number of maintenance engineers is enough to satisfy the replacement demands of failed equipment unless the failure rate of equipment is too high.
Figure 5. Influence of τ on system reliability indexes.
Mathematics 11 03688 g005
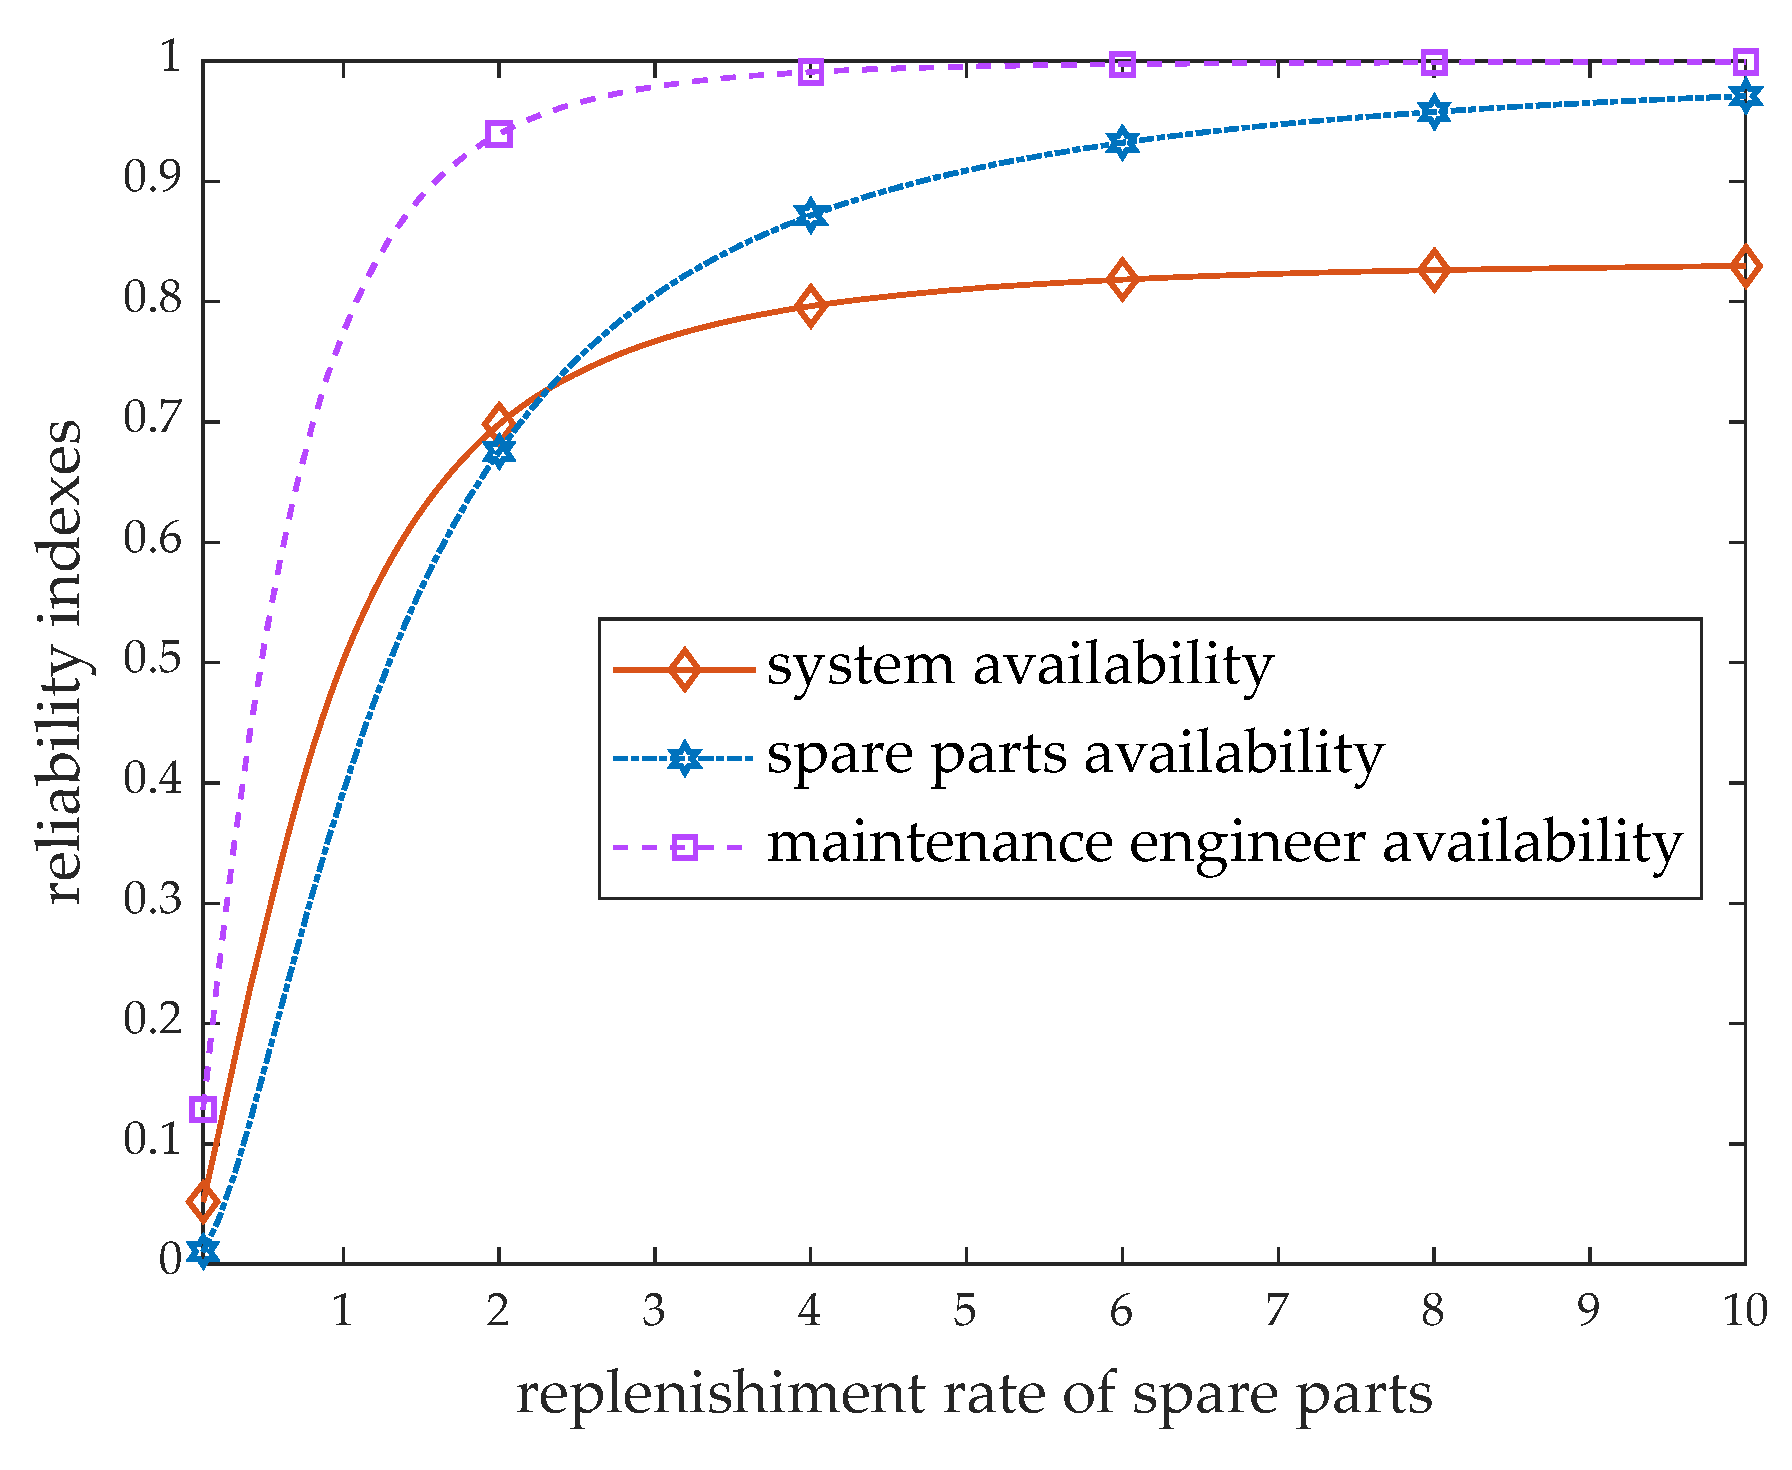
Figure 5 presents how the system reliability indexes are influenced by the changing replenishment rate of the spare parts. The system availability, spare parts availability and maintenance engineer availability all increase with the larger τ , because the sufficient spare parts can enhance the resource support for repairing the failed emergency charging equipment. On the other hand, the increment rates of the three indicators decline with the increasing value of τ , maybe resulting from the comparatively low maintenance rate. At τ = 10 , the value of system availability, spare parts availability and maintenance engineer availability converge to 0.83, 0.97 and 1, respectively.
Figure 6. Influence of P 11 on system reliability indexes.
Mathematics 11 03688 g006
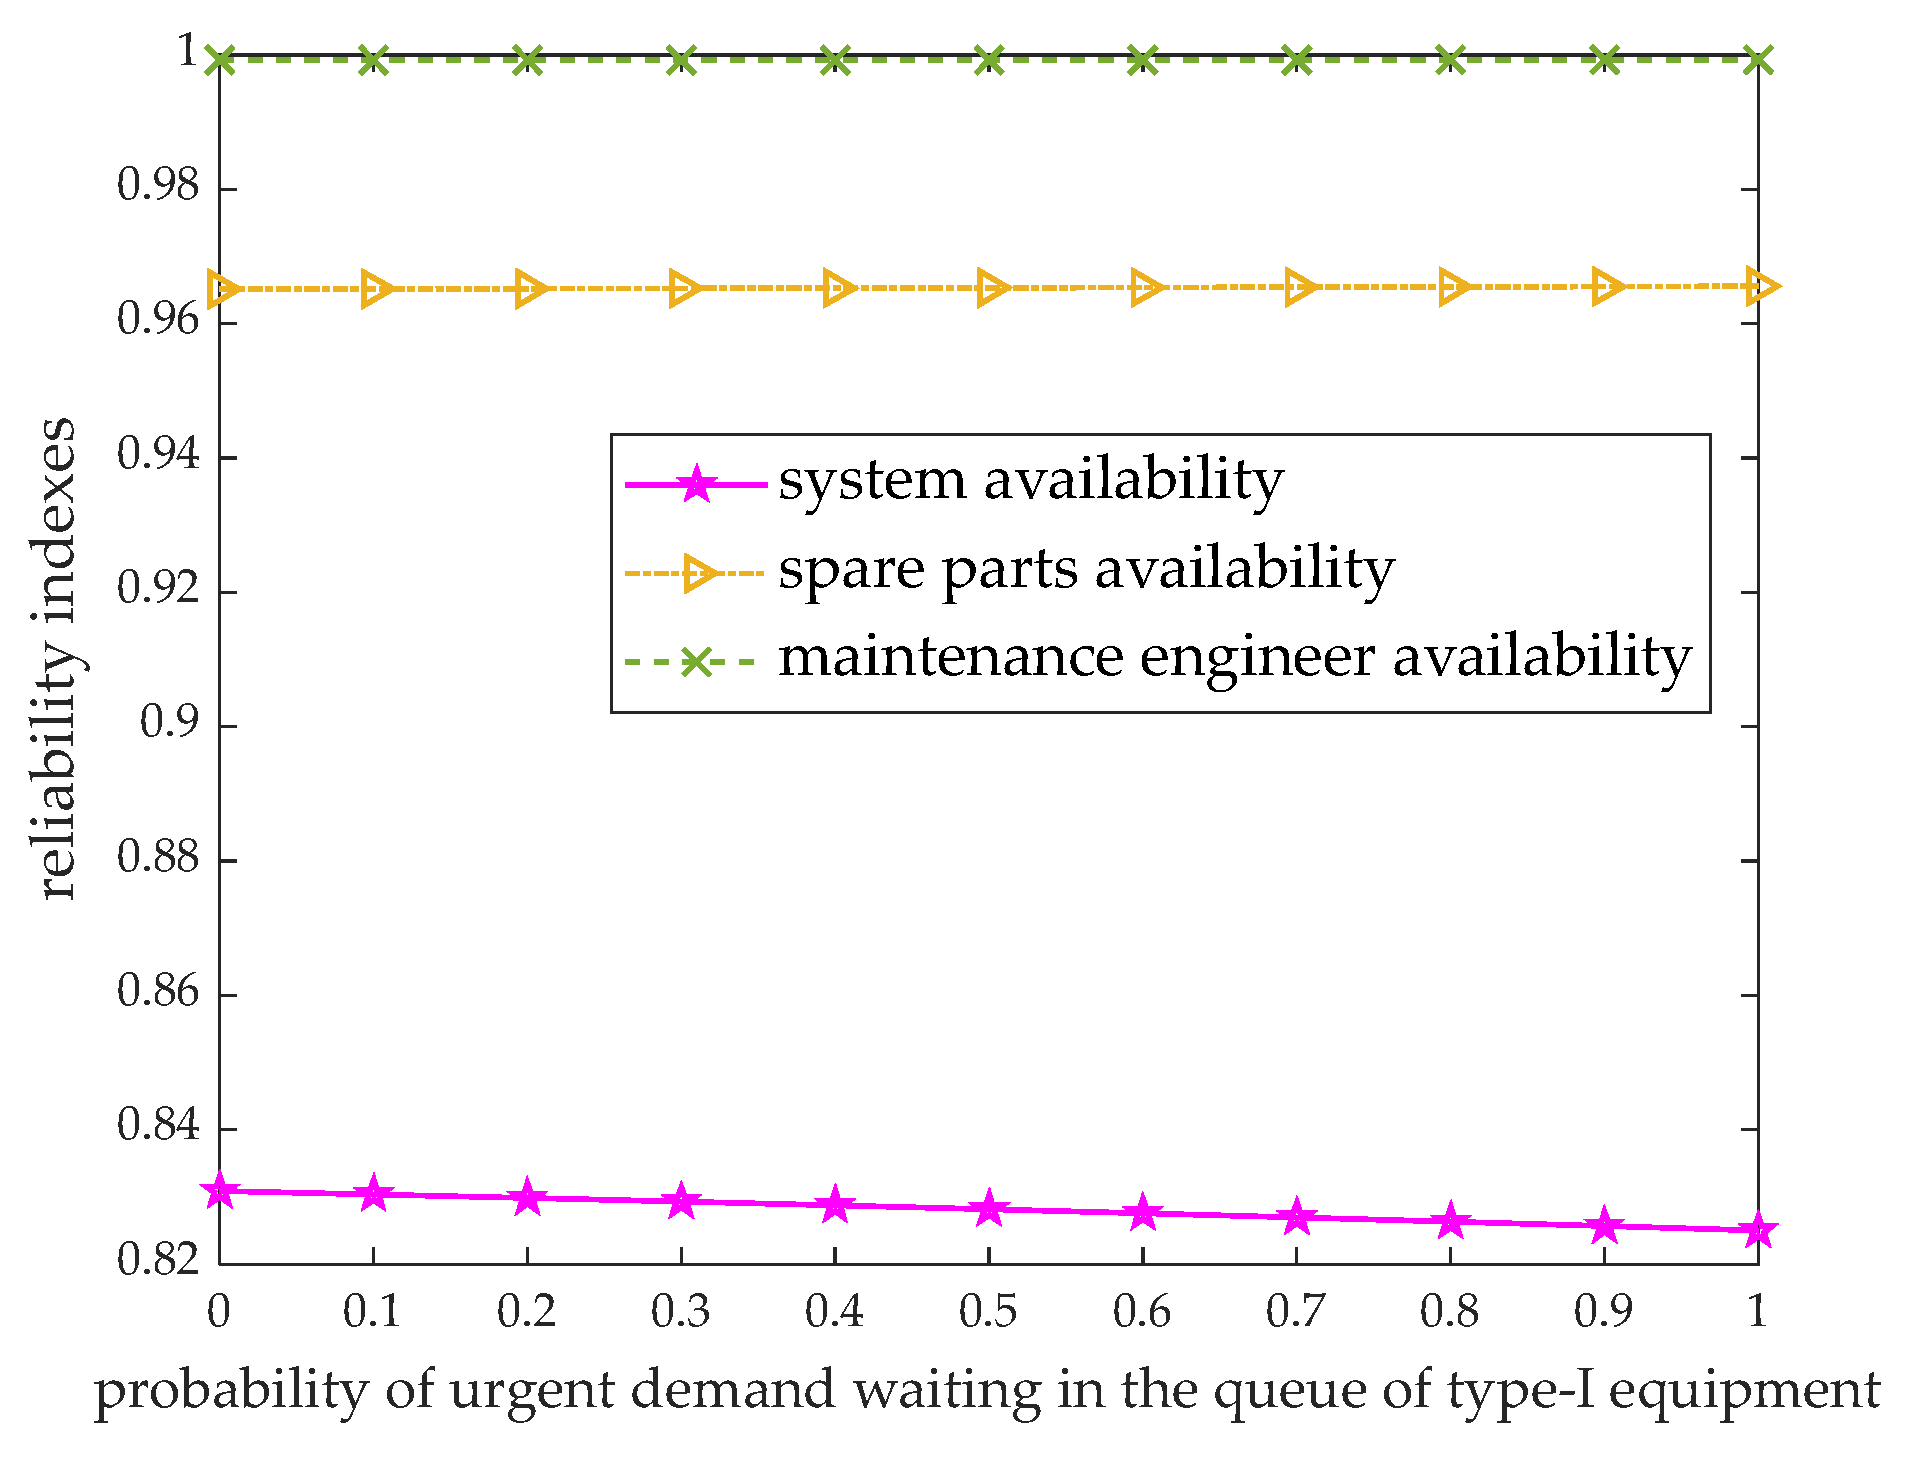
Figure 6 displays the changing tendency of the system reliability indexes along with the varying probability of urgent demand waiting in the queue of type-I emergency charging equipment. The system availability decreases with the larger P 11 , because a higher number of waiting customers may lead to the system reaching the maximum waiting capacity with a greater likelihood. The availabilities of spare parts and maintenance engineers have not been influenced significantly, which may result from the little effect of P 11 on the two abovementioned availabilities. In Figure 7, the influence of the probability of non-urgent demand staying in the queue of type-II emergency charging equipment P 22 on system probabilistic indexes is examined, and the analysis outcomes are similar to those when the probability P 11 varies.
Figure 7. Influence of P 22 on system reliability indexes.
Mathematics 11 03688 g007
Based on the preset values of A c * = 0.8 , A m * = 0.8 , E C * = 25 and c b = 3 , the impacts of c m ,   c h and c e on joint optimization policy and reliability indexes are presented in Table 6. By comparing the results of examples 1 and 2 in Table 6, the decreases in s , S and the three types of availability indexes stemmed from a higher cost of a maintenance activity c m , when k remains unchanged. It is notable that when c m is increased to 15 in example 3, the optimum number of engineers is reduced to 1 and the availability of maintenance engineers decreases significantly. The examples 1, 4 and 5 in Table 6 show that when the holding cost c h of a spare part inventory becomes greater, the decision variable S decreases monotonously and the three types of availability exhibit monotonous declines as well. Meanwhile, the optimal solutions of s and k may become smaller or remain unvarying. This indicates that relevant costs can be reasonably controlled by cutting down the quantity of spare parts in stock or the maintenance engineers, in order to ensure the total cost is within the budget range, under the increasing holding cost of an individual spare. On the other hand, it can be observed that the enhancement of the system availability can be gained through raising the stock quantity of spare parts and the workforce size of maintenance engineers, on the premise of keeping inventory costs within a certain range. Examples 1, 6 and 7 in Table 6 can be compared to present the effect of varying c e on the optimum settlement and reliability indexes. With the higher employment cost of engineers, the optimal number of hired maintenance engineers k and all availability indexes decrease owing to the restricted budget of the expected total cost. Furthermore, the expected cost expense gets raised as the increase in the cost of hiring an individual engineer.

6. Conclusions

This paper investigates the problem of jointly deriving the optimal maintenance and spare parts inventory strategies for emergency engineering equipment and introduces the demand priority as the principle to influence the service sequence. To be specific, there are two types of equipment in the model, which provide express service and regular service respectively. The urgent demands have a higher priority to be served and satisfied compared with non-urgent demands when they wait in line for the equipment offering express service simultaneously, due to the common social consciousness. By applying the Markov process imbedding method, the running process of the proposed system can be properly described and a group of probabilistic indexes related to system reliability can be derived analytically, such as the availability of the proposed service system, spare parts and maintenance engineer. Furthermore, a joint optimization model aiming at the maximization of the system availability is established to derive the optimal setting of the number of maintenance engineers and spare parts inventory strategy, under the constraints of maintenance engineer availability, spare parts availability and total cost. Then, the constructed optimization model is resolved via the utilization of the branch-and-bound technique. Finally, an engineering example of emergency charging equipment is introduced for the verification of the constructed model and the efficiency of the applied methods. In addition, we also analyze the impacts of various model parameters on the probabilistic indexes regarding system reliability by means of sufficient sensitivity analyses.
The directions of future study that are valuable to be further explored are listed as follows: (1) future work can consider the maintenance results completed by the engineers to have multiple possibilities with certain probabilities, which may include the perfect and imperfect maintenance actions; and (2) a more complex and comprehensive reliability model that considers multiple priority requirements can be constructed to further expand the developments of the reliability theory of complex systems with emergency engineering equipment.

Author Contributions

Conceptualization, X.W.; methodology, X.W. and R.N.; software, J.W. and R.N.; validation, X.W., J.W. and R.N.; writing—original draft preparation, J.W. and R.N.; writing—review and editing, X.W. and X.C.; supervision, X.W.; funding acquisition, X.W. All authors have read and agreed to the published version of the manuscript.

Funding

This research was funded by the National Natural Science Foundation of China (Grant Nos. 72001006, 72371003, 72131002 and 71971026), the Beijing Social Science Foundation (Grant No. 20GLC052), the Young Elite Scientist Sponsorship Program by Beijing Association for Science and Technology (Grant No. BYESS2023054) and the Project of Beijing Municipal University Teacher Team Construction Support Plan (No. BPHR20220104).

Data Availability Statement

The authors confirm that the data supporting the findings of this study are available within the article.

Conflicts of Interest

The authors declare no conflict of interest.

References

  1. Wang, X.Y.; Zhao, X.; Wang, S.Q.; Sun, L.P. Reliability and maintenance for performance-balanced systems operating in a shock environment. Reliab. Eng. Syst. Saf. 2020, 195, 106705. [Google Scholar] [CrossRef]
  2. Dui, H.Y.; Yang, X.J.; Fang, Y.N. Evaluation methodology for preventive maintenance in multi-state manufacturing systems considering different costs. Int. J. Prod. Res. 2022. [Google Scholar] [CrossRef]
  3. Li, J.L.; Yin, G.H.; Wang, X.F.; Yan, W.X. Automated decision making in highway pavement preventive maintenance based on deep learning. Autom. Constr. 2022, 135, 104111. [Google Scholar] [CrossRef]
  4. Wang, S.Q.; Zhao, X.; Wu, C.S.; Wang, X.Y. Joint optimization of multi-stage component reassignment and preventive maintenance for balanced systems considering imperfect maintenance. Reliab. Eng. Syst. Saf. 2023, 237, 109367. [Google Scholar] [CrossRef]
  5. Dong, E.Z.; Gao, T.L.; Cheng, Z.H.; Wang, R.C.; Bai, Y.S. Opportunistic maintenance strategy for complex equipment with a genetic algorithm considering failure dependence: A two-dimensional warranty perspective. Sensors 2022, 22, 6801. [Google Scholar] [CrossRef]
  6. Li, H.; Huang, C.G.; Soares, C.G. A real-time inspection and opportunistic maintenance strategies for floating offshore wind turbines. Ocean Eng. 2022, 256, 111433. [Google Scholar] [CrossRef]
  7. Broek, M.; Teunter, R.H.; de Jonge, B.; Veldman, J. Joint condition-based maintenance and condition-based production optimization. Reliab. Eng. Syst. Saf. 2021, 214, 107743. [Google Scholar] [CrossRef]
  8. Zheng, R.; Makis, V. Optimal condition-based maintenance with general repair and two dependent failure modes. Comput. Ind. Eng. 2020, 141, 106322. [Google Scholar] [CrossRef]
  9. Shen, J.Y.; Cui, L.R.; Ma, Y.Z. Availability and optimal maintenance policy for systems degrading in dynamic environments. Eur. J. Oper. Res. 2019, 276, 133–143. [Google Scholar] [CrossRef]
  10. Liu, Q.N.; Ma, L.; Wang, N.C.; Chen, A.K.; Jiang, Q.H. A condition-based maintenance model considering multiple maintenance effects on the dependent failure processes. Reliab. Eng. Syst. Saf. 2022, 220, 108267. [Google Scholar] [CrossRef]
  11. Dui, H.Y.; Zhang, C.; Tian, T.Z.; Wu, S.M. Different costs-informed component preventive maintenance with system lifetime changes. Reliab. Eng. Syst. Saf. 2022, 228, 108755. [Google Scholar] [CrossRef]
  12. Tusar, M.I.H.; Sarker, B.R. Spare parts control strategies for offshore wind farms: A critical review and comparative study. Wind Eng. 2022, 46, 1629–1656. [Google Scholar] [CrossRef]
  13. Dendauw, P.; Goeman, T.; Claeys, D.; De Turck, K.; Fiems, D.; Bruneel, H. Condition-based critical level policy for spare parts inventory management. Comput. Ind. Eng. 2021, 157, 107369. [Google Scholar] [CrossRef]
  14. Zhou, Y.L.; Li, H.; Hu, S.Q.; Yu, X.Z. Two-stage supply chain inventory management based on system dynamics model for reducing bullwhip effect of sulfur product. Ann. Oper. Res. 2022. [Google Scholar] [CrossRef]
  15. Zhang, Z.X.; Zhang, J.X.; Du, D.B.; Li, T.M.; Si, X.S. A lifetime estimation method for multi-component degrading systems with deteriorating spare parts. Reliab. Eng. Syst. Saf. 2023, 238, 109427. [Google Scholar] [CrossRef]
  16. Yan, T.; Lei, Y.; Wang, B.; Han, T.; Si, X.; Li, N. Joint maintenance and spare parts inventory optimization for multi-unit systems considering imperfect maintenance actions. Reliab. Eng. Syst. Saf. 2020, 202, 106994. [Google Scholar] [CrossRef]
  17. Zhao, F.; Liu, X.; Peng, R.; Kang, J. Joint optimization of inspection and spare ordering policy with multi-level defect information. Comput. Ind. Eng. 2020, 139, 106205. [Google Scholar] [CrossRef]
  18. Zhang, J.X.; Du, D.B.; Si, X.S.; Hu, C.H.; Zhang, H.W. Joint optimization of preventive maintenance and inventory management for standby systems with hybrid-deteriorating spare parts. Reliab. Eng. Syst. Saf. 2021, 214, 107686. [Google Scholar] [CrossRef]
  19. Cai, B.P.; Wang, Y.D.; Zhang, Y.P.; Liu, Y.L.; Ge, W.F.; Li, R.K.; Liu, Y.H.; Liu, G.J. Condition-based maintenance method for multi-component system based on RUL prediction: Subsea tree system as a case study. Comput. Ind. Eng. 2022, 173, 108650. [Google Scholar] [CrossRef]
  20. Zahedi-Hosseini, F.; Scarf, P.; Syntetos, A. Joint maintenance-inventory optimisation of parallel production systems. J. Manuf. Syst. 2018, 48, 73–86. [Google Scholar] [CrossRef]
  21. Salmasnia, A.; Talesh-Kazemi, A. Integrating inventory planning, pricing and maintenance for perishable products in a two-component parallel manufacturing system with common cause failures. Oper. Res. 2022, 22, 1235–1265. [Google Scholar] [CrossRef]
  22. Zhu, M.X.; Zhou, X.J. Hybrid opportunistic maintenance policy for serial-parallel multi-station manufacturing systems with spare part overlap. Reliab. Eng. Syst. Saf. 2023, 236, 109304. [Google Scholar] [CrossRef]
  23. Wang, J.; Zhu, X.Y. Joint optimization of condition-based maintenance and inventory control for a k-out-of-n: F system of multi-state degrading components. Eur. J. Oper. Res. 2021, 290, 514–529. [Google Scholar] [CrossRef]
  24. Zheng, M.M.; Lin, J.; Xia, T.B.; Liu, Y.; Pan, E.R. Joint condition-based maintenance and spare provisioning policy for a K-out-of-N system with failures during inspection intervals. Eur. J. Oper. Res. 2023, 308, 1220–1232. [Google Scholar] [CrossRef]
  25. Zhu, X.Y.; Wang, J.; Coit, D.W. Joint optimization of spare part supply and opportunistic condition-based maintenance for onshore wind farms considering maintenance route. IEEE Trans. Eng. Manag. 2022. [Google Scholar] [CrossRef]
  26. Wang, J.J.; Qiu, Q.G.; Wang, H.H. Joint optimization of condition-based and age-based replacement policy and inventory policy for a two-unit series system. Reliab. Eng. Syst. Saf. 2021, 205, 107251. [Google Scholar] [CrossRef]
  27. Liu, X.B.; Yang, T.J.; Pei, J.; Liao, H.T.; Pohl, E.A. Replacement and inventory control for a multi-customer product service system with decreasing replacement costs. Eur. J. Oper. Res. 2019, 273, 561–574. [Google Scholar] [CrossRef]
  28. Yi, H.; Cui, L.R. A new computation method for signature: Markov process method. Nav. Res. Log. 2018, 65, 410–426. [Google Scholar] [CrossRef]
  29. Cui, L.R.; Gao, H.D.; Mo, Y.C. Reliability for k-out-of-n: F balanced systems with m sectors. IISE Trans. 2018, 50, 381–393. [Google Scholar] [CrossRef]
  30. Zhao, X.; Zhang, J.; Wang, X.Y. Joint optimization of components redundancy, spares inventory and repairmen allocation for a standby series system. Proc. Inst. Mech. Eng. Part O-J. Risk Reliab. 2019, 233, 623–638. [Google Scholar] [CrossRef]
  31. Dui, H.Y.; Lu, Y.H.; Gao, Z.F.; Xing, L.D. Performance efficiency and cost analysis of multi-state systems with successive damage and maintenance in multiple shock events. Reliab. Eng. Syst. Saf. 2023, 238, 109403. [Google Scholar] [CrossRef]
  32. Wang, X.Y.; Ning, R.; Zhao, X.; Wu, C.S. Reliability assessments for two types of balanced systems with multi-state protective devices. Reliab. Eng. Syst. Saf. 2023, 229, 108852. [Google Scholar] [CrossRef]
  33. Zhao, X.; Li, Z.Y.; Wang, X.Y.; Guo, B. Reliability of performance-based system containing multiple load-sharing subsystems with protective devices considering protection randomness. Reliab. Eng. Syst. Saf. 2023, 239, 109508. [Google Scholar] [CrossRef]
  34. Song, Y.B.; Wang, X.Y. Reliability analysis of the multi-state k-out-of-n: F systems with multiple operation mechanisms. Mathematics 2022, 10, 4615. [Google Scholar] [CrossRef]
  35. Wu, C.S.; Zhao, X.; Wang, X.Y.; Wang, S.Q. Reliability analysis of performance-based balanced systems with common bus performance sharing. Reliab. Eng. Syst. Saf. 2021, 215, 107865. [Google Scholar] [CrossRef]
  36. Wang, X.Y.; Zhao, X.; Wu, C.S.; Lin, C. Reliability assessment for balanced systems with restricted rebalanced mechanisms. Comput. Ind. Eng. 2020, 149, 106801. [Google Scholar] [CrossRef]
  37. Wang, X.Y.; Ning, R.; Zhao, X.; Zhou, J. Reliability evaluations for a multi-state k-out-of-n: F system with m subsystems supported by multiple protective devices. Comput. Ind. Eng. 2022, 171, 108409. [Google Scholar] [CrossRef]
  38. Xie, W.; Liao, H.T.; Jin, T.D. Maximizing system availability through joint decision on component redundancy and spares inventory. Eur. J. Oper. Res. 2014, 237, 164–176. [Google Scholar] [CrossRef]
  39. Abdelmaguid, T.F. Bi-objective dynamic multiprocessor open shop scheduling for maintenance and healthcare diagnostics. Expert Syst. Appl. 2021, 186, 115777. [Google Scholar] [CrossRef]
  40. Yu, V.F.; Salsabila, N.Y.; Siswanto, N.; Kuo, P.H. A two-stage genetic algorithm for joint coordination of spare parts inventory and planned maintenance under uncertain failures. Appl. Soft. Comput. 2022, 130, 109705. [Google Scholar] [CrossRef]
  41. Yang, M.; Li, C.B.; Tang, Y.; Xiong, M.K. Availability-oriented maintenance strategy of key equipment in automated production line considering performance degradation. IEEE Robot. Autom. Lett. 2023, 8, 3182–3189. [Google Scholar] [CrossRef]
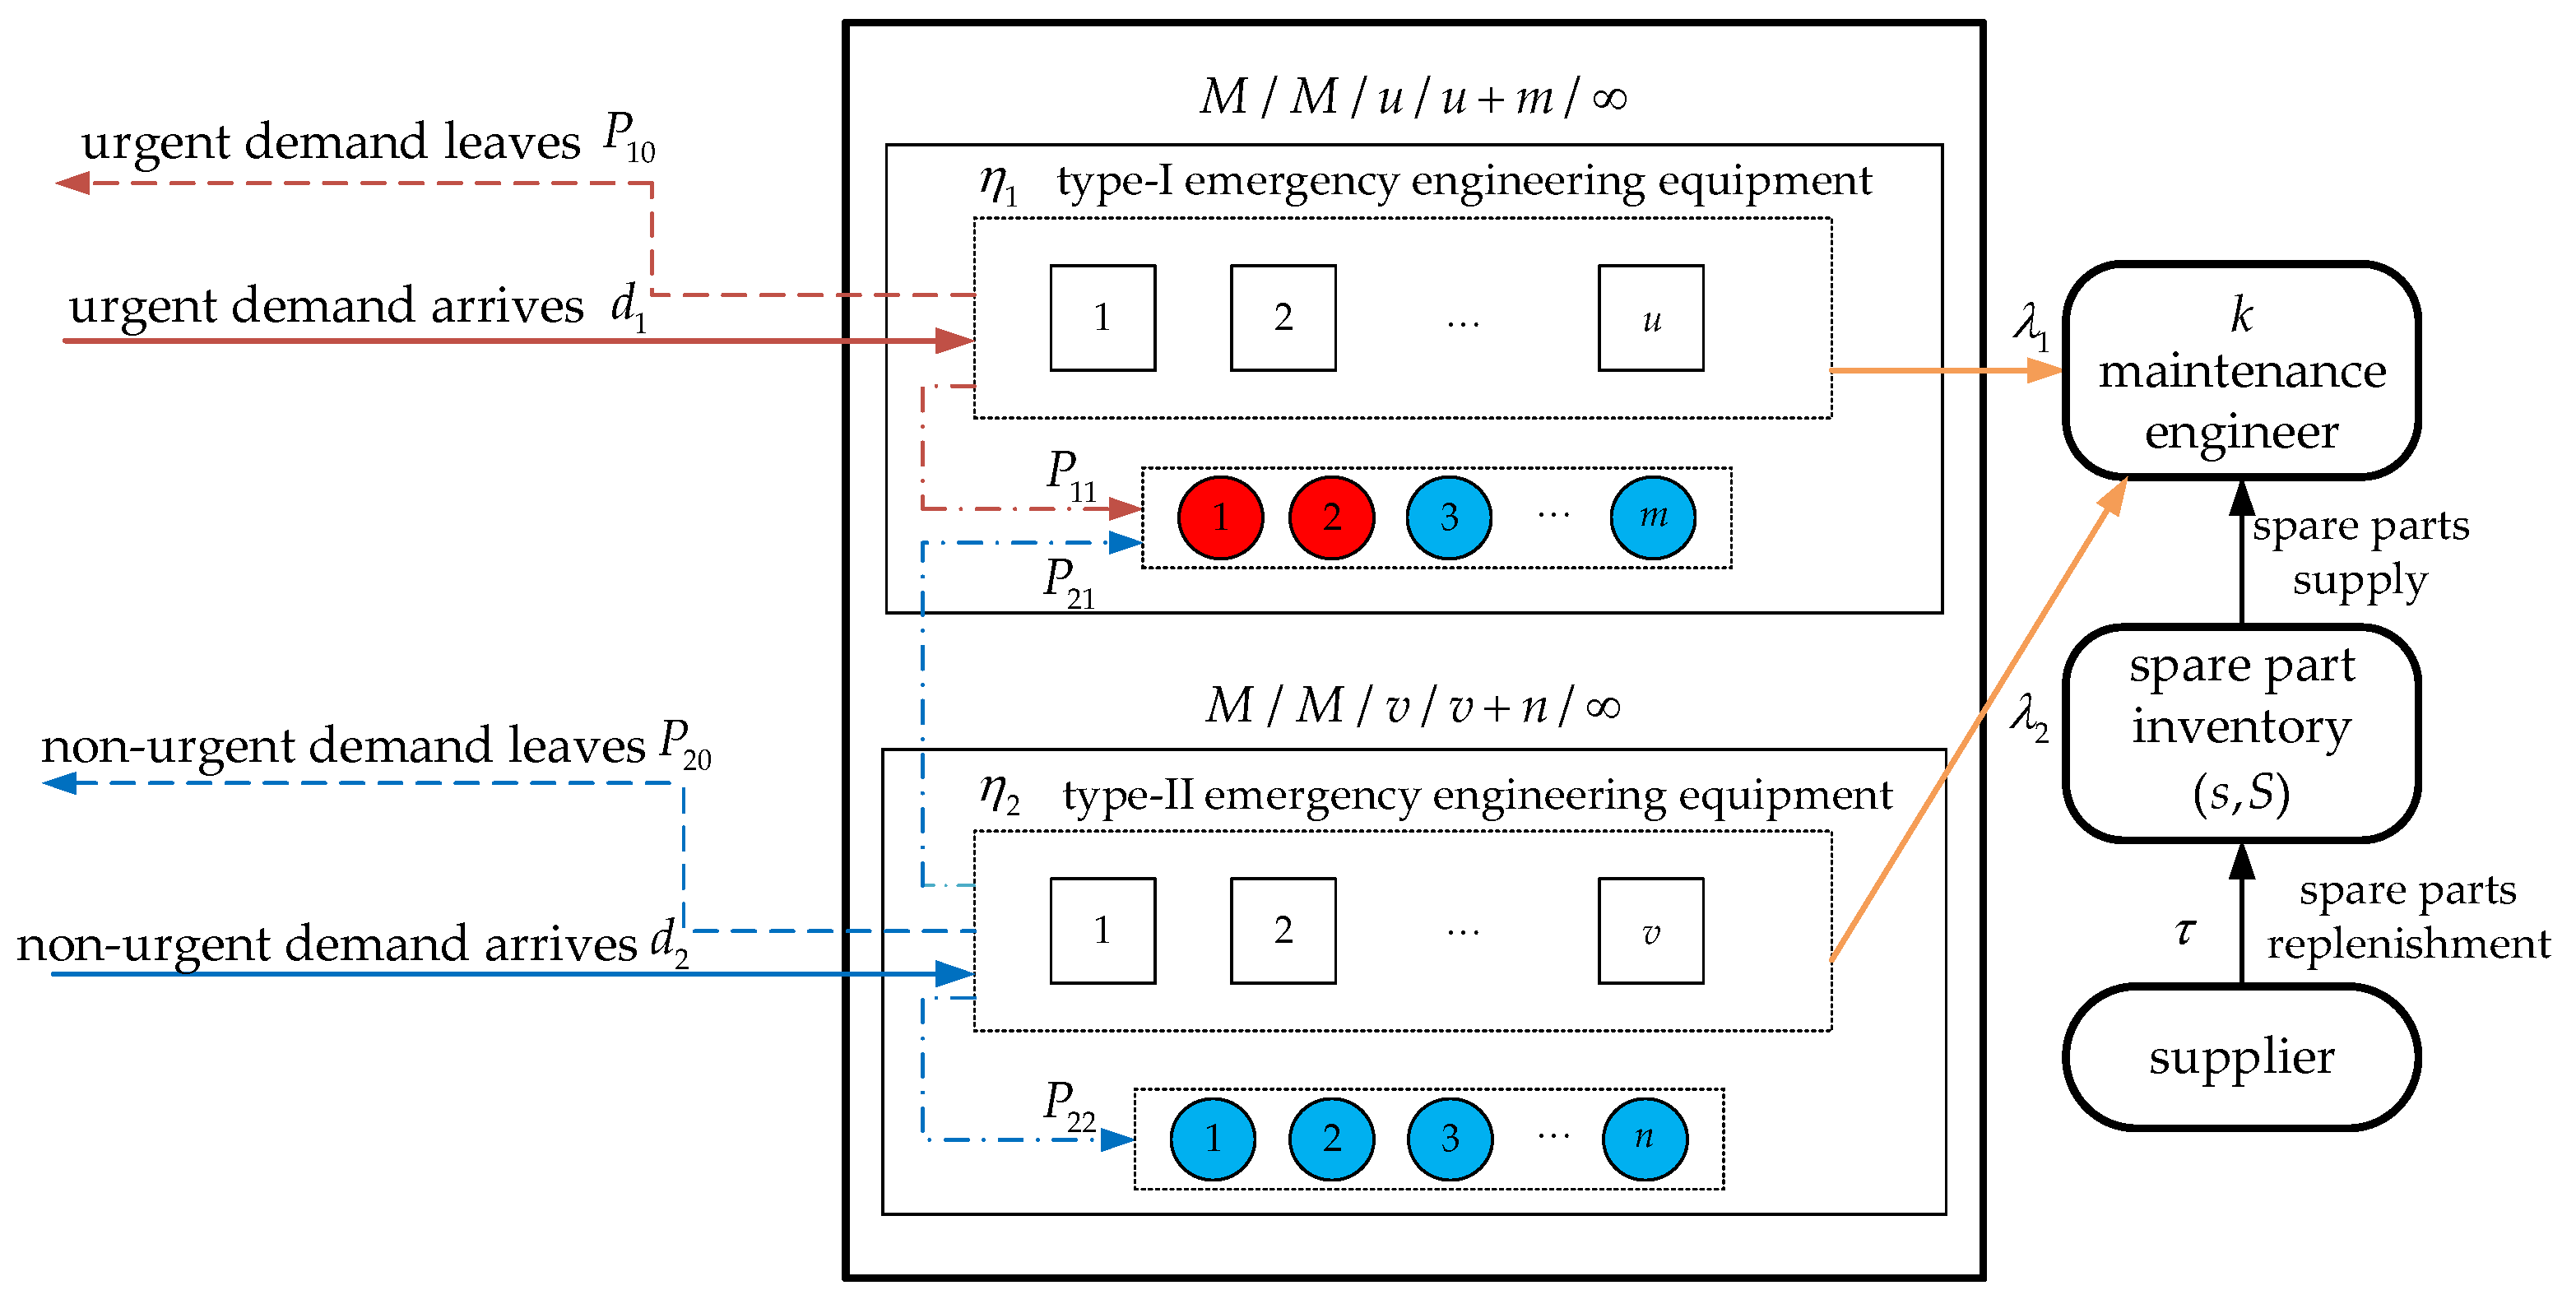
Figure 1. Operation process of the service station with emergency engineering equipment.
Mathematics 11 03688 g001
Figure 2. Process of obtaining optimal joint optimization policy.
Mathematics 11 03688 g002
Figure 3. Influence of ω 1 on system reliability indexes.
Mathematics 11 03688 g003
Figure 4. Influence of λ 2 on system reliability indexes.
Mathematics 11 03688 g004
Table 1. Comparisons between illustrative previous studies and this study.
StudySystem StructureOptimized PolicyMethodologyDemand
Priority
Ref. [16]Series system with identical unitsPreventive maintenance (PM) and inventoryStochastic dynamic programming and simulationNone
Ref. [17]Single-unit systemCondition-based maintenance (CBM) and threshold of ordering sparesEnumeration algorithmNone
Ref. [18]Standby systemPM and inventorySimulationNone
Ref. [19]Multi-component systemCBM and inventoryGenetic algorithmNone
Refs. [20,21,22]Parallel or series-parallel systemPM and inventory [20,21];
Opportunistic maintenance and inventory [22]
Simulation [20];
Particle swarm optimization [21];
Hierarchical optimization [22]
None
Refs. [23,24,25,26]k-out-of-n: F system [23,24];
Onshore Wind Farm [25];
Two-unit series system [26]
CBM and inventoryMarkov decision process (MDP) and dynamic programming [23]; MDP and value iteration [24];
Clustering and simulation [25];
Semi-MDP [26]
None
Ref. [27]Use-oriented product service system CBM and inventoryMDP and sequential heuristic solutionNone
This paperService system with two types of equipmentCorrective maintenance engineer allocation and inventoryMarkov process imbedding and branch-and-bound methodUrgent demands given higher priority
Table 2. Explanations for transition rules (1–6).
RuleCommon TriggerDistinctive ConditionTransitionRate
(1)An urgent demand arrives (1) Type-I equip. is available. o 1 o 1 + 1 d 1
(2) (2) Demand waits in type-I queue due to the unavailability of type-I equip. c 1 j c 1 j + 1 d 1 P 11
(3)A non-urgent demand arrives (3) Type-II equip. is available. o 2 o 2 + 1 d 2
(4) (4) Type-II and type-I equip. is unavailable and available, respectively. o 1 o 1 + 1 d 2 P 21
(5) (5) Demand waits in type-I queue due to the unavailability of type-I and type-II equip. c 1 f c 1 f + 1 d 2 P 21
(6) (6) Demand waits in type-II queue due to the unavailability of type-II equip. c 2 c 2 + 1 d 2 P 22
Table 3. Explanations for transition rules (7–13).
RuleCommon TriggerDistinctive ConditionTransitionRate
(7)A piece of equip. fails (7) A piece of type-I equip. fails. f 1 f 1 + 1 ( u o 1 f 1 ) λ 1
(8) (8) A piece of type-II equip. fails. f 2 f 2 + 1 ( v o 2 f 2 ) λ 2
(9)A piece of type-I equip. completes the service (9) There is no waiting demand. o 1 o 1 1 o 1 η 1
(10) (10) There exists at least one waiting urgent demand. c 1 j c 1 j 1 o 1 η 1
(11) (11) There is no waiting urgent demand but at least one waiting non-urgent demand. c 1 f c 1 f 1 o 1 η 1
(12)A piece of type-II equip. completes the service (12) There is no waiting demand. o 2 o 2 1 o 2 η 2
(13) (13) There exists at least one waiting non-urgent demand. c 2 c 2 1 o 2 η 2
Table 4. Explanations for transition rules (14–18).
RuleCommon TriggerDistinctive ConditionTransitionRate
(14)A piece of type-I equip. is completely repaired (14) There is no waiting demand. f 1 f 1 1 ,
q q 1
min { f 1 , q , k } ω 1
(15) (15) There exists at least one waiting urgent demand. o 1 o 1 + 1 ,
f 1 f 1 1 ,
c 1 j c 1 j 1 ,
q q 1
min { f 1 , q , k } ω 1
(16) (16) There is no waiting urgent demand but at least one waiting non-urgent demand. o 1 o 1 + 1 ,
f 1 f 1 1 ,
c 1 f c 1 f 1 ,
q q 1
min { f 1 , q , k } ω 1
(17)A piece of type-II equip. is completely repaired (17) There is no waiting demand. f 2 f 2 1 ,
q q 1
min { f 2 , q , k } ω 2
(18) (18) There exists at least one waiting non-urgent demand. o 2 o 2 + 1 ,
f 2 f 2 1 ,
c 2 c 2 1 ,
q q 1
min { f 2 , q , k } ω 2
Table 5. Operation and maintenance parameters of emergency charging equipment system.
d 1 d 2 P 10 P 11 P 20 P 21 P 22 η 1 η 2 λ 1 λ 2 ω 1 ω 2 τ
540.50.50.50.250.25971.5112109
Table 6. Influence of c m ,   c h and c e on joint optimization policy and reliability indexes.
No. c m c h c e Joint Optimization PolicyReliability Indexes E C
1738 ( s , S ) = ( 1 , 3 )
k = 2
A s = 0.8247
A c = 0.9491
A m = 0.9894
23.8372
2138 ( s , S ) = ( 2 , 4 )
k = 2
A s = 0.8318
A c = 0.9848
A m = 0.9932
24.4232
31538 ( s , S ) = ( 3 , 5 )
k = 1
A s = 0.8215
A c = 0.9952
A m = 0.9127
24.6996
4718 ( s , S ) = ( 4 , 5 )
k = 2
A s = 0.8343
A c = 0.9975
A m = 0.9946
22.9336
57108 ( s , S ) = ( 1 , 2 )
k = 1
A s = 0.8027
A c = 0.8925
A m = 0.8777
21.9344
6731 ( s , S ) = ( 4 , 5 )
k = 3
A s = 0.8347
A c = 0.9975
A m = 0.9998
18.0879
77317 ( s , S ) = ( 1 , 3 )
k = 1
A s = 0.8120
A c = 0.9433
A m = 0.8949
24.7137
Disclaimer/Publisher’s Note: The statements, opinions and data contained in all publications are solely those of the individual author(s) and contributor(s) and not of MDPI and/or the editor(s). MDPI and/or the editor(s) disclaim responsibility for any injury to people or property resulting from any ideas, methods, instructions or products referred to in the content.