Article

Random Forest Regression in Predicting Students’ Achievements and Fuzzy Grades

Faculty of Education, University of Primorska, 5-6000 Koper, Slovenia
*
Author to whom correspondence should be addressed.
Mathematics 2023, 11(19), 4129; https://doi.org/10.3390/math11194129
Submission received: 4 September 2023 / Revised: 23 September 2023 / Accepted: 26 September 2023 / Published: 29 September 2023
(This article belongs to the Section Fuzzy Sets, Systems and Decision Making)

Abstract

:
The use of fuzzy logic to assess students’ knowledge is not a completely new concept. However, despite dealing with a large quantity of data, traditional statistical methods have typically been the preferred approach. Many studies have argued that machine learning methods could offer a viable alternative for analyzing big data. Therefore, this study presents findings from a Random Forest (RF) regression analysis to understand the influence of demographic factors on students’ achievements, i.e., teacher-given grades, students’ outcomes on the national assessment, and fuzzy grades, which were obtained as a combination of the two. RF analysis showed that demographic factors have limited predictive power for teacher-assigned grades, unlike INVALSI scores and fuzzy grades. School type, macroregion, and ESCS are influential predictors, whereas gender and origin have a lesser impact. The study highlights regional and socio-economic disparities, influencing both student outcomes and fuzzy grades, underscoring the need for equitable education. Unexpectedly, gender’s impact on achievements is minor, possibly due to gender-focused policies. Although the study acknowledges limitations, its integration of fuzzy logic and machine learning sets the foundation for future research and policy recommendations, advocating for diversified assessment approaches and data-driven policymaking.

1. Introduction

Evaluating the accomplishments of students holds a central position within educational processes [1]. This evaluation serves as a vital feedback mechanism for educators, students, parents, institutions, and policymakers, shedding light on the effectiveness of instruction quality [2]. A significant role in this assessment landscape, driving educational reforms and policy changes, is played by large-scale assessments of students’ knowledge [3]. Among these, national assessments have a pivotal role in shaping a country’s educational reforms [4]. In this context, the focus of this discussion narrows down to the national assessments of mathematical knowledge. For the aforementioned reasons, it becomes of paramount importance to fully understand which factors might influence students’ achievements.
By conducting predictive investigations, it becomes feasible to furnish strategic insights concerning the quality of teaching and learning. Such studies offer the means to assess the degree to which variables forecast educational results [5,6]. Notably, predictive studies serve as valuable tools for comprehending the impact of factors such as school atmosphere, teaching methodologies, and individual student attributes (such as gender, socio-economic status, etc. [5]). The findings yielded by predictive studies hold potential utility for policymakers, informing their decisions within educational policies [6].
Despite the significance of predictive studies aimed at comprehending the factors influencing students’ achievements in mathematics, it should be noted that the matter of how to assess students’ knowledge remains unresolved. For example, policymakers might focus solely on students’ performance in standardized (national) assessments of knowledge, or conversely, on teacher-assigned grades. To gain a more comprehensive understanding of students’ competencies and knowledge, the literature has suggested merging these two evaluations [7,8]. However, combining them might introduce an additional challenge, as teacher-assigned grades, despite usually being represented as numerical values, essentially entail verbal and linguistic descriptions of students’ knowledge levels, often lacking clarity. To address this, the literature has recommended the utilization of the mathematical framework of fuzzy logic, designed precisely for handling ambiguous, verbal data [9,10,11,12,13,14,15,16,17]. Consequently, this paper employed methodologies rooted in fuzzy logic to combine (1) students’ performance in the national assessment of mathematical knowledge and (2) teacher-assigned mathematics grades.
Hence, employing fuzzy logic may offer educators a more comprehensive perspective on students’ knowledge and competencies. Nonetheless, it is essential to acknowledge that even with the suggested improvements concerning students’ achievements, predictive studies commonly rely on traditional statistical methodologies, such as linear and multiple regressions [18]. These conventional tools might not be apt for accurately predicting large volumes of data, which is often the case when analyzing national and large-scale assessments [19,20]. Therefore, the current study focused on utilizing a specific machine learning technique to analyze data from the Italian National Assessment of Mathematical Knowledge, INVALSI, specifically through Random Forest (RF) regression analysis [19,21]. Therefore, the objective of this paper is to comprehensively examine the influence of multiple factors on various aspects of students’ educational outcomes using modern machine learning methodology.

1.1. The Italian Context

1.1.1. Teacher-Given Grades and the INVALSI Test

In Italian secondary education, comprising middle school (grades 6–8) and high school (grades 9–13), teachers assign numerical grades that range from a minimum of 1 to a maximum of 10, with 10 representing the highest grade. Grades below 6 are considered “failing grades”, while grades equal to or greater than 6 are considered “passing grades”. Teachers propose students’ final grades. However, it is the responsibility of the class councils (comprising all schoolteachers teaching a particular class) to approve or modify the proposed grades.
Each subject’s assessment can occur in one of three ways: (1) through written and oral evaluations, (2) solely written evaluations, or (3) only oral evaluations. Written evaluations entail more intricate written tests, while oral evaluations involve assessments such as oral exams, homework, projects, exercises, or shorter written tests. The preferred assessment method is determined by high school class councils, resulting in students receiving either one (oral or written) or two grades (both oral and written) in each subject. In contrast, middle school students receive only a single grade on their report cards (either oral or written). In the present research, we decided to focus on students’ oral grades since they might contain a more multifaceted picture of students’ knowledge and competencies.
Every academic year, the INVALSI institute assesses the entire population of Italian students in the 2nd (with an average age of 7 years), 5th (10 years old), 8th (13 years old), 10th (15 years old), and starting from the 2018–2019 school year, also in the 13th (18 years old) grades. Consequently, students are obligated to participate in the mandatory nationwide standardized assessment of mathematical proficiency [22]. This standardized evaluation gauges students’ comprehension of mathematical concepts outlined in the National curriculum guidelines. These documents encompass the topics that math educators are required to teach in secondary and high school settings [22].
The national assessment INVALSI comprises several questions that vary each year (typically ranging from 30 to 45 items), encompassing both closed and open-ended formats. Students in grades 8, 10, and 13 undertake the computerized version of the test [22]. Additionally, questions are chosen automatically and at random from a question database, thereby minimizing the potential for academic dishonesty. As the selected questions share equal difficulty, the tests are deemed equivalent and comparable [22]. The results obtained by students in the INVALSI test are quantitatively measured on a Rasch scale, where the mean is set at 200 and the standard deviation at 40.
The Rasch scale is a mathematical model used for the analysis of data from standardized tests and other measurement instruments. It helps in understanding and interpreting test results. The Rasch model is based on Item Response Theory (IRT) and is used to estimate the abilities or traits of individuals and the difficulty levels of test items on a common interval scale [23,24]. In particular, a standardized test comprises a set of items that are designed to measure a specific trait or ability, in our case it is mathematical proficiency. Each item has a set of response options (e.g., multiple-choice answers or rating scales). Individuals’ responses to these items are scored, typically assigning a score of 1 for a correct response and 0 for an incorrect response. The Rasch model estimates two key parameters: (1) person parameters (which represent the abilities or traits of the individuals being assessed; they are expressed on a log-odds scale), and (2) item parameters (which represent the difficulty levels of the test items; they are expressed on a log-odds scale). The model calculates the probability that an individual with a certain ability level will answer a particular item correctly [24]. This probability depends on the difference between the individual’s ability and the item’s difficulty. The Rasch model then transforms the raw scores (e.g., the number of correct answers) into interval scale measures. This transformation ensures that the measures are on a consistent scale across different items and tests. The main advantage of the Rasch scale is the ability to compare individuals’ abilities and item difficulties on the same scale, which simplifies the interpretation of test results [23,24]. In the Italian context, students’ achievements on the INVALSI tests are expressed as a continuous variable that has been obtained using the Rasch model.

1.1.2. Factors Influencing Students’ Achievements on the INVALSI Test

While serving as essential tools to gauge the quality of the education system, national assessments of students’ mathematical knowledge are influenced by various factors [25]. Gender, for instance, emerges as a significant determinant in national mathematics assessments, as indicated in the literature [26,27,28]. Specifically, there is a consistent pattern of boys achieving higher scores on these assessments, notably in Italy, where the gender disparity in mathematical achievement becomes evident from the early years of primary schooling [27,28,29].
Furthermore, the socio-economic, cultural, and familial backgrounds of students (Economic, Social, and Cultural Status, ESCS) exhibit a strong correlation with their academic achievements [25]. Higher ESCS consistently corresponds to better performance in mathematics, a trend that holds true even within the Italian context [28,30,31,32]. These factors, in turn, display regional variations across Italy, with northern regions generally demonstrating higher ESCS compared to their southern counterparts [33]. Additionally, disparities in achievement levels are observed across different Italian macroregions in the context of national assessments of mathematical knowledge [31,32,34], with students from northern Italy typically outperforming those from the southern regions and islands.
Another critical consideration involves the variety of school types in Italy, each offering specialized education tailored to distinct career trajectories [27]. Lyceums (L) provide a comprehensive educational experience encompassing liberal arts, languages, and sciences. Among them, Scientific Lyceums (SL) place a strong emphasis on science and mathematics, preparing students for future careers in fields such as engineering, medicine, or research. Technical schools (TS) deliver focused training in areas such as mechanics, electronics, or tourism, equipping students with practical skills relevant to specific industries. Vocational schools (VS), on the other hand, prioritize technical and professional education, gearing students towards careers in domains such as catering, fashion, or administration. Available research indicates that students from distinct school types exhibit differing performance levels on the INVALSI math test, with those from SL showcasing the highest achievements, while students from VS show comparatively lower results [34].
Furthermore, the origin of students significantly influences their test outcomes. Research underscores that children of immigrants tend to attain lower scores [35,36,37,38], often linked to the language spoken at home and the socio-economic and cultural status of their families [39].

1.2. Research Aims

Although the international and Italian literature acknowledges the substantial impact of factors such as gender, regional disparities, differences in ESCS, school type, and students’ origin on standardized mathematics test outcomes, the precise significance of each factor in predicting (1) performance in national assessments, (2) teacher-given grades, and (3) the fuzzy combinations of the both remains relatively unexplored. This knowledge gap exists due to the absence of a dedicated statistical methodology designed to address this question [18].
In recent years, machine learning methods have gained traction for analyzing extensive educational assessment data, estimating the influence of individual factors, and constructing predictive models [40]. Among these techniques, the RF approach has been proposed to assess the significance of individual factors in predicting outcomes [18,19,21]. For instance, RF can be applied to identify key variables for predicting students’ mathematics achievements by incorporating student, teacher, and school-related factors [18].
This paper aims to investigate the influence of students’ gender, regional background, school type, socio-economic status (ESCS), and origin on their performance in the Italian National Assessment of Mathematical Knowledge (INVALSI), as well as their teacher-assigned mathematics grades and the composite fuzzy grades derived from their performance on the INVALSI mathematics test and teacher-assigned grades. To achieve this, the Random Forest (RF) methodology was applied to a sample of grade 13 students who participated in the INVALSI test during the 2018–2019 academic year (prior to the COVID-19 pandemic). Thus, the research questions addressed in this study are as follows:
RQ1: What is the extent of the predictive influence of gender, students’ ESCS, macroregion, school type, ESCS, and students’ origin on teacher-assigned mathematics grades?
RQ2: How much do gender, students’ ESCS, macroregion, school type, ESCS, and students’ origin contribute to predicting students’ achievements on the INVALSI mathematics test?
RQ3: What is the degree of predictive power exerted by gender, students’ ESCS, macroregion, school type, ESCS, and students’ origin on students’ fuzzy grades, which amalgamate both their INVALSI test results and teacher-assigned grades?

2. Related Work

2.1. Fuzzy Logic

Fuzzy logic emerges from the foundation of the fuzzy set theory pioneered by Iranian mathematician Lotfi A. Zadeh in 1965. This logic variant represents a significant augmentation to classical logic due to its versatile applications and its capacity to model situations involving imprecision [9,41]. Despite its name, which might evoke notions of imprecise or vague mathematical constructs, fuzzy logic operates within the framework of precise and rigorous mathematical principles [41]. In practical scenarios, fuzzy logic can be harnessed to formulate mathematical solutions for problems expressed in natural language, characterized by varying degrees of vagueness and uncertainty [9]. Fuzzy logic involves the computation of linguistic terms, empowering mathematical techniques to emulate various linguistic attributes associated with human cognition.
Due to its capacity to handle imprecise data, certain research endeavors have suggested the utilization of fuzzy logic for assessing students’ knowledge and competencies [9,11,12,14,15,17,42,43,44]. Specifically, teacher-assigned grades often stem from verbal assessments. For example, in Italy, where grades span from 1 to 10, a grade of “10” signifies “excellent”, while a grade of “6” indicates “sufficient”.
Hence, fuzzy logic serves as a mathematical instrument that educators and researchers can employ to amalgamate diverse variables expressed verbally and characterized by imprecision.
There are several compelling reasons motivating the adoption of fuzzy logic for student assessment. Firstly, teacher-assigned grades are typically articulated in verbal (linguistic) terms, and the assessment process is intricate, nonlinear, and laden with uncertainty [45]. Moreover, although students’ grades might be expressed numerically or in percentages, these representations stem from qualitative descriptions [45].
Secondly, a fuzzy-oriented assessment approach can potentially encompass more nuanced information than quantitative teacher-assigned grades, thus furnishing a more equitable and comprehensive measure of knowledge [12,45]. For the aforementioned reasons, the evaluation of students’ knowledge, which inherently encompasses imprecise data and subjective viewpoints, can find utility through the application of fuzzy logic.

2.1.1. Fuzzy Sets and Membership Functions

Definition 1.
A fuzzy set is a set  S  in a universal set  U , defined as a set of pairs  S = { s , μ S x : s U } , were  μ S : U [ 0 ,   1 ]  is a mapping known as the membership function of the fuzzy set  S .
Definition 2.
The value  μ S ( s ) , where  s U , is the degree of membership of the element  s  in the fuzzy set  S .
Among the most used membership functions, we mention the triangular, trapezoidal, and Gaussian.
Definition 3.
The triangular function for  α < β < γ  is defined as the following function:
T r i a n x , α , β , γ = 0 ; x α x γ x α β α ; x ( α , β ) γ x γ β ; x [ β , γ ) .
Definition 4.
The trapezoidal function for  α < β < γ < δ  is defined as the following function:
T r a p x , α , β , γ , δ = 0 ; x α x δ x α β α ; x ( α , β ) 1 ; x [ β , γ ] δ x δ γ ; x ( γ , δ ) .
Definition 5.
The Gaussian function for two parameters  μ  and  σ  is defined as follows:
G a u s s x , μ , σ = e x μ 2 2 σ 2 .
The triangular and trapezoidal membership functions are among the most popular [16]. Gaussian membership function is most adequate to represent uncertainty in the measurements [46].

2.1.2. The Fuzzy Inference System

The Fuzzy Inference System (FIS), commonly referred to as a fuzzy system, is a software application that employs fuzzy set theory and fuzzy inference technology to handle imprecise information [47]. The classical FIS comprises five fundamental components: defining inputs and outputs, establishing fuzzification strategies, constructing knowledge bases, designing fuzzy inference mechanisms, and performing defuzzification of output (Figure 1).
  • Defining Inputs and Outputs
Inputs and outputs correspond to the variables observed and the variables operated on, respectively. The process of defining inputs and outputs encompasses aspects such as determining parameters, the number of variables, and data formats.
  • Developing Fuzzification Strategies
Fuzzification involves assigning each input variable to a fuzzy set with a specific membership degree. Input variables can be either crisp (precise) values or fuzzy data with noise. Therefore, it is essential to consider the format of input variables when devising a fuzzification strategy. Fuzzy data are typically presented in discrete nominal formats or aggregate interval-value formats, which makes it challenging to mathematically define membership functions [47].
  • Constructing Knowledge Bases
A knowledge base comprises two components: a database and a rule base. The database includes features such as membership functions, scale transformation factors, and fuzzy set variables. The rule base encompasses fuzzy control conditions and fuzzy logic relationships [47].
  • Designing Fuzzy Inference Mechanisms
Fuzzy inference employs fuzzy control conditions and fuzzy logic to predict the future state of operational variables, serving as the core of an FIS. In FIS, syllogisms are commonly used for inference, which can be expressed as IF-THEN rules [41]. The inference result is determined through a combination of fuzzy conditions and fuzzy logic.
  • Defuzzifying Output
Typically, the result obtained from the FIS is a fuzzy value or set, which must be processed to derive a clear control signal or decision output. Commonly used defuzzification methods include maximum membership, weighted average, and center of gravity [47]. In the present work, the Mean of Maxima method was used. It is defined as follows:
Definition 6.
Let  M  be the set of all elements  s U  from the universal set, for which  μ S ( s )  assumes the maximum degree of membership. Let  M  be the cardinality of the set  M . Then the Mean of Maximum (MoM) is defined as:
M o M S = 1 M × x M x .

2.2. Fuzzy Logic in Education

During the process of evaluation, educators often grapple with situations of uncertainty when appraising students’ knowledge, prompting the potential of fuzzy logic to offer remedies for this challenge [9]. Over time, numerous applications of fuzzy logic have been suggested, such as generating student grades using two input values, specifically their performance in two exams [11], and evaluating students’ knowledge by factoring in the results of three exams, one of which was practical in nature [42], develop a model for assessing student knowledge by considering multiple factors that might impact final performance, including the originality of students’ work [48], introduce a model for appraising students’ comprehension, incorporating their grades and attendance records [17], etc.
For instance, Petrudi et al. [42] developed a model for assessing students’ knowledge through fuzzy logic, which incorporated three exam outcomes, including a practical exam. The authors argue that fuzzy logic allows for a more accurate assessment of students’ performance. In a similar vein, Barlyabayev et al. [10] employed a knowledge assessment model based on four factors: lecture evaluation, practical evaluation, self-work by students, and a final control exam. Their research revealed a strong and positive correlation between the fuzzy grading model and traditional grading. However, the advantage of using the fuzzy grading system lies in the application of inference rules rather than in calculating the means of individual exams. This approach can accommodate exams expressed on different measuring scales, eliminating the need for standardization.
The researchers determined that student assessment methods incorporating fuzzy logic could yield more refined insights into individual performance, leading to enhanced evaluations of students’ learning trajectories [9,13,15,16,17,42,48].
While some research has utilized fuzzy logic to evaluate students’ achievements, to the best of our knowledge, there has been limited exploration in the field of educational sciences that combines the use of fuzzy logic for assessing students’ knowledge with the methodologies of machine learning to analyze the factors influencing these grades in extensive and standardized tests. One such study is the work of Casalino et al. [49], which aimed to investigate the prediction of Open University students’ achievements using neuro-fuzzy systems. This research focused on nine factors related to students’ interaction with the platform, including quizzes, forums, glossary, homepage, collaboration, content, resources, subpages, and URLs. Of these factors, the study particularly emphasized two—the homepage and quizzes. Interactions were fuzzified using three triangular functions, namely, low, middle, and high. The findings from this study suggest that neuro-fuzzy systems exhibit a high level of precision in predicting students’ outcomes.
Although the literature has aimed to explore the assessment of students’ knowledge using fuzzy logic, there is still a scarcity of research that has evaluated the factors impacting this type of grading and to what extent they do so. Therefore, the objective of this current study is to fill this gap in the existing literature by examining achievements and fuzzy grades through the Random Forest regression analysis.

3. Materials and Methods

3.1. Methodology

The current research is a quantitative non-experimental empirical study with a descriptive research nature. The methodological framework is visually outlined in Figure 2. Official data sources provided the dataset encompassing students’ teacher-assigned grades and their performances in the national mathematics assessment, INVALSI. Following this, data underwent a filtration process to eliminate any missing elements (further details can be found in the Research Sample subsection). Subsequently, the remaining dataset was subjected to fusion via the application of the fuzzy logic method, elucidated in thorough detail in the Procedure subsection. Following the generation of the composite grade through fuzzy logic, the data underwent analysis employing statistical techniques. The used methodology is similar to the one used in the work ref. [50].

3.2. Data Collection

The data were sourced from the official web page of the Statistical Service of the INVALSI Institute (https://invalsi-serviziostatistico.cineca.it/, accessed on 21 August 2023), where the following variables were accessible:
  • Teacher-assigned grades for oral evaluations in mathematics;
  • Scores from the national assessment INVALSI;
  • Students’ gender;
  • Schools’ type;
  • Schools’ geographic macroregion;
  • Students’ Economic, Social, and Economic Status (ESCS);
  • Students’ origin.
The data were directly collected by the INVALSI Institute; therefore, they represent a trustworthy source. However, despite the meticulous efforts of the INVALSI institute in ensuring the collection of valid and reliable data, it should be noted that there remains a minimal probability that these data might contain minor errors which could potentially impact the outcomes of the analysis. However, since these errors might occur randomly, their occurrence does not significantly impact the validity and reliability of the data [51].

3.3. Data Filtering

In the initial sample of grade 13 students that took the INVALSI mathematics test during the 2018–2019 school year, 36,589 students were considered. From the original sample, a total of 22,011 (60.2%) students were maintained since the original sample included missing data. Among them, 48.4% were boys and 51.6% girls. In totoal, 26.4% of the students attended scientific lyceums (SL), 32.6% other lyceums (OL), 27.1% technical schools (TS), and 13.9% vocational schools (VS). Moreover, 22.4% of students were from Northwestern Italy, 25.2% from Northeastern Italy, 21.5% from Central Italy, 17.9% from Southern Italy, and 13.1% from Southern Italy and the Isles. There were 92.0% of native Italian students, 3.6% of first-generation immigrant students, and 4.5% of second-generation immigrant students.

3.4. Application of Fuzzy Logic

3.4.1. The Proposed Model

To evaluate students’ knowledge and competencies in mathematics, a fuzzy logic approach was employed to integrate two assessment methods (refer to Figure 3): (1) teacher-assigned grades in mathematics, and (2) students’ achievements on the mathematics national assessment INVALSI. Teacher-assigned grades, which span from 1 to 10, underwent fuzzification through triangular and trapezoidal membership functions (as described in Section 3.4.2), while students’ performance on the INVALSI test was fuzzified using Gaussian functions (as detailed in Section 3.4.3). The fuzzified grades were then combined utilizing inference rules (outlined in Section 3.4.4), resulting in a singular fuzzy grade derived from this process. This grade was subsequently subjected to defuzzification (as explained in Section 3.4.5) to obtain the final Fuzzy grade. The range of this grade was set from 1 to 10, allowing for comparability to a conventional school grade that could be featured on students’ report cards.

3.4.2. Fuzzification of Teacher-Given Grades

Teacher-given grades represented the first crisp input data. These data were discrete and ranged from 1 to 10. The membership functions are those represented in Table 1 and their plots are depicted in Figure 4. The decision to use these functions has been made by considering previous works in the literature [42] and the researchers’ experience as educators (cf. [41]). The use of triangular and trapezoidal functions was preferred due to the discrete nature of teacher-assigned grades, which cannot be considered as continuous variables.

3.4.3. Fuzzification of the INVALSI Scores

As students’ achievements on the INVALSI tests are represented as continuous variables, Gaussian functions were employed [47]. Since the population’s mean score was designated as M = 200, and the standard deviation was fixed at SD = 40 (using the Rasch model), the Gaussian function G a u s s   ( x , 200 ,   40 ) was used to fuzzify the discrete students’ achievements on the INVALSI tests. To determine the other membership functions, a linear transformation was applied: the standard deviation for each function was set to σ = 40 , while the mean was computed as the previous mean plus or minus the standard deviation (e.g., μ 2 = μ 1 σ = 200 40 = 160 ) . As a result, the membership functions were established according to the definitions provided in Table 2, accompanied by the corresponding plots depicted in Figure 5.

3.4.4. Inference rules

In Table 3, inference rules are presented. The inference rules used are the same as in [42] with the following differences, which are the results of the researchers’ experience [41]:
  • It is possible to have the “Excellent” (E) level only if both achievements are E;
  • High performance (H) on the INVALSI tests can only produce at least discrete (D) ratings;
  • The final grade is high (H) only if both ratings are high (H) or if one rating is excellent (E) and the other is at least discrete (D).

3.4.5. Defuzzification

The output variable, encompassing the comprehensive mathematical achievement of the students, is called “Fuzzy grade” and incorporates five membership functions (as delineated in Table 1 and Figure 4). Upon the completion of the fuzzy inference process, the fuzzy final grade must undergo conversion into a precise value through defuzzification. For this study, the Mean of Maxima (MoM) approach was used. All fuzzy grades (i.e., the output data) were rounded to the nearest integer.

3.5. Quantitative Analysis

Fuzzification, inference, and defuzzification procedures were executed using the Fuzzy Logic Toolbox integrated within MATLAB R2020b. Statistical analyses were conducted employing the JAPS 0.17.1.0 [52] statistical software.

3.5.1. Preliminary Analyses

A combination of descriptive and inferential statistical techniques was employed. Descriptive statistical measures including frequencies, means, medians, and standard deviations were computed. The Kolmogorov–Smirnov test was applied to assess data normality. In light of the non-normality of data, non-parametric inferential statistical tests were employed. Specifically, the following were used:
  • Spearman’s ρ coefficient was used to compute correlations between students’ achievements and their ESCS;
  • The Mann–Whitney U test was used to check for gender differences in students’ achievements;
  • The Kruskal–Wallis χ2-test was utilized to investigate differences among three or more categories.

3.5.2. Random Forest

Random Forests (RF) were initially introduced by Breiman [53] as a solution for handling extensive datasets while maintaining robust statistical efficacy. This method is particularly adept at predictive tasks due to its remarkable accuracy. Operating as a quintessential machine learning algorithm, RF is employed for classification, regression, and other learning-related tasks [54,55]. It draws upon the bagging algorithm [53] to aggregate data from the original dataset, followed by individual training for each aggregated group using the decision tree model [55]. The ultimate RF model is formed through amalgamating and analyzing the decision outcomes from these sub-models [55]. The final RF model operates on a voting principle: the classification with the highest number of votes becomes the ultimate output [56]. This approach mitigates the error of individual classifiers, enhancing the overall classification accuracy [53]. Notably, RF outperforms alternative methods such as regression trees and neural networks in terms of accuracy and classification performance [54,55]. Its efficacy is particularly evident in large-scale data processing [55].
RF leverages the Gini index indicator to assess attribute purity [54], where a smaller Gini value corresponds to a purer node [21]. The accuracy of RF predictions can be estimated from the “out of the bag” (OOB) data, representing approximately 36.8% of observations that are not used for any individual tree [57,58]. The estimation equation is represented as follows:
M S E O B B = 1 n i = 1 n y i y ^ i   ¯ 2 ,
where y ^ i   ¯ denotes the average prediction for the ith observation from all trees for which this observation is OOB. To evaluate prediction performance, additional metrics such as Mean Absolute Error (MAE), Mean Squared Error (MSE), Root Mean Squared Error (RMSE), and Mean Absolute Percentage Error (MAPE) are computed [59,60]:
M A E = 1 n i = 1 n y y i ,
M S E = 1 n i = 1 n y y i 2 ,
R M S E = 1 n i = 1 n y y i 2 ,
M A P E = 1 n i = 1 n y y i y .
In this context, where y represents the original data and y i stands for the predicted value resulting from random forest regression, the model’s performance in accurately predicting the target variable is enhanced by lower values of MAE, MSE, RMSE, and MAPE. Additionally, an essential outcome of every RF process is the assessment of variable importance [59]. This signifies that if an input variable exerts an influence on the output variable, the model’s predictive accuracy diminishes. Consequently, a more pronounced reduction in prediction accuracy indicates stronger relationships between the independent and dependent variables [59]. Furthermore, the linear correlation coefficient R2 is employed to gauge the model’s generalization capacity [59]. A higher R2 value indicates a superior fit of the model.
In the present research, we decided to utilize the RF regression in order to have a picture of which factors influence the dependent variables (teacher-given mathematics grades, students’ achievements on the INVALSI mathematics test, and fuzzy grades, which are a combination of the previous two). The independent variables are: (1) students’ gender; (2) school type; (3) school geographic macroregion; (4) students’ ESCS; and (5) students’ origin.
Within the present study, 20% of the samples were designated for validation data; tree numbers were fixed to 500, 1000, and 2000 trees; each tree drew on 50% of the training data. Two variables (the square root of the total number of variables, i.e., 5 2 ) were randomly selected for node splitting in each decision tree generated from bootstrapped datasets [40,53]. Therefore, n(Train) = 17,609; n(Test) = 4402.

4. Results

4.1. Preliminary Analyses

Descriptive statistics of teacher-assigned grades, students’ achievements on the INVALSI assessment, and fuzzy grades are presented in Table 4.
Table 5 presents descriptive statistics of students’ achievements (teacher-assigned grades, achievements on the INVALSI test, and fuzzy grades) segregated by demographic factors, along with the outcomes of the Mann–Whitney (U) or Kruskal–Wallis test (χ2) used to examine differences in achievements among the analyzed categories.
Furthermore, there is a positive correlation between students’ ESCS and teacher-assigned grades (ρ = 0.095; p < 0.001), INVALSI scores (ρ = 0.231; p < 0.001), as well as fuzzy grades (ρ = 0.205; p < 0.001). It is important to note that these correlations are relatively modest, suggesting that students’ ESCS might exert a comparatively minor influence on these variables.

4.2. Random Forest

Table 6 displays the findings from the RF regression analysis. Notably, as the number of adopted trees increased, there was negligible alteration in both the overall predictive performance and the parameters. This indicates that augmenting the number of trees does not yield a distinctive shift in the outcomes. Furthermore, the predictive capability of demographic factors for teacher-assigned grades was notably limited, implying that other factors hold greater significance in their prediction. Conversely, demographic factors demonstrated a more pronounced predictive capacity for students’ achievements on the INVALSI mathematics test. Additionally, demographic factors predicted students’ fuzzy grades relatively well, lying at an intermediate point between teacher-assigned grades and students’ achievements on the INVALSI test. This outcome is unsurprising, given that fuzzy grades emerge as a composite of the other two evaluations.
When considering the model that best fits the data, the third model (the one applying 2000 trees) was chosen. An analysis of the model fit R2 has revealed a moderate fit to the model. In particular, the considered demographic factors have a poor predictive performance on teacher-given grades (R2 = 0.052), which, in turn, demonstrates that other factors might influence these grades to a greater extent. On the contrary, demographic factors explain almost 40% of the variance in students’ achievements on the INVALSI tests (R2 = 0.391). Considering fuzzy grades, which were obtained as a combination of the two, the fit is approximately an average of the previous two fits (R2 = 0.205), indicating a weak fit.

5. Discussion

To offer educators reliable and accurate data concerning the education system’s quality, pinpointing potential systematic variations in scores among diverse student categories, national assessments could fulfill this objective [1,3,4,7]. Large-scale assessments and national evaluations of knowledge generate substantial amounts of data, necessitating appropriate statistical methodologies for analysis and accurate interpretation. Existing literature recommends the utilization of machine learning techniques, such as Random Forest (RF) regression analysis, enabling researchers to gain a more comprehensive understanding of the variables that potentially influence students’ achievements across multiple assessments [5,6,18,19,20]. Furthermore, research proposes the combination of students’ grades with their performance in standardized tests [7,8], an approach that could provide educators with a more lucid and comprehensive understanding of students’ knowledge and competencies. The literature advocates for the application of fuzzy logic methodologies, which are adept at handling ambiguous, linguistic data such as teacher-assigned grades [9,41]. Fuzzy logic presents an enhanced approach for merging diverse assessments [9,10,11,12,14,15,16,39,56]. Hence, the objective of this study was to employ RF regression analysis to examine students’ fuzzy grades, aiming to ascertain the demographic factor that potentially influences them.
Initial analyses were conducted to investigate potential differences in teacher-assigned grades, students’ achievements on the INVALSI test, and fuzzy grades across five demographic factors: students’ gender, school typology, students’ origin, ESCS, and schools’ macroregion. By employing the Mann–Whitney U test and the Kruskal–Wallis test, we demonstrated that girls generally exhibit higher teacher-assigned grades, but lower performance than boys on the national mathematics assessment. These findings align with previous research studies [26,27,28,29]. Furthermore, there are disparities in students’ achievements across the four school types. Specifically, students from OL attained the highest teacher-assigned grades, though they ranked third in achievements on the INVALSI test. In terms of INVALSI scores, students from SL performed the best, whereas those from VS demonstrated the lowest achievements. Notably, students in SL also achieved the highest fuzzy grades. Our findings align with those from earlier research studies [34]. Furthermore, distinctions in students’ achievements emerged among the five Italian macroregions. In line with existing literature, our study corroborated that students from Northern Italy achieve higher scores (teacher-assigned grades, achievements on the INVALSI test, and fuzzy grades) compared to their counterparts from Southern Italy [31,32,34]. The results also validated the notion that students with higher ESCS typically achieve better on the INVALSI test and obtain higher fuzzy grades, which is in accordance with previous studies [32,33,35]. However, the correlation between ESCS and teacher-assigned grades was relatively moderate, possibly stemming from teachers (unintentionally) assigning grades in alignment with the regional or school average ESCS. Furthermore, our investigation highlighted that native Italian students tend to achieve higher results than both first- and second-generation immigrant students, with the latter achieving higher than first-generation students. This observation is consistent with existing literature [36,37,38,39] and can potentially be elucidated by examining the interplay between origin and ESCS.
Preliminary analyses indeed confirmed that the considered factors may contribute to explaining a portion of the variance in students’ achievements. To investigate this relationship, we employed RF regression analysis. As our research demonstrates, the most influential determinant in predicting students’ achievements, particularly in terms of fuzzy grades, is the type of school students attend. Those enrolled in SL receive a more comprehensive mathematical education and possess enhanced problem-solving skills. Notably, despite the distinct emphases of the four school types—leading to divergent perceptions of mathematics as either an integral part of scientific culture in SL or a tool for addressing real-world problems in TS and VS—students undoubtedly receive varying levels of mathematical instruction. This discrepancy could potentially lead to disparities in opportunities within the job market and higher education. Consequently, policymakers should factor in this reality while devising future reforms and policy adjustments.
Secondly, schools’ macroregion and students’ ESCS are influential factors in predicting students’ outcomes and fuzzy grades. Addressing the disparities between Northern and Southern Italy [31,32], as well as socio-economic inequalities [32,33], is crucial to ensure a more equitable and sustainable education for all students. Notably, these factors also exert a significant impact on fuzzy grades. Lastly, students’ gender and their origin emerge as the least influential factors. While students’ origin is related to their ESCS [38], which might partly explain the reduced significance in predicting students’ outcomes, the fact that gender holds less importance in predicting students’ achievements is surprising considering the outcomes reported in the literature [26,27,28]. The literature has shown a relatively substantial impact of gender on students’ achievements. This unexpected result could potentially be attributed to the influence of social and educational policies that have aimed to alleviate gender disparities in mathematics achievements. Nevertheless, it is noteworthy that gender-based differences in achievements persist within the utilized sample. As a result, further research is necessary to comprehensively fathom the underlying factors contributing to this phenomenon.
The analysis using RF indicated that the demographic factors under consideration have limited predictive capability for teacher-assigned grades, as evidenced by the notably low fit coefficient. This could be attributed to the fact that teachers are closely attuned to the local context of their schools, adjusting their grading standards in response to student motivation (which is influenced by the choice of school), personal background (ESCS, gender, and origin), and even the socioeconomic dynamics of the region (macroregion). On the other hand, the scenario is different when it comes to the INVALSI tests, which offer a more objective means of evaluating students’ knowledge. Here, the demographic factors exhibit a stronger predictive capacity for students’ INVALSI test outcomes. Fuzzy grades, being a fusion of the two aforementioned assessments, also display sensitivity to demographic factors, and these factors predict them relatively effectively (with the fit coefficient acting as an intermediary between the two aforementioned coefficients). Consequently, if fuzzy grades are potentially employed in the future to comprehensively evaluate students’ knowledge through a composite of assessments, educators and policymakers should recognize that these evaluations are influenced by various non-cognitive factors. Nonetheless, their dependence on demographic factors is less pronounced compared to national assessments, suggesting that fuzzy grades could provide a relatively more objective and less demographic-dependent insight into students’ knowledge.
While the RF analysis has demonstrated the significance of the considered demographic factors in predicting students’ fuzzy grades, the examination of the R2 coefficient has revealed a relatively low model fit. These findings align with those of previous studies conducted in Italy [61,62]. The reason for the limited model fit could be attributed to the possibility that there are other factors that serve as stronger predictors of students’ academic achievement, specifically in the case of fuzzy grades. These additional factors may include students’ math anxiety, test anxiety, their relationships with teachers, and so on [63]. Consequently, further research is warranted to gain a more comprehensive understanding of the role played by the analyzed factors in predicting students’ fuzzy grades, as well as to identify which factors exert the greatest influence on these grades.
Moreover, some previous studies that have employed the usage of RF in education [64,65,66] have shown that the results of the RF might help educators identify students at risk of failure or dropout. Nevertheless, these studies mainly employed the RF classification algorithm instead of the RF regression, as employed in the present paper. Therefore, additional studies are needed to fully understand how Machine Learning algorithms might assist educators in predicting students’ grades, especially when fuzzy logic methods are also applied to determine students’ final grades.

6. Conclusions

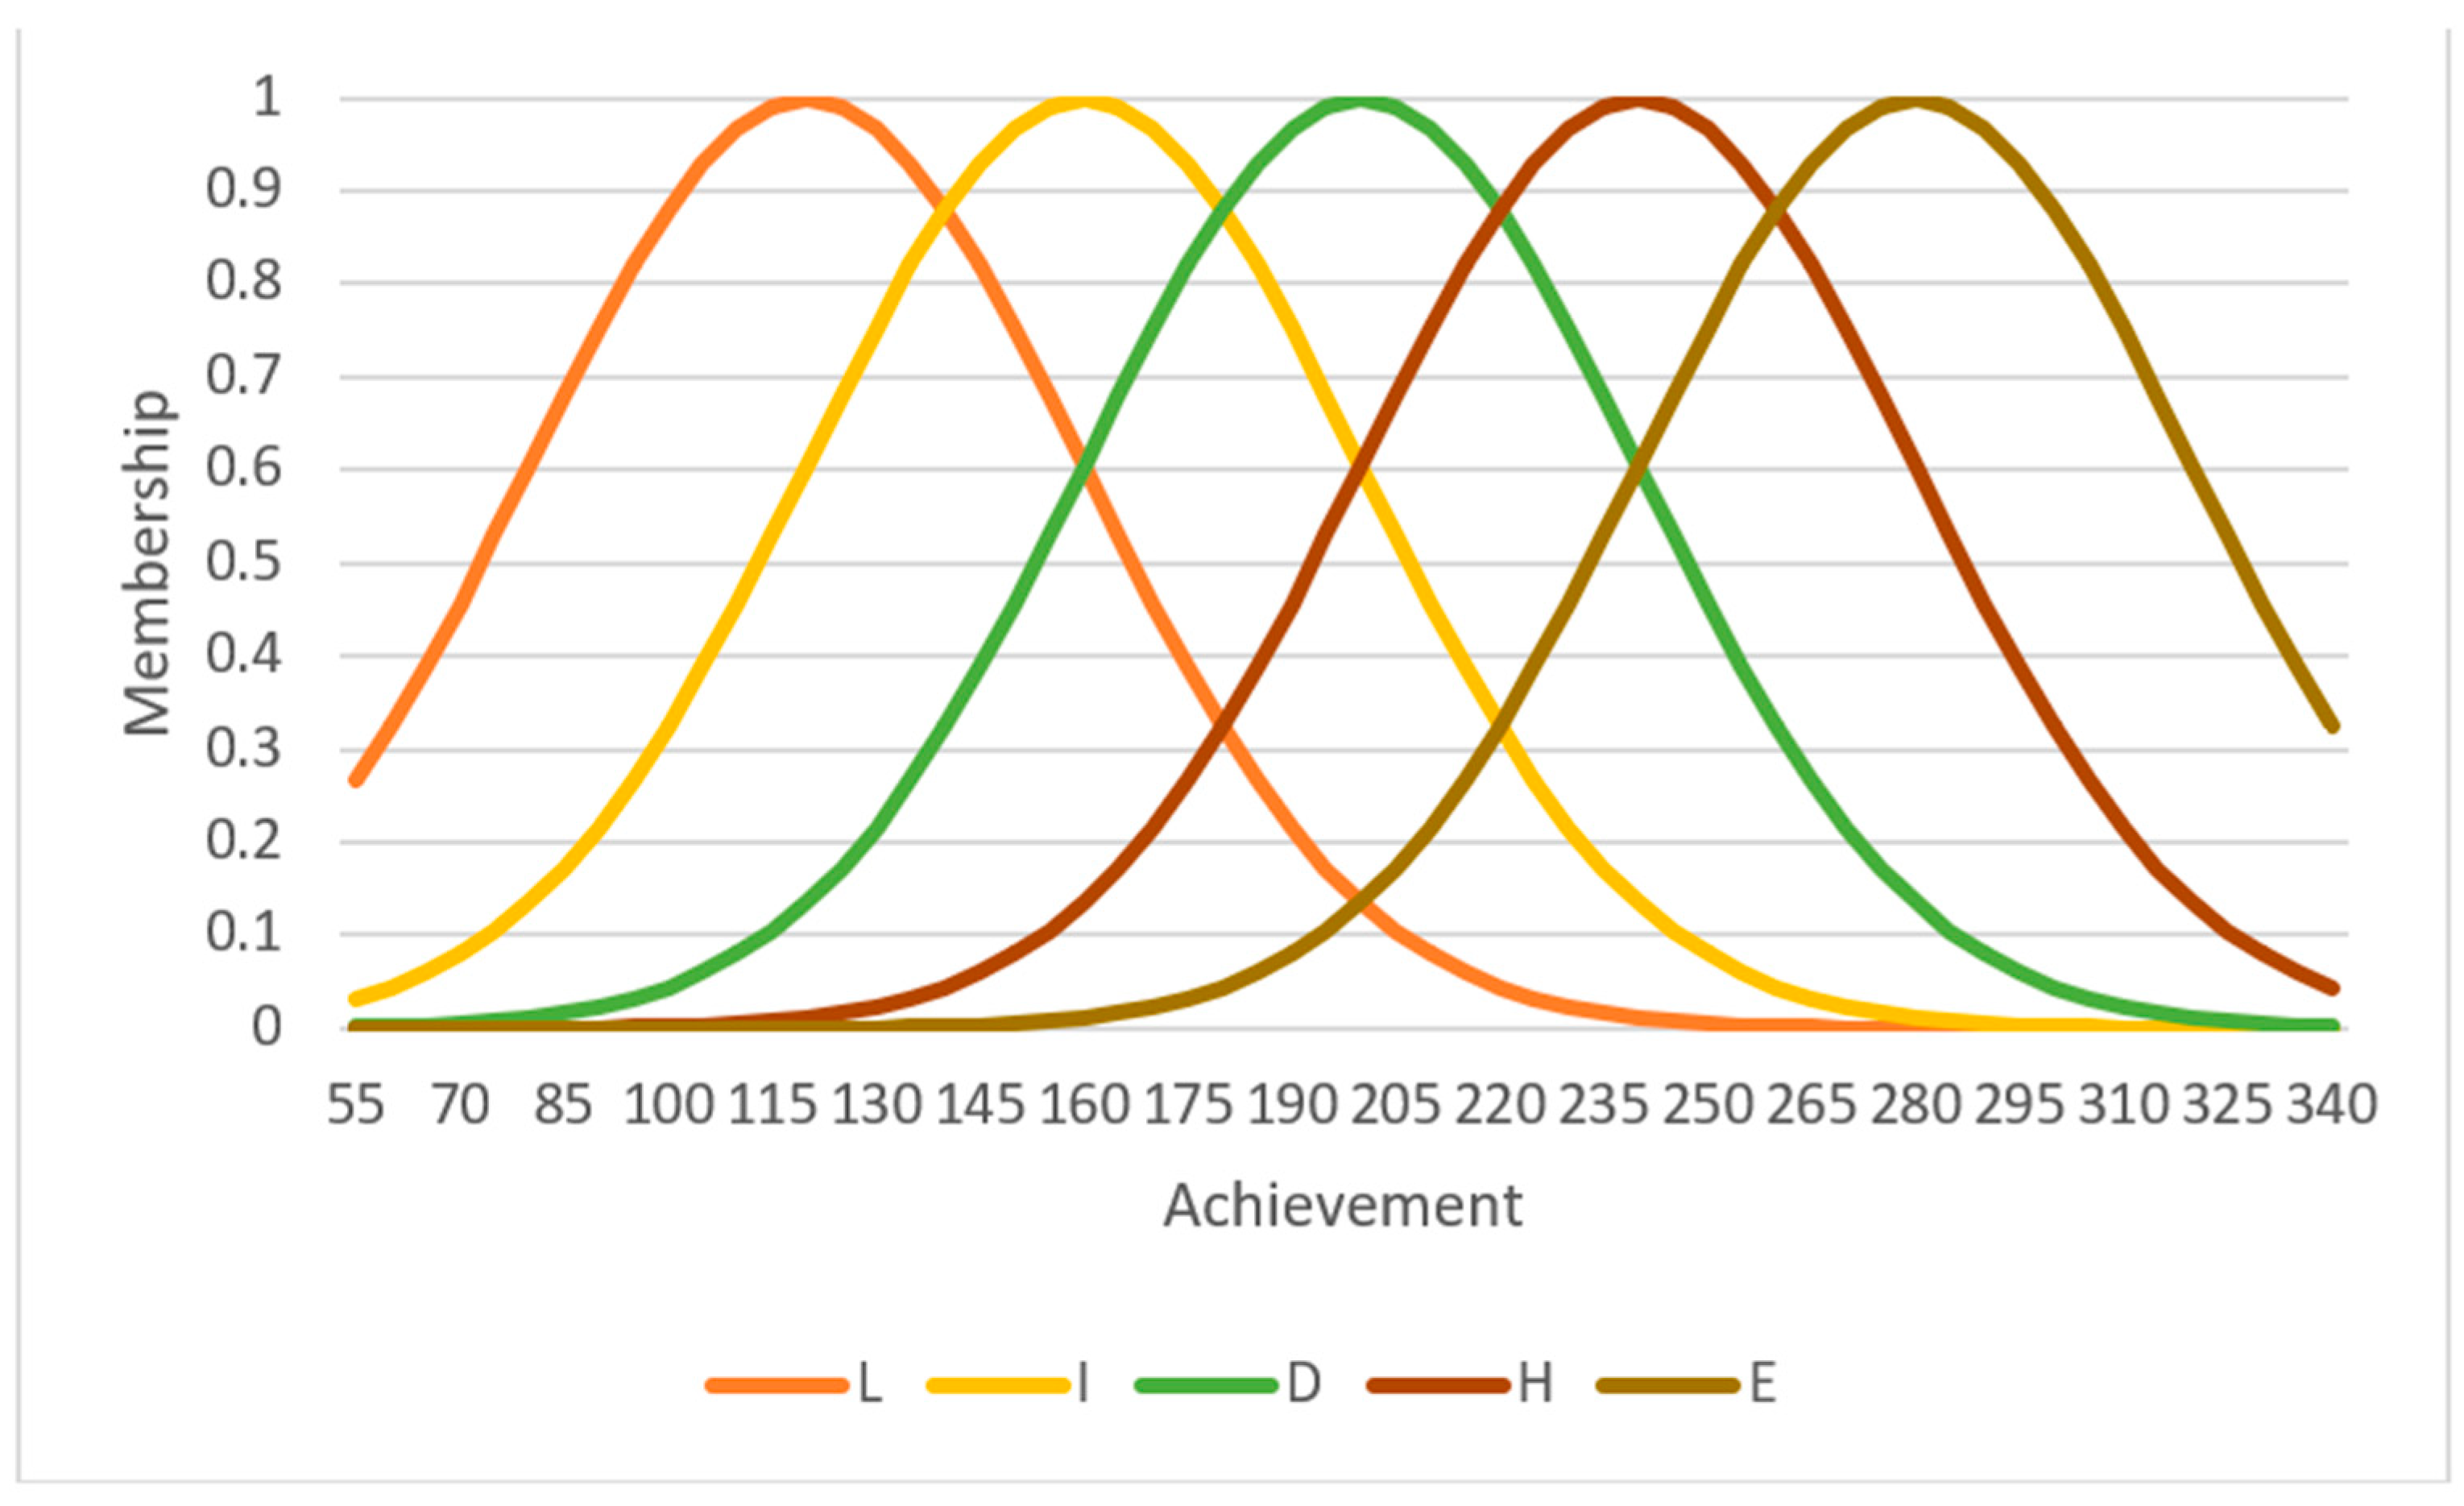
The present research is not without limitations. Firstly, due to the initial sample filtering, the sample size has been reduced, raising questions about the potential impact on the generalizability of the results. Secondly, while RF offers numerous advantages, its application is not devoid of limitations. Although RF can provide insights into variable importance, the intricate ensemble nature of the model can pose challenges in interpretation. Furthermore, RF is less suited for extrapolating beyond the range of the training data. Thirdly, the selection of membership functions, fuzzification and defuzzification methods, and inference rules were determined by the researchers based on their expertise [41] and previous studies [42]. Consequently, alternative choices within the fuzzy process could yield divergent outcomes. Despite these recognized limitations, our study is pioneering in its integration of fuzzy logic techniques in education with machine learning algorithms for predictive analysis.
Future research endeavors could expand on our work by experimenting with different parameters within the fuzzy process and employing different regression analyses. Our study underscores that several demographic factors impact fuzzy grades, although to a lesser extent than students’ achievements on national assessments. Consequently, fuzzy grades offer a promising foundation for educators and policymakers to inform forthcoming decisions and reforms based on extensive data. We encourage educators to diversify approaches to assessing students’ knowledge beyond traditional teacher-given grades and standardized test scores, using the aid of fuzzy logic. Additionally, we advocate for policymakers to embrace machine learning methods and exploit the potential of big data analytics to scrutinize substantial datasets.
Furthermore, we propose that policymakers explore the feasibility of implementing the fuzzy logic assessment approach. This could potentially mitigate bias stemming from demographic factors in national assessments, while simultaneously enhancing teacher-assigned grades with more objective indicators of students’ knowledge.

Author Contributions

Conceptualization, D.D., M.C. and D.F.; methodology, D.D.; software, D.D.; validation, D.D., M.C. and D.F.; resources, D.F.; data curation, D.D. and M.C.; writing—original draft preparation, D.D. and M.C.; writing—review and editing, D.F.; supervision, D.F.; project administration, M.C. All authors have read and agreed to the published version of the manuscript.

Funding

This research received no external funding.

Data Availability Statement

All data are accessible from the INVALSI official webpage (https://invalsi-serviziostatistico.cineca.it/, accessed on 21 August 2023) and, filtered, may be found on Zenodo (https://doi.org/10.5281/zenodo.8271797, accessed on 22 August 2023). The code is available on Zenodo as well (https://doi.org/10.5281/zenodo.8351758, accessed on 16 September 2023).

Conflicts of Interest

The authors declare no conflict of interest.

References

  1. Baird, J.-A.; Andrich, D.; Hopfenbeck, T.N.; Stobart, G. Assessment and Learning: Fields Apart? Assess. Educ. Princ. Policy Pract. 2017, 24, 317–350. [Google Scholar] [CrossRef]
  2. DeLuca, C.; Valiquette, A.; Coombs, A.; LaPointe-McEwan, D.; Luhanga, U. Teachers’ Approaches to Classroom Assessment: A Large-Scale Survey. Assess. Educ. Princ. Policy Pract. 2018, 25, 355–375. [Google Scholar] [CrossRef]
  3. Fischman, G.E.; Topper, A.M.; Silova, I.; Goebel, J.; Holloway, J.L. Examining the Influence of International Large-Scale Assessments on National Education Policies. J. Educ. Policy 2019, 34, 470–499. [Google Scholar] [CrossRef]
  4. Tobin, M.; Nugroho, D.; Lietz, P. Large-Scale Assessments of Students’ Learning and Education Policy: Synthesising Evidence across World Regions. Res. Pap. Educ. 2016, 31, 578–594. [Google Scholar] [CrossRef]
  5. Gomes, C.M.A.; Almeida, L.S. Advocating the Broad Use of the Decision Tree Method in Education. Pract. Assesss. Res. Eval. 2017, 22, 10. [Google Scholar] [CrossRef]
  6. Osborne, J.W. Prediction in Multiple Regression. Pract. Assesss. Res. Eval. 2010, 7, 2. [Google Scholar] [CrossRef]
  7. Felda, D. Preverjanje matematičnega znanja. Rev. Za Elem. Izobr. 2018, 11, 175–188. [Google Scholar] [CrossRef]
  8. Finefter-Rosenbluh, I.; Levinson, M. What Is Wrong with Grade Inflation (If Anything)? Philos. Inq. Educ. 2020, 23, 3–21. [Google Scholar] [CrossRef]
  9. Voskoglou, M. Fuzzy Logic as a Tool for Assessing Students’ Knowledge and Skills. Educ. Sci. 2013, 3, 208–221. [Google Scholar] [CrossRef]
  10. Barlybayev, A.; Sharipbay, A.; Ulyukova, G.; Sabyrov, T.; Kuzenbayev, B. Student’s Performance Evaluation by Fuzzy Logic. Procedia Comput. Sci. 2016, 102, 98–105. [Google Scholar] [CrossRef]
  11. Gokmen, G.; Akinci, T.Ç.; Tektaş, M.; Onat, N.; Kocyigit, G.; Tektaş, N. Evaluation of Student Performance in Laboratory Applications Using Fuzzy Logic. Procedia Soc. Behav. Sci. 2010, 2, 902–909. [Google Scholar] [CrossRef]
  12. Ivanova, V.; Zlatanov, B. Application of Fuzzy Logic in Online Test Evaluation in English as a Foreign Language at University Level. AIP Conf. Proc. 2019, 2172, 040009. [Google Scholar]
  13. Ivanova, V.; Zlatanov, B. Implementation of Fuzzy Functions Aimed at Fairer Grading of Students’ Tests. Educ. Sci. 2019, 9, 214. [Google Scholar] [CrossRef]
  14. Amelia, N.; Abdullah, A.G.; Mulyadi, Y. Meta-Analysis of Student Performance Assessment Using Fuzzy Logic. Indones. J. Sci. Technol. 2019, 4, 74. [Google Scholar] [CrossRef]
  15. Yadav, R.S.; Singh, V.P. Modeling Academic Performance Evaluation Using Soft Computing Techniques: A Fuzzy Logic Approach. Int. J. Comput. Sci. Eng. 2011, 3, 676–686. [Google Scholar]
  16. Yadav, R.S.; Soni, A.K.; Pal, S. A Study of Academic Performance Evaluation Using Fuzzy Logic Techniques. In Proceedings of the 2014 International Conference on Computing for Sustainable Global Development (INDIACom), New Delhi, India, 5–7 March 2014; IEEE: Piscataway, NJ, USA, 2014; pp. 48–53. [Google Scholar]
  17. Namli, A.; Şenkal, O. Using the Fuzzy Logic in Assessing the Programming Performance of Students. Int. J. Assess. Tools Educ. 2018, 5, 701–712. [Google Scholar] [CrossRef]
  18. Yoo, C.; Ramirez, L.; Liuzzi, J. Big Data Analysis Using Modern Statistical and Machine Learning Methods in Medicine. Int. Neurourol. J. 2014, 18, 50. [Google Scholar] [CrossRef]
  19. Lee, H. What Drives the Performance of Chinese Urban and Rural Secondary Schools: A Machine Learning Approach Using PISA 2018. Cities 2022, 123, 103609. [Google Scholar] [CrossRef]
  20. Immekus, J.C.; Jeong, T.; Yoo, J.E. Machine Learning Procedures for Predictor Variable Selection for Schoolwork-Related Anxiety: Evidence from PISA 2015 Mathematics, Reading, and Science Assessments. Large-Scale Assess. Educ. 2022, 10, 30. [Google Scholar] [CrossRef]
  21. Qi, Y. Random Forest for Bioinformatics. In Ensemble Machine Learning; Springer: New York, NY, USA, 2012; pp. 307–323. [Google Scholar]
  22. INVALSI Quadro Di Riferimento Delle Prove INVALSI Di Matematica 2019. Available online: https://invalsi-areaprove.cineca.it/docs/file/QdR_MATEMATICA.pdf (accessed on 20 August 2023).
  23. Van Zile-Tamsen, C. Using Rasch Analysis to Inform Rating Scale Development. Res. High. Educ. 2017, 58, 922–933. [Google Scholar] [CrossRef]
  24. Goldstein, H. Consequences of Using the Rasch Model for Educational Assessment. Br. Educ. Res. J. 1979, 5, 211–220. [Google Scholar] [CrossRef]
  25. Wang, X.S.; Perry, L.B.; Malpique, A.; Ide, T. Factors Predicting Mathematics Achievement in PISA: A Systematic Review. Large-Scale Assess. Educ. 2023, 11, 24. [Google Scholar] [CrossRef]
  26. Else-Quest, N.M.; Hyde, J.S.; Linn, M.C. Cross-National Patterns of Gender Differences in Mathematics: A Meta-Analysis. Psychol. Bull. 2010, 136, 103–127. [Google Scholar] [CrossRef]
  27. Contini, D.; Tommaso, M.L.D.; Mendolia, S. The Gender Gap in Mathematics Achievement: Evidence from Italian Data. Econ. Educ. Rev. 2017, 58, 32–42. [Google Scholar] [CrossRef]
  28. Giofrè, D.; Cornoldi, C.; Martini, A.; Toffalini, E. A Population Level Analysis of the Gender Gap in Mathematics: Results on over 13 Million Children Using the INVALSI Dataset. Intelligence 2020, 81, 101467. [Google Scholar] [CrossRef]
  29. Doz, E.; Cuder, A.; Pellizzoni, S.; Carretti, B.; Passolunghi, M.C. Arithmetic Word Problem-Solving and Math Anxiety: The Role of Perceived Difficulty and Gender. J. Cogn. Dev. 2023, 24, 598–616. [Google Scholar] [CrossRef]
  30. Costanzo, A.; Desimoni, M. Beyond the Mean Estimate: A Quantile Regression Analysis of Inequalities in Educational Outcomes Using INVALSI Survey Data. Large-Scale Assess. Educ. 2017, 5, 14. [Google Scholar] [CrossRef]
  31. Daniele, V. Two Italies? Genes, Intelligence and the Italian North–South Economic Divide. Intelligence 2015, 49, 44–56. [Google Scholar] [CrossRef]
  32. Daniele, V. Socioeconomic Inequality and Regional Disparities in Educational Achievement: The Role of Relative Poverty. Intelligence 2021, 84, 101515. [Google Scholar] [CrossRef]
  33. Agasisti, T.; Vittadini, G. Regional Economic Disparities as Determinants of Students’ Achievement in Italy. Res. Appl. Econ. 2012, 4, 33–54. [Google Scholar] [CrossRef]
  34. Argentin, G.; Triventi, M. The North-South Divide in School Grading Standards: New Evidence from National Assessments of the Italian Student Population. Ital. J. Sociol. Educ. 2015, 7, 157–185. [Google Scholar]
  35. Bianconcini, S.; Mignani, S.; Mingozzi, J. Assessing Maths Learning Gaps Using Italian Longitudinal Data. Stat. Methods Appl. 2022, 32, 911–930. [Google Scholar] [CrossRef]
  36. Di Liberto, A. Length of Stay in the Host Country and Educational Achievement of Immigrant Students: The Italian Case. SSRN Electron. J. 2014, 8547. [Google Scholar] [CrossRef]
  37. Rose, G.L.; Riccardi, V. Foreign Students and Achievement in Mathematics: Evidence from the Italian Case. Ital. J. Educ. Res. 2016, 17, 143–168. [Google Scholar]
  38. Triventi, M.; Vlach, E.; Pini, E. Understanding Why Immigrant Children Underperform: Evidence from Italian Compulsory Education. J. Ethn. Migr. Stud. 2022, 48, 2324–2346. [Google Scholar] [CrossRef]
  39. Triventi, M. Are Children of Immigrants Graded Less Generously by Their Teachers than Natives, and Why? Evidence from Student Population Data in Italy. Int. Migr. Rev. 2020, 54, 765–795. [Google Scholar] [CrossRef]
  40. Hong, J.; Kim, H.; Hong, H.-G. Random Forest Analysis of Factors Predicting Science Achievement Groups: Focusing on Science Activities and Learning in School. Asia-Pac. Sci. Educ. 2022, 8, 424–451. [Google Scholar] [CrossRef]
  41. Bai, Y.; Wang, D. Fundamentals of Fuzzy Logic Control—Fuzzy Sets, Fuzzy Rules and Defuzzifications. In Advanced Fuzzy Logic Technologies in Industrial Applications; Bai, Y., Zhuang, H., Wang, D., Eds.; Advances in Industrial Control; Springer: London, UK, 2006; pp. 17–36. ISBN 978-1-84628-468-7. [Google Scholar]
  42. Jafari Petrudi, S.H.; Pirouz, M.; Pirouz, B. Application of Fuzzy Logic for Performance Evaluation of Academic Students. In Proceedings of the 2013 13th Iranian Conference on Fuzzy Systems (IFSC), Qazvin, Iran, 27–29 August 2013; IEEE: Piscataway, NJ, USA, 2013; pp. 1–5. [Google Scholar]
  43. Eryılmaz, M.; Adabashi, A. Development of an Intelligent Tutoring System Using Bayesian Networks and Fuzzy Logic for a Higher Student Academic Performance. Appl. Sci. 2020, 10, 6638. [Google Scholar] [CrossRef]
  44. Chrysafiadi, K.; Virvou, M. Evaluating the Integration of Fuzzy Logic into the Student Model of a Web-Based Learning Environment. Expert Syst. Appl. 2012, 39, 13127–13134. [Google Scholar] [CrossRef]
  45. Annabestani, M.; Rowhanimanesh, A.; Mizani, A.; Rezaei, A. Fuzzy Descriptive Evaluation System: Real, Complete and Fair Evaluation of Students. Soft Comput. 2020, 24, 3025–3035. [Google Scholar] [CrossRef]
  46. Azam, M.H.; Hasan, M.H.; Hassan, S.; Abdulkadir, S.J. Fuzzy Type-1 Triangular Membership Function Approximation Using Fuzzy C-Means. In Proceedings of the 2020 International Conference on Computational Intelligence (ICCI), Bandar Seri Iskandar, Malaysia, 8 October 2020; IEEE: Piscataway, NJ, USA, 2020; pp. 115–120. [Google Scholar]
  47. Zhang, Y.; Qin, C. A Gaussian-Shaped Fuzzy Inference System for Multi-Source Fuzzy Data. Systems 2022, 10, 258. [Google Scholar] [CrossRef]
  48. Saliu, S. Constrained Subjective Assessment of Student Learning. J. Sci. Educ. Technol. 2005, 14, 271–284. [Google Scholar] [CrossRef]
  49. Casalino, G.; Castellano, G.; Zaza, G. Neuro-Fuzzy Systems for Learning Analytics. In Proceedings of the International Conference on Intelligent Systems Design and Applications, Online, 12–14 December 2020; Springer: Cham, Switzerland, 2022; Volume 418. [Google Scholar]
  50. Doz, D.; Felda, D.; Cotič, M. Combining Students’ Grades and Achievements on the National Assessment of Knowledge: A Fuzzy Logic Approach. Axioms 2022, 11, 359. [Google Scholar] [CrossRef]
  51. Mohajan, H.K. Two Criteria for Good Measurements in Research: Validity and Reliability. Ann. Spiru Haret Univ. Econ. Ser. 2017, 17, 59–82. [Google Scholar] [CrossRef] [PubMed]
  52. Goss-Sampson, M.A. Statistical Analysis in JASP—A Guide for Students; JASP: Amsterdam, The Netherlands, 2019. [Google Scholar]
  53. Breiman, L. Random Forests. Mach. Learn. 2001, 45, 5–32. [Google Scholar] [CrossRef]
  54. Ahmed, N.S.; Hikmat Sadiq, M. Clarify of the Random Forest Algorithm in an Educational Field. In Proceedings of the 2018 International Conference on Advanced Science and Engineering (ICOASE), Duhok, Iraq, 9–11 October 2018; IEEE: Piscataway, NJ, USA, 2018; pp. 179–184. [Google Scholar]
  55. Xu, Q.; Yin, J. Application of Random Forest Algorithm in Physical Education. Sci. Program. 2021, 2021, 1996904. [Google Scholar] [CrossRef]
  56. Abdulkareem, N.M.; Abdulazeez, A.M. Machine Learning Classification Based on Radom Forest Algorithm: A Review. Int. J. Sci. Bus. 2021, 5, 128–142. [Google Scholar] [CrossRef]
  57. Grömping, U. Variable Importance Assessment in Regression: Linear Regression versus Random Forest. Am. Stat. 2009, 63, 308–319. [Google Scholar] [CrossRef]
  58. Probst, P.; Boulesteix, A.-L. To Tune or Not to Tune the Number of Trees in Random Forest. J. Mach. Learn. Res. 2018, 18, 6673–6690. [Google Scholar]
  59. Han, Q.; Gui, C.; Xu, J.; Lacidogna, G. A Generalized Method to Predict the Compressive Strength of High-Performance Concrete by Improved Random Forest Algorithm. Constr. Build. Mater. 2019, 226, 734–742. [Google Scholar] [CrossRef]
  60. Kurniawati, N.; Novita Nurmala Putri, D.; Kurnia Ningsih, Y. Random Forest Regression for Predicting Metamaterial Antenna Parameters. In Proceedings of the 2020 2nd International Conference on Industrial Electrical and Electronics (ICIEE), Lombok, Indonesia, 20–21 October 2020; IEEE: Piscataway, NJ, USA, 2020; pp. 174–178. [Google Scholar]
  61. Sani, C.; Grilli, L. Differential Variability of Test Scores Among Schools: A Multilevel Analysis of the Fifth-Grade INVALSI Test Using Heteroscedastic Random Effects. J. Appl. Quantiative Methods 2011, 6, 88–99. [Google Scholar]
  62. Raffinetti, E.; Romeo, I. Dealing with the Biased Effects Issue When Handling Huge Datasets: The Case of INVALSI Data. J. Appl. Stat. 2015, 42, 2554–2570. [Google Scholar] [CrossRef]
  63. Brezavšček, A.; Jerebic, J.; Rus, G.; Žnidaršič, A. Factors Influencing Mathematics Achievement of University Students of Social Sciences. Mathematics 2020, 8, 2134. [Google Scholar] [CrossRef]
  64. Jayaprakash, S.; Krishnan, S.; Jaiganesh, V. Predicting Students Academic Performance Using an Improved Random Forest Classifier. In Proceedings of the 2020 International Conference on Emerging Smart Computing and Informatics (ESCI), Pune, India, 12–14 March 2020; IEEE: Piscataway, NJ, USA, 2020; pp. 238–243. [Google Scholar]
  65. Vo Chau, T.N.; Phung, N.H. Imbalanced Educational Data Classification: An Effective Approach with Resampling and Random Forest. In Proceedings of the 2013 RIVF International Conference on Computing & Communication Technologies—Research, Innovation, and Vision for Future (RIVF), Hanoi, Vietnam, 10–13 November 2013; IEEE: Piscataway, NJ, USA, 2013; pp. 135–140. [Google Scholar]
  66. Yu, J. Academic Performance Prediction Method of Online Education Using Random Forest Algorithm and Artificial Intelligence Methods. Int. J. Emerg. Technol. Learn. IJET 2021, 16, 45. [Google Scholar] [CrossRef]
Figure 1. The fuzzy process (adapted from [47]).
Mathematics 11 04129 g001
Figure 2. The methodology used.
Mathematics 11 04129 g002
Figure 3. The applied fuzzy process in the proposed model.
Mathematics 11 04129 g003
Figure 4. Graphical representation of membership functions for the fuzzification of teacher-given grades.
Mathematics 11 04129 g004
Figure 5. Graphical representation of membership functions for the fuzzification of students’ achievements on the INVALSI mathematics test.
Mathematics 11 04129 g005
Table 1. Membership functions used to fuzzify teacher-given grades.
Description of LevelMembership Function
Low (L) T r i a n ( x , 1 ,   1 ,   3 )
Insufficient (I) T r i a n ( x , 1 ,   3 ,   5 )
Discrete (D) T r a p ( x , 3 ,   5 ,   6 ,   8 )
High (H) T r i a n ( x , 6 ,   8 ,   10 )
Excellent (E) T r i a n ( x , 8 ,   10 ,   10 )
Table 2. Membership functions used to fuzzify students’ achievements on the INVALSI test.
Description of LevelMembership Function
Low (L) G a u s s   ( x , 120 ,   40 )
Insufficient (I) G a u s s   ( x , 160 ,   40 )
Discrete (D) G a u s s   ( x , 200 ,   40 )
High (H) G a u s s   ( x , 240 ,   40 )
Excellent (E) G a u s s   ( x , 280 ,   40 )
Table 3. The used inference rules.
Teacher-Given Grade Level
LIDHE
INVALSI levelLLLIID
ILIIDD
DIIDDD
HDDDHH
EDDHHE
Table 4. Descriptive statistics of variables.
VariableMSDMdnminmaxSkewKurt
Grades6.411.4662100.0170.033
INVALSI208.5239.50206.0871.63340.570.176−0.196
Fuzzy5.711.596110−0.2290.144
Table 5. Descriptive statistics of variables distinguished among groups.
VariableGroupMSDU/χ2
GradeBoys6.181.49 5.00 × 10 7 ***
Girls6.621.39
SL6.441.49424.42 ***
OL6.661.40
VS6.231.48
TS6.111.38
NW6.491.4788.90 ***
NE6.501.45
C6.411.45
S6.291.44
SI6.231.45
Nat6.431.4556.36 ***
1GI6.071.46
2GI6.231.45
INVALSIBoys215.4240.67 7.23 × 10 7 ***
Girls202.0337.22
SL237.4435.955492.15 ***
OL201.1333.55
VS206.3335.13
TS175.2229.84
NW215.9337.271542.13 ***
NE219.8338.80
C207.7639.13
S196.7537.31
SI191.4537.64
Nat209.3139.54110.32 ***
1GI196.3837.98
2GI202.0437.73
FuzzyBoys5.801.61 6.43 × 10 7 ***
Girls5.621.57
SL6.471.382951.80 ***
OL5.641.53
VS5.611.51
TS4.601.51
NW5.961.481033.41 ***
NE6.051.48
C5.711.59
S5.321.64
SI5.131.63
Nat5.741.59112.90 ***
1GI5.221.57
2GI5.451.56
Note. SL = scientific lyceums; OL = other lyceums; TS = technical schools; VS = vocational schools; NW = Northwester Italy; NE = Northeastern Italy; C = Central Italy; S = Southern Italy; SI = Southern Italy and Isles; Nat = Native Italian; 1GI = first-generation immigrant; 2GI = second-generation immigrant; *** p < 0.001.
Table 6. Parameters of the Random Forest regression analysis.
ItemsGrades—500Grades—1000Grades—2000INVALSI—500INVALSI—1000INVALSI—2000Fuzzy—500Fuzzy–1000Fuzzy—2000
Parameters
Test MSE0.9620.9610.9620.6280.6280.6280.8210.8200.820
OOB Error0.9570.9570.9570.6400.6410.6410.8020.8020.802
Evaluation Metrics
MSE0.9620.9610.9620.6280.6280.6280.8210.8200.820
RMSE0.9810.9800.9810.7920.7920.7920.9060.9060.906
MAE0.7890.7880.7890.6270.6270.6270.6790.6790.679
MAPE97.89%97.85%97.85%262.47%262.36%262.34%127.34%127.13%126.96%
R20.0520.0520.0520.3910.3910.3910.2040.2050.205
Mean decrease in accuracy
School type0.0380.0380.0380.4700.4710.4720.2540.2530.253
Macroregion0.0140.0140.0140.1500.1490.1490.1010.1010.101
ESCS0.0230.0230.0230.0280.0280.0280.0300.0290.029
Gender0.0410.0410.0410.0430.0430.0430.0140.0130.014
Origin0.0090.0090.0090.0080.0080.0080.0100.0100.010
Total increase in node purity
School type176.06173.78173.122033.512033.452034.971079.901079.191076.58
Macroregion 157.69158.28156.09655.37655.78657.77477.63482.00480.99
ESCS500.44497.30492.16527.20528.34523.51613.11614.95611.45
Gender178.49177.15176.81187.32184.83182.0269.8169.2669.47
Origin82.6181.4280.5872.4972.1271.7985.4184.9384.89
Note. Variable—500 = 500 trees used; Variable—1000 = 1000 trees used; Variable—2000 = 2000 trees used.
Disclaimer/Publisher’s Note: The statements, opinions and data contained in all publications are solely those of the individual author(s) and contributor(s) and not of MDPI and/or the editor(s). MDPI and/or the editor(s) disclaim responsibility for any injury to people or property resulting from any ideas, methods, instructions or products referred to in the content.

