Article

Identification of Inhomogeneities: The Selected Coordinate Descent Method Applied in the Drilling Area

by
Tatyana Smaglichenko
1,* and
Alexander Smaglichenko
2
1
Research Oil and Gas Institute, Russian Academy of Sciences, Moscow 119333, Russia
2
Institute of Seismology and Geodynamics, Structural Subdivision of the V.I. Vernadsky Crimean Federal University, Simferopol 295007, Russia
*
Author to whom correspondence should be addressed.
Mathematics 2023, 11(20), 4297; https://doi.org/10.3390/math11204297
Submission received: 28 August 2023 / Revised: 2 October 2023 / Accepted: 8 October 2023 / Published: 15 October 2023

Abstract

:
The exploration of inhomogeneities is a crucial factor for industries because of the necessary control of the quality of output products or the check adequacy of the data from the helping information systems. In the energy-conception field, the preliminary study of borehole areas has special importance because it can avoid risks of secure drilling and financial expenses. In this paper, an innovative option of the traditional coordinate descent method called selected coordinate descent, was investigated by collating its fundamentals with other methods used in various industrial branches. A practical application of selected coordinate descent was performed for experimental data of seismic event registration observed in the region of geothermal plants. An explicit formula for the resolution parameter was utilized to distinguish well and poorly resolved anomalies. The inhomogeneities were validated on the basis of a good resolution and comparison with data from other disciplines. The main result of our study is the performance of the algebraic technique application in the reconstruction of large-size structures. The identification of the found seismic inhomogeneities permits us to indicate the sites that are questionable for drilling and to obtain knowledge about the rock types at crucial depths.

1. Introduction

In vital industries, almost all kinds of modern manufacturing exploit technical systems that are optimally functioning because they were developed by involving fundamental methods to solve the inverse problem related to inhomogeneities. In robotics, the robot body can perform the motion with fixed velocity and acceleration. However, the presence of an obstacle destroys the geometry of the workspace, and inhomogeneity of the motion appears. The authors of [1] applied linear algebra and a pseudoinverse approach to avoid the nonlinear constraints of the obstacles. In the classical task of motion with control of the robot, one can consider the deviation from the planned trajectory as an inhomogeneity. The authors of [2] developed the automatic control of robots with revolute and prismatic joints by solving the nonlinear and linear systems of algebraic equations. In the material production industry, the defect of the output product is estimated as inhomogeneity, which is variability from the etalon sample. To improve the optical systems of non-destructive testing of the materials output production, constraints of the differential equation under an elastic wave passing in real materials were explored [3]. For physical modeling manufacturing 3D printers, the authors of [4] formulated the problem of the homogeneous distribution of deposited metal as a differential equation with boundary conditions.
Commodity industries, encompassing hydrocarbon [5] and mining [6], are based on knowledge of inhomogeneities of geological structures reconstructed by inversion methods. Numerical techniques are widely applied to investigate rock properties in the space between boreholes for monitoring the production process [5]. A numerical analysis of the stress field distribution was made in [6] to study rock mechanics and obtain a priori information about the mining horizon, which is very important for areas of coal mines. Another aspect of inhomogeneity arising in the commodity industry is the robotic motion deviation from a fixed position. In petrochemical plants and refineries, robotic manipulators are used to protect people from dangerous production conditions. Kinematic equation systems arise when the prototype models should be tested. The forward problem and the corresponding solution for the modeling of the motion of robots with wheeled different drive mechanisms were developed in [7].
The basic principle of manufacturing operations reliability is safety control. The facilities occupy large areas. Automatic analysis of the power supply systems modes is performed due to the matrix techniques application. For preventing emergencies in power lines, the conductivity perturbations are determined due to inversion methods. The authors of classical work [8] realized Kirchoff’s voltage laws and formulated the equilibrium state of the electricity system in terms of differential equations. This allowed the obtaining of a sparse system of algebraic equations of a fixed structure. Direct solvers based on matrix decomposition were applied in [9].
Presently, information systems based on satellite imagery perform production and logistic monitoring. The images might be cleaned using system solvers, which are helpful for distinguishing inhomogeneities that are related or not related to the subject being investigated. Owing to this approach, the authors of [10] discerned two types of image anomalies: those related to hazardous gas leakage from the pipeline and others far away from the pipeline.
For the protection of populations and manufacturing facilities, scientists of the National Research Institute for Earth Science and Disaster Prevention (NIED), Japan developed the Earthquake Early Warning (EEW) [11]. The imagery of inhomogeneous Earth structures defined by an algebraic systems solution is an essential component of the EEW system.
We have just listed a small sector of manufacturing issues regarding the equations system associated with inhomogeneities. The field of applications of the inverse problems solution is not limited. An unusual example is the production of electromagnets for electronic equipment. The authors of [12] found a novel set of partial differential equations for optical theory, which might be numerically solved and which have value for application in electromagnetism. Another practical pattern might be used in the production of biomedical materials. The authors of [13] showed that the manufacturing of materials for biomedical applications depends on the reliability of the modeling based on the finite element method and consequently on the solution of the associated system of algebraic equations.
The purpose of this paper is to describe an innovative coordinate descent (CD) algorithm, outline its theoretical difference from approaches conventionally used in industry, and demonstrate its effectiveness in resolving large-size inhomogeneities. Within this study, we present an example of the drilling areas exploration for the energy industry. The CD method is an iterative technique used to solve the linear equations system; that is, an alternative to direct solvers, which apply matrix singular value decomposition (SVD). The direct solver is widely exploited. Nevertheless, the iterative approach remains admired in many industries. In robotics [1], when an obstacle appears, the robot’s way is changed, and the trajectory function should be approximated using a negative gradient. Smoothing operator is applied to provide the stable movement of the robot, and SVD is needed to solve the system with Jacoby’s matrix. In classical robotics, the main task is the stability of the movement. Machines or manipulators consist of a set of pairs of mechanisms that are subsequently linked [14]. The variation model might be constructed with respect to the fixed link, which corresponds to the frame of the whole mechanism [2,14]. The position of the framework might be defined as the forward problem in finding a deterministic trajectory [2,15,16]. We assume that errors determining the variation in the movement parameters from the framework variables are small. If the matrix elements are small, the direct SVD inversion will be more complicated than in the case when iterative techniques are used. Therefore, in modern works, the iterative CD is traditionally exploited [2,17]. In a mathematical review [18], the backgrounds of many CD algorithms are expounded, including a cyclic fashion [2,17].
Both the iterative Gauss–Newton algorithm and the SVD method are commonly used in information systems, as shown in [19]. The observed multispectral image is the mixture of measurements of various spectral channels, and the task is to separate components of this mixture to find the subject with the maximal brightness. The greater the number of channels, the more strings of the corresponding observed matrix, which becomes over-determined. The element of the unknown vector corresponds to the contribution of the spectral characteristic of the separated channel. Multi channels form the brightness of pixels. For the model retrieval, iterative and direct solvers are used.
Iterative conjugate gradient techniques might be applied in the industrial area for non-destructive control of the material strengths and properties. The author of [20] developed the approach based on the Boundary Element Method (BME) to detect material defects, crack size estimation, and crack growth evaluation. The author of [21] outlined the difference between BME and the Finite Elements Method (FEM) conventionally used. The BME advantage is the discretization of the boundary instead of the FEM discretization of the whole domain. This permits solving the system with a small and filled-in matrix instead of the system with a large and sparse matrix. In [22], a few variants of conjugate gradient algorithms are presented for solving dense large systems associated with BME. In the opinion of the authors, these techniques are helpful for researchers working with BME. The common feature of techniques is caused by mathematical operations created by Lanczos [23]. The Lanczos development included the obtaining of the system of normal equations with the symmetric and positive-definite matrix and the reducing of the matrix to tridiagonal form. The symmetric system might be formed due to the multiplication of both parts to the transposed initial matrix. On the other hand, the authors of [22] assumed that the drawback of this approach might be slow convergence if the initial system is considered to be ill-conditioned. At the same time, the authors convince the readers that the method is guaranteed to converge. The authors of [24] also pointed out the disadvantage of matrix multiplication, which is able to enhance errors of the initial dataset because the physical experiment does not always provide high accuracy of measurements. Nevertheless, such mathematical manipulations can be effective when measurements are controlled, and, consequently, they have a small error.
The given paper concerns issues in the production processes when mineral resources are extracted. The industry experience shows that environmental problem primarily springs from errors in the planning of production. We focus our attention on the selection of sites for the drilling wells because ecological as well as technical conditions of manufacturing and the production process itself directly depend on the decision on the drilling site. Please note that there is a similarity between the drilling process for traditional oil and gas recovery and the extraction of thermal water. Recent investigations convince us that the drilling provokes induced and triggered seismicity, and sometimes strong earthquakes can appear [25,26,27]. Seismic events are strongly influenced by the complex seismic structure of the underground medium. Seismic tomography is a modern fundamental tool to obtain images of the Earth’s body that consists of the different size inhomogeneities distributed in a chaotic mosaic manner, in other words, the different types of seismic structure. It applies various algebraic techniques to solve the linear equation systems, the known part of which is determined owing to the registration of signals from seismic sources. In medical tomography, rays scan patients from all directions, and numerical techniques have a priority to process complete data. Seismic rays scan the Earth’s body in limited conditions because sources can be deeply and sparsely located. Therefore, seismic tomography requires the development of special methods, which overcome numerical problems of large and sparse matrixes and serious issues of non-uniqueness of the linear inversion solutions. It is known that seismologists often prefer the most popular solver, the LSQR algorithm, which was developed in [28] or the LSMR algorithm modified in [29]. Applications can be found in [30,31,32] and in many other works. These algorithms are variants of the classical conjugate gradients method.
Analyzing the inversion methods applied in various production fields of the industry, we can divide them into two groups: (1) iterative CD and (2) Conjugate Gradient (CG) methods based on the Lanczos process. The direct solver SVD relates to the second group. The authors of [33] showed that the LSQR used with a small number of iterations gives a result that is equivalent to the SVD outcome. The first group processes an arbitrary matrix while, owing to the Lanczos process, the second group works with a symmetric positive-define matrix or nonsymmetrical square matrix with a positive-definite symmetric part.
The practical objective of this paper is to investigate the results of the new CD version. Why is it so essential? Let us analyze the previous studies. The authors of [34] established distinctive features of the linear inversion model of Lanczos, which is the CG base. Using the common tests with synthetic data, they showed that the Lanczos technique has different levels of effectiveness for various types of structures. This technique is rapid and robust when the small-size structure is retrieved, but it has difficulties when the medium is characterized by the presence of large-size heterogeneities.
The authors of [35] repeated the numerical experiments conducted in [34] to check the ability of the tomography approach that realise the principle of iterative subtraction of contrast anomalies from the data for recognizing the anomalies with less contrast. The experiments on arbitrary models revealed that a new way of solving has an advantage in reconstructing the large-size heterogeneity, which is surrounded by uniform structure [35]. In [24,36], the method based on the physical idea of subtraction [35] was established as a novel variant of the classical Coordinate Descent (CD) method called the Selected Coordinate Descent (SCD). Thus, SCD is the mathematical analogue of the tomography technique, which processes seismic data. The mathematical background of SCD (proof of convergence, degree of convergence) obtained by the first author of this study is given in Appendix A and B of [35].
In [24], a formula describing the SCD resolution tool was developed, and, using real data, it was demonstrated that SCD is practically convenient to identify a large-size structure. In this work, we explain SCD in more detail than it was in previous studies [24,36]. We perform the theoretical comparison of SCD with CD and CG and determine the SCD’s particularities. Taking into account the resolution estimates obtained in [24], we present seismic images of allotted well-resolved anomalies for the region of the geothermal wells in the northeastern part of Iceland. We identify large-size inhomogeneities by exploiting the integrated analysis of the inversion results with the data of other independent studies and checking how the obtained results are realistic. The techniques overview performed here shows that iterative methods are in demand in the main fields of industry. Therefore, we suggest that the conducted SCD exploration might be of relevance for a wide range of applications.

2. Modeling of the Elastic Medium Structure

The seismic wave propagates from the source of seismic energy, and its arrival is registered by a receiver as a specific increase in amplitude on a seismogram. Various geological structures (dense rocks or fluids) can be on the way of the wave. Properties of some structures may delay the propagation, while another property can contribute to the fast-moving of the wave to the surface. A simplified approximation permits us to consider the wave as a seismic ray, which goes from the source point (hypocenter) through geological blocks of the studied space. Automatic processing of arrivals registered by many receivers estimates the most accurate coordinates of the earthquake hypocenter location and its origin time. The travel time is a time of the difference between the arrival of the main seismic wave to the receiver station and the origin time.
It is known that for simple linear motion, time is equal to the displacement s divided by velocity v. However, the ray path W is very complicated. In the common case, the travel time t is an integral characteristic of the displacement change d s and is divided by the velocity v ( r ) that is varied from point to point, r is the radius vector of the point with coordinates ( x , y , z ) in Cartesian coordinate system.
t = W d s v ( r ) .
In many regions, the initial model v ( z ) of the velocity change with respect to the depth z can be obtained using drilling information about Earth rocks that are deeply located. The knowledge about very deep layers might be taken from the explosion experiments. The model is often expressed as v ( z ) = a × z + b , where a and b are real numbers such that the velocity is growing with a depth because properties of Earth material are normally distributed in such a way. Presently, similar models are known for many areas on the sea and land. Supposing that real velocity does not strongly deviate from the initial (“framework”) model, one can write that v ( x , y , z ) v ( z ) + δ v ( x , y , z ) , where δ v ( x , y , z ) is the velocity anomaly. Figure 1 illustrates the scheme of the path for the real ray W (red curve) and the model ray W 0 (yellow curve). For the model time t 0 Equation (1) can be presented as the following:
t 0 = W 0 d s 0 v ( z ) .
Subtracting Equation (2) from Equation (1) and doing simple transformations we obtain:
Δ t = t t 0 W 0 δ v ( x , y , z ) v 2 ( z ) d s 0 .
As mentioned above, regarding the way from the seismic source to the receiver, the ray meets inhomogeneities. Divide the studied volume into blocks and suppose that the ray passed K blocks. Then for each ray, Equation (3) can be written in the form of:
Δ t = k = 1 K δ v k v k ( z ) t k ,
where Δ t is the travel time residual for the ray, δ v k v k ( z ) is velocity perturbation in the k-th block, t k = W 0 k d s 0 k v k ( z ) = s k v k ( z ) is the time calculated for the k-th block with respect to the initial linear model v ( z ) .
What is known and what is unknown in Equation (4) for the considered ray? The value Δ t involves the travel time t, which is the difference between the registered time and the origin time of the seismic event that can be found by an explicit formula. Because the initial model for velocity (“framework”) is known, the model time t 0 is simply calculated by applying forward modeling. Thus, the left side of Equation (4) is known.
The right side consists of known theoretical time t k , known modeling velocity v k ( z ) , and unknown velocity anomaly δ v k . For m-th ray Equation (4) can be represented as the algebraic equation:
y m = a m 1 x 1 + a m 2 x 2 + + a m k x k + + a m K x K ,
where y m is known value, a m k is known element of vector a m , x k is unknown element of vector x = ( x 1 , x k , x K ) . For a set M of seismic rays that penetrate the volume from various directions, we have a linear system of equations:
A x = y ,
where y m is element of vector y = ( y 1 , y m , y M ) , a m k is element of matrix A with dimension M × K . Thus, the inverse problem is formulated as follows. From a set of observations presented by vector y, we should calculate the unknown vector x, which corresponds to these observations.

3. The SCD’s Ability to Recognize the Large-Size Inhomogeneity

Modern technical abilities permit us to make many measurements. As a result, the system of algebraic equations might be over-determined when the number of unknowns is significantly less than the number of equations. There is a problem of non-uniqueness of solutions when a set of various models satisfies the system with the same error. The least-square approach provides different solvers, as discussed in the introduction section. The explorations [34,35] showed that there are particularities of the solvers when individual structures are retrieved. The small-size structure is determined as the numerical field consisting of negative and positive values of the same modules, which are alternated. Lanczos process [34] quickly reconstructs such structure. At the same time, there are variants of large-size structures. One of them is the numerical field, which contains a cluster of equal values surrounded by values with opposite signs [34]. If the numerical field is presented by zero homogeneous values and it incorporates the group of equal nonzero values of the same sign, then we have to deal with individual large-size inhomogeneity. Such structure can be reconstructed by SCD [35,36].

3.1. Special Tactic of SCD in Comparison with CD and the Conjugate Gradient Methods

SCD, its classical analogue CD, and Lanczos’s-like methods are applied for the manufacturing and logistics tasks aiming for the same goal to obtain the most accurate solution x of the system (6) by minimizing the least-square function and working with the Euclidean norm. However, the tactics of the methods are different.
First, let us analyze the similarities and differences between the traditional CD and its new SCD variant considered in this paper. CD is the numerical method described in [37] to minimize convex functions. As well as CD, the SCD method builds the final solution accumulating from one iteration step i to another its approximate values:
x ( i ) = x ( i 1 ) + α k e k ,
where e k is the identity vector, the k-th component of which is equal to 1.0, and others are equal to zero values. From the simple condition setting the derivative of the least square functional F ( x ( i ) ) = A x ( i ) y to zero value F ( x ( i ) ) = 0 , we determine:
x ( i ) = x ( i 1 ) ( A x ( i 1 ) y , A e k ) ( A e k , A e k ) ,
where
α k = ( A x ( i 1 ) y , A e k ) ( A e k , A e k )
is a component of the gradient, which is given by the identity vector e k .
Let us outline that CD cyclically searches the coordinate direction k, performing the rule that the least-square functional does not increase (lowers or unchanged) from one iteration to another. SCD has the same purpose. However, it selects k following the criterion, which is defined from mathematical transformations that provide the functional minimum on each iteration step. Thus, the difference between SCD and CD is in the existence of explicit mathematical expression, which on each iteration step estimates the contribution of the descent direction k to reach the minimum norm solution and permits the selection of the direction responsible for the minimum.
Next, let us note the definite difference between the CD algorithms and the other group of gradient techniques (SVD, LSQR, CG). To understand details, we will compare the coordinate descent techniques with the simple strategy of the conjugate gradient method described in [22]. We will match the SCD Equations (7) and (8) with the basic formulas of the CG method. The iteration process in the conjugate gradients is determined as follows:
x ( i ) = x ( i 1 ) + β ( i ) r ( i 1 ) ,
where r ( i 1 ) = y A x ( i 1 ) is defined as the residual of the point x ( i 1 ) . Determining β ( i ) from the algorithm described in [22] and substituting it into Equation (10) we obtain:
x ( i ) = x ( i 1 ) + ( r ( i 1 ) , r ( i 1 ) ) ( r ( i 1 ) , A r ( i 1 ) ) r ( i 1 ) .
Let us understand the difference between Equations (7), (8), (10) and (11). The first pair of Equations (7) and (8) defines the CD and SCD tactics, which is the choice of the coordinate k. This coordinate actually corresponds to the element of the unknown vector x, which leads to the minimal least-square solution. A e k is a column of matrix A that contains the known information about this element. For instance, the information about seismic or atmospheric sounding might be presented by the geometry of the mutual location of sources and receivers. Moreover, the parameter α k in Equation (7) is a direct contribution to the final value of an element x k of the unknown vector x in Equation (6). If the value obtained during calculations contradicts the physical sense of the parameter x, which we determine as the physical solution, then the iterative process should be stopped. Thus, Equations (7) and (8) show us that in CD and SCD, the main involvement belongs to columns of matrix A.
The second pair of Equations (10) and (11) performs the other tactics, which characterize the conjugate gradients that are Lanczos’s-like methods. One can see that in Equation (10), the decisional role belongs to the residual vector y A x ( i 1 ) . The component of the residual vector is defined due to the vector A x ( i 1 ) and elements of unknown vector x in Equation (6) are directly dependent on it. The right part of Equation (11) shows that multiplications of the matrix strings on the current approximation vector x ( i 1 ) mainly contribute to the approximation x ( i ) . Thus, Lanczos’s-like methods use all strings of matrix A to build the solution.
Let us note that each string of the matrix and the corresponding element of the known vector y have their error that mainly consists of the measurement error and the error of the initial model exploited to solve the forward problem. Under the given tactic of the solution construction, the whole set of individual errors characterizing strings of the matrix participate to obtain x ( i ) . The influence of a big error of some separated string may destroy the adequacy of the inverse outcome presented by the vector x. In this study, we consider the general case when the total error is within limits that might be under control. To decrease the influence of such errors and construct a stable solution, the Tikhonov regularization method and the Twomey regularization method were simultaneously developed to minimize the smooth function [38,39]. The author of [19] reviewed both methods and compared them with the SVD regularization way that was proposed by the author of [40]. In [19], it was concluded that the Twomey-Tikhonov method is simpler than the SVD approach because it does not require singular vector calculations. In our opinion, the importance of the Twomey-Tikhonov method is that it gives a possibility of choice of variants when the solution is cut off.
It becomes clear that the iteration processes in SCD and Lanczos’s-like methods analyzed above are different. The SCD solution is retrieved using the matrix columns corresponding to elements of the reconstructed vector, while the conjugate gradients utilize all strings of the matrix. Obviously, the k-th matrix column includes elements of strings, which form the k-th component of an unknown vector on each iteration. If we have to deal with errors in some string, then the iteration process will poorly converge. In [41], to avoid such a situation, the starting approximation of some elements was set by incorporating the information from other disciplines. Such an approach permits us to regulate the solution without “forcing”change in the initial system. As indicated above, the solution vector in Lanczos’s-like methods is calculated using strings of the matrix, and approximation is simultaneously estimated for all elements of the unknown vector. In such a case, classical regularization might be appropriate.

3.2. The SCD Iterative Technique

Coordinate descent searches for a solution by advancing to it by moving from one coordinate direction k to another. The component of k-th gradient is determined by the value in Equation (9). The least-square function might be presented in the form of a scalar product:
F ( x ( i ) ) = ( A x ( i ) y , A x ( i ) y ) .
Let us use the coordinate form of the approximate solution that is Equation (7) and substitute the right part instead x ( i ) into Equation (12). The simple mathematical transformations lead to the next equation:
F ( x ( i ) ) = F ( x ( i 1 ) ) + ( α k A e k , α k A e k ) .
The following condition should be satisfied to obtain the convergence process:
F ( x ( i ) ) < F ( x ( i 1 ) ) .
By substituting of α k from Equation (9) into Equation (13), we obtain:
F ( x ( i ) ) = F ( x ( i 1 ) ) ( A x ( i 1 ) y , A e k ) 2 ( A e k , A e k ) .
Obviously, that the maximal value of the parameter D ( k ) = ( A x ( i 1 ) y , A e k ) 2 ( A e k , A e k ) provides the condition of the function F ( x ( i ) ) decrease presented by Equation (14). Formula derived by Equation (15) gives a possibility to achieve the minimal value of the function F ( x ) by the search of the direction k, for which D ( k ) has maximal value. Hence, the SCD iterative step calculates two parameters α k and D ( k ) for each k and then we estimate the maximal value D ( k ) . Consequently, we obtain the iterative contribution α k to the final value of the k -th element of unknown vector x. The following step finds the point x ( i ) from Equation (7) and calculates the next iterative residual of this point A x ( i ) y in order to evaluate the next iterative field of the D ( k ) values. Let us note that the element k is changed in current iteration step under the transition from i 1 to i because the found direction k corresponds to a unique minimum of the function in the point, which is determined by the direction k . Thus, in the next step, the minimum will belong to another element.

3.3. How to Distinguish Well and Poorly Resolved Elements in the Solution Vector?

The iterative process of the SCD solution search can be stopped when the residual of the point x ( i ) estimated as r ( i ) = y A x ( i ) is not growing with iterations and the standard deviation value of this vector is not bigger than the measuring error of the registered data. In practice, the simple way is to evaluate the standard deviation and mean values of the starting observation vector y and to analyze the fall of these values on the final iterative step. Then, one can see the closeness of the approximate solution x ( i ) to the accurate solution in the least-square sense. This is the overall characteristic of the model accuracy. It shows the level of equilibrium between the observed vector y and the model response A x ( i ) . The contribution of each element of the vector x ( i ) to that conformity is defined by the resolution parameter [24]. A simple mathematical transformation of Equation (15) adduces to the parameter that is the vector R k , elements of which ( r 1 , r k , r K ) , respectively, determine the resolution of elements x ( i ) = ( x 1 ( i ) , x k ( i ) , x K ( i ) ) . The resolution parameter R k is calculated using the following scalar products:
R k = 1.0 ( A x ( i ) y , A e k ) 2 ( A e k , A e k ) ( A x ( i ) y , A x ( i ) y ) .
The closeness of the element r k of the vector R k to 1.0 means that the resolution of the element x k ( i ) is high.

4. The SCD Application to Seismic Data in the Region of Geothermal Power Stations

Downhole seismic methods like vertical seismic profiling are actively used in the geothermal industry. Seismic tomography might be a cheap exploration tool because it does not require expenses for drilling. At the same time, one should notice that a set of not expensive receivers should be provided to obtain a high resolution. The seismic inhomogeneities might be revealed on various scales under the extended area in subsurface volume, while downhole seismic methods have limitations because they are able to illuminate characteristics on the drilling site only or around. Moreover, the drilling equipment can be destroyed due to the high temperature of geothermal fluids. The toxic and combustible gases on the surface of drilling rigs can be the cause of environmental damage. The tomography is a safe tool for ecology and might be exploited to give preliminary knowledge to select the site for the reservoir and to evaluate the production effectiveness. Below, we consider the problem of boreholes in more detail. In Section 4.3, we compare the SCD result with numerical values of seismic velocity found processing the vertical seismic profiling data in the area of the K 18 drilling borehole in the Krafla geothermal field (northeastern Iceland). The interpretations of other SCD images are also provided.

4.1. Why a Site for the Production Well Should Be Thoroughly Selected?

Energy consumption in the manufacturing process might be reduced owing to employing geothermal energy. The author of [42] pointed out the advantages of subsurface heat for the industry in comparison with fossil fuels, solar, and wind farms. Geothermal plants do not depend on the season time and may produce more energy than equivalent solar or wind farms. Unlike oil and gas, geothermal power is a clean and renewable type of energy for the defense environment.
Fossil fuel becomes a threat to human health because it contributes to climate change and global warming. The authors of [43] calculated the effects of greenhouse gas emissions over a life cycle of 20 years for heating systems based on geothermal energy and conventional gas. Geothermal pump systems can provide savings in the emission of 87.1% in comparison to conventional systems. Moreover, the authors remarked that particulate matter is formed due to burning fossil fuels.
On the other hand, extraction of subsurface geothermal resources might be accompanied by CO2 and CH4 direct emissions, emissions of metals, etc. The authors of [44] reviewed 30 studies on geothermal plants and revealed the influence of the geotechnical parameters of various drilling sites on the environment. The authors considered the following geological conditions: temperature of fluids, reservoir depth, and rock properties. Technical factors are the conversion technology, the production flow, and the plant capacity.
The financial costs of drilling lead to the necessity to develop drilling technology and improve resource identification. Sufficient rock permeability helps the drilling process. The authors of [45] supposed that channels of major fractures can be permeable structures. Moreover, fluids of fractures with higher temperatures than the temperature of geothermal resources may produce superheated steam at shallow depths, which has a chance to enter the borehole and improve the resource quality. Hence, the drill site properly chosen is able to optimize production.
At the same time, the production process of generating electricity requires multiple stimulations of wells accompanied by fluid injection. This leads to the growth of underground stress magnitude and provokes a big seismic event. Therefore, the authors of [46] recommended obtaining seismic velocity models prior to drilling and during the exploitation process to monitor the state of the geological medium.
The challenge of drilling arises for geothermal resources with a high temperature of fluids and closing to the host volcano. The authors of [47] described such difficulties of the Krafla power plant exploitation located northeast of Iceland. The area around this plant is the focus of the given research. The plant started production of energy in northeastern Iceland in 1978. Unfortunately, only one turbine operated instead of the two planned. The reason was in the Krafla volcano activity (the rifting episode during 1975–1984) with the appearance of acid volcanic gases caused corrosion of the well and its equipment. There was scale inside the drill pipe, and there was not enough steam to generate electricity. The attempt at deep drilling was made in 2008. However, it was not successful because the well had a collision with magma. The authors of [48] reviewed this case (“the IDDP-1 well at Krafla encountered magma”). During the drilling, volcanic magma was detected at a depth of 2.104 km. In spite of the Icelandic Deep Drilling Project (IDDP) plan to drill deeper to a depth of 4.5 km, the production of the well was stopped, taking into account the appearance of supercritical fluids with very high temperatures. Rhyolitic magma with a supercritical temperature of about 1050 °C was injected into the drill hole and brought technical problems: caving with the following need for cementing, being stuck, twisting off the bottom hole, etc. for almost three months [49]. Attempts to take coring in the barrel were failures.
All studies underline that the IDDP objective is to select sites for drilling. One of the opportunities to find such places might be given due to seismic exploration [48]. Therefore, the authors of [50] conducted the experiment using the well’s equipment (drill-bit) and the controlled source to image the seismic structure around the well in Nevada (US). Seismic data were recorded by surface geophones distributed along two parallel lines on both sides of the geothermal well at a distance of less than 1 km. The 2D velocity model was constructed to a depth of 1.5 km.
In the given research, we applied the SCD method to the dataset consisting of P-wave arrivals from noncontrolled sources, which are local earthquakes that occurred in northeastern Iceland. Events of small magnitudes were registered by temporary stations installed during the period 1986–1989, owing to the research group from Mainz University (Germany). We focus on the region where the Krafla and Theistareykir geothermal power plants are in the vicinities of volcanos Krafla and Theistareykir. Both stations are exploited for electricity production. The Theistareykir station turbines started regular operations in 2018, 40 years later than the Krafla pioneering turbine. Volcano Krafla erupted in 1984 [51]. After that, inflationary and deflationary pulses were observed during 1988 and 1989 consequently. Thus, the dataset we have used is non-common because seismic events were recorded just after rifting episodes and eruptions. Hence, the data correspond to a weakly unstable deformation state of the geological medium.

4.2. Measurements and Numerical Example of the System

The P-wave arrivals were measured from seismograms reported by 18 stations, which were distributed along the northeastern coast. The dataset consisted of 574 earthquakes, each of which was registered by a minimum of five receivers. A reading error for the whole dataset was estimated as having a normal distribution with s t d = 0.1 s.
The next steps were involved in the data pre-processing in order to construct the system of linear equations. Because northeastern Iceland is a complex transform tectonic zone, three main faults are located there, the parts of which are in the sea. Measurements were obtained near the land parts of the faults. The faults are oriented parallel to the tectonic transform. For answering the questions about the inhomogeneous structure along the faults, the position of the Cartesian coordinate system was changed. One of the axes was turned parallel to the faults. The latitude and longitude of hypocenters and receiver stations were transformed into coordinates of the orthogonal system. Then, in this system, the ray traces were constructed using an analytical solution for the chosen initial model (the forward modeling). Segments of the ray trace in the blocks of the geological medium formed elements of matrix A. The calculated differences between observed and theoretical travel times formed elements of vector b. The system of linear equations was determined utilizing matrix A and vector b. The matrix A had 3666 rows and 346 columns.
Some uncertainties arise when the SCD solver is applied. Because of the modeling error, a few values of the parameter D ( k ) , which are responsible for the minimum of the least-square function, can be near-equal in the SCD iterative step. For such case, the first author of this study developed the criterion in [35].
To show how the SCD method works, let us take a small part of the system. Let A be the 2 × 2 matrix, x be unknown 2 × 1 column, and b be 2 × 1 column:
A = 1.4965 5.3457 10.3484 2.5468 , x = x 1 x 2 , b = 0.3779 0.7905 .
The accurate solution of this system is vector x s o l :
x s o l = 0.1007 0.0989 .
Please note that the small matrix is given to illustrate the method steps. The dimension of the matrix is 2 × 2 , which means that 2 blocks were intersected by 2 rays. However, one should understand that in the initial matrix, at least 15 rays pass through one block. Otherwise, the information is not sufficient to construct the tomography solution. The initial system is very sparse, over-determined, and considered to be ill-conditioned. There is no accurate solution for such a system.
Table 1 demonstrates values of the SCD basic parameters α k and D ( k ) (see Section 3.1 and Section 3.2) at the first iteration step i = 1 .
One can see that the maximum of D ( k ) is achieved for the component k = 1 . Hence, the value α 1 must be selected to construct the first approximation as a vector:
x ( 1 ) = 0.0697 0.0 .
Then, using the approximation x ( 1 ) , we repeat the process and determine parameters α k and D ( k ) . After an Iterative procedure that checks the standard deviation of the residual vector A x ( 1 ) b , we obtain the solution.
Table 2 shows values of the approximation x ( 6 ) , the resolution parameter R k , and the difference Δ of the approximation components with components of the accurate solution x s o l after 6 iterations.
Testing confirms that the resolution parameter R k , which is close to 1.0, gives a small difference between the approximation and an accurate solution. Thus, the parameter R k plays an important role in the estimation of the solution quality. In the next section, we present the result of the obtained seismic anomalies that are characterized by high resolution. Good interpretation of the anomalies, especially numerical correspondence of found velocities to the borehole experiments, proves the necessity of resolution tool application.
Remark that in [35], the reader can find the detailed results of other numerical examples comparing the SCD method with Lanczos’s method under equal conditions of numerical experiments. Lanczos’s approach is the base of the group of gradient techniques, which were analyzed in this paper.

4.3. Identification of Well-Resolved Seismic Anomalies
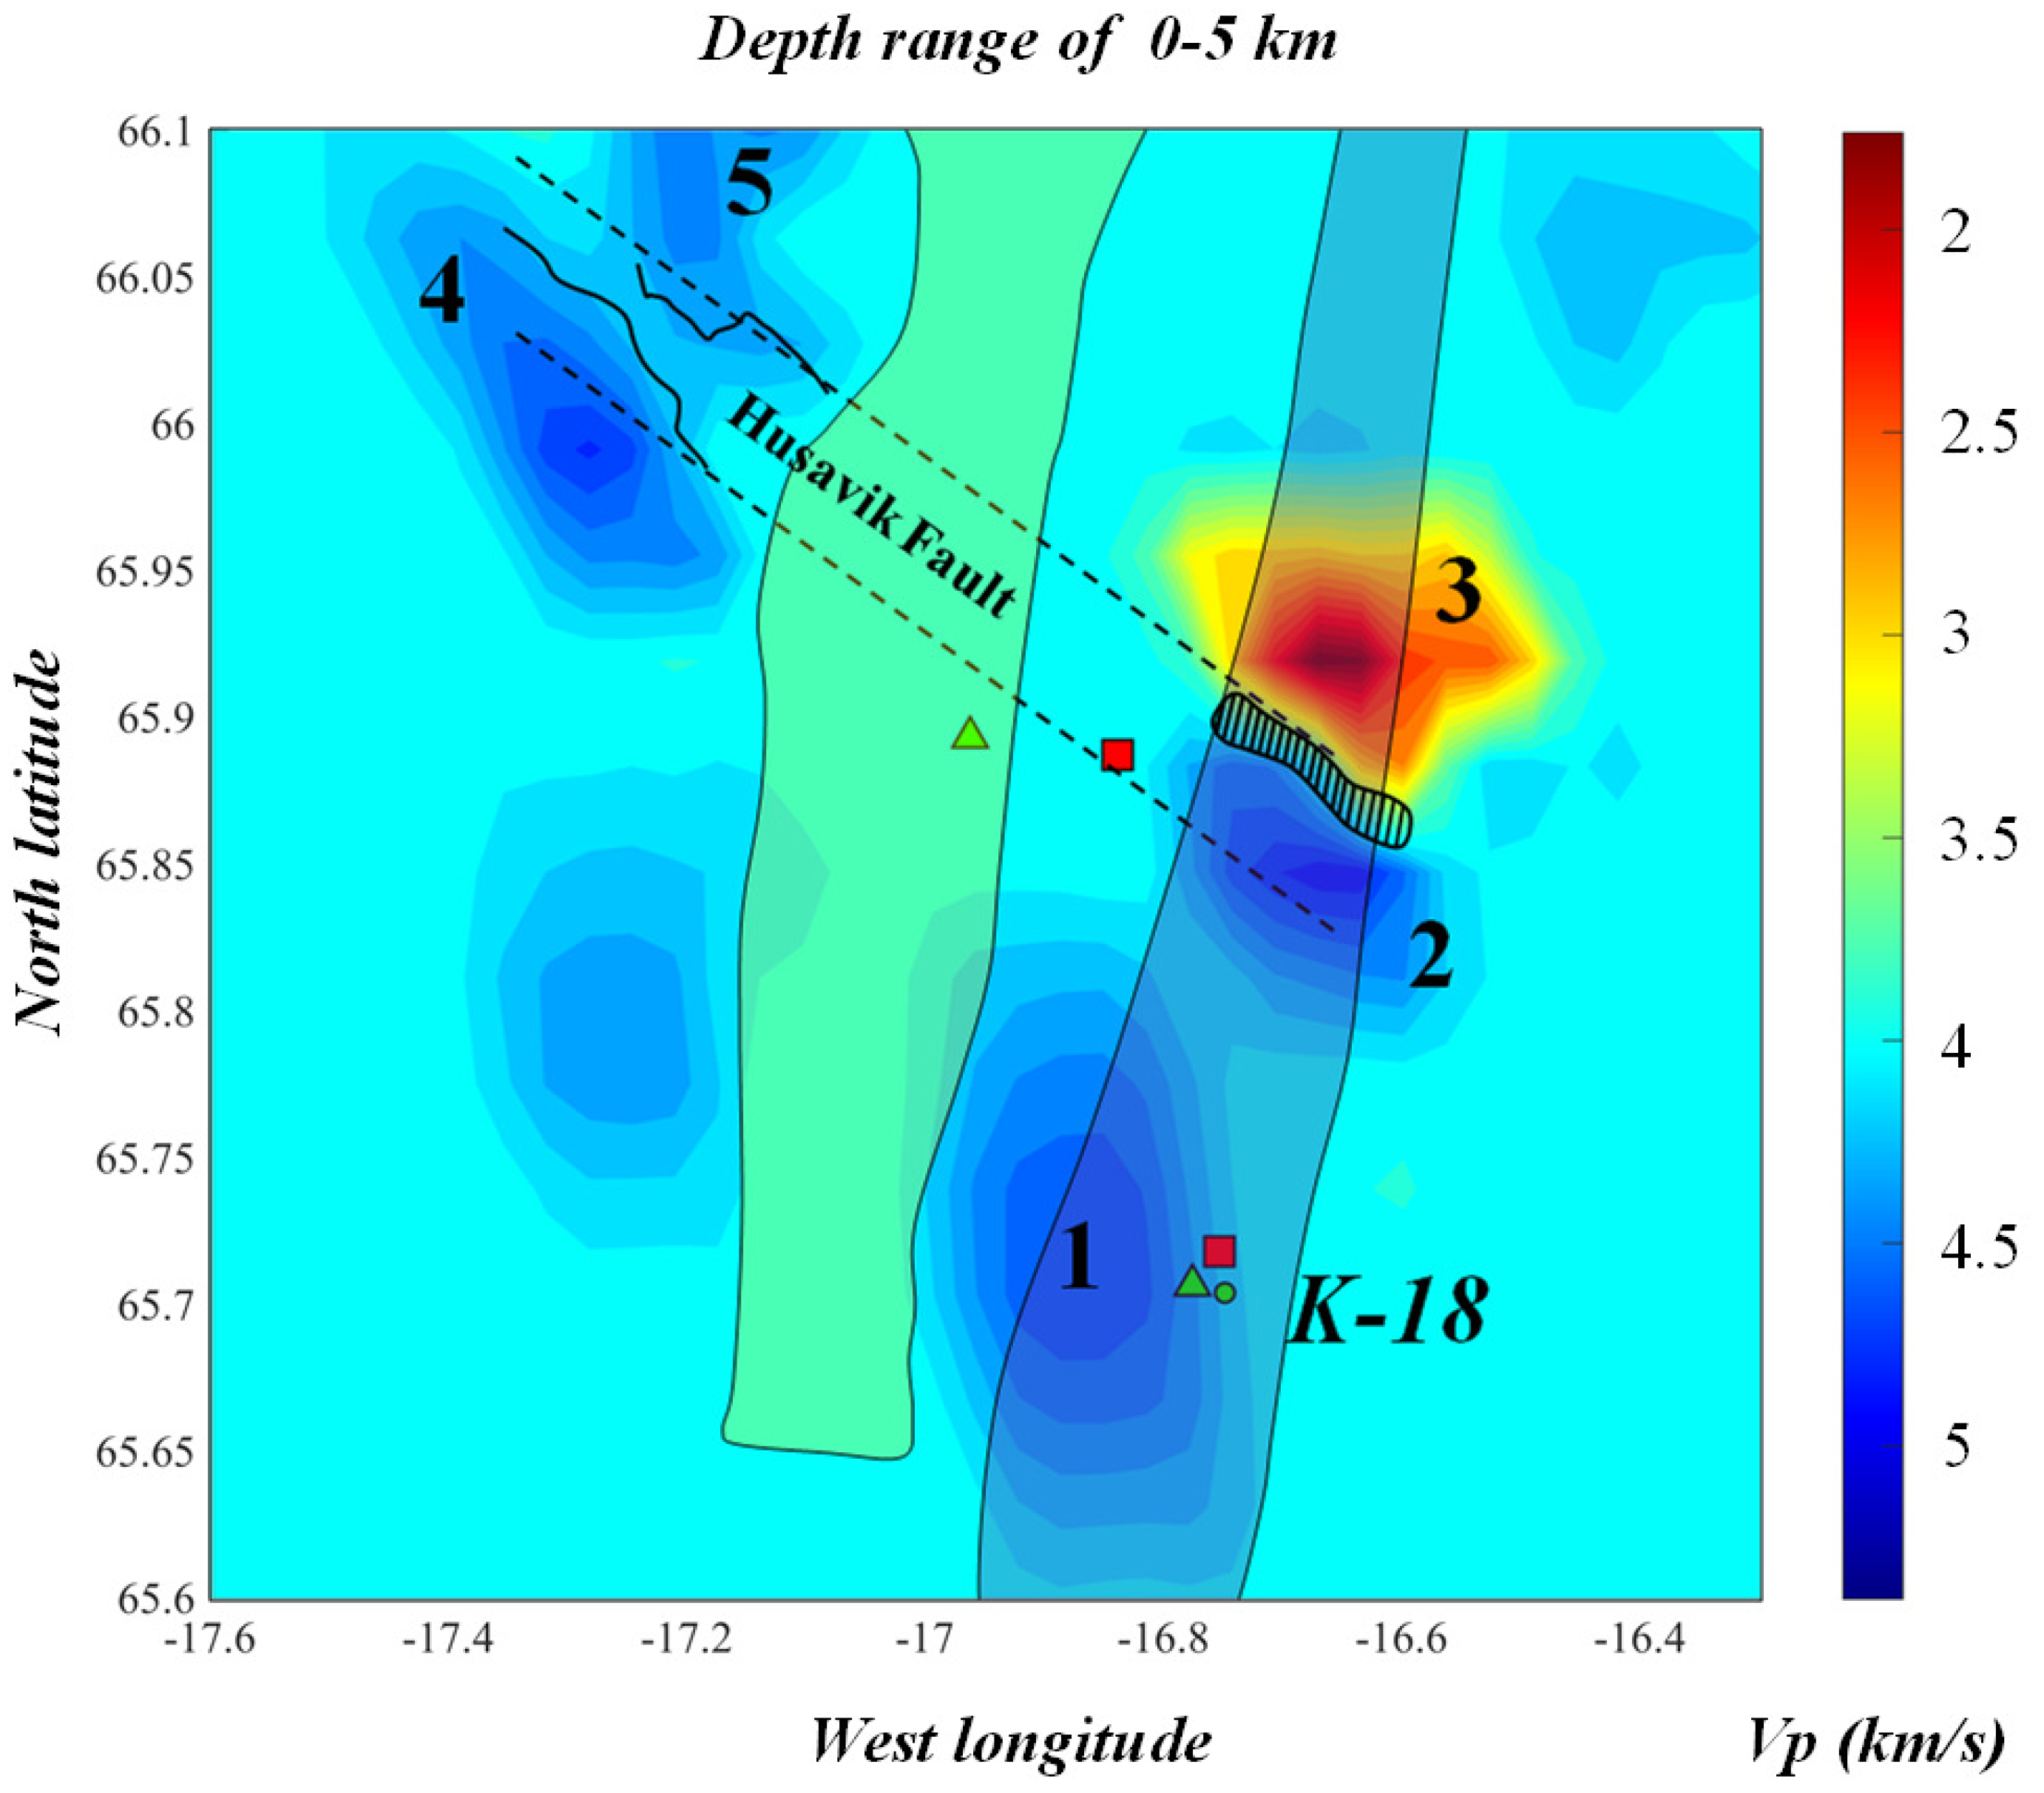
In Section 3.3, we have described the practical instrument (the resolution parameter), which is the indicator of trust or distrust in the result. The prior analysis showed that at the depth range of 0–5 km, anomalous structures are characterized by different values of elements of the resolution parameter R k . Well-resolved high-velocity anomalies with R k close to 1.0 are in good agreement with the relief elements [24].
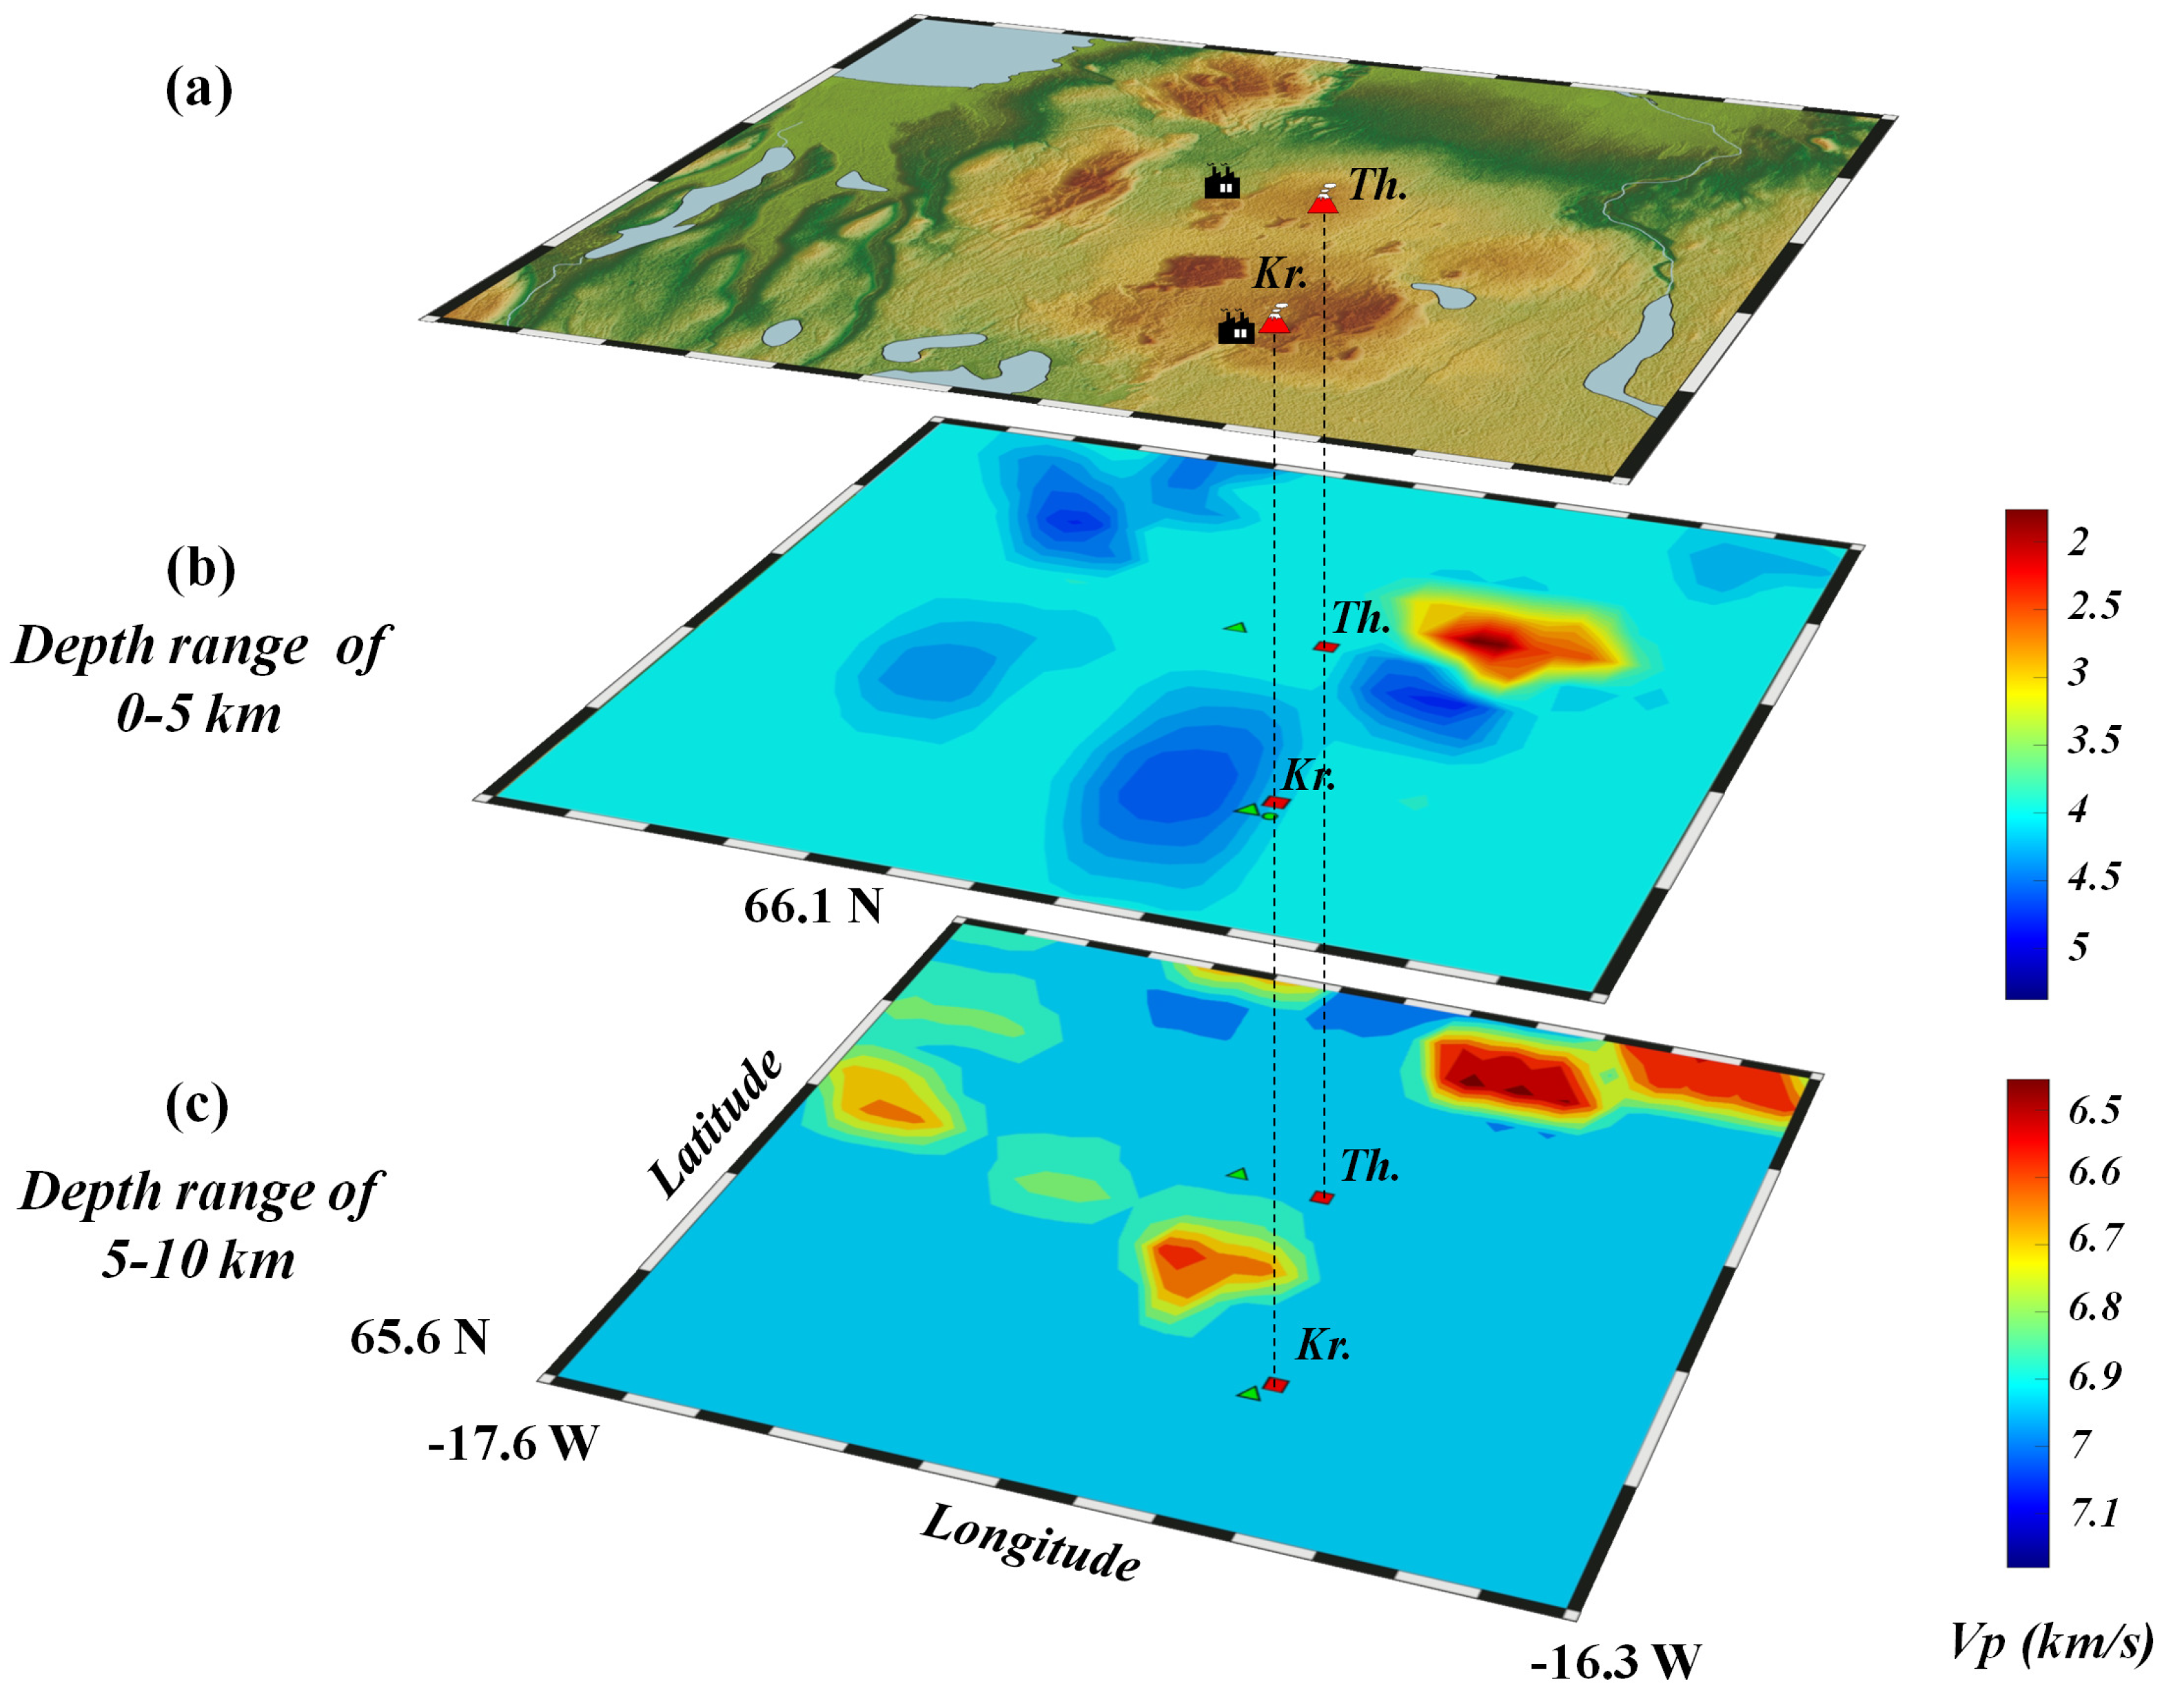
Figure 2a demonstrates the relief map and the obtained result for two subsurface layers at the depth range 0–5 (Figure 2b) and 5–10 km (Figure 2c). Notice that in Figure 2b,c red and blue colors denote low and high anomalies with respect to the P-wave average velocity ( V p ) that was calculated for each depth range in accordance with the initial model (see Section 2). In the figures mentioned above, the background shading corresponds to average velocities. On the right, color bars show concrete numerical values of velocities.
At the same time, each region of the world has its own reference model. Therefore, we analyze numerical values of V p , which are computed seismic velocities connected with local anomalies. Please note that only well-resolved areas are presented. They have a discontinuous location. Some of these areas are near the Krafla and Theistareykir geothermal power plants and enter volcano calderas. The others found in the same region are far from the geothermal energy production sites. The non-uniform distribution of seismic sources and receivers of seismic signals can explain this [24]. In the conducted experiment, receivers were mainly placed along the seashore, while not many hypocenters were registered inside and around calderas southward from the receivers array. The distance between receivers was about 10 km. The decrease in this distance owing to a dense network and the increase in the amount of recorded data can procure the resolution growth.
The unsuccessful drilling attempt at Krafla in 2008 allows us first to focus on the found anomalies that are within the Krafla volcanic caldera. The authors of [52] carried out a detailed analysis of the influence of rifting episodes on the Krafla volcano. We compared the anomaly locations with the structural pattern of fractures that were revealed owing to geological research. To see the structural details and identify the inhomogeneities Figure 3 and Figure 4 display the result in the planar longitude-latitude and correspond to Figure 2b,c.
Seismic tomography shows P-wave high-velocity inhomogeneity till 5 km of depth. In Figure 3, it corresponds to Anomaly 1 (around the point 65.707 N; 16.87 W). It involves the western part of the caldera. Some small fracture segments of the caldera are inside this anomaly, while a basic eastern line of the caldera frame is located outside. The anomaly (10 km wide and 18 km long) is stretched in a north-south orientation. P-wave velocity is distributed from 4.35 to 4.54 km/s increasing from north to south. The found value V p of 4.54 km/s captures rocks of the recent Krafla rifting episode. The southern set of fractures and fissures is defined by the authors of [52]. The fractures are adjoined to some rocks.
Anomaly 1 was compared with the result of the vertical seismic profile integrated analysis that was made for the K-18 borehole located in a 1-km radius of volcano Krafla and the geothermal well. The exploration borehole was drilled in 1981 down to 2215 m depth. Vertical seismic profiling was realized in 2014. Thus, the profiling results [53,54], as well as our results, detected the state of subsurface velocity structures after a basic volcanic event, i.e., the eruption in 1984. In [53,54], the P-velocity model was calculated using (1) sonic log data collected within K-18 and (2) P-wave data generated by the explosive source (2 km outside of K-18) and air gun (over K-18). The processing of data (1) showed that the average velocity of the acoustic P-wave is 4.43 km/s. The average P-wave velocity for seismic data (2) is 4.6 km/s, which nearly coincides with our result. The K-18 well temperature was about 185 °C, which is lower by 1.62 than the temperature in the surrounding field. The authors of [53,54] supposed the existence of barriers, which hinder feeding the well site. Their interpretation shows that the complex geological structure of the borehole comprises basalt lava flows, pumice composition, crystalline basalt, and gabbro. The crystalline basalt, with an average velocity of 4.5 km/s, corresponds to the depth range from 1.12 to 1.88 km, which is the highest thickness layer. This layer is a central part of the depth range 0–5 km. P-wave velocity value in the crystalline basalt is in good agreement with the value of Anomaly 1. Hence, we identify the inhomogeneity connected with Anomaly 1 as the rock that is the crystalline basalt.
The critical 2008 IDDP-1 well is placed about 2 km northwest of the K-18. As mentioned in the previous section, rhyolitic magma entered this borehole when the depth reached more than 2 km. Before drilling, the integrated model was constructed using seismic and magnetotelluric data. On the basis of this model, the incorrect suggestion was made that the magma is deeper than the 4.5 km depth planned by IDDP [49]. In the opinion of the authors [49], the model resolution was not good, and a dense observation network must be employed to understand the reservoir structure. Much earlier, the author [55] identified the S-wave shadow zone beneath the Krafla caldera and estimated that the magma chamber is located in a 3–7 km depth range, which is in agreement with the fact of the drilling failure. In 2008, the authors [56] participated in the construction of the revised model for the Krafla geothermal field. They revealed the structural features of the temperature regime for different parts of the IDDP-1 and established that superheated steam is below 2.0 km, which indicates some risk for the given site. In this paper, we obtain knowledge of the reservoir area after erroneous drilling. However, the SCD outcomes are obtained for crucial depth ranges 0–5 km and 5–10 km. Therefore, we suppose that the revealed information will contribute to the reliable evaluation of other well sites. However, the SCD outcomes are obtained for crucial depth ranges 0–5 km and 5–10 km.
Anomaly 2 with a high V p = 4.7 km/s represents an inhomogeneous formation around the point (65.85 N; 16.696 W). This anomaly was detected at the depth range of 0–5 km (Figure 3). The revealed structure is located on uplift within the extrapolation of the Husavik transform fault zone, which was established in [52] (dash line in Figure 3). The anomaly adjoins the junction of the Krafla fissure swarm and the Husavik extrapolation zone (the southeastern flank). We assume that the high-velocity structure can be an obstacle to the extension of the Husavik zone to the southeast. At the same time, the high-velocity inhomogeneity borders with an extremely low-velocity structure that is Anomaly 3 in Figure 3, which is located around the point (65.92 N; 16.69 W). Anomaly 3 is in the lowland to the north direction and has a V p of 1.9 km/s. The boundary between the two contrasting structures is denoted by the shaded zone in Figure 3 and adjoins the northern line of the Husavik faults extrapolation (dash line in Figure 3). Recent tomography studies show that hypocenters of strong earthquakes might be located at the boundary between the high and low-velocity zones [36,57]. Thus, the narrow local zone of the revealed boundary becomes critical and requires the detailed analysis of researchers from different disciplines. Let us make an important note. This zone is close to the Theistareykir volcanic area. There is a risk of drilling there.
Anomalies 4 and 5 present large-size inhomogeneities with high velocities V p = 4.7 and 4.4 km/s and identify uplifts. The authors of [58] mapped the Husavik fault and the main normal faults and lineaments in the given region. The corresponding lines were revealed owing to determining accurate relative locations of small earthquake swarms and focal mechanisms of various earthquakes and analyzing the field data. We have compared the positions of the fault lines and anomalies 4 and 5. Figure 3 displays the basic fault locations denoted by solid lines in accordance with [58], and the graphical contours of anomalies coincide with these lines. This confirms the high quality of the tomography results obtained in the present research.
Figure 3. The SCD numerical result for the depth range of 0–5 km. Digits 1–5 mark the anomalies. Black solid lines denote segments of the Husavik fault (after [58]). Dashed parallel lines show the Husavik extrapolation zone (after [52]). The Theistareykir and Krafla volcanos and plants are designated by red squares and green triangles, respectively. The K-18 borehole is marked by a black circle. Approximate outlines of the Theistareykir and Krafla fissure swarms are shaded light green and light blue, respectively (after [52]). Black vertical lines (see Section 4.3) shade the critical boundary between anomalies 2 and 3.
Mathematics 11 04297 g003
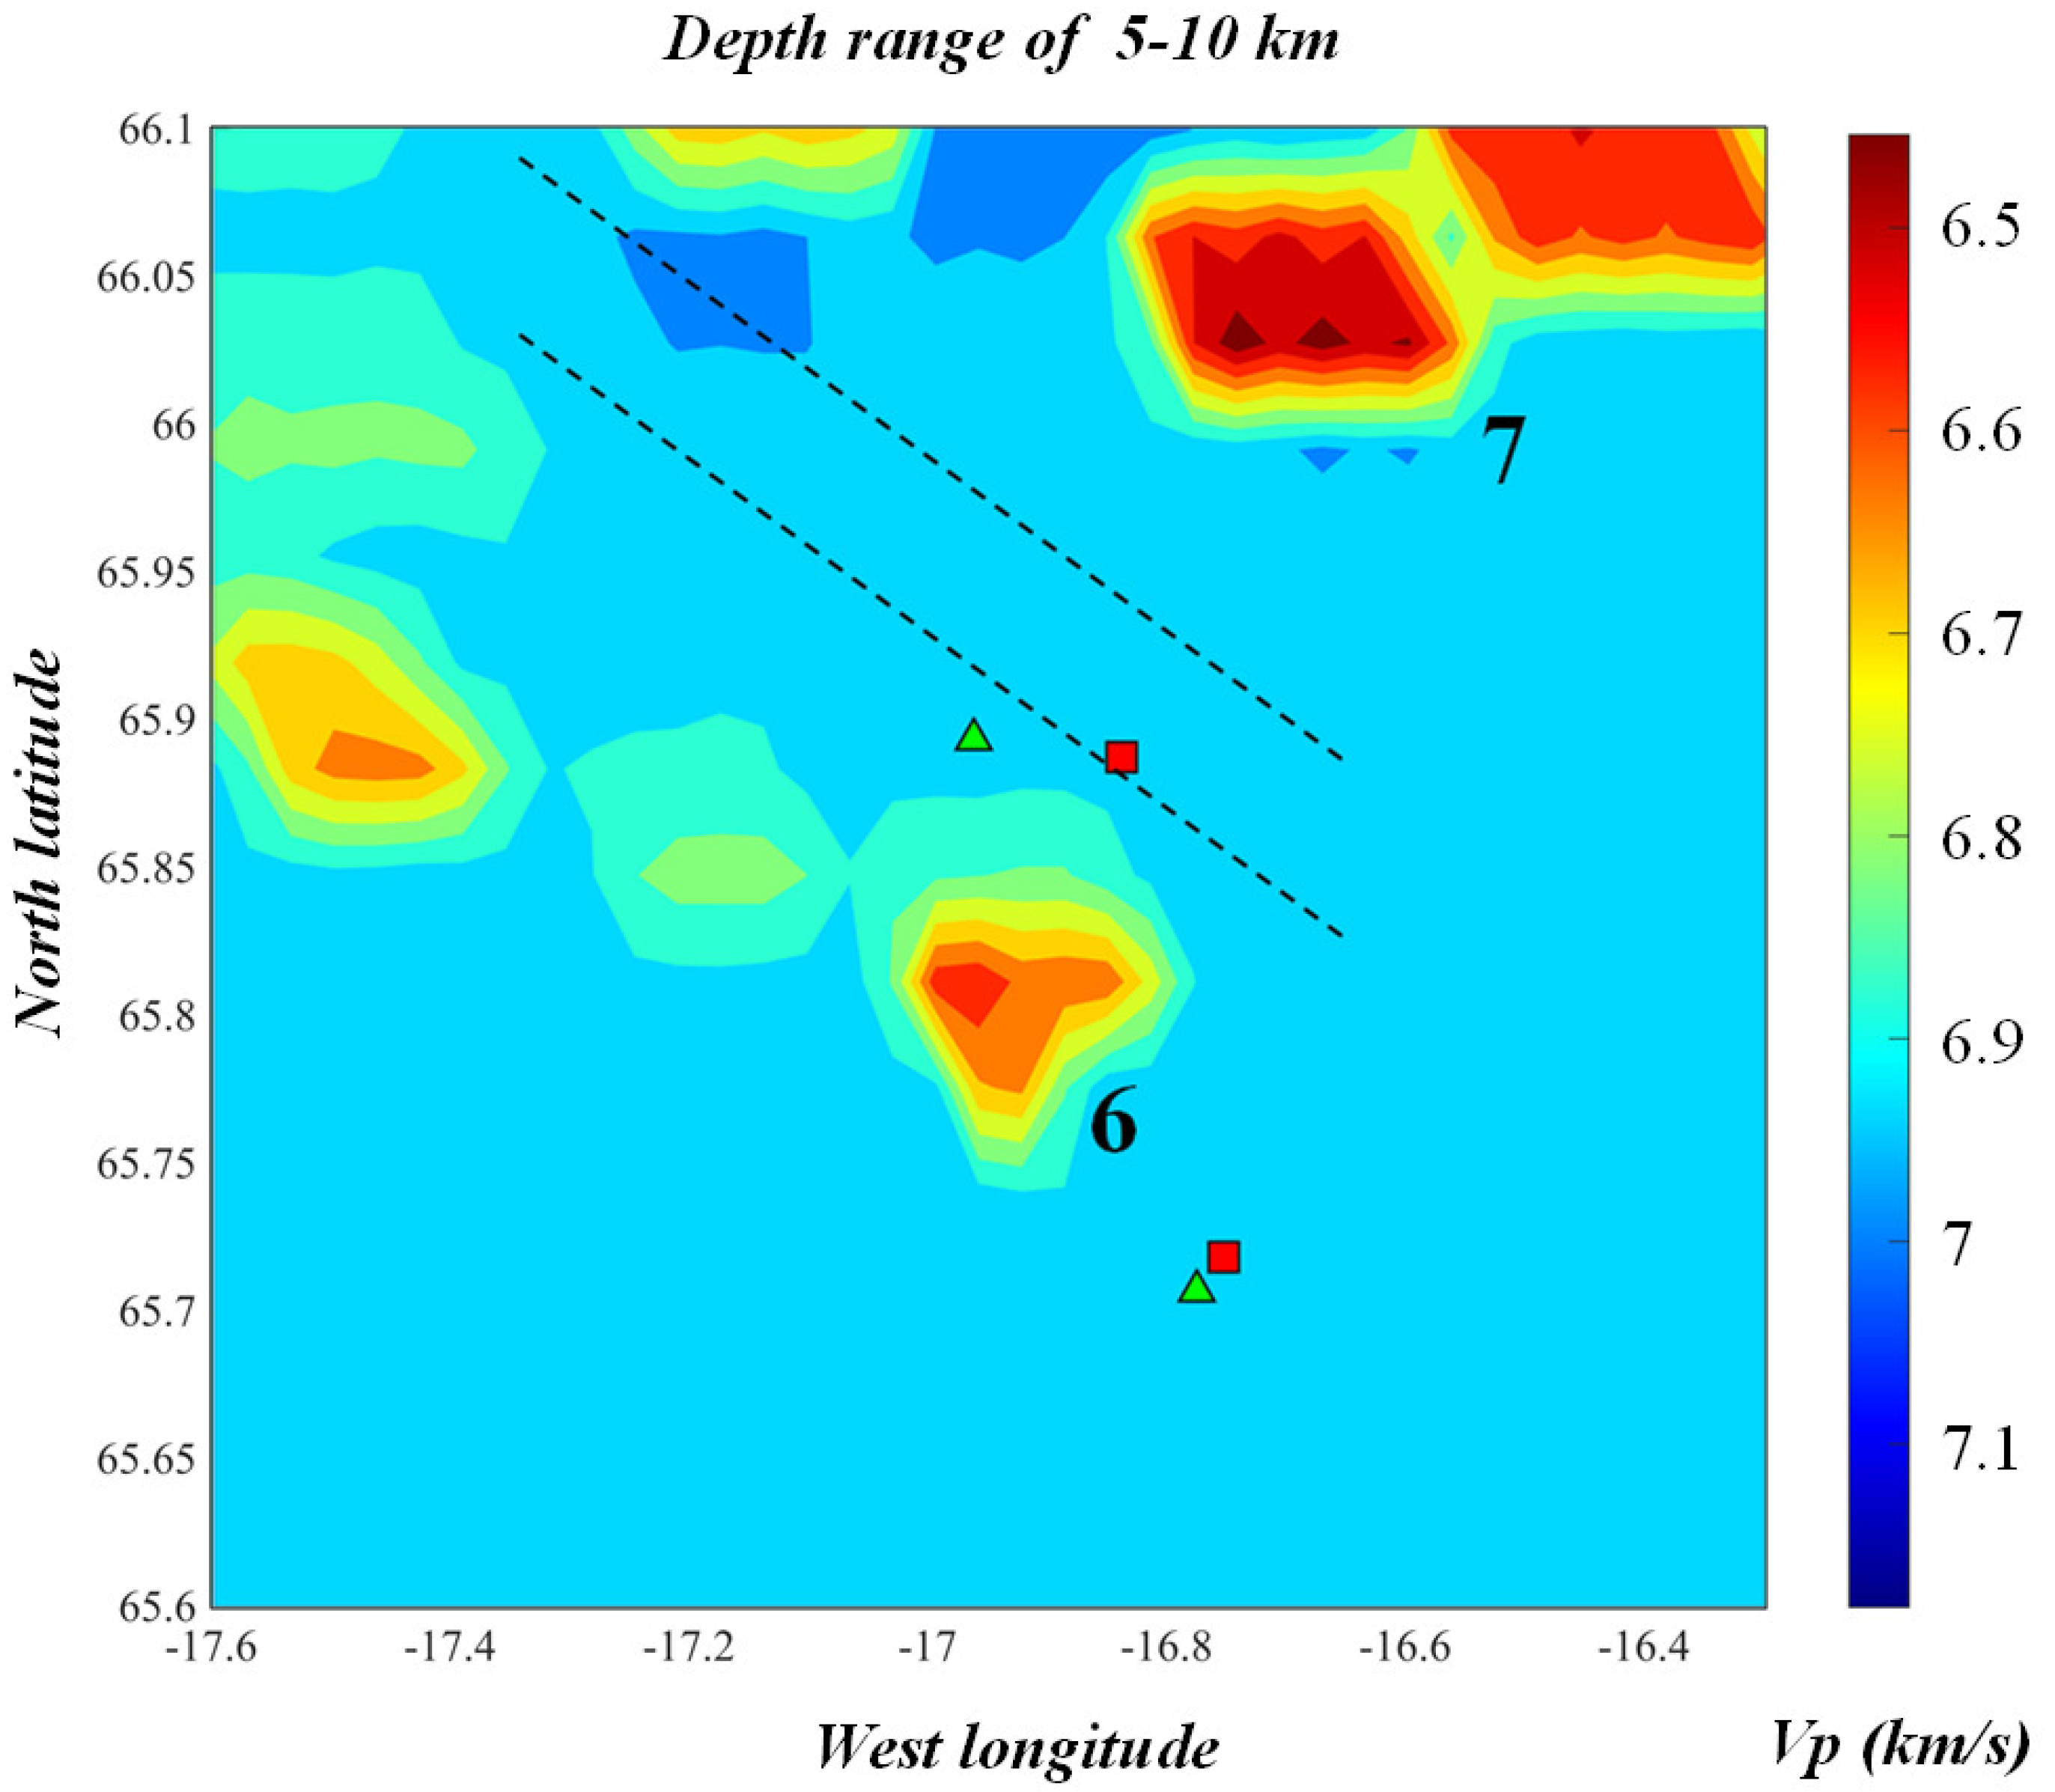
Figure 4 displays anomalies determined at the depth range of 5–10 km. Anomaly 6 around the point (65.82 N; 16.98 W) with low V p = 6.55 km/s is northwest of the area of power plant Krafla. As indicated above, the 4–5 km is a crucial depth range that defines the behavior of Earth’s materials in the drilling area. The temperature regime is changed, and two options for the drilling process may take place: (1) hot magma can be injected into the drilling hole with big risks, or (2) magma is outside of drilling wells and fluids with high temperatures will provide high-enthalpy steam that is beneficial for the electricity production [45].
The authors of [59] conducted numerous experiments to determine the P-velocity values for the rocks under conditions of high pressures and temperatures that are close to reality. The P-velocity measurements in amphibolite and basalt were made in the presence of water at a pressure of 300 MPa. The authors illustrated that in the case of amphibolites at the segment of some proximity to the temperature 600 °C, there is a sharp linear decrease in V p from 7.5 km/s (for lower temperatures 0–500 °C) to 5.5 km/s. Then, there is a sharp linear increase from 5.5 km/s to 7.0 km/s when the temperature reaches 900 °C. Thus, there is an “open triangle” of the P-wave velocity change between 500 °C and 900 °C. For amphibolites, the value 6.5 km/s corresponds to values of the temperature: 600 °C and 810 °C. In the case of basalt, the parabolic decrease in V p from 5.25 km/s (temperature 620 °C) to 3.5 km/s (temperature 900 °C) takes place. The maximal value of V p = 5.5 km/s basalt has at the segment around 300 °C. The authors of [60] empirically identified minerals for which high temperatures varied from upper and lower limits. The temperature for actinolite (amphibole) is varied from 300 °C to 600 °C. The modeling of the temperature regimes for hydrothermal fluids showed that fluids have supercritical conditions at the depth below 5 km (>600 °C) and amphibolite facies grade of metamorphism can reach temperatures > 400 °C [45]. It is known that amphibolites are mainly formed from basalts and gabbro. The intrusion gabbro in dense basaltic composition was detected at the drilling final depth interval of 1.69–2.2 km [53]. Taking into account all these studies, we identify Anomaly 6 with V p = 6.5 km/s as amphibolites.
Figure 4. The SCD numerical result for the depth range of 5–10 km. Digits 6–7 mark the anomalies. The Theistareykir and Krafla volcanos and plants are designated by red squares and green triangles, respectively. Dashed parallel lines show the Husavik extrapolation zone (after [52]).
Mathematics 11 04297 g004
Anomaly 6 is part of a low-velocity zone parallelly located to the southern line of the extrapolation of the Husavik transform fault zone. The zone involves low-velocity inhomogeneities distributed as 6.5, 6.78, 6.57, and 6.73 km/s to the northwest of the Krafla production area. The western end of the zone ( V p = 6.73 km/s) turns to the direction of the Husavik fault.
Anomaly 7 around the point (66.04 N; 16.7 W) is the strong low-velocity inhomogeneity with V p = 6.22 km/s at the depth range of 5–10 km. Its location corresponds to high fracture density inside the Krafla fissure swarm studied in [52]. This local area consists of Holocene deformation, and fractures are distributed in loose rocks [52]. It is known that such rocks are characterized by high porosity. Anomaly 7 adjacent to rivers and lakes, and we assume that pores of rocks can involve fluids. The authors of [61] outlined the rock theory based on laboratory studies and field works. In their opinion, the saturation of the fracture materials pores by fluids decreases V p . Thus, we identify inhomogeneity 7 as rocks, whose pores are activated with fluids.

5. Discussion and Conclusions

The paper described the fundamentals of the innovative SCD method and compared SCD with conventional techniques that are exploited in production and logistic systems to identify inhomogeneities. SCD is the analogue of the classical CD. At the same time, the difference between SCD and CD was outlined. Specifically, in SCD, the analytical solution simplifies the search for the least-square function minimum. The difference between SCD and the conjugate gradient algorithms was also studied. In SCD, the direction of the function minimum is defined using the individual matrix column, while the conjugate gradients utilize all strings of the matrix. This SCD feature was the reason for a good reconstruction of the separated large-size inhomogeneity as testing experiments revealed in earlier work [35]. Within this study, SCD was applied to seismic data from the conducted experiments in the area of geothermal plants Krafla and Theystareykir in northeastern Iceland. The results confirmed the SCD’s ability to determine large-size anomalies in the domain of high resolution.
The seven inhomogeneities located at depths that are responsible for secure drilling were identified. A detailed comparison was made between them and the outcomes of many other studies. The range for interpretation involves vertical seismic profiling [53,54], the laboratory experiments of rock transformations at high pressure and temperature [59], calculations of focal mechanisms of the earthquake clusters [58], temperature regimes for rocks [60], scenarios of deep fluids behavior [45], recent geological advances based on field survey cartography data, satellite image interpretation, and aerial photos [52].
The critical line (shaded band in Figure 3) was revealed owing to the identification of the contrasting high and low anomalies. Based on previous studies [36,57], we assume that the probability of a strong earthquake appearance is high along this line. Therefore, we guess careful seismic monitoring utilizing a dense network to control the energy production process in the Theystareykir geothermal field and its vicinities.
In this paper, the theoretical analysis of SCD and the result of its practical application to seismic observations, which is consistent with the data of related disciplines, convince us that this method can retrieve large-size structures. We conclude that the technique might be useful as a cheap prior tool for drill planning. To prevent emergencies, the drilling strategy requires knowledge of the characteristics of rocks at great depths. Icelandic experience described in this study shows that many efforts of drilling failed because of the injection of hot magma into the drilling hole. Therefore, the collaboration of researchers and working groups of industrial projects is needed to select proper sites. Due to SCD’s ability to detect large-size anomalies, we estimated the places that are inappropriate for drilling because of seismic hazards.
The SCD particularity can be used in other industrial branches too, for instance, in the manufacture of various materials to detect the appearance of separated inhomogeneity in the out product, to differentiate similar color saturation spots in satellite images etc.

Author Contributions

Conceptualization, T.S. and A.S.; developed method, T.S.; software realizing the method, T.S.; graphical software, A.S.; visualization of results, A.S.; investigation, T.S. and A.S.; writing—original draft preparation, T.S. and A.S. All authors have read and agreed to the published version of the manuscript.

Funding

This research was supported under project No. 122022800270-0 funded by the Ministry of Science and Higher Education of the Russian Federation (FMME-2022-0004).

Data Availability Statement

Not applicable.

Acknowledgments

We thank Wolfgang Jacoby (Mainz University, Germany), owing to whom the seismic experiment was organized in northeastern Iceland. The collected data have been used in our research.

Conflicts of Interest

The authors declare no conflict of interest.

References

  1. Ratliff, N.; Toussaint, M.; Schaal, S. Understanding the geometry of workspace obstacles in Motion Optimization. In Proceedings of the 2015 IEEE International Conference on Robotics and Automation (ICRA), Seattle, WA, USA, 26–30 May 2015; pp. 4202–4209. [Google Scholar] [CrossRef]
  2. Chen, Y.; Luo, X.; Han, B.; Jia, Y.; Liang, G.; Wang, X. A General Approach Based on Newton’s Method and Cyclic Coordinate Descent Method for Solving the Inverse Kinematics. Appl. Sci. 2019, 9, 5461. [Google Scholar] [CrossRef]
  3. Walley, S.M.; Field, J.E. Elastic Wave Propagation in Materials. In Reference Module in Materials Science and Materials Engineering; Elsevier: Cambridge, UK, 2016. [Google Scholar] [CrossRef]
  4. Hernandez, P.M.; Socas, A.; Benitez, A.N.; Ortega, F.; Diaz, N.; Marrero, M.D.; Monzon, M.D. Boundary Element Method Applied to Electroforming Process. Mater. Sci. Forum 2014, 797, 125–132. [Google Scholar] [CrossRef]
  5. Xie, C.G. Applications of tomography in oil-gas industry—Part 1. In Industrial Tomography, Woodhead Publishing Series in Electronic and Optical Materials; Wang, M., Ed.; Woodhead Publishing: Cambridge, UK, 2015; pp. 591–632. [Google Scholar] [CrossRef]
  6. Pariseau, W.G. Finite Element Analysis of Barrier Pillar Mining at Crandall Canyon. In Mine Safety and Health Administration; University of Utah: Salt Lake City, UT, USA, 2008. [Google Scholar]
  7. Mishra, D.; Yadav, R.S.; Agrawal, K.K. Kinematic modelling and emulation of robot for traversing over the pipeline in the refinery. Microsyst. Technol. 2020, 26, 1011–1020. [Google Scholar] [CrossRef]
  8. Hachtel, G.D.; Brayton, R.K.; Gustavson, F.G. The Sparse Tableau Approach to Network Analysis and Design. IEEE Trans. Circuit Theory 1971, 18, 101–113. [Google Scholar] [CrossRef]
  9. de Araujo, L.R.; Penido, D.R.R.; Pereira, J.L.R.; Carneiro, S., Jr. A Sparse Linear Systems Implementation for Electric Power Systems Solution Algorithms. J. Control Autom. Electr. Syst. 2013, 24, 504–512. [Google Scholar] [CrossRef]
  10. Werff, H.; Noomen, M.; Meijde, M.; Kooistra, J.; Meer, F. Use of hyperspectral remote sensing to detect hazardous gas leakage from pipelines. In New Developments and Challenges in Remote Sensing; Millpress: Rotterdam, The Netherlands, 2007; pp. 707–715. [Google Scholar]
  11. Horiuchi, S.; Negishi, H.; Abe, K.; Kamimura, A.; Fujinawa, Y. An Automatic Processing System for Broadcasting Earthquake Alarms. Bull. Seismol. Soc. Am. 2005, 95, 708–718. [Google Scholar] [CrossRef]
  12. Engquist, B.; Rimborg, O. Multi-phase computations in Geometrical Optics. J. Comput. Appl. Math. 1996, 74, 175–192. [Google Scholar] [CrossRef]
  13. Dehghanghadikolaei, A.; Ibrahim, H.; Amerinatanzi, A.; Elahinia, M. 9—Biodegradable magnesium alloys. In Woodhead Publishing Series in Biomaterials, Metals for Biomedical Devices, 2nd ed.; Niinomi, M., Ed.; Woodhead Publishing: Cambridge, UK, 2019; pp. 265–289. [Google Scholar] [CrossRef]
  14. Ghosh, A.; Mallik, A.K. Theory of Mechanisms and Machines, 3rd ed.; Affiliated East West Press: New Delhi, India, 2015. [Google Scholar]
  15. Wang, L.; Chen, C.A. Combined optimization method for solving the inverse kinematics problem of mechanical manipulators. IEEE Trans. Robot. Autom. 1991, 7, 489–498. [Google Scholar] [CrossRef]
  16. Toussaint, M. Robot trajectory optimization using approximate inference. In Proceedings of the 26th International Conference on Machine Learning (ICML), Montreal, QC, Canada, 14–18 June 2009; pp. 1049–1056. [Google Scholar]
  17. Luenberger, D.G.; Ye, Y. Conjugate Direction Methods. In Linear and Nonlinear Programming; International Series in Operations Research & Management Science; Springer: New York, NY, USA, 2008; Volume 116, pp. 263–284. [Google Scholar] [CrossRef]
  18. Wright, S.J. Coordinate descent algorithms. Math. Program. 2015, 151, 3–34. [Google Scholar] [CrossRef]
  19. Rodgers, C.D. Inverse Methods for Atmospheric Soundings: Theory and Practice; Series on Atmospheric, Oceanic and Planetary Physics; World Scientific: Singapore, 2000; Volume 2. [Google Scholar] [CrossRef]
  20. Aliabadi, M.H. Boundary Element Methods in Linear Elastic Fracture Mechanics. In Reference Module in Materials Science and Materials Engineering; Elsevier: Amsterdam, The Netherlands, 2016. [Google Scholar] [CrossRef]
  21. LaForce, T. PE281 Boundary Element Method Course Notes; Stanford University: Stanford, CA, USA, 2006. [Google Scholar]
  22. Valente, F.P.; Pina, H.L.G. Iterative solvers for BEM algebraic systems of equations. Eng. Anal. Bound. Elem. 1998, 22, 117–124. [Google Scholar] [CrossRef]
  23. Lanczos, C. An iteration method for the solution of the eigenvalue problem of linear differential and integral operators. J. Abbr. 1950, 45, 255–282. [Google Scholar] [CrossRef]
  24. Smaglichenko, T.A.; Smaglichenko, A.V. Resolution Estimates for Selected Coordinate Descent: Identification of Seismic Structure in the Area of Geothermal Plants. In Advances in Production Management Systems. Artificial Intelligence for Sustainable and Resilient Production Systems. IFIP Advances in Information and Communication Technology; Dolgui, A., Bernard, A., Lemoine, D., von Cieminski, G., Romero, D., Eds.; Springer: Cham, Switzerland, 2021; Volume 630, pp. 580–588. [Google Scholar] [CrossRef]
  25. Dahm, T.; Cesca, S.; Hainzl, S.; Braun, T.; Kruger, F. Discrimination between induced, triggered, and natural earthquakes close to hydrocarbon reservoirs: A probabilistic approach based on the modeling of depletion-induced stress changes and seismological source parameters. J. Geophys. Res. Solid Earth 2015, 120, 2491–2509. [Google Scholar] [CrossRef]
  26. Wilson, M.P.; Davies, R.J.; Foulger, G.R.; Julian, B.R.; Styles, P.; Gluyas, J.G.; Almond, S. Anthropogenic earthquakes in the UK: A national baseline prior to shale exploitation. Mar. Pet. Geol. 2015, 68, 1–17. [Google Scholar] [CrossRef]
  27. Foulger, G.R.; Wilson, M.P.; Gluyas, J.G.; Julian, B.R.; Davies, R.J. Global review of human-induced earthquakes. Earth-Sci. Rev. 2018, 178, 438–514. [Google Scholar] [CrossRef]
  28. Paige, C.; Saunders, M. LSQR: An algorithm for sparse linear equations and sparse least squares. ACM Trans. Math. Soft. 1982, 8, 43–71. [Google Scholar] [CrossRef]
  29. Fong, D.C.L.; Saunders, M. LSMR: An iterative algorithm for sparse least-squares problems. SIAM J. Sci. Comput. 2011, 33, 2950–2971. [Google Scholar] [CrossRef]
  30. Widiyantoro, S.; van der Hilst, R. Mantle structure beneath Indonesia inferred from high-resolution tomographic imaging. Geophys. J. Int. 1997, 130, 167–182. [Google Scholar] [CrossRef]
  31. Tryggvason, A.; Rognvaldsson, S.T.; Flovenz, O.G. Three-dimensional imaging of the P- and S-wave velocity structure and earthquake locations beneath Southwest Iceland. Geophys. J. Int. 2002, 151, 848–866. [Google Scholar] [CrossRef]
  32. Bianco, M.J.; Gerstoft, P.; Olsen, K.B.; Lin, F. High-resolution seismic tomography of Long Beach, CA using machine learning. Sci. Rep. 2019, 9, 14987. [Google Scholar] [CrossRef]
  33. Yao, Z.S.; Roberts, R.G.; Tryggvason, A. Calculating resolution and covariance matrices for seismic tomography with the LSQR method. Geophys. J. Int. 1999, 138, 886–894. [Google Scholar] [CrossRef]
  34. Leveque, J.J.; Rivera, L.; Wittlinger, G. On the use of the checker-board test to assess the resolution of tomographic inversions. Geophys. J. Int. 1993, 115, 313–318. [Google Scholar] [CrossRef]
  35. Smaglichenko, T.A.; Nikolaev, A.V.; Horiuchi, S.; Hasegawa, A. The method for consecutive subtraction of selected anomalies: The estimated crustal velocity structure in the 1996 Onikobe (M = 5.9) earthquake area (1996), northeastern Japan. Geophys. J. Int. 2003, 153, 627–644. [Google Scholar] [CrossRef]
  36. Smaglichenko, T.A.; Jacoby, W.; Smaglichenko, A.V. Alternative 3D Tomography Methods and Their Applications to Identify Seismic Structure Around the Hydrothermal Gas Field. In Proceedings of the 2020 Eleventh International Conference “Management of Large-Scale System Development” (MLSD), Moscow, Russia, 28–30 September 2020; Institute of Electrical and Electronics Engineers (IEEE): Piscataway Township, NJ, USA, 2020; p. 9247697. [Google Scholar] [CrossRef]
  37. Warga, J. Minimizing certain convex functions. J. Soc. Ind. Appl. Math. 1963, 11, 588–593. [Google Scholar] [CrossRef]
  38. Twomey, S. On the numerical solution of Fredholm integral equation of the first kind by the inversion of the linear system produced by quadrature. J. Assoc. Comput. Mach. 1963, 10, 97–101. [Google Scholar] [CrossRef]
  39. Tikhonov, A.N. On the solution of incorrectly stated problems and a method of regularization. Dokl. Acad. Nauk SSSR 1963, 151, 501–504. [Google Scholar]
  40. Mateer, C.L. On the information content of umkehr observations. J. Atmos. Sci. 1965, 22, 370–381. [Google Scholar] [CrossRef]
  41. Smaglichenko, T.; Smaglichenko, A.; Sayankina, M.; Chigarev, B. Seismic Anomalies in the Geothermal District Revealed by the Relaxation Algorithm of Selected Coordinate Descent. In Proceedings of the 2021 14th International Conference “Management of Large-Scale System Development” (MLSD), Moscow, Russia, 27–29 September 2021; Institute of Electrical and Electronics Engineers (IEEE): Piscataway Township, NJ, USA, 2021; p. 21507066. [Google Scholar] [CrossRef]
  42. Strauss, Z. Unearthing Potential: The Value of Geothermal Energy to US Decarbonization; Atlantic Council: Washington, DC, USA, 2022. [Google Scholar]
  43. Saner, D.; Juraske, R.; Kübert, M.; Blum, P.; Hellweg, S.; Bayer, P. Is it only CO2 that matters? A life cycle perspective on shallow geothermal systems. Renew. Sustain. Energy Rev. 2010, 14, 1798–1813. [Google Scholar] [CrossRef]
  44. Gkousis, S.; Welkenhuysen, K.; Compernolle, T. Deep geothermal energy extraction, a review on environmental hotspots with focus on geo-technical site conditions. Renew. Sustain. Energy Rev. 2022, 162, 112430. [Google Scholar] [CrossRef]
  45. Fridleifsson, G.O.; Elders, W.A. Progress Report on the Iceland Deep Drilling Project (IDDP). Sci. Drill. 2007, 4, 26–29. [Google Scholar] [CrossRef]
  46. Zang, A.; Oye, V.; Jousset, P.; Deichmann, N.; Gritto, R.; McGarr, A.; Majer, E.; Bruhn, D. Analysis of induced seismicity in geothermal reservoirs—An overview. Geothermics 2014, 52, 6–21. [Google Scholar] [CrossRef]
  47. Bjornsson, S.; Gudmundsdottir, I.D.; Ketilsson, J. (Eds.) Geothermal Development and Research in Iceland; Orkustofnun: Reykjavik, Iceland, 2010. [Google Scholar]
  48. Dobson, P.F.; Asanuma, H.; Huenges, E.; Poletto, F.; Reinsch, T.; Sanjuan, B. Supercritical Geothermal Systems—A Review of Past Studies and Ongoing Research Activities. In Proceedings of the 42nd Workshop on Geothermal Reservoir Engineering, Stanford, CA, USA, 13–15 February 2017; pp. 670–682. [Google Scholar]
  49. Elders, W.; Fridleifsson, G.O. The Science Program of the Iceland Deep Drilling Project (IDDP): A study of supercritical geothermal resources. In Proceedings of the World Geothermal Congress 2010, Bali, Indonesia, 25–29 April 2010. [Google Scholar]
  50. Poletto, F.; Corubolo, P.; Farina, B.; Schleifer, A.; Pollard, J.; Peronio, M.; Bohm, G. Drill-bit SWD and seismic interferometry for imaging around geothermal wells. In Proceedings of the SEG Technical Program Expanded Abstracts, San Antonio Annual Meeting, San Antonio, TX, USA, 18–23 September 2011; Volume 2011, pp. 4319–4324. [Google Scholar]
  51. McClelland, L. (Ed.) Global Volcanism Program. Report on Krafla (Iceland). In Scientific Event Alert Network Bulletin; Smithsonian Institution: Washington, DC, USA, 1989; Volume 14. [Google Scholar] [CrossRef]
  52. Hjartardottir, A.R.; Einarsson, P.; Bramham, E.; Wright, T.J. The Krafla fissure swarm, Iceland, and its formation by rifting events. Bull. Volcanol. 2012, 74, 2139–2153. [Google Scholar] [CrossRef]
  53. Millett, J.M.; Planke, S.; Kastner, F.; Blischke, A.; Hersir, G.P.; Halldorsdottir, S.; Flovenz, O.G.; Arnadottir, S.; Helgadottir, H.M.; Vakulenko, S.; et al. Sub-surface geology and velocity structure of the Krafla high temperature geothermal field, Iceland: Integrated ditch cuttings, wireline and zero offset vertical seismic profile analysis. J. Volcanol. Geotherm. Res. 2020, 391, 106342. [Google Scholar] [CrossRef]
  54. Kastner, F.; Giese, R.; Planke, S.; Millett, J.M.; Flovenz, O.G. Seismic imaging in the Krafla high-temperature geothermal field, NE Iceland, using zero- and far-offset vertical seismic profiling (VSP) data. J. Volcanol. Geotherm. Res. 2020, 391, 106315. [Google Scholar] [CrossRef]
  55. Einarsson, P. S-wave shadows in the Krafla Caldera in NE-Iceland, evidence for a magma chamber in the crust. Bull. Volcanol. 1978, 41, 187–195. [Google Scholar] [CrossRef]
  56. Gudmundsson, A.; Mortensen, A.K. Well locations-consideration of purpose, objectives and achievement with emphasis on recent drilling in the Krafla Geothermal area. In Proceedings of the World Geothermal Congress, Melbourne, Australia, 19–25 April 2015. [Google Scholar]
  57. Murai, Y.; Katsumata, K.; Takanami, T.; Watanabe, T.; Yamashina, T.; Cho, I.; Tanaka, M.; Azuma, R. Seismic velocity structure in southern Hokkaido deduced from ocean-bottom seismographic and land observations. In Proceedings of the Japan Geoscience Union Meeting, Makuhari Messe, Chiba, Japan, 26–30 May 2019. [Google Scholar]
  58. Rognvaldsson, S.; Gudmundsson, A.; Slunga, R. Seismotectonic Analysis of the Tjornes Fracture Zone, an Active Transform Fault in North Iceland. J. Geophys. Res. 1998, 103, 30117–30129. [Google Scholar] [CrossRef]
  59. Lebedev, E.B.; Ryzhenko, B.N.; Burkhardt, H.; Zharikov, A.V.; Roshchina, I.A.; Kononkova, N.N.; Zebrin, S.R. Influence of fluid composition on the elastic properties of sandstone and quartzite at high temperature and pressure in application to the problem of crustal waveguides. Izv. Phys. Solid Earth 2014, 50, 367–377. [Google Scholar] [CrossRef]
  60. Fridleifsson, G.O.; Armannsson, H.; Arnason, K.; Bjarnason, I.T.; Gislason, G. Part I: Geosciences and Site Selection. In Iceland Deep Drilling Project, Feasibility Report Number: OS-2003/007; Fridleifsson, G.O., Ed.; Orkustofnun: Reykjavik, Iceland, 2003. [Google Scholar]
  61. Hutchings, L.; Bonner, B.; Saltiel, S.; Jarpe, S.; Nelson, M. Rock Physics Interpretation of Tomographic Solutions for Geothermal Reservoir Properties. In Applied Geophysics with Case Studies on Environmental, Exploration and Engineering Geophysics; IntechOpen: Rijeka, Croatia, 2019. [Google Scholar] [CrossRef]
Figure 1. Ray paths through the medium’s blocks from the hypocenter (black circle) to the receiver (black triangle) for the model of real velocity (red curve) and initial “framework”model (yellow curve).
Mathematics 11 04297 g001
Figure 2. (a) Relief map showing volcanos Krafla (Kr.) and Theistareykir (Th.). Black denotes geothermal stations. Lowlands and mounts are indicated with green and brown, respectively. (b) The SCD result: inhomogeneities at the depth range of 0–5 km. (c) The SCD result: inhomogeneities at the depth range of 5–10 km. Vertical lines are projections of volcano locations.
Mathematics 11 04297 g002
Table 1. The SCD results at the first step i = 1 .
k α k D(k)
10.06970.5304
2−0.00020.000001
Table 2. The SCD estimations after 6 iterations.
k x ( 6 ) R k Δ
10.09980.9980.0009
2−0.0960.6799−0.0029
Disclaimer/Publisher’s Note: The statements, opinions and data contained in all publications are solely those of the individual author(s) and contributor(s) and not of MDPI and/or the editor(s). MDPI and/or the editor(s) disclaim responsibility for any injury to people or property resulting from any ideas, methods, instructions or products referred to in the content.