
An Analytical Approach for Temporal Infection Mapping and Composite Index Development

Abstract
:1. Introduction
2. Materials and Methods
2.1. Data Sources
2.2. Analytical Framework
2.2.1. Modeling Program with Functional Data Analysis
2.2.2. Composite Indices Development through Orthogonal Transformation
3. Results
3.1. Prevalence and Internal Kinetic Characteristics for Each Disease
3.2. Composite Indices
4. Discussion
5. Conclusions
Supplementary Materials
Author Contributions
Funding
Data Availability Statement
Acknowledgments
Conflicts of Interest
References
- Johnson, P.T.J.; de Roode, J.C.; Fenton, A. Why infectious disease research needs community ecology. Science 2005, 349, 1259504. [Google Scholar] [CrossRef]
- Jasny, B.; Roberts, L.; Enserink, M.; Smith, O. What works [introduction to Global Health special issue]. Science 2014, 345, 1256–1257. [Google Scholar] [CrossRef]
- Hassanzadeh, P.; Atyabi, F.; Dinarvand, R. Nanobionics: From plant empowering to the infectious disease treatment. J. Control Release 2022, 349, 890–901. [Google Scholar] [CrossRef] [PubMed]
- GBD 2019 Antimicrobial Resistance Collaborators. Global mortality associated with 33 bacterial pathogens in 2019, a systematic analysis for the Global Burden of Disease Study 2019. Lancet 2022, 400, 2221–2248. [Google Scholar]
- Kirtane, A.R.; Verma, M.; Karandikar, P.; Furin, J.; Langer, R.; Traverso, G. Nanotechnology approaches for global infectious diseases. Nat. Nanotechnol. 2021, 16, 369–384. [Google Scholar] [CrossRef]
- Morens, D.; Folkers, G.; Fauci, A. The challenge of emerging and re-emerging infectious diseases. Nature 2004, 430, 242–249. [Google Scholar] [CrossRef] [PubMed]
- Chen, C.; Haupert, S.R.; Zimmermann, L.; Shi, X.; Fritsche, L.G.; Mukherjee, B. Global prevalence of post-coronavirus disease 2019 (COVID-19) condition or long covid: A meta-analysis and systematic review. J. Infect. Dis. 2022, 226, 1593–1607. [Google Scholar] [CrossRef] [PubMed]
- Bai, L.; Wei, Y.; Wei, G.; Li, X.; Zhang, S. Infectious disease pandemic and permanent volatility of international stock markets: A long-term perspective. Financ. Res. Lett. 2021, 40, 101709. [Google Scholar] [CrossRef]
- Padhan, R.; Prabheesh, K.P. The economics of COVID-19 pandemic: A survey. Econ. Anal. Policy 2021, 70, 220–237. [Google Scholar] [CrossRef]
- Wolf, J.; Johnston, R.B.; Ambelu, A.; Arnold, B.F.; Bain, R.; Brauer, M.; Brown, J.; Caruso, B.A.; Clasen, T.; Colford, J.M.; et al. Burden of disease attributable to unsafe drinking water, sanitation, and hygiene in domestic settings: A global analysis for selected adverse health outcomes. Lancet 2023, 401, 2060–2071. [Google Scholar] [CrossRef]
- European Commission. Handbook on Constructing Composite Indicators: Methodology and User Guide; Organisation for Economic Co-Operation and Development, SourceOECD (Online Service), Ed.; OECD: Paris, France, 2008; p. 158. [Google Scholar]
- Lloyd-Smith, J.O.; George, D.; Pepin, K.M.; Pitzer, V.E.; Pulliam, J.R.; Dobson, A.P.; Hudson, P.J.; Grenfell, B.T. Epidemic dynamics at the human–animal interface. Science 2009, 326, 1362–1367. [Google Scholar] [CrossRef]
- Han, C.; Li, M.; Haihambo, N.; Cao, Y.; Zhao, X. Enlightenment on oscillatory properties of 23 class B notifiable infectious diseases in the mainland of China from 2004 to 2020. PLoS ONE 2021, 16, e0252803. [Google Scholar] [CrossRef]
- Zhang, X.; Hou, F.; Qiao, Z.; Li, X.; Zhou, L.; Liu, Y.; Zhang, T. Temporal and long-term trend analysis of class C notifiable diseases in China from 2009 to 2014. BMJ Open 2016, 6, e011038. [Google Scholar] [CrossRef] [PubMed]
- Wang, Z.; Liu, Y.; Li, Y.; Wang, G.; Lourenço, J.; Kraemer, M.; He, Q.; Cazelles, B.; Li, Y.; Wang, R.; et al. The relationship between rising temperatures and malaria incidence in Hainan, China, from 1984 to 2010: A longitudinal cohort study. Lancet Planet Health 2022, 6, e350–e358. [Google Scholar] [CrossRef] [PubMed]
- Zhao, X.; Li, M.; Haihambo, N.; Jin, J.; Zeng, Y.; Qiu, J.; Guo, M.; Zhu, Y.; Li, Z.; Liu, J.; et al. Changes in Temporal Properties of Notifiable Infectious Disease Epidemics in China During the COVID-19 Pandemic: Population-Based Surveillance Study. JMIR Public Health Surveill. 2022, 8, e35343. [Google Scholar] [CrossRef]
- The Lancet Infectious Diseases. Designing infectious disease programmes for the future. Lancet Infect. Dis. 2022, 22, 1253.
- Schleihauf, E.; Watkins, R.; Plant, A. Heterogeneity in the spatial distribution of bacterial sexually transmitted infections. Sex. Transm. Infect. 2009, 85, 45–49. [Google Scholar] [CrossRef] [PubMed]
- Liu, Y.; Hu, Y.; Hu, Y.; Gao, Y.; Liu, Z. Water quality characteristics and assessment of Yongding New River by improved comprehensive water quality identification index based on game theory. J. Environ. Sci. 2021, 104, 40–52. [Google Scholar] [CrossRef] [PubMed]
- Vondrak, J.; Penhakert, M. Statistical Evaluation of Transformation Methods Accuracy on Derived Pathological Vectorcardiographic Leads. IEEE J. Transl. Eng. Health Med. 2022, 10, 1900208. [Google Scholar] [CrossRef]
- King, D.A.; Peckham, C.; Waage, J.K.; Brownlie, J.; Woolhouse, M.E.J. Infectious Diseases: Preparing for the Future. Science 2006, 313, 1392–1393. [Google Scholar] [CrossRef]
- Ladner, J.T.; Grubaugh, N.D.; Pybus, O.G.; Andersen, K.G. Precision epidemiology for infectious disease control. Nat. Med. 2019, 25, 206–211. [Google Scholar] [CrossRef] [PubMed]
- Zhang, Q. Data science approaches to infectious disease surveillance. Philos. Trans. A Math. Phys. Eng. Sci. 2022, 380, 20210115. [Google Scholar] [CrossRef]
- Ye, Y.; Zhang, Q.; Wei, X.; Cao, Z.; Yuan, H.Y.; Zeng, D.D. Equitable access to COVID-19 vaccines makes a life-saving difference to all countries. Nat. Hum. Behav. 2022, 6, 207–216. [Google Scholar] [CrossRef] [PubMed]
- Chao, A.; Chazdon, R.L.; Colwell, R.K.; Shen, T.J. A new statistical approach for assessing similarity of species composition with incidence and abundance data. Ecol. Lett. 2004, 8, 148–159. [Google Scholar] [CrossRef]
- Paulson, A.R.; Lougheed, S.C.; Huang, D.; Colautti, R.I. Multiomics Reveals Symbionts, Pathogens, and Tissue-Specific Microbiome of Blacklegged Ticks (Ixodes scapularis) from a Lyme Disease Hot Spot in Southeastern Ontario, Canada. Microbiol. Spectr. 2023, 11, e0140423. [Google Scholar] [CrossRef]
- Romero-Vega, L.M.; Piche-Ovares, M.; Soto-Garita, C.; Barantes Murillo, D.F.; Chaverri, L.G.; Alfaro-Alarcón, A.; Corrales-Aguilar, E.; Troyo, A. Seasonal changes in the diversity, host preferences and infectivity of mosquitoes in two arbovirus-endemic regions of Costa Rica. Parasit. Vectors 2023, 16, 34. [Google Scholar] [CrossRef]
- Dannenmaier, J.; Kaltenbach, C.; Kölle, T.; Krischak, G. Application of functional data analysis to explore movements: Walking, running and jumping—A systematic review. Gait Posture 2020, 77, 182–189. [Google Scholar] [CrossRef]
- Ramsay, J.O.; Silverman, B.W. Functional Data Analysis, 2nd ed.; Springer: New York, NY, USA, 2010. [Google Scholar]
- Dieng, S.; Michel, P.; Guindo, A.; Sallah, K.; Ba, E.H.; Cissé, B.; Carrieri, M.P.; Sokhna, C.; Milligan, P.; Gaudart, J. Application of Functional Data Analysis to Identify Patterns of Malaria Incidence, to Guide Targeted Control Strategies. Int. J. Environ. Res. Public Health 2020, 17, 4168. [Google Scholar] [CrossRef]
- Shah, D.A.; De Wolf, E.D.; Paul, P.A.; Madden, L.V. Functional Data Analysis of Weather Variables Linked to Fusarium Head Blight Epidemics in the United States. Phytopathology 2019, 109, 96–110. [Google Scholar] [CrossRef] [PubMed]
- Ullah, S.; Finch, C.F. Applications of functional data analysis: A systematic review. BMC Med. Res. Methodol. 2013, 13, 43. [Google Scholar] [CrossRef]
- Bernasconi, A.; Canakoglu, A.; Masseroli, M.; Ceri, S. The road towards data integration in human genomics: Players, steps and interactions. Brief. Bioinform. 2021, 22, 30–44. [Google Scholar] [CrossRef]
- Wilhelm, D.; Lohmann, J.; De Allegri, M.; Chinkhumba, J.; Muula, A.S.; Brenner, S. Quality of maternal obstetric and neonatal care in low-income countries: Development of a composite index. BMC Med. Res. Methodol. 2019, 19, 154. [Google Scholar] [CrossRef]
- Wang, L.; Wang, Y.; Jin, S.; Wu, Z.; Chin, D.P.; Koplan, J.P.; Wilson, M.E. Emergence and control of infectious diseases in China. Lancet 2008, 372, 1598–1605. [Google Scholar] [CrossRef]
- Jiang, Y.; Dou, X.; Yan, C.; Wan, L.; Liu, H.; Li, M.; Wang, R.; Li, G.; Zhao, L.; Liu, Z.; et al. Epidemiological characteristics and trends of notifiable infectious diseases in China from 1986 to 2016. J. Glob. Health 2020, 10, 020803. [Google Scholar] [CrossRef]
- LoMauro, A.; Colli, A.; Colombo, L.; Aliverti, A. Breathing patterns recognition: A functional data analysis approach. Comput. Methods Programs Biomed. 2022, 217, 106670. [Google Scholar] [CrossRef] [PubMed]
- Pons-Salort, M.; Grassly, N.C. Serotype-specific immunity explains the incidence of diseases caused by human enteroviruses. Science 2018, 361, 800–803. [Google Scholar] [CrossRef]
- Jones, K.E.; Patel, N.G.; Levy, M.A.; Storeygard, A.; Balk, D.; Gittleman, J.L.; Daszak, P. Global trends in emerging infectious diseases. Nature 2008, 451, 990–993. [Google Scholar] [CrossRef] [PubMed]
- Halliday, J.E.B.; Hampson, K.; Hanley, N.; Lembo, T.; Sharp, J.P.; Haydon, D.T.; Cleaveland, S. Driving improvements in emerging disease surveillance through locally relevant capacity strengthening. Science 2017, 357, 146–148. [Google Scholar] [CrossRef]
- Townsend, A.K.; Sewall, K.B.; Leonard, A.S.; Hawley, D.M. Infectious disease and cognition in wild populations. Trends Ecol. Evol. 2022, 37, 899–910. [Google Scholar] [CrossRef] [PubMed]
- Han, C.; Li, M.; Haihambo, N.; Babuna, P.; Liu, Q.; Zhao, X.; Jaeger, C.; Li, Y.; Yang, S. Mechanisms of recurrent outbreak of COVID-19: A model-based study. Nonlinear Dyn. 2021, 106, 1169–1185. [Google Scholar] [CrossRef]
- Suk, J.E.; Vaughan, E.C.; Cook, R.G.; Semenza, J.C. Natural disasters and infectious disease in Europe: A literature review to identify cascading risk pathways. Eur. J. Public Health 2020, 30, 928–935. [Google Scholar] [CrossRef]
- Bharti, N.; Tatem, A.J.; Ferrari, M.J.; Grais, R.F.; Djibo, A.; Grenfell, B.T. Explaining seasonal fluctuations of measles in Niger using nighttime lights imagery. Science 2011, 334, 1424–1427. [Google Scholar] [CrossRef] [PubMed]
- Buonomo, B.; Della Marca, R. Oscillations and hysteresis in an epidemic model with information-dependent imperfect vaccination. Math. Comput. Simul. 2019, 162, 97–114. [Google Scholar] [CrossRef]
- Lee, S.W.; Kim, H.Y. Stock market forecasting with super-high dimensional time-series data using ConvLSTM, trend sampling, and specialized data augmentation. Expert Syst. Appl. 2020, 161, 113704. [Google Scholar] [CrossRef]
- Zeger, S.L.; Irizarry, R.; Peng, R.D. On Time Series Analysis of Public Health and Biomedical Data. Annu. Rev. Public Health 2006, 27, 57–79. [Google Scholar] [CrossRef]
- Yuan, A.E.; Shou, W. Data-driven causal analysis of observational biological time series. eLife 2022, 11, e72518. [Google Scholar] [CrossRef]
- Blázquez-García, A.; Conde, A.; Mori, U.; Lozano, J.A. A review on outlier/anomaly detection in time series data. Comput. Surveys 2021, 54, 1–33. [Google Scholar] [CrossRef]
- López-Pintado, S.; Romo, J. On the Concept of Depth for Functional Data. J. Am. Stat. Assoc. 2009, 104, 718–734. [Google Scholar] [CrossRef]
- Nanditha, N.G.; Dong, X.; McLinden, T.; Sereda, P.; Kopec, J.; Hogg, R.S.; Montaner, J.S.; Lima, V.D. The impact of lookback windows on the prevalence and incidence of chronic diseases among people living with HIV: An exploration in administrative health data in Canada. BMC Med. Res. Methodol. 2022, 22, 1. [Google Scholar] [CrossRef]
- Levitin, D.J.; Nuzzo, R.L.; Vines, B.W.; Ramsay, J.O. Introduction to functional data analysis. Can. Psychol. 2007, 48, 135–155. [Google Scholar] [CrossRef]
- Barman, K.; Borkar, V.S. A note on linear function approximation using random projections. Syst. Control. Lett. 2008, 57, 784–786. [Google Scholar] [CrossRef]
- Nedic, A.; Bertsekas, D.P. Least-squares policy evaluation algorithms with linear function approximation. Discret. Event Dyn. Syst. 2003, 13, 79–110. [Google Scholar] [CrossRef]
- Berstein, S. Démonstration du théorèm de Weierstrass fondée sur le calculdes probabilities. Comm. Soc. Math. Khardov 1912, 13, 1–2. [Google Scholar]
- Li, Y.; Lei, M.; Cui, W.; Guo, Y.; Wei, H.L. A Parametric Time-Frequency Conditional Granger Causality Method Using Ultra-Regularized Orthogonal Least Squares and Multiwavelets for Dynamic Connectivity Analysis in EEGs. IEEE Trans. Biomed. Eng. 2019, 66, 3509–3525. [Google Scholar] [CrossRef] [PubMed]
- Jimenez, C.E.; Keestra, S.; Tandon, P.; Cumming, O.; Pickering, A.J.; Moodley, A.; Chandler, C.I. Biosecurity and water, sanitation, and hygiene (WASH) interventions in animal agricultural settings for reducing infection burden, antibiotic use, and antibiotic resistance: A One Health systematic review. Lancet Planet. Health 2023, 7, e418–e434. [Google Scholar] [CrossRef]
- Harder, T.; Takla, A.; Rehfuess, E.; Sánchez-Vivar, A.; Matysiak-Klose, D.; Eckmanns, T.; Krause, G.; de Carvalho Gomes, H.; Jansen, A.; Ellis, S.; et al. Evidence-based decision-making in infectious diseases epidemiology, prevention and control: Matching research questions to study designs and quality appraisal tools. BMC Med. Res. Methodol. 2014, 14, 69. [Google Scholar] [CrossRef]
- Yen, J.; Wang, L. Simplifying fuzzy rule-based models using orthogonal transformation methods. IEEE Trans. Syst. Man. Cybern. B Cybern. 1999, 29, 13–24. [Google Scholar] [CrossRef]
- Li, J.; Lai, S.; Gao, G.F.; Shi, W. The emergence, genomic diversity and global spread of SARS-CoV-2. Nature 2021, 600, 408–418. [Google Scholar] [CrossRef]
- Polaris Observatory Collaborators. Global prevalence, cascade of care, and prophylaxis coverage of hepatitis B in 2022: A modelling study. Lancet Gastroenterol. Hepatol. 2023, 8, 879–907. [Google Scholar]
- Xu, C.; Wang, Y.; Cheng, K.; Yang, X.; Wang, X.; Guo, S.; Liu, M.; Liu, X. A Mathematical Model to Study the Potential Hepatitis B Virus Infections and Effects of Vaccination Strategies in China. Vaccines 2023, 11, 1530. [Google Scholar] [CrossRef]
- Rothe, C.; Jong, E.C. Emerging Infectious Diseases and the International Traveler. Travel Trop. Med. Man. 2017, 27–35. [Google Scholar] [CrossRef]
- Cooke, G.S.; Andrieux-Meyer, I.; Applegate, T.L.; Atun, R.; Burry, J.R.; Cheinquer, H.; Dusheiko, G.; Feld, J.J.; Gore, C.; Griswold, M.G.; et al. Accelerating the elimination of viral hepatitis: A Lancet Gastroenterology & Hepatology Commission. Lancet Gastroenterol. Hepatol. 2019, 4, 135–184. [Google Scholar] [PubMed]

| Gastro-Intestinal Infectious Disease ) | ||
|---|---|---|
| Items | Orthogonalized Variates | |
| Bacterial or amebic dysentery | 0.707 | 0.707 |
| Typhoid fever and paratyphoid | 0.707 | −0.707 |
| Eigenvalue | 1.371 | 0.346 |
| Weight | 0.798 | 0.202 |
| Synthetic expression | = 0.707 + 0.421 * | |
| ) | |||||
|---|---|---|---|---|---|
| Items | Orthogonalized Variates | ||||
| Tuberculosis | 0.238 | 0.742 | 0.261 | 0.57 | 0.009 |
| Scarlet fever | −0.544 | 0.283 | 0.231 | −0.236 | −0.718 |
| Pertussis | −0.427 | −0.306 | 0.734 | 0.234 | 0.362 |
| Measles | 0.505 | 0.153 | 0.535 | −0.656 | 0.065 |
| Epidemic cerebrospinal meningitis | 0.458 | −0.503 | 0.231 | 0.366 | −0.591 |
| Eigenvalue | 1.629 | 1.153 | 0.824 | 0.473 | 0.34 |
| Weight | 0.369 | 0.261 | 0.186 | 0.107 | 0.077 |
| Synthetic expression | * | ||||
| Sexually Transmitted and Blood-Borne Disease | ||||
|---|---|---|---|---|
| Orthogonalized Variates | ||||
| Virus hepatitis | 0.401 | 0.812 | 0.405 | 0.121 |
| Syphilis | 0.545 | −0.266 | 0.222 | −0.764 |
| Gonorrhea | −0.536 | −0.134 | 0.828 | −0.095 |
| Acquired immune deficiency syndrome (AIDS) | 0.505 | −0.501 | 0.318 | 0.627 |
| Eigenvalue | 1.781 | 0.845 | 0.331 | 0.076 |
| Weight | 0.587 | 0.279 | 0.109 | 0.025 |
| Synthetic expression | * | |||
| Vector-Borne Disease | ||||||||
|---|---|---|---|---|---|---|---|---|
| Orthogonalized Variates | ||||||||
| Brucellosis | 0.424 | 0.065 | 0.027 | 0.088 | 0.38 | 0.799 | 0.143 | 0.06 |
| Dengue fever | 0.202 | 0.342 | 0.898 | 0.017 | 0.012 | −0.167 | −0.055 | 0.06 |
| Epidemic hemorrhagic fever | −0.395 | 0.312 | 0.019 | −0.051 | 0.068 | −0.002 | 0.857 | 0.062 |
| Malaria | −0.337 | −0.408 | 0.354 | −0.109 | −0.463 | 0.454 | 0.046 | −0.4 |
| Epidemic encephalitis | −0.424 | 0.067 | 0.062 | −0.468 | 0.049 | 0.25 | −0.301 | 0.662 |
| Anthrax | −0.401 | 0.132 | 0.027 | 0.851 | −0.041 | 0.148 | −0.193 | 0.189 |
| Hydrophobia | −0.125 | −0.708 | 0.249 | 0.106 | 0.571 | −0.204 | 0.144 | 0.144 |
| Leptospirosis | −0.392 | 0.302 | −0.005 | −0.15 | 0.553 | 0.035 | −0.301 | −0.58 |
| Eigenvalue | 2.277 | 1.284 | 0.857 | 0.43 | 0.349 | 0.249 | 0.194 | 0.155 |
| Weight | 0.393 | 0.222 | 0.148 | 0.074 | 0.006 | 0.043 | 0.033 | 0.027 |
| Synthetic expression | * | |||||||
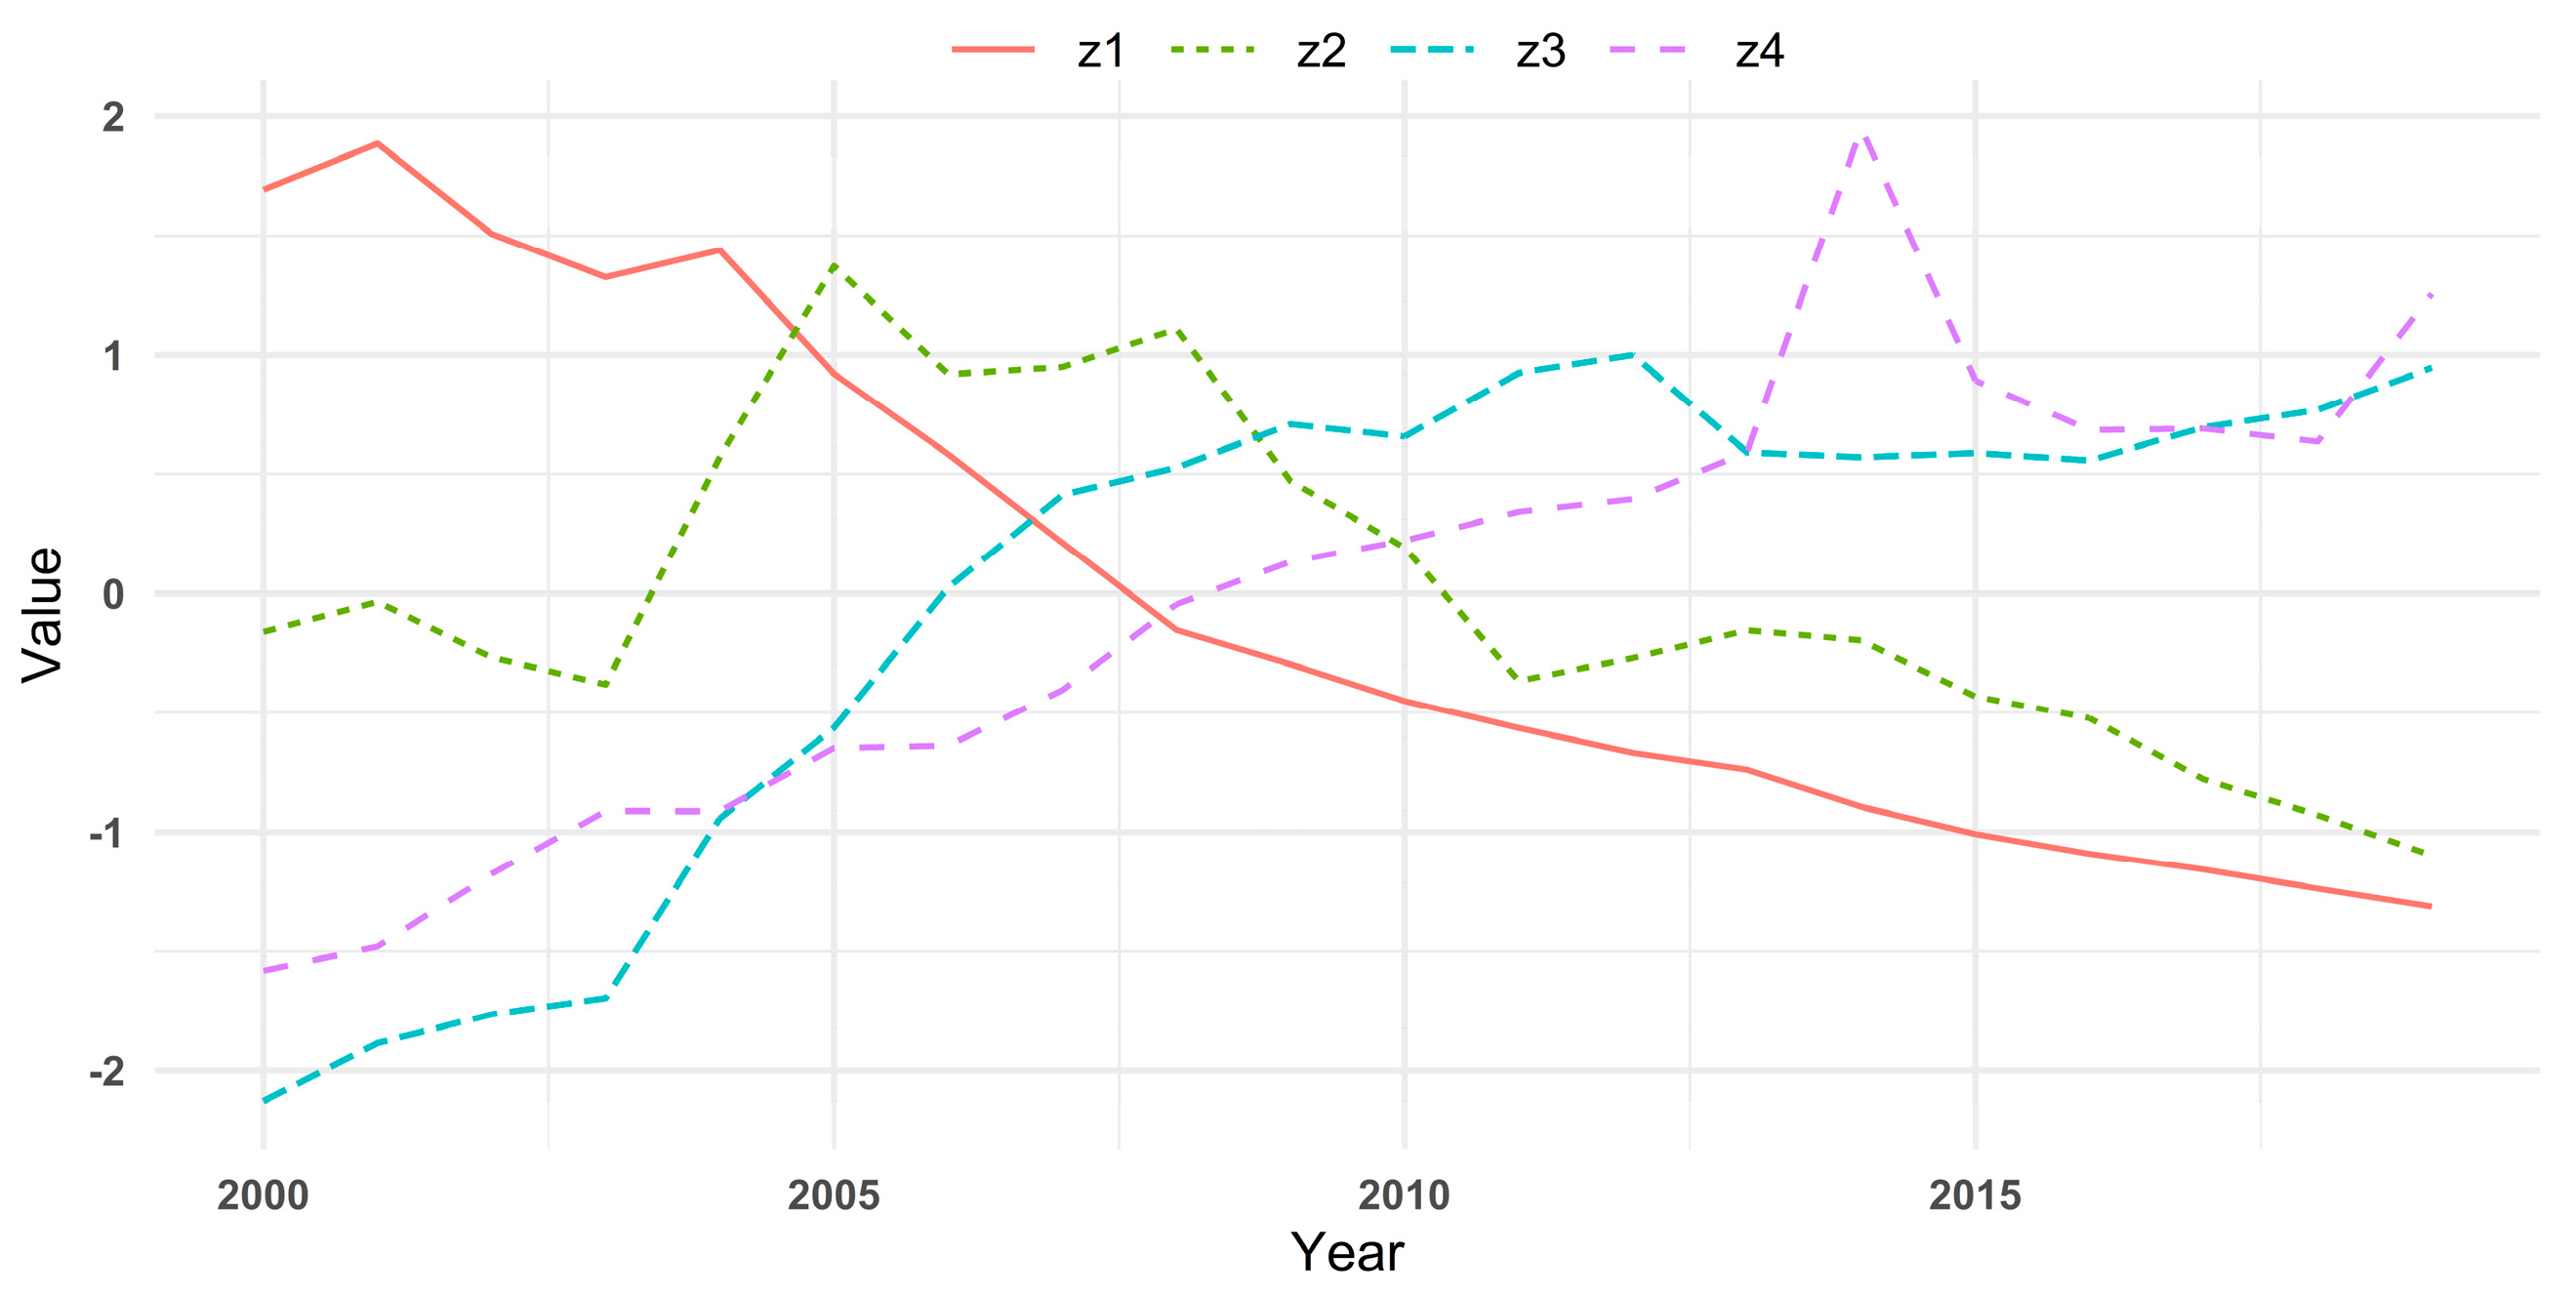
| Year | ||||
|---|---|---|---|---|
| 2000 | 1.6925 | −0.1611 | −2.1279 | −1.5806 |
| 2001 | 1.8862 | −0.0356 | −1.8848 | −1.4797 |
| 2002 | 1.5086 | −0.2673 | −1.7643 | −1.1765 |
| 2003 | 1.3259 | −0.3807 | −1.6958 | −0.9115 |
| 2004 | 1.4395 | 0.5718 | −0.9421 | −0.9119 |
| 2005 | 0.9217 | 1.3731 | −0.5628 | −0.6481 |
| 2006 | 0.5831 | 0.9195 | 0.0242 | −0.6388 |
| 2007 | 0.2136 | 0.9500 | 0.4128 | −0.4043 |
| 2008 | −0.1529 | 1.1096 | 0.5273 | −0.0451 |
| 2009 | −0.2963 | 0.4717 | 0.7088 | 0.1335 |
| 2010 | −0.4502 | 0.1930 | 0.6577 | 0.223 |
| 2011 | −0.5648 | −0.3655 | 0.9253 | 0.3422 |
| 2012 | −0.6686 | −0.2700 | 1.0005 | 0.3961 |
| 2013 | −0.7391 | −0.1532 | 0.5918 | 0.5923 |
| 2014 | −0.8944 | −0.1958 | 0.5712 | 1.9487 |
| 2015 | −1.0073 | −0.4313 | 0.5889 | 0.8935 |
| 2016 | −1.0910 | −0.5233 | 0.5570 | 0.6848 |
| 2017 | −1.1576 | −0.7785 | 0.6963 | 0.6909 |
| 2018 | −1.2365 | −0.9282 | 0.7688 | 0.6359 |
| 2019 | −1.3125 | −1.0982 | 0.9469 | 1.2556 |
Disclaimer/Publisher’s Note: The statements, opinions and data contained in all publications are solely those of the individual author(s) and contributor(s) and not of MDPI and/or the editor(s). MDPI and/or the editor(s) disclaim responsibility for any injury to people or property resulting from any ideas, methods, instructions or products referred to in the content. |
© 2023 by the authors. Licensee MDPI, Basel, Switzerland. This article is an open access article distributed under the terms and conditions of the Creative Commons Attribution (CC BY) license (https://creativecommons.org/licenses/by/4.0/).
Share and Cite
Wang, W.; Weng, F.; Zhu, J.; Li, Q.; Wu, X. An Analytical Approach for Temporal Infection Mapping and Composite Index Development. Mathematics 2023, 11, 4358. https://doi.org/10.3390/math11204358
Wang W, Weng F, Zhu J, Li Q, Wu X. An Analytical Approach for Temporal Infection Mapping and Composite Index Development. Mathematics. 2023; 11(20):4358. https://doi.org/10.3390/math11204358
Chicago/Turabian StyleWang, Weiwei, Futian Weng, Jianping Zhu, Qiyuan Li, and Xiaolong Wu. 2023. "An Analytical Approach for Temporal Infection Mapping and Composite Index Development" Mathematics 11, no. 20: 4358. https://doi.org/10.3390/math11204358