Abstract
In recent years, the maritime industry’s carbon emissions have garnered increasing attention, leading to the proposal of various policy measures aimed at mitigating emissions and fostering a green and sustainable maritime sector. Among these measures, the book and claim mechanism, which allows shippers to access low or zero-emission bunkering by purchasing such fuels without physically participating in the refueling process, has emerged as a crucial catalyst for fuel conversion within the maritime industry. While book and claim has gained widespread recognition and facilitated the sale of clean fuels by some bunker suppliers, there has been limited research focused on evaluating its practical efficacy. Thus, we construct two distinct Mixed-Integer Linear Programming (MILP) models—one with the inclusion of the book and claim mechanism and one without—and conduct an analytical comparison of optimal decisions made by bunker suppliers and shippers under different model scenarios. Through numerical experiments, we have uncovered a noteworthy insight: with book and claim, bunker suppliers may set higher prices to maximize total profits due to various price sensitivities among shippers towards clean fuels, thus promoting low-price-sensitive shippers to purchase clean fuels while making it challenging for high-price-sensitive shippers to do so. Consequently, when compared to a scenario without book and claim, the total quantity of clean fuels purchased by shippers in the presence of book and claim may decrease, giving rise to a paradox where the implementation of book and claim inadvertently increases societal carbon emissions. This underscores the imperative for policymakers to conduct comprehensive market research, understand different shippers’ price sensitivities towards clean fuels, and make scientifically sound decisions when considering the implementation of the book and claim mechanism.
Keywords:
mathematical programming; sustainable operations research; green shipping; carbon emissions MSC:
9010
1. Introduction
The imperative of carbon reduction has become a ubiquitous undertaking in contemporary society. The pursuit of green and low-carbon development, coupled with the ambitious strategies for carbon peaking and carbon neutrality, promises to usher in profound and extensive systemic transformations across various domains. Among these, the shipping industry, a linchpin of global trade advancement, finds itself inexorably entwined in this paradigm shift. Accountable for approximately 90% of the world’s trade transport [1], the shipping industry contributes a substantial 2.89% share of the world’s greenhouse gas emissions [2]. The International Maritime Organization (IMO) forecasted in 2018 that CO emissions would surge by approximately 50% from 2018 levels by 2050, propelled by the continued rise in demand for maritime transportation [3]. Hence, many measures have been proposed to reduce carbon emission, promoting green and sustainable development. Within the context of the shipping industry, carbon insetting, or book and claim, emerges as a pivotal strategy facilitating the transition from conventional fuels to cleaner alternatives, thus fostering the industry’s green evolution. Book and claim represents a mechanism for compensating emissions that are challenging or prohibitively expensive to mitigate within routine operations but can be addressed elsewhere within one’s fleet or the sector. Book and claim is characterized by its simplicity, scalability, and, perhaps most significantly, its applicability to nearly all vessels without necessitating retrofitting or upfront investment costs [4]. Presently, the concept of book and claim in the shipping industry has garnered widespread attention and recognition, with some bunker suppliers adopting this approach to promote the sale of clean fuels. Nonetheless, prior research has predominantly centered on the theoretical exploration of the book and claim mechanism’s potential to promote sustainability in the maritime sector, leaving a notable void in quantitative analyses applied to real-world scenarios. This gap pertains to the assessment of decision-making dynamics among shippers and bunker suppliers when employing the book and claim system. This involves an examination of how bunker suppliers price diverse fuel types and the quantities shippers purchase at different price levels. In response to this research gap, our study addresses this gap by constructing two models: one incorporating the book and claim mechanism and one without. We conduct experiments to determine optimal pricing for clean fuels and the associated societal carbon emissions under these models, validating the utility of the book and claim mechanism by a comparative analysis.
In this paper, we have constructed two models based on the presence or absence of the book and claim mechanism, analyzing the optimal decisions for bunker suppliers and shippers under different model scenarios. This analysis allows us to assess the practical impact of book and claim implementation, thereby offering valuable insights for policymakers in shaping their strategies. Specifically, our investigation addresses the following research inquiries:
- 1.
- Can the book and claim mechanism genuinely catalyze the reduction of carbon emissions within the shipping industry, thereby facilitating green and sustainable development?
- 2.
- Under varying model scenarios, what is the optimal pricing strategy for bunker suppliers (the ideal selling price of clean fuels) to maximize their profits?
- 3.
- Within distinct model contexts, what quantities of clean and conventional fuels represent the optimal purchasing decisions for different shippers?
To address the three research inquiries mentioned above, we commence by introducing two intricate mixed-integer nonlinear optimization (MINLP) models, characterized by their intricate nature and challenging problem-solving complexity. Subsequently, we employ advanced mathematical techniques to convert these MINLP models into two mixed-integer linear programming (MILP) formulations. This transformation facilitates the utilization of readily available optimization solvers, enhancing the feasibility of solving the MILP model. Lastly, we undertake an extensive series of experiments to compare the results derived from the two models.
1.1. Literature Review
We review two streams of literature closely related to our study: (i) carbon emission reduction strategies in shipping; (ii) book and claim in the shipping industry.
1.1.1. Carbon Emission Reduction Strategies in Shipping
At the level of regulation and policies, many countries and international organizations have proposed some measures to achieve emissions targets. The IMO have categorized the measures in green and sustainable development in the shipping industry into short-term, medium-term, and long-term solutions [5]. So far, the primary focus has been on short-term measures, resulting in the adoption of pivotal initiatives such as the Energy Efficiency Existing Ships Index (EEXI) [6], the Carbon Intensity Indicator (CII) [7], and the fortification of the Ship Energy Efficiency Management Plan (SEEMP) [8]. Additionally, the European Commission (EC) unveiled a proposal of considerable significance—the expansion of the ambit of the European Union Emissions Trading System (EU ETS) to encompass greenhouse gas (GHG) emissions emanating from the maritime sector on 14 July 2021 [9]. This strategic amendment to the EU ETS forms an integral part of the comprehensive “Fit for 55” package, with the overarching objective of aligning with the European Union’s ambitious pursuit of achieving net-zero GHG emissions by the year 2050 [10]. In addition to integrating maritime emissions into the EU ETS, the legislation encompasses key elements. The FuelEU Maritime Initiative establishes rigorous targets for reducing GHG intensity and enforces stringent fuel standards for ships [11]. The Energy Taxation Directive eliminates fuel tax exemptions in the maritime sector [12]. Simultaneously, the Alternative Fuels Infrastructure Regulation strives to enhance access to shore-side electricity and Liquefied Natural Gas (LNG) in ports, facilitating the shift towards sustainable maritime energy sources [13]. What is more, functioning as a robust Market-Based Measure (MBM), the EU ETS is anchored in the core principle of the “polluter-pays” paradigm. In essence, it seeks to incentivize stakeholders through financial means, compelling them to take concerted actions towards reducing their carbon footprint [14]. The EU ETS operates on the “cap and trade” model, setting a limit on total GHG emissions. These emissions allowances, known as European Union Allowances (EUAs), are distributed among regulated entities. The specific allocation method among Member States (MS) is pending definition by the Directive. Companies within this system report their allowances through their respective registered MS and obtain EUAs through auctions based on their prior year’s emissions, all while complying with EU ETS reduction targets [9]. Notably, the extension of the EU ETS aligns with key principles from the EU Monitoring, Reporting, and Verification system (EU MRV), designating shipping companies and their registered countries as regulated entities [15].
At the technical and operational levels, numerous researchers place their emphasis on enhancing energy efficiency and effecting a shift from fossil fuels to renewable alternatives, all in the pursuit of decarbonizing the maritime shipping industry. Bouman et al. [1] conducted a comprehensive synthesis, mapping the potential for reducing carbon dioxide (CO) emissions based on an extensive review of 150 studies examining shipping energy efficiency and greenhouse gas emissions. Their findings affirm that through a combination of measures and supportive policies, emissions could be curtailed by more than 75% by 2050, leveraging existing technologies. Grahn et al. [16] undertook a meticulous assessment of the cost competitiveness and environmental performance of various energy carriers, including hydrogen, e-ammonia, e-methanol, and electricity, across different propulsion systems. Their study underscores the promise of these selected technologies as effective means to significantly diminish emissions within the shipping sector. Parallel to Grahn et al. [16], Anderson et al. [17] and Skov et al. [18] conducted rigorous analyses, probing the cost dynamics and environmental ramifications associated with the production of low-carbon marine fuels. Their collective conclusion accentuates the higher CO mitigation costs inherent in alternative fuels and novel propulsion systems when compared to existing options, highlighting the imperative for substantial incentives to facilitate widespread adoption. Furthermore, a plethora of optimization models have been formulated to attain optimal decisions on sailing speed, vessel routing, fleet allocation and so on. Dulebenets [19] delved into the realm of green scheduling for ships, crafting a novel mixed-integer non-linear programming model. This model took into account carbon emissions both at sea and during port activities, offering a holistic approach to emissions reduction. Sheng et al. [20] formulated a sophisticated mixed-integer programming model to explore the optimal ship speed and size considerations when transiting through emission control areas, providing valuable insights into emissions reduction strategies. Ge et al. [21] constructed a stochastic programming model to investigate the implications of a maritime emissions trading system on carrier’s ship deployment strategies and carbon emissions, shedding light on the potential impact of market-based mechanisms on environmental sustainability within the industry.
What is more, in terms of clean energy price elasticity, clean energy markets are subject to influences extending beyond the typical forces of supply and demand [22]. In addition, research by Hemrit and Benlagha in 2021, as indicated by [23], had shed light on additional factors such as geopolitical risks (GPR), climate policies, and economic policy uncertainty (EPU). Additionally, a substantial body of literature also demonstrates the profound impact of climate change and climate policies on the volatility of energy markets, as exemplified by [24]. For instance, in [25], it was revealed that climate policy uncertainty plays a robust predictive role in shaping the dynamics of the clean energy market. Moreover, Kettner and Kletzan-Slamanig [26] underscored the significant influence of climate policies on energy prices due to the intrinsic connection between greenhouse gas emissions and the intricate interplay of energy supply and demand. In-depth analyses, such as those found in [27], probed the principal determinants of the clean energy market within the framework of climate models and comprehensive assessment models, suggesting that clean energy may exhibit heightened sensitivity to forthcoming climatic shifts. Moreover, major events exert substantial influence on energy supply and demand dynamics, consequently impacting energy prices. For instance, the Russian–Ukrainian conflict has not only led to a sharp decline in oil demand in both countries but has also severely disrupted the export of Russian clean fuels. This has prompted certain nations to consider an upsurge in clean energy adoption in response to the spike in oil prices. Evidently, the clean energy market is highly susceptible to the influence of factors of uncertainty, leading to price volatility and consequent shifts in supply and demand.
1.1.2. Book and Claim in the Shipping Industry
The maritime industry is facing escalating demands to curtail GHG emissions. Among the most efficacious tactics in mitigating these emissions is the transition away from traditional fuels, such as heavy fuel oil, in favor of clean fuel sources [28]. As a result, numerous policy measures have been proffered to incentivize maritime companies to embrace cleaner fuels. Among these, carbon insetting, or alternatively referred to as book and claim, has garnered increasingly discerning attention. The concept of book and claim proves advantageous when a shipper seeks to employ alternative fuels, such as LNG, but encounters logistical constraints hindering his direct bunkering. This approach enables the shipper to financially support the acquisition of clean fuels, allowing other vessels servicing ports with accessible supplies to refuel with environmentally friendly options on his behalf. Consequently, this practice effectively curtails carbon emissions. It is worth noting that the pricing structure for the Ship Green service per twenty-foot equivalent unit (TEU) exhibits variability based on the voyage’s duration and the magnitude of emissions reduction sought, ranging from 25% to a full 100% [29]. With a book and claim mechanism, the company could first book the CO reduction for a specific cargo volume and then it can claim the achieved CO reduction for that cargo volume [30]. The decoupling and exchange of emissions within the maritime industry offer significant benefits to stakeholders across the value chain. Cargo owners willing to invest in eco-friendly transport services can utilize the book and claim system to reduce their emissions, while ship operators using low-emission fuels gain access to a broader market of environmentally conscious cargo owners. Additionally, by monetizing their green initiatives through book and claim, ship operators can potentially secure higher time charter premiums for low-emission vessels, aiding in the recovery of their decarbonization investments. This mechanism serves as a collaborative, cost-sharing tool to alleviate the financial burdens associated with decarbonization, with participation open to all roles in the maritime supply chain, including shipowners, ship operators, freight forwarders, and cargo owners [31]. In practical terms, book and claim is already being put into action between some bunker suppliers and shippers. For example, Amsterdam-based Titan is poised to offer LNG insetting tokens through the 123Carbon platform to shipping companies and freight forwarders. Under this innovative approach, entities further down the supply chain, from bunkering onwards, are willing to pay a premium for the use of LNG as opposed to conventional fuels. This decision serves to curtail emissions, as the concept posits. The collaborating companies contend that the utilization of LNG-based tokens, a practice referred to as insetting, has the potential to yield emission reductions of up to 16%, rooted in the disparity between CO emissions from LNG and those from traditional fuel oil [32]. This highlights that the book and claim method is gaining more and more attention and recognition in the shipping industry, showing its increasing importance.
However, there are still some practical challenges of implementing book and claim. Many of the existing book and claim approaches currently in use, both in the aviation and shipping sectors, are proprietary ventures. In these instances, logistics providers or shipping companies exclusively offer low-emission shipping options to their clients, coupled with their proprietary book and claim services. While these developments in the market play a pivotal role in demonstrating the feasibility and value of book and claim methodologies, they also present a potential risk. The risk lies in the divergence of proprietary offerings concerning their accounting practices and the terms under which they are provided. This divergence has the potential to introduce uncertainty into the market, potentially impeding the growth in demand. Furthermore, there’s a concern that the book and claim system could be accused of greenwashing, as some companies may lay claim to sustainability without genuinely implementing sustainable practices. At the present time, there exists a lack of universally accepted regulations governing Registries and the book and claim model at large. This creates a susceptibility to issues such as double counting and data manipulation. Another widely shared apprehension is that emissions reductions through book and claim mechanisms cannot be reported in compliance with the Greenhouse Gas Protocol, nor can they be applied towards achieving an organization’s Science Based Targets Initiative (SBTi). Hence, it is necessary for the shipping industry to engage in concerted efforts to address critical obstacles and potential facilitators that can promote the adoption of book and claim tools, thereby expediting the process of maritime decarbonization. Facilitating collaborative efforts among companies to drive harmonization in accounting frameworks, commercial standards, and the general acceptability of book and claim within reporting standards holds the potential to significantly contribute to the realization of zero-emissions ocean transportation [33].
In a broader context, there is an increasing emphasis on green and sustainable development in the maritime industry. More policies and technological innovations have been introduced to mitigate carbon emissions from ships, such as the adoption of clean fuels to alleviate emissions pollution. The book and claim mechanism has emerged as a vital means of achieving fuel substitution, effectively promoting shippers to procure clean fuels to reduce carbon emissions, thereby promoting the environmentally sustainable growth of the shipping sector. Nevertheless, previous research efforts have predominantly focused on the theoretical examination of the utility of implementing the book and claim mechanism, with an emphasis on its potential to foster sustainability in the maritime industry. However, there has been a scarcity of studies that undertake a quantitative analysis of the efficacy of the book and claim mechanism in specific cases. In other words, there is a notable gap in research that seeks to analyze the decision-making behaviors of shippers and bunker suppliers when applying the book and claim mechanism in concrete scenarios. This entails scrutinizing how bunker suppliers price different types of fuel and the purchasing quantities of shippers at varying price points. Such an approach provides a more tangible perspective for the evaluation of the book and claim mechanism’s efficacy. In response to this gap, our study endeavors to address this by constructing two models—one with book and claim and one without book and claim. We conduct experiments to determine optimal prices for clean fuels and overall societal carbon emissions under different models. Through this quantitative analysis of the impact of book and claim, we aim to provide insights and guidance for policymakers and stakeholders, such as bunker suppliers, seeking references and best practices in this context.
1.2. Research Contributions
- 1.
- Theoretical contributions. The current research addresses a significant gap in existing literature by focusing on the optimal decision-making and carbon emissions within two models—one with and one without the book and claim mechanism. Remarkably, this specific aspect has been largely overlooked in prior studies. To the best of our knowledge, this has pioneered the paradox that with the book and claim mechanism, the shipping industry’s overall carbon emissions may experience an unexpected increase compared to without the book and claim mechanism.
- 2.
- Practical contributions. This research offers valuable practical insights into the realm of green and sustainable development within the shipping industry. The conclusions drawn from experiments are poised to serve as a valuable reference for relevant policymakers. Furthermore, they provide guidance for policymakers to conduct comprehensive market research, gain a deep understanding of the varying degrees of sensitivity among different shippers to clean fuel prices, and quantitatively assess policy effectiveness. Thus, these insights empower policymakers to make well-informed and scientifically sound decisions in the realm of policy formulation.
The rest of the paper is organized as follows. Section 2 describes the research problem in detail and develops the mathematical model. Section 3 proposes solution methods for addressing the initial proposed model. Section 4 conducts experiments and a sensitivity analysis. Finally, conclusions are drawn in Section 5.
The main notations used in this study are summarized in Table 1.

Table 1.
Notations.
2. Problem Description and Model Development
Maritime shipping, long recognized as the primary mode of transportation for approximately 90% of global trade, has played a crucial role in ensuring the efficient and cost-effective movement of goods [34]. However, despite its significance, the industry has faced substantial public criticism. The primary source of concern stems from its heavy reliance on fossil fuel combustion, resulting in the substantial release of GHGs, with carbon dioxide (CO) being the primary culprit. These significant carbon emissions from shipping have emerged as a formidable contributor to global warming and climate change. According to the Fourth International IMO GHG study conducted in 2020 [35], the total CO emissions from shipping increased from 962 million tonnes in 2012 to 1056 million tonnes in 2018. This accounted for roughly 3% of global anthropogenic CO emissions during the period of 2012 to 2018. Disturbingly, the study also reveals that without additional carbon emission mitigation measures, maritime CO emissions could soar by 130% of 2008 levels by 2050 under various scenarios of economic conditions and energy consumption [34].
In response to this challenge, numerous emission reduction measures in shipping have been proposed to foster the green and sustainable development of the maritime industry. Among these measures, carbon insetting has garnered increasing attention in recent years. The implementation of carbon insetting relies on the foundation of book and claim principles.
The book and claim mechanism empowers us to reserve, oversee, authenticate, and lay claim to the environmental advantages linked with the utilization of sustainable fuels. Essentially, it serves as a method to disentangle specific attributes, such as diminished greenhouse gas emissions, from the tangible product and transfer them to another entity. One allocates a precise volume of sustainable fuel in one location, then asserts ownership of it in another, entirely disconnected location. This ingenious approach enables the acquisition of environmental benefits without the need to physically track the fuel’s journey through the supply chain. An independently verified certificate is issued to substantiate these claims (further elaboration on this is provided below). This process, also recognized as carbon insetting, presents vast untapped potential. When implemented correctly and universally adopted across industries, it has the potential to instigate a significant transformation toward more environmentally conscious logistics, thereby dramatically reducing the carbon footprint of the transportation sector. While the book and claim system might appear to be a relatively straightforward accounting model, it represents a remarkably innovative solution to a multifaceted problem. It allows individuals and businesses alike to actively contribute to sustainable logistics. Whether dispatching a small package or an entire pallet, every individual or company has the opportunity to engage in the sustainable fuels market. This participation must expand rapidly if we are to effectively diminish the carbon footprint of the transportation sector and actively contribute to achieving global climate objectives. In the context of a sustainable economy, sustainable logistics is not merely a desirable aspect but an absolute necessity. The book and claim system serves as a crucial mechanism propelling us one step closer to realizing both these aspirations [36]. In maritime, book and claim enables shippers to financially support the procurement of alternative fuels and allows other vessels calling at ports with available supplies to utilize these fuels on their behalf. For instance, consider the case of shipper A, who charters a vessel V1 on a route, which unfortunately lacks the access to use clean energy and consequently emits high carbon emissions. Concurrently, shipper B charters a vessel V2 sailing on another route, who possesses the ability to utilize clean energy and reduce carbon emissions. In this book and claim mechanism, shipper A could opt to purchase clean energy for shipper B’s V2, enabling V2 to utilize clean energy during its operations, while attributing the resulting emission reductions from V2’s use of clean energy to V1. This effectively reduces the carbon footprint associated with shipper A’s products.
Based on the book and claim, we consider a scenario involving multiple bunker suppliers and shippers. Within this market context, all bunker suppliers possess the capability to vend traditional fuels, yet only one bunker supplier has the capacity to supply clean fuels. Shippers are constrained to procure clean fuels from this single bunker supplier, given the prevailing market condition of a sole clean fuel provider. Let there be N shippers, denoted by . Each shipper i has a few carbon reduction targets, the number of which is . Target is the reduction of CO by tons, and the shipper i would like to pay dollars.
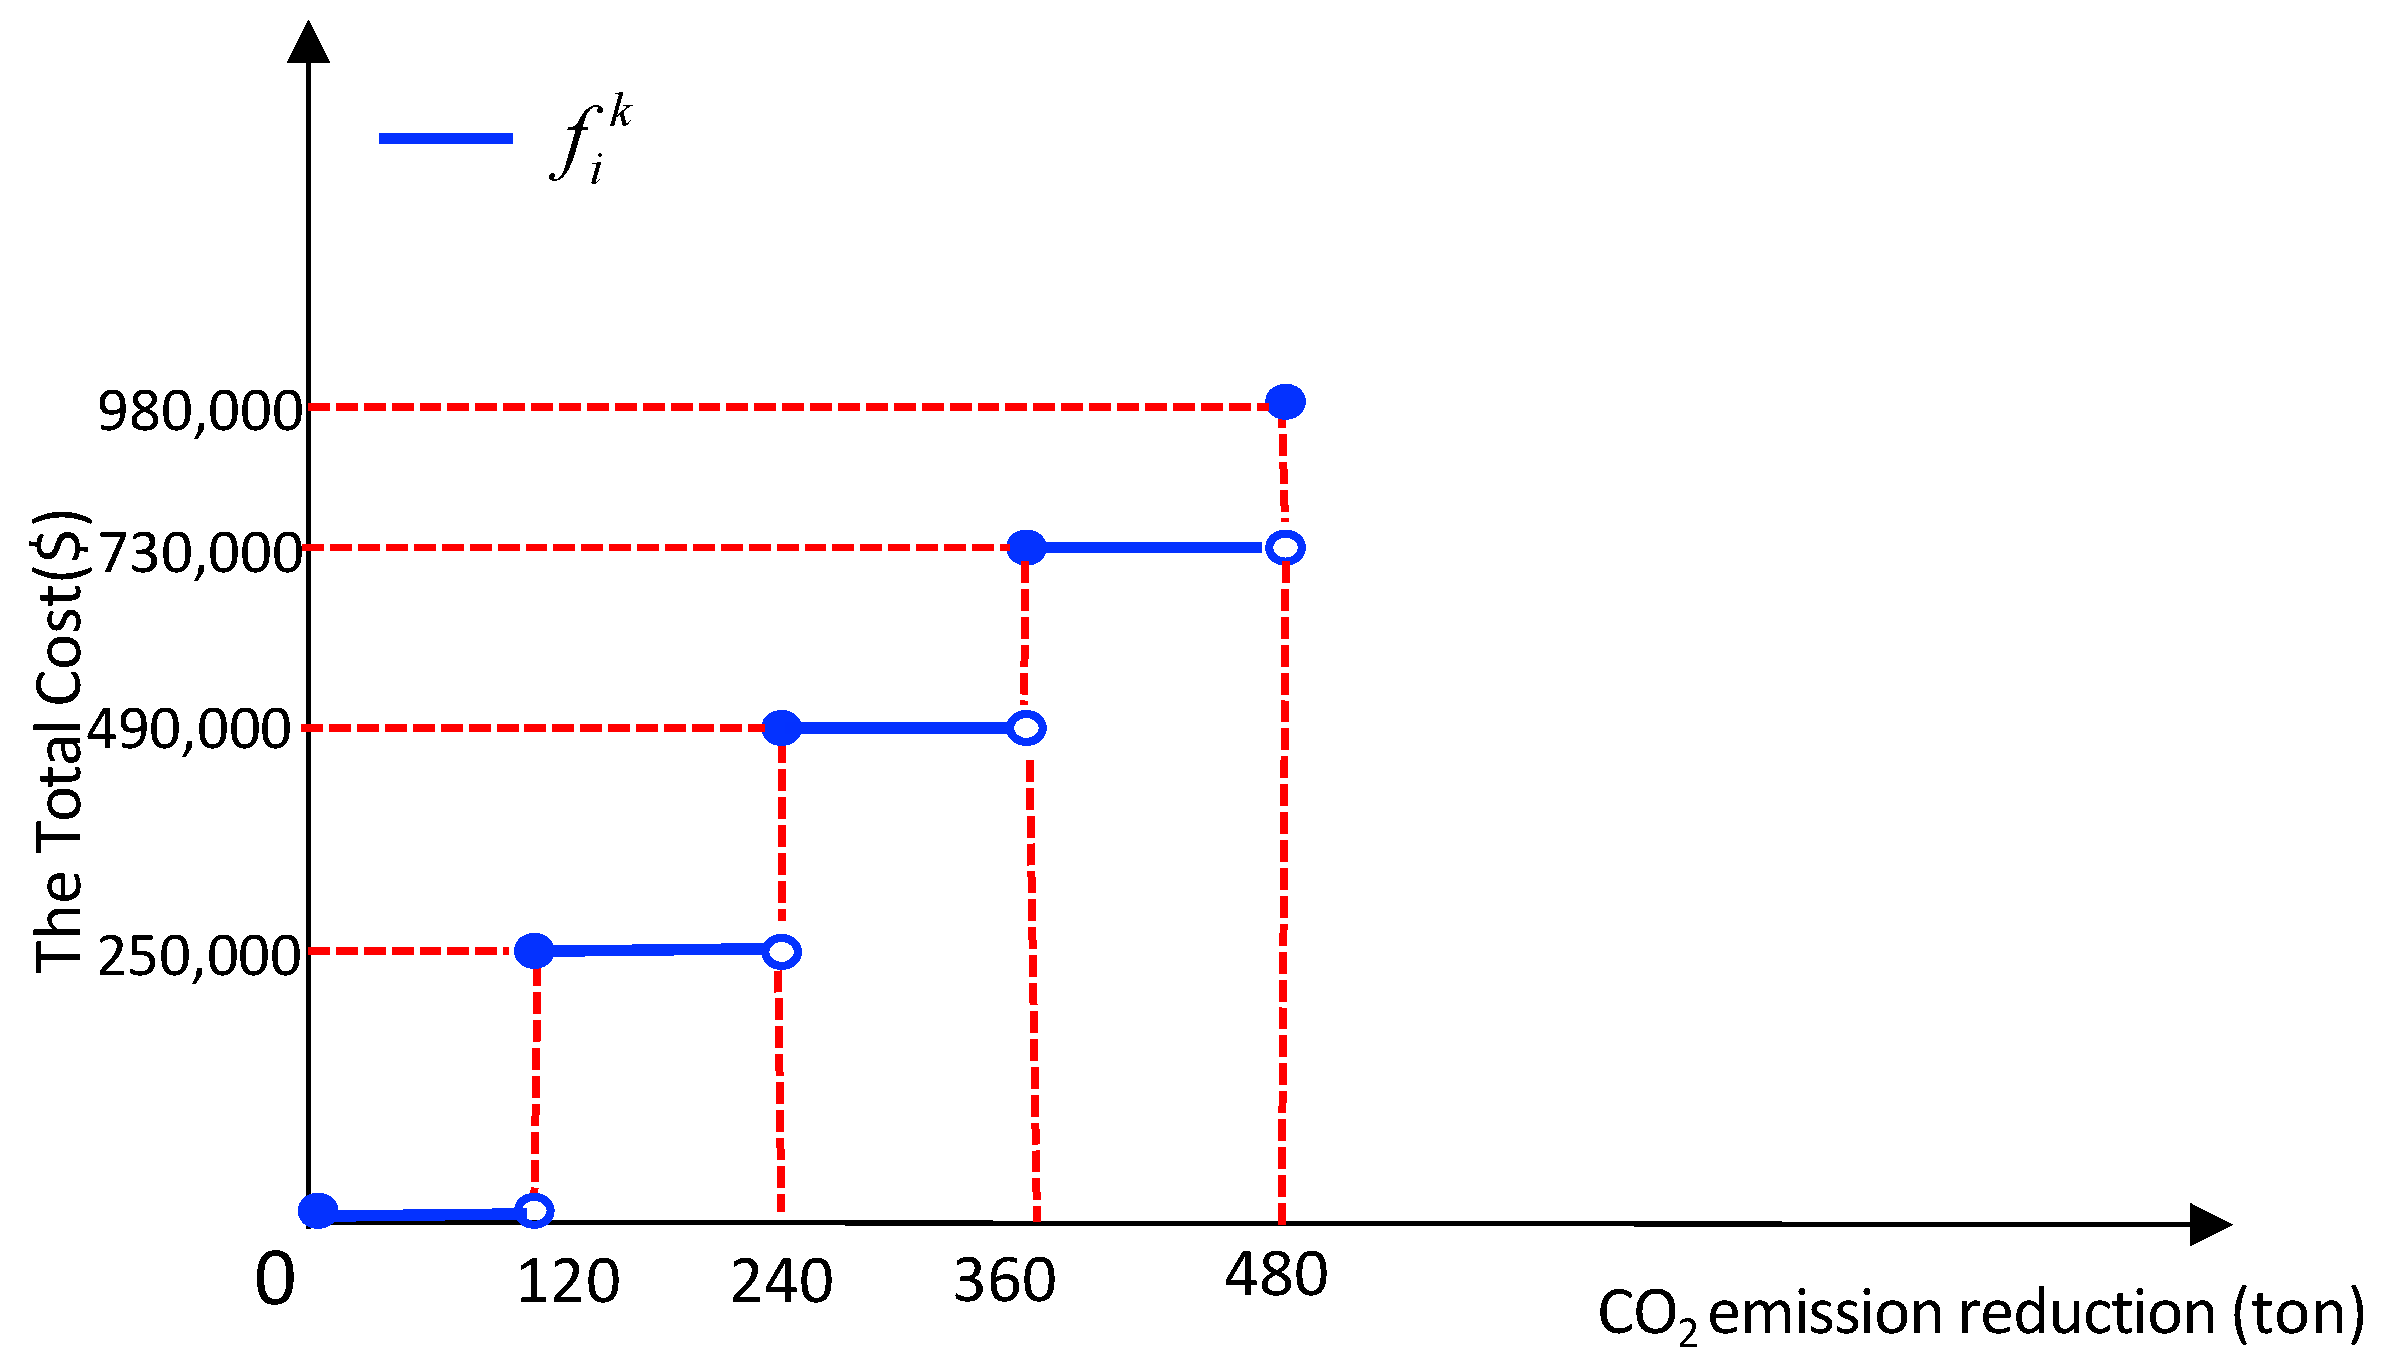
To facilitate our research, we define the conversion coefficient between traditional fuels energy and clean fuels energy , which means 1 ton of traditional fuel will generate the same amount of energy as tons of clean fuels. In addition, we define that 1 ton of traditional fuel generates tons of CO, and 1 ton of clean fuel generates tons CO. Moreover, the price a bunker supplier sells traditional fuel to shippers is denoted as (dollar/ton), while the price a bunker supplier sells clean fuel to shippers is denoted as x (dollar/ton), which is a decision variable, and the upper bound of x is set to . Considering practical situations, we assume that x is an integer, as fuel prices are integer dollars per ton usually. Based on the above parameters and variables setting, we can conclude that burning 1 ton of clean fuel can save a CO amount of , compared with burning a ton of traditional fuel. Therefore, target k of shipper i is to use tons of clean fuels, and the shipper i would like to pay (dollars). Furthermore, we define , which means if , the shipper i would like to buy tons of clean fuels. For example, suppose that traditional fuel only includes diesel, burning one ton of which will generate 3.024 ton CO. Meanwhile, we assume that clean fuel only includes methanol, and burning one ton of methanol will generate 1.267 ton CO. The value of is set to 1.8 [37]. Hence, compared to diesel, using methanol will reduce CO : ton. Suppose the is 120 tons and the corresponding is 120,000 dollars. Then, the is equal to tons, while is equal to . More detailed information is shown in Figure 1. Furthermore, we define that and assume , as when shipper i purchases more clean fuels, the unit price of clean fuel will decrease from a practical situation.
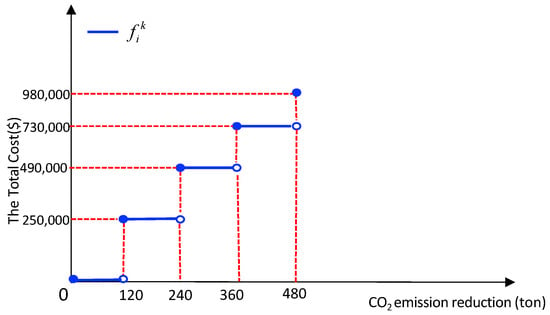
Figure 1.
The relationship curve between total cost and CO emission reduction.
Besides, we suppose the purchasing cost of traditional for a bunker supplier is (dollar/ton) and clean fuel is (dollar/ton). We further define parameter , which means the total energy quantity of traditional fuels for shipper i. For decision variables, we define as the amount of clean fuels to buy for shipper i and as the amount of traditional fuels to purchase for shipper i. What is more, is defined as a binary decision variable that is equal to 1 if and only if shipper i achieves the target k and 0 otherwise.
According to the above assumptions and parameters as well as decision variables setting, we can deduce the model with book and claim (in this research, we assume in the system that there are enough ships equipped with engines that can burn clean fuel). In this model, the bunker supplier serves as the price setter for clean fuels (in the context of our study, only this particular bunker supplier can provide clean fuels, while several others offer traditional fuels at market-average prices). Shippers, on the other hand, optimize their fuel purchase quantities based on the prices set by the supplier. Consequently, the model necessitates the maximization of the bunker supplier’s profit through the optimization of clean fuel prices and the quantities purchased by individual shippers. Therefore, the model is represented as follows:
[M1]
subject to
Objective function (1) consists of two parts. Firstly, calculates the net clean fuels profit. Secondly, represents the net traditional fuels profit for the bunker supplier. Constraints (2) meet the total energy demand for shipper i, , where we use the conversion coefficient to converse clean fuels energy to corresponding traditional fuels energy to facilitate our research. Constraints (3) calculate the total clean fuels for shipper i, . Constraints (4) represent shipper i, purchase quantity of clean fuels based on the clean fuel price x set by the bunker supplier to achieve carbon reduction target k, or not purchase any clean fuels (if x is greater than ). Furthermore, constraints (5) regulate the clean fuel prices ranges when shipper i, will purchase tons clean fuels to realize target k, . Constraint (6) restricts the selling price of clean fuels x.
3. Solution Methods
Model [M1] is hard to solve due to the operation of multiplying decision variables in objective function (1) and the constraints (5) are difficult to deal with. We next develop methods to address these problems and transform [M1] into an MILP model, which improves computational efficiency.
The constraints (5) are hard to deal with. We can define
and then the constraints (5) are transformed into:
It is equivalent to:
It is equivalent to:
M represents an extreme value, a common feature in the utilization of the big-M method. When employing this method, it is imperative to specify the value of the big-M. However, it is worth noting that not all instances of big-M in a model are uniform. The magnitude of the big-M must be substantial enough to ensure the constraints are satisfied by the optimal solution to the problem at hand. In the process of constructing a model, it is generally preferred to employ a smaller value for the big-M, provided that it is still sufficiently large to guarantee the model’s accuracy. This preference stems from the fact that computational time for solving a model with smaller big-M values is typically shorter than for an equivalent model with larger big-M values. As such, the determination of the precise value of M hinges upon the specific characteristics of the problem in question. In this constraint, the above big-M can be .
In this constraint, the above big-M can be .
Finally, the obj function has the term
We can define intermediate decision variables , , and thus replace in objective function 1 with subject to
Hence, we transform the nonlinear integer programming model [M1] into mixed-integer linear programming (MILP) model [M2]:
[M2]
subject to
where the big-M in constraint (22) can be set to , and the big-M in constraint (23) can be set to .
Generally speaking, the model [M2] encompasses three categories of decision variables. The first category involves integer decision variables x and . The second category include binary decision variables , comprising a total of binary decision variables. Specifically, is equal to 1 if and only if shipper i achieves target k and 0 otherwise. The last category consists of continuous decision variables . Hence, the original optimization model has been transformed into an MILP model, which can be solved by the off-of-shelf optimization solver Gurobi.
To better understand the efficacy of implementing the book and claim mechanism, we construct two models based on the presence or absence of the book and claim mechanism, evaluating the influence of book and claim mechanism establishment on the bunker supplier’s pricing strategy for clean fuel and, furthermore, its impact on the overall societal carbon emissions. For the model without book and claim, we define the first shippers to be the ones that use ships that can burn both clean fuels and traditional fuels. Then, the resulting model is the same, except N is replaced with (it is important to clarify that due to the model’s optimization decisions being independent of the sequence in which shippers are arranged, we can assume that among the N shippers, the first shippers have the capability of utilizing both traditional and clean fuels. Consequently, in scenarios where the book and claim mechanism is absent, the remaining N- shippers are constrained to purchase traditional fuels exclusively. As a result, the model only necessitates the optimization of the first shippers).
4. Experiments
4.1. Experiment Settings
The experiments were run on a laptop computer equipped with 2.60 GHz of Intel Core i7 CPU and 16 GB of RAM, and Model [M2] was solved by Gurobi Optimizer 10.0.2 via Python API.
4.1.1. Selected Shippers
In this study, we have selected a total of 20 shippers, with each shipper i exclusively chartering a single vessel along a specific shipping route. Additionally, we assume that each shipper i has its own price function for carbon emission reductions, which means different price sensitivities. To adequately assess the effectiveness of book and claim, we divide the 20 shippers into two groups, with each group consisting of 10 shippers. Furthermore, we assume that ships chartered by shipper 1 to shipper 5 in each group can only utilize traditional fuels, meaning that in the absence of book and claim, these shippers are limited to purchasing traditional fuels. Conversely, ships chartered by shipper 6 to shipper 10 in each group have the flexibility to choose clean fuels or traditional fuels. The price functions and corresponding values for both groups are presented in Table 2 and Table 3.
Table 2.
The basic information of shippers in group 1.
Table 3.
The basic information of shippers in group 2.
4.1.2. Parameter Settings
We first set the values of parameters for drawing the basic results.
- 1.
- The CO emission of a ton of clean fuel generates . Referring to [37], we first set ton.
- 2.
- The CO emission of a ton of traditional fuel generates . Referring to [37], we first set ton.
- 3.
- The purchasing cost of clean fuel for bunker supplier . We set per ton.
- 4.
- The purchasing cost of traditional fuel for bunker supplier . We set per ton.
- 5.
- The price a bunker supplier sells traditional fuel to shippers . Referring to [38], we set per ton.
- 6.
- The highest price a bunker supplier sells clean fuel to shippers . We set to be $1200 per ton.
- 7.
- Referring to [37], the conversion coefficient between clean fuels energy and traditional fuels energy . We set .
4.2. Basic Results
Based on the shippers presented in Table 2 and Table 3 as well as the parameter settings, we conducted numerical experiments for both groups, considering both the scenarios with book and claim and without book and claim mechanisms. The results obtained are presented in Table 4, Table 5, Table 6 and Table 7. As described in Section 2, the decisions regarding clean fuel price that the bunker supplier sells to shippers, denoted by the variable x, and the quantity of clean fuel purchased by shipper i, denoted by , as well as the quantity of traditional fuel purchased by shipper i, denoted by , play a crucial role in the analysis. Hence, we conducted a comprehensive analysis of x, , and across different models.
Table 4.
Basic results of group 1 with book and claim.
Table 5.
Basic results of group 1 without book and claim.
Table 6.
Basic results of group 2 with book and claim.
Table 7.
Basic results of group 2 without book and claim.
For the experiment results pertaining to group 1, it is conspicuously evident that with book and claim, the cumulative quantity of clean fuel purchased by all shippers significantly surpasses the quantity of clean fuel procured by shippers in the absence of book and claim. This observation underscores the compelling incentive provided by book and claim, motivating shippers to acquire clean fuels as a means to mitigate CO emissions. Such proactive measures not only contribute to the advancement of the shipping industry but also foster a broader societal agenda centered around environmental sustainability and green initiatives. Furthermore, regarding the price of clean fuels, in the presence of the book and claim mechanism, the bunker supplier sets the price of clean fuel at 998 dollars per ton. Conversely, in the absence of the book and claim mechanism, the price of clean fuel stands at 894 dollars per ton, significantly lower than the former. This discrepancy arises because without the book and claim mechanism, the bunker supplier is constrained to sell clean fuel to a limited number of shippers. These shippers, being sensitive to the price of clean fuel, are unwilling to accept exorbitant prices. Consequently, in order to ensure the sale of clean fuel, the bunker supplier is compelled to moderately reduce the price of clean fuel. Thus, relative to the profit under the book and claim mechanism (7,160,249 dollars), the profit for the bunker supplier in the absence of the book and claim mechanism experiences a decline (6,458,844 dollars).
From a cost–benefit perspective, as previously discussed, the utilization of one ton of clean fuel generates 1.267 tons of carbon dioxide, while the use of one ton of traditional fuel results in the production of 3.024 tons of carbon dioxide. Consequently, we can calculate that in scenarios with the book and claim mechanism in place, the overall carbon emissions amount to tons, with profits totaling $7,160,249. In situations where the book and claim mechanism is absent, the overall carbon emissions are calculated as tons, yielding profits amounting to $6,458,844 Therefore, within group 1, the implementation of the book and claim mechanism not only enhances the profitability of the bunker supplier but also mitigates the overall carbon emissions.
However, for group 2, we made an interesting discovery: in contrast to the model with book and claim, we observed that under the model without book and claim, the cumulative quantity of clean fuel purchased by all ships was higher, leading to lower CO emissions. This observation contradicts the initial intent of implementing book and claim to reduce CO emissions. To address this, we can offer the following explanation: within group 2, shipper 1 to shipper 4 exhibit lower price sensitivity, implying their willingness to incur higher costs to reduce CO emissions by purchasing clean fuels. On the other hand, the remaining shippers display higher price sensitivity and are unwilling to incur higher costs to reduce CO emissions. Consequently, in order to maximize profits, the bunker supplier sets a higher selling price for clean fuel. In this scenario, shipper 1 to shipper 4 will purchase clean fuels at a higher price, while the rest of the shippers will refrain from buying clean fuel due to the elevated cost. Thus, even though the overall quantity of clean fuel purchased by all shippers may be relatively low, the bunker supplier can still attain substantial profits. Similar to group 1, the bunker supplier, in the presence of the book and claim mechanism, establishes a pricing for clean fuel at 1200 dollars per ton, which exceeds the price observed in the absence of the book and claim mechanism, set at 963 dollars per ton. Owing to this significantly elevated price, the bunker supplier can achieve substantial profits, even with lower sales of clean fuel under the book and claim mechanism, which amounts to a lower quantity compared to sales in the absence of the book and claim mechanism. Consequently, the profit realized by the bunker supplier under the book and claim mechanism (8,158,255 dollars) surpasses that which is attained in the absence of the book and claim mechanism (7,097,363 dollars).
Likewise, we conducted an analysis of carbon emissions and profits for group 2, considering the presence or absence of the book and claim mechanism. With the book and claim mechanism in place, the carbon emissions amounted to tons, yielding profits of $8,158,255. In scenarios where the book and claim mechanism was absent, the carbon emissions were calculated as tons, resulting in profits of $7,097,363. Therefore, when comparing the situation with the presence of the book and claim mechanism to its absence, we observe a reduction of 120 tons in carbon emissions and a decrease in profits by $1,060,892, presenting the paradox: “Implementing the book and claim mechanism paradoxically leads to an increase in carbon emissions”.
Hence, we argue that the book and claim may give rise to an increase in CO emissions due to the bunker supplier’s objective of maximizing profit and the varying price sensitivities of different shippers towards clean fuels. Specifically, the bunk supplier is inclined to set a higher price x for clean fuels. This allows him to sell a smaller quantity of clean fuels to shippers with lower demand and lesser price sensitivity, thereby maximizing his profit. However, shippers with a greater demand for emission reductions, who are sensitive to clean fuels prices, face difficulties in purchasing clean fuels. Consequently, this results in the paradox of an overall increase in societal carbon emissions, despite the establishment of the book and claim with the intention of reducing carbon emissions.
For instance, we consider a simple scenario involving a bunker supplier and two shippers: shipper 1 and shipper 2. We assume that shipper 1 is constrained to using traditional fuels with a lower fuels demand, while shipper 2 has the option to use traditional fuels or clean fuels with a higher fuels demand. In this scenario, shipper 1 exhibits a lower level of price sensitivity, indicating a willingness to pay a higher price for clean fuel in order to reduce carbon emissions. Conversely, shipper 2 displays higher levels of price sensitivity, meaning he is only inclined to purchase clean fuel for emission reduction purposes when the price of clean fuel is comparatively lower. The pricing functions and respective values of for these two shippers are represented in Table 8:
Table 8.
The basic information of two shippers.
Through numerical experiments, we have derived consequential decisions made by both the bunker supplier and the shippers in the models with and without book and claim. The fundamental results yielded by these two distinct models are as follows:
Through Table 9, we have observed that due to shipper 1’s lower price sensitivity, in the presence of book and claim, shipper 1 is willing to pay a higher price to fulfill their decarbonization needs. Consequently, the bunker supplier might set a higher price x, knowing that shipper 1 will still purchase clean fuels. Despite a potential decrease in the quantity of clean fuels sold, the bunker supplier can still generate overall higher profits. However, shipper 2, constrained by the elevated prices, is unable to afford clean fuels, resulting in an increase in society’s overall CO emission.
Table 9.
Basic results with book and claim.
Conversely, in Table 10, where book and claim does not exist, shipper 1 is restricted to using traditional fuels, rendering the bunker supplier able to sell clean fuels only to shipper 2. Given the higher price sensitivity of shipper 2, he can only accept lower fuel prices. Therefore, the bunker supplier would adjust the price downwards (compared to the model with book and claim) to stimulate a clean fuels sale and maximize profits, consequently leading to a reduction in society’s carbon emissions. This explains the paradox of why the establishment of book and claim paradoxically results in increased carbon emissions.
Table 10.
Basic results without book and claim.
Hence, we can deduce that if within the market, there exists a significant portion of shippers with substantial demand for emission reductions who are highly sensitive to clean fuel pricing, alongside a smaller segment of shippers with limited request for emission reductions and insensitivity to clean fuel prices, the paradox of book and claim may arise. Conversely, in cases where the demand for emission reductions among shippers sensitive to clean fuel prices is not substantial, the paradox will not materialize. Ultimately, the occurrence of this paradox hinges upon the balance between the aggregate demand for emission reductions of each shipper in the market and his sensitivity to clean fuel pricing.
4.3. Sensitivity Analysis
As the maritime industry’s emphasis on carbon reduction and the principles of sustainable development continue to garner increasing attention and recognition, the transition of fuels, shifting from conventional to cleaner alternatives, undoubtedly stands as a pivotal component in achieving low-carbon progress in the shipping sector. Consequently, the prices of these two fuel types undeniably exert a pronounced influence on the decision-making processes of both bunker suppliers and shippers. In practice, the fuel market is often subject to external risks, such as the ongoing impact of unforeseen events, exemplified by the recent pandemic, resulting in considerable volatility in fuel prices. Therefore, it is imperative to undertake sensitivity analyses on the pricing and cost structures of different fuels. In our research, we have meticulously conducted sensitivity analyses on critical parameters, including the procurement cost of clean fuel for bunker suppliers (), the acquisition cost of traditional fuel for bunker suppliers (), and the selling price of traditional fuel from bunker suppliers to shippers (). These analyses serve as a robust framework for evaluating the nuanced interplay of these variables in shaping strategic decisions and addressing the challenges inherent in this dynamic environment.
4.3.1. Impact of the Purchasing Cost of Clean Fuel for the Bunker Supplier
Our initial analysis focused on , considering a range spanning from 600$/ton to 900$/ton, with the core outcomes presented in Table 11 and Table 12. Regarding the bunker supplier’s decision, within both groups, as increases, there is a discernible tendency for the bunker supplier to judiciously augment the pricing of clean fuels, resulting in a gradual decline in his overall profitability. Simultaneously, we also observe that, whether within group 1 or group 2, the profitability of the bunker supplier in the presence of the book and claim mechanism surpasses that of scenarios devoid of such a mechanism. This alignment with our prior analysis underscores the notion that in the absence of a book and claim mechanism, the bunker supplier tends to lower prices to ensure the sale of clean fuels but, overall, experiences a reduction in profitability. In terms of shippers’ decisions, the ascent of , resulting in an increase in x, leads to a proportional decrease in their acquisition of clean fuels. In parallel, there is a concomitant upsurge in their procurement of traditional fuels.
Table 11.
Sensitivity of in group 1.
Table 12.
Sensitivity of in group 2.
4.3.2. Impact of the Purchasing Cost of Traditional Fuel for the Bunker Supplier
Subsequently, we conducted a sensitivity analysis on , constraining its range between $300 and $600, with the fundamental outcomes presented in Table 13 and Table 14. Concerning the bunker supplier’s strategic considerations, as the price of escalates while holding other variables constant, the profit margins on traditional fuels diminish. In response, the bunker supplier, under these circumstances, endeavors to enhance his sales volume of clean fuels by judiciously lowering his prices, thus maximizing his overall profitability. Consequently, we observe a decline in the value of x as ascends, along with a continuous erosion of the overall profitability. Regarding shippers’ decision-making, with the elevation of , there is a continuous augmentation in the quantities of clean fuels procured, concomitant with a corresponding reduction in the quantities of traditional fuels acquired.
Table 13.
Sensitivity of in group 1.
Table 14.
Sensitivity of in group 2.
4.3.3. Impact of the Price a Bunker Supplier Sells Traditional Fuel to Shippers
Lastly, we conducted an analysis of , defining its range between $520 and $820, with the fundamental outcomes showcased in Table 15 and Table 16. Concerning the bunker supplier’s decision making, as ascends, the bunker supplier experiences an increase in profitability within the realm of traditional fuels, resulting in an overall profit uptick. In the context of clean fuel pricing, with the escalation of traditional fuel prices, shippers curtail their purchases of traditional fuels and augment their procurement of clean fuels. Under these circumstances, in the presence of the book and claim mechanism, the bunker supplier may consider elevating the prices of clean fuels. This strategy entices price-sensitive shippers to purchase clean fuels at higher rates, thereby maximizing their overall profitability. Conversely, in scenarios where the book and claim mechanism is absent, the bunker supplier, despite the inclination to raise clean fuel prices, takes into account the price sensitivity and purchasing demands of shippers. As a result, while there is an adjustment in pricing, it is less pronounced than in situations where the book and claim mechanism is in place. Nevertheless, the bunker supplier still witnesses a continuous uptick in his overall profitability. Regarding shippers’ decisions, as traditional fuel prices increase, their purchases of traditional fuels decrease, paralleled by a corresponding increase in their procurement of clean fuels.
Table 15.
Sensitivity of in group 1.
Table 16.
Sensitivity of in group 2.
5. Conclusions
Our research entails an analysis of the optimal decisions made by the bunker supplier and shippers, as well as the overall carbon emissions, in scenarios with and without the book and claim mechanism. Specifically, we have constructed two MILNP models and transformed them into MILP models for ease of study. To facilitate our investigation, we consider a scenario featuring a single bunker supplier and multiple shippers. In the course of our experiments, we have introduced 20 shippers with varying degrees of price sensitivity towards clean fuels and divided them into two groups for experimentation. Through our experiments, we have unveiled a fascinating observation: the price sensitivity of shippers towards clean fuels varies significantly. Some shippers exhibit low demand and low price sensitivity towards clean fuels, while others may have high demand and heightened sensitivity to prices. In light of this, in the presence of the book and claim mechanism, the bunker supplier might opt to set a higher selling price for clean fuels. Low-price-sensitive shippers would continue to purchase clean fuels, while those with higher price sensitivity might find it challenging to do so. In this scenario, although the bunker supplier sells a reduced quantity of clean fuels, he can still generate substantial profits through higher fuel prices. Paradoxically, however, this results in an overall increase in societal carbon emissions. In contrast, in the absence of “book and claim,” the bunker supplier would only be able to sell clean fuels to high-demand, high-sensitivity shippers. Without the book and claim mechanism, the bunker supplier might choose to set a relatively lower fuel price (compared to the price under book and claim) to stimulate fuel sales. This not only maximizes the bunker supplier’s profits but also contributes to reduced carbon emissions within the shipping industry. Meanwhile, if the desire for emission reductions among environmentally conscious shippers who are sensitive to clean fuel costs is modest, the paradox will not happen. In summary, the emergence of this paradox depends on the intricate balance struck between the demand for emission reductions of every shipper in the marketplace and his susceptibility to the pricing dynamics of clean fuels.
Hence, we have uncovered this paradoxical scenario where the implementation of book and claim inadvertently leads to an increase in overall societal carbon emissions. This provides guidance and a reference for governmental entities when formulating policies. Specifically, policymakers need to commence with extensive market research, comprehending the varying demands for emission reductions and the sensitivity to clean fuel prices among different shippers in the market. For instance, understanding the quantity of clean fuel shipper i would purchase at a specific price point. Concurrently, an analysis of bunker suppliers’ pricing strategies is essential. Once this information is gathered, an assessment of the aggregate quantity of clean fuel purchased by all shippers in the market at different price points, in comparison to the aggregate quantity of traditional fuels, enables an inference regarding whether the implementation of the book and claim system would engender a paradox. This analytical approach facilitates informed and rational decision-making by governmental bodies. These considerations hold a paramount role in driving forward the ethos of environmentally conscious and sustainable progress within the maritime industry. In essence, they form the cornerstone of a broader vision to foster a maritime industry that not only thrives economically but does so while minimizing its ecological footprint and enhancing its long-term viability.
Meanwhile, our research is not without its limitations. For instance, the scenarios we have assumed are relatively simplistic, devoid of the consideration of a myriad of clean and traditional fuel types. Furthermore, we have not taken into account shippers’ preferences when it comes to fuel selection, and the demands of shippers have not been based on real-world data. Building upon these considerations, we will enhance our research from the following aspects in the future. (i) Enhanced Scenario Complexity: Future research will delve into more intricate and realistic scenarios that encompass a wider array of clean and traditional fuel types. By introducing these complexities, we can gain a deeper understanding of the dynamics at play in the decision-making process. (ii) More advanced techniques: To push the boundaries of research in this field, the incorporation of more advanced techniques is essential. These advanced techniques encompass highly sophisticated mathematical and computational tools that can be harnessed to tackle the intricacies of models that consider a multitude of variables and constraints. In essence, these advanced techniques offer the means to navigate the complexities arising from a broader spectrum of clean and traditional fuel types, shippers’ diverse preferences, fluctuating market dynamics, and the ever-evolving regulatory landscape. (iii) Real-World Data Collection: To bolster the applicability of research findings, collecting real-world data on shipper demands and market conditions would be invaluable. These data can serve as a foundation for more accurate and insightful modeling and analysis. (iv) Comparative Analysis: Comparative studies between different regions or industries can yield valuable insights. Analyzing how fuel selection decisions vary across diverse contexts can reveal best practices and potential areas for improvement.
In summary, our research findings are inherently innovative, offering valuable guidance and a benchmark for governmental entities in deliberating the establishment of a book and claim mechanism. Furthermore, our work contributes significantly to fostering the green and sustainable development of the maritime industry. While acknowledging the current strengths of our study, it is important to note that certain limitations persist. Consequently, we are committed to undertaking more profound research explorations in the future, aiming to refine and augment our study. This endeavor is poised to elevate the efficacy of our research, ensuring its enhanced applicability and impact within the realm of sustainable practices in the shipping industry.
Author Contributions
Conceptualization, S.W., Y.L., H.W. and Y.D.; methodology, S.W., Y.L., H.W. and Y.D.; software, Y.L.; validation, S.W., Y.L., H.W. and Y.D.; formal analysis, S.W. and Y.L.; writing—original draft preparation, S.W. and Y.L.; writing—review and editing, H.W. and Y.D.; visualization, Y.L.; supervision, S.W. and Y.D. All authors have read and agreed to the published version of the manuscript.
Funding
This research received no external funding.
Data Availability Statement
Data are contained within the article.
Conflicts of Interest
The authors declare no conflict of interest.
References
- Bouman, E.A.; Lindstad, E.; Rialland, I.A.; Strømman, A.H. State-of-the-art technologies, measures, and potential for reducing GHG emissions from shipping—A review. Transp. Res. Part D Transp. Environ. 2017, 52, 408–427. [Google Scholar] [CrossRef]
- Kim, H.; Koo, K.Y.; Joung, T.H. A study on the necessity of integrated evaluation of alternative marine fuels. J. Int. Marit. Safety Environ. Aff. Shipp. 2020, 4, 26–31. [Google Scholar] [CrossRef]
- Joung, T.H.; Kang, S.G.; Lee, J.K.; Ahn, J. The IMO initial strategy for reducing Greenhouse Gas (GHG) emissions, and its follow-up actions towards 2050. J. Int. Marit. Safety Environ. Aff. Shipp. 2020, 4, 1–7. [Google Scholar] [CrossRef]
- Sustainable Ships. What Is Carbon Insetting? 2023. Available online: https://www.sustainable-ships.org/stories/2021/what-is-carbon-insetting (accessed on 23 September 2023).
- Lagouvardou, S.; Psaraftis, H.N.; Zis, T. Impacts of a bunker levy on decarbonizing shipping: A tanker case study. Transp. Res. Part D 2022, 106, 103257. [Google Scholar] [CrossRef]
- Bayraktar, M.; Yuksel, O. A scenario-based assessment of the energy efficiency existing ship index (EEXI) and carbon intensity indicator (CII) regulations. Ocean. Eng. 2023, 278, 114295. [Google Scholar] [CrossRef]
- Sou, W.S.; Goh, T.; Lee, X.N.; Ng, S.H.; Chai, K. Reducing the carbon intensity of international shipping – The impact of energy efficiency measures. Energy Policy 2022, 170, 113239. [Google Scholar] [CrossRef]
- Hansen, E.K.; Rasmussen, H.B.; Lützen, M. Making shipping more carbon-friendly? Exploring ship energy efficiency management plans in legislation and practice. Energy Res. Soc. Sci. 2020, 65, 101459. [Google Scholar] [CrossRef]
- Lagouvardou, S.; Psaraftis, H. Implications of the EU Emissions Trading System (ETS) on European container routes: A carbon leakage case study. Marit. Transp. Res. 2022, 3, 100059. [Google Scholar] [CrossRef]
- Ovaere, M.; Proost, S. Cost-effective reduction of fossil energy use in the European transport sector: An assessment of the Fit for 55 Package. Energy Policy 2022, 168, 113085. [Google Scholar] [CrossRef]
- Malmborg, F. Advocacy coalitions and policy change for decarbonisation of international maritime transport: The case of FuelEU maritime. Marit. Transp. Res. 2023, 4, 100091. [Google Scholar] [CrossRef]
- Dominioni, G. Towards an equitable transition in the decarbonization of international maritime transport: Exemptions or carbon revenues? Mar. Policy 2023, 154, 105669. [Google Scholar] [CrossRef]
- European Economic and Social Committee. European Economic and Social Committee. 2022. Available online: https://www.eesc.europa.eu/en/our-work/opinions-information-reports/opinions/fit-55-delivering-eus-2030-climate-target-way-climate-neutrality (accessed on 23 September 2023).
- Wu, M.; Li, K.X.; Xiao, X.; Yuen, K.F. Carbon Emission Trading Scheme in the shipping sector: Drivers, challenges, and impacts. Mar. Policy 2022, 138, 104989. [Google Scholar] [CrossRef]
- European Commission. European Commission. 2022. Available online: https://climate.ec.europa.eu/eu-action/eu-emissions-trading-system-eu-ets_en (accessed on 15 September 2023).
- Kanchiralla, F.M.; Brynolf, S.; Malmgren, E.; Hansson, J.; Grahn, M. Life-Cycle Assessment and Costing of Fuels and Propulsion Systems in Future Fossil-Free Shipping. Environ. Sci. Technol. Environ. Aff. Shipp. 2022, 56, 12517–12531. [Google Scholar] [CrossRef] [PubMed]
- Brynolf, S.; Hansson, J.; Anderson, J.E.; Skov, I.R.; Wallington, T.J.; Grahn, M.; Korberg, A.D.; Malmgren, E.; Taljegård, M. Review of electrofuel feasibility—prospects for road, ocean, and air transport. Prog. Energy 2022, 4, 042007. [Google Scholar] [CrossRef]
- Korberg, A.D.; Brynolf, S.; Grahn, M.; Skov, I.R. Techno-economic assessment of advanced fuels and propulsion systems in future fossil-free ships. Renew. Sustain. Energy Rev. 2021, 142, 110861. [Google Scholar] [CrossRef]
- Dulebenets, M.A. Green vessel scheduling in liner shipping: Modeling carbon dioxide emission costs in sea and at ports of call. Int. J. Transp. Sci. Technol. 2018, 7, 26–44. [Google Scholar] [CrossRef]
- Sheng, D.; Meng, Q.; Li, Z. Optimal vessel speed and fleet size for industrial shipping services under the emission control area regulation. Transp. Res. Part C Emerg. Technol. 2019, 105, 37–53. [Google Scholar] [CrossRef]
- Zhu, M.; Yuen, K.F.; Ge, J.W.; Li, K.X. Impact of maritime emissions trading system on fleet deployment and mitigation of CO2 emission. Transp. Res. Part D Transp. Environ. 2018, 62, 474–488. [Google Scholar] [CrossRef]
- Muhammad, S.; Mohammad, D.M.; Alam, M.S.; Muhammad, A. Does economic policy uncertainty affect renewable energy consumption? Renew. Energy 2021, 179, 1500–1521. [Google Scholar]
- Anupam, D.; Probal, D. Geopolitical risk and renewable energy asset prices: Implications for sustainable development. Renew. Energy 2022, 196, 518–525. [Google Scholar]
- Sabine, F.; Jana, S.; Nikolay, K.; Michael, O. Renewables and climate change mitigation: Irreversible energy investment under uncertainty and portfolio effects. Energy Policy 2012, 40, 59–68. [Google Scholar]
- Liang, C.; Muhammad, U.; Ma, F.; Toan, L.H. Climate policy uncertainty and world renewable energy index volatility forecasting. Technol. Forecast. Soc. Chang. 2022, 182, 121810. [Google Scholar] [CrossRef]
- Kettner, C.; Kletzan-Slamanig, D. Is there climate policy integration in European Union energy efficiency and renewable energy policies? Yes, no, maybe. Environ. Policy Gov. 2020, 30, 141–150. [Google Scholar] [CrossRef]
- David, E.H.J.; Gernaat, H.S.B.; Vassilis, D.; Seleshi, G.Y.; Christoph, M.; Detlef, P.V. Climate change impacts on renewable energy supply. Nat. Clim. Chang. 2021, 11, 119–125. [Google Scholar]
- Atilhan, S.; Park, S.; El-Halwagi, M.M.; Atilhan, M.; Moore, M.; Nielsen, R.B. Green hydrogen as an alternative fuel for the shipping industry. Curr. Opin. Chem. Eng. 2021, 31, 100668. [Google Scholar] [CrossRef]
- Baker, J. DB Schenker Turns to Hapag-Lloyd for Emissions Reductions. 2023. Available online: https://lloydslist.maritimeintelligence.informa.com/LL1146186/DB-Schenker-turns-to-Hapag-Lloyd-for-emissions-reductions (accessed on 23 September 2023).
- DHL. Greener Inside: ‘Book and Claim’ Carbon Insetting for Your Supply Chain. 2021. Available online: https://www.dhl.com/global-en/home/our-divisions/global-forwarding/forwarding-insights/gogreen/greener-inside-bookandclaim-carbon-insetting.html (accessed on 15 September 2023).
- Maritime Book and Claim. Maritime Book and Claim—System Overview. 2023. Available online: https://cms.zerocarbonshipping.com/media/uploads/documents/Book-Claim-Methodology-Report.pdf (accessed on 15 September 2023).
- Enes Tunagur. Titan to Offer LNG-Based Carbon Insetting. 2023. Available online: https://lloydslist.maritimeintelligence.informa.com/LL1146352/Titan-to-offer-LNG-based-carbon-insetting (accessed on 15 September 2023).
- Book and Claim Transportation. Sustainability Made Easy? Advantages and Obstacles of Book and Claim in Transportation. 2023. Available online: https://shipzero.com/book-and-claim-in-transportation/ (accessed on 15 September 2023).
- Zhu, M.; Shen, S.; Shi, W. Carbon emission allowance allocation based on a bi-level multi-objective model in maritime shipping. Ocean. Coast. Manag. 2023, 241, 106665. [Google Scholar] [CrossRef]
- IMO. Fourth IMO Greenhouse Gas Study. 2020. Available online: https://www.imo.org/en/OurWork/Environment/Pages/Fourth-IMO-Greenhouse-GasStudy2020.aspx (accessed on 15 September 2023).
- Book and Claim. Book and Claim. 2023. Available online: https://www.dhl.com/global-en/delivered/sustainability/book-and-claim-explained.html (accessed on 15 September 2023).
- Marine. Marine Methanol Report Methanol Institute May 2023. 2023. Available online: https://www.methanol.org/wp-content/uploads/2023/05/Marine_Methanol_Report_Methanol_Institute_May_2023.pdf (accessed on 15 September 2023).
- Marine. Feature-Low-to-No-Carbon-Marine-Fuel-Costs-Still-a-Barrier. 2023. Available online: https://shipandbunker.com/news/world/707088-feature-low-to-no-carbon-marine-fuel-costs-still-a-barrier (accessed on 15 September 2023).
Disclaimer/Publisher’s Note: The statements, opinions and data contained in all publications are solely those of the individual author(s) and contributor(s) and not of MDPI and/or the editor(s). MDPI and/or the editor(s) disclaim responsibility for any injury to people or property resulting from any ideas, methods, instructions or products referred to in the content. |
© 2023 by the authors. Licensee MDPI, Basel, Switzerland. This article is an open access article distributed under the terms and conditions of the Creative Commons Attribution (CC BY) license (https://creativecommons.org/licenses/by/4.0/).