Abstract
Owing to changes in consumer attitudes, the beauty consumer population is growing rapidly and the demands of beauty consumers are variable. With a wide range of beauty products and exaggerated product promotions, consumers rely more on online reviews to perceive product information. In this paper, we propose a demand forecasting model that takes into account both product features and product emotional needs based on online reviews to help companies better develop production and sales plans. Firstly, a Word2vec model and sentiment analysis method based on a sentiment dictionary are used to extract product features and factors influencing product sentiment; secondly, a multivariate Support Vector Regression (SVR) demand prediction model is constructed and the model parameters are optimized using particle swarm optimization; and finally, an example analysis is conducted with beauty product Z. The results show that compared with the univariate SVR model and the multivariate SVR model with only product feature demand as the influencing factor, the multivariate SVR model with both product feature and product sentiment demand as influencing factors has a smaller prediction error, which can enable beauty retail enterprises to better grasp consumer demand dynamics, make flexible production and sales plans, and effectively reduce production costs.
MSC:
91B42; 91B74
1. Introduction
In recent years, relying on the deepening application of the mobile Internet, cloud computing, artificial intelligence, and other technologies, the e-commerce online retail market has flourished, becoming a new space for consumption growth and a new driving force for economic development. According to the data of China’s National Bureau of statistics, national online retail sales reached CNY 13.49 trillion in 2022, a year-on-year increase of 4%. In 2023, China’s online retail market continued to show a steady growth trend. Among them, new models, such as live e-commerce and community group purchasing, maintained double-digit growth. At the same time, social attributes are deeply embedded in the whole chain of consumer shopping, and consumers enjoy the happiness brought by social interaction through various links, such as obtaining information, making decisions, and sharing experiences. In addition to traditional physical stores, online sales platforms such as short videos, social media, and evaluation apps have become key shopping channels that affect consumer decisions.
While online retailers enjoy the operational dividends generated by high sales volumes and fast shipments, they also face the challenge of balancing the capacity of supply chain production and sales. Exponential increases in sales have been brought about by online promotions; however, the low stickiness, low loyalty, and flexible demand of the millennial generation have made it impossible for companies to accurately grasp consumer demand based on historical baselines alone. This makes it more difficult to develop production and sales plans. To this end, it is important for online retailers to find a demand forecasting method that can accurately and dynamically capture consumer demand [1].
The key to demand forecasting is to accurately grasp consumer demand. In online retail, consumer demand is contained within the online comments of various online platforms. On the one hand, online reviews are an open form of expression. The content of a review is the expression of the consumer’s perception of products and ancillary services, which can be derived from the comments of product consumers on a shopping platform or from the experience sharing of users on a social platform. Online reviews will form a word-of-mouth effect among consumers, which will affect the product demand of subsequent consumers [2]. On the other hand, in online shopping, consumers are more likely to obtain product information from online reviews [3], and product information largely influences consumers’ purchasing decisions [4]. Therefore, online reviews have become an important reference for online retailers to formulate production and sales plans and make supply decisions.
With rapid economic development, rising living standards, people’s pursuit of “beauty”, and changes in consumer attitudes, beauty consumer groups are becoming increasingly large and demand for beauty products continues to increase. As an important sales channel for beauty products, the e-commerce platform, with its large sales volumes and fast-changing user demands, requires the supply chain system of beauty online retail enterprises to have strong supply and demand forecasting capabilities and be able to make flexible production and sales plans. However, with a wide range of beauty products, fast product updates, and exaggerated product publicity, consumers are more likely to perceive product information from other consumers’ online reviews when choosing to buy beauty products. Therefore, it is important for beauty online retailers to tap into consumers’ concerns about their products based on online reviews in order to provide a basis for accurately forecasting of consumer demand.
At present, in consumer demand forecasting, scholars have used online comment data to assist in demand forecasting, such as adding consumer ratings, scores, and other factors to the forecasting models; however, most of the existing research objects are fresh products with short life cycles [2] and consumables represented by automobiles [5], while few people have studied beauty products. The sales trends of beauty products are irregular, nonseasonal, and more dependent on online word of mouth. The demand changes are more vulnerable to online reviews, so it is more suitable to use online reviews to support dynamic demand forecasting. We considered adding product perception information from consumers’ online reviews to study the problem of demand forecasting accuracy in e-tailing of beauty products.
The rest of the paper is arranged as follows. Section 2 reviews the research results on the problem of forecasting demand based on online reviews. Section 3 describes the research methods of this paper. Section 4 constructs a multivariate SVR demand forecasting model for beauty products based on online reviews. Section 5 takes beauty product Z as an example to test the prediction effect of the model. Section 6 describes the discussion of the research results, theoretical and managerial contributions, and research limitations. Finally, Section 7 summarizes the conclusions of this study and proposes future research directions.
2. Literature Review
After the concept of Web2.0 appeared in 2004, social media such as Facebook and B2B e-commerce platforms emerged and have become the mainstream platforms at present [6,7]. Large numbers of online reviews reflecting consumers’ opinions on products emerge endlessly. Online reviews are not only the most common expression of consumer product experience, but also the most widely disseminated form of user communication. At present, studies have confirmed that online reviews have a great impact on product sales, and some studies have found that sales prediction models considering online reviews have higher prediction accuracy.
Research on the impact of online reviews on product sales has focused on the unstructured content of online reviews (such as product features and product emotions) in recent years. Moses SJ et al. helped recommend products that consumers are more likely to repurchase by identifying product features in after-sales evaluations of groceries [8]. Yin H et al. confirmed that the richness of online reviews has a positive impact on sales [9]. Nikbin D et al. found that positive product reviews on Facebook could improve consumers’ trust in brands and products, enhance consumers’ purchase intentions, and then affect sales [10]. Hazar H et al. found that the influence of social media has brought more sales to enterprises, and information quality, credibility, and attractiveness (ATT) significantly affect customers’ purchase intention [11]. Choi J et al. analyzed customers’ purchase intentions based on the online reviews on an automotive online portal and found that this method could more easily predict automotive demand in the market [12]. Most of the existing relevant studies have reached the same conclusion that online reviews will affect product sales and found that the sales prediction models considering online reviews have better prediction accuracy.
Research on sales forecasting models considering the unstructured data characteristics of online reviews focuses on the possible impact of users’ expression of product features, product emotions, and other information on product sales in online reviews. Earlier, Dellarocas et al. introduced online product feature review indicators to study film sales prediction, which improved the prediction accuracy [13].
Subsequent studies have focused on the impact of consumers’ product emotions on sales forecasting. Chern et al. proposed an online sales prediction method based on word of mouth by analyzing online reviews. This method was especially suitable for products with rich online reviews, and the prediction result was better than most traditional time series prediction models [14]. Pai et al. and Ampountolas et al. showed that adding emotion factors to the social platform in the prediction model can improve the accuracy of prediction [15,16]. Ou-Yang C et al. analyzed the case of Taiwan automotive products and proposed a method that could improve the performance of sales forecasting using a CNN-LSTM (Convolutional Neural Networks-Long Short Term Memory) method based on online comment emotion data [5]. Ruiz-Mafe et al. found that online reviews with positive emotional tendencies were more beneficial to the improvement of enterprise sales [17].
We selected some typical existing studies, as shown in Table 1. We compared the research objects, influencing factors, prediction methods, and research purposes in the existing research, and found the following findings:

Table 1.
Comparison of Related Studies.
First, the purpose of existing research is mostly to express the relationship between online comment information and product sales and to predict customer content recommendations. Research on consumer demand prediction is rarely involved, and the change in sales volume determines the change in demand to a certain extent. For example, Iftikhar et al. predicted product demand based on historical sales data [6] and Viverit et al. predicted hotel demand based on historical reservation data [21]. Second, the existing research focuses on one aspect of product characteristics or emotion factors. For example, Fan et al. predicted product demand based on product emotion characteristics and historical sales data [22], while Ding Y et al. predicted automobile demand based on product emotion characteristics and historical sales data [23]. The existing research rarely considers the joint influence of both. Third, for the prediction method, the existing research uses multivariable SVR or SVR combined with optimization algorithm, such as Qu F et al., who used the Gray Wolf optimizer algorithm to optimize SVR in order to predict vehicle sales [24]. Fourth, from the perspective of research objects, there is more research on products with a long life cycles, such as cars [5] and notebook computers [18], and less research on beauty products with fast updates and iterations.
In summary, we will construct a multivariable demand forecasting model considering product characteristics and emotion factors at the same time, which is used to solve the problem of demand forecasting for beauty products in order to accurately predict product demand, thereby helping beauty online retail enterprises better understand consumer demand, adjust production strategies in a timely manner, and improve enterprise competitiveness.
3. Selection of Modeling Methods
In order to extract the consumer’s perceived factors (product feature factors and emotion factors) in online reviews and introduce them into the demand forecasting for beauty products, it is necessary to choose reasonable unstructured text data processing methods, online text emotion processing methods, and demand forecasting models. This paper selected the Word2vec model, an emotion dictionary, and multivariate SVR model in the process of constructing a demand forecasting model for beauty products.
3.1. Selection of Text Data Processing Methods
Traditional data processing methods cannot meet the processing requirements of a large amount of online comment text data. In order to accurately extract the product features perceived by consumers from online comments, it is necessary to find a more appropriate processing method for unstructured text data. Common methods for processing large amounts of unstructured text data include K-means clustering, the Word2vec model, Latent Dirichlet Allocation (LDA), etc. [25,26,27]. Although K-means clustering is simple in principle and easy to implement, it has high requirements for data samples, is sensitive to noise and outliers, and is prone to local optimization. LDA is a typical bag of words model, which believes that there is no order and order relationship between words. The Word2vec model does not have strict sample data requirements. It can combine the context of words, understand the semantic and grammatical information in the text, better fit the characteristics of online comment text, and more comprehensively obtain the characteristic words of products. Compared with other methods, it has better performance [28].
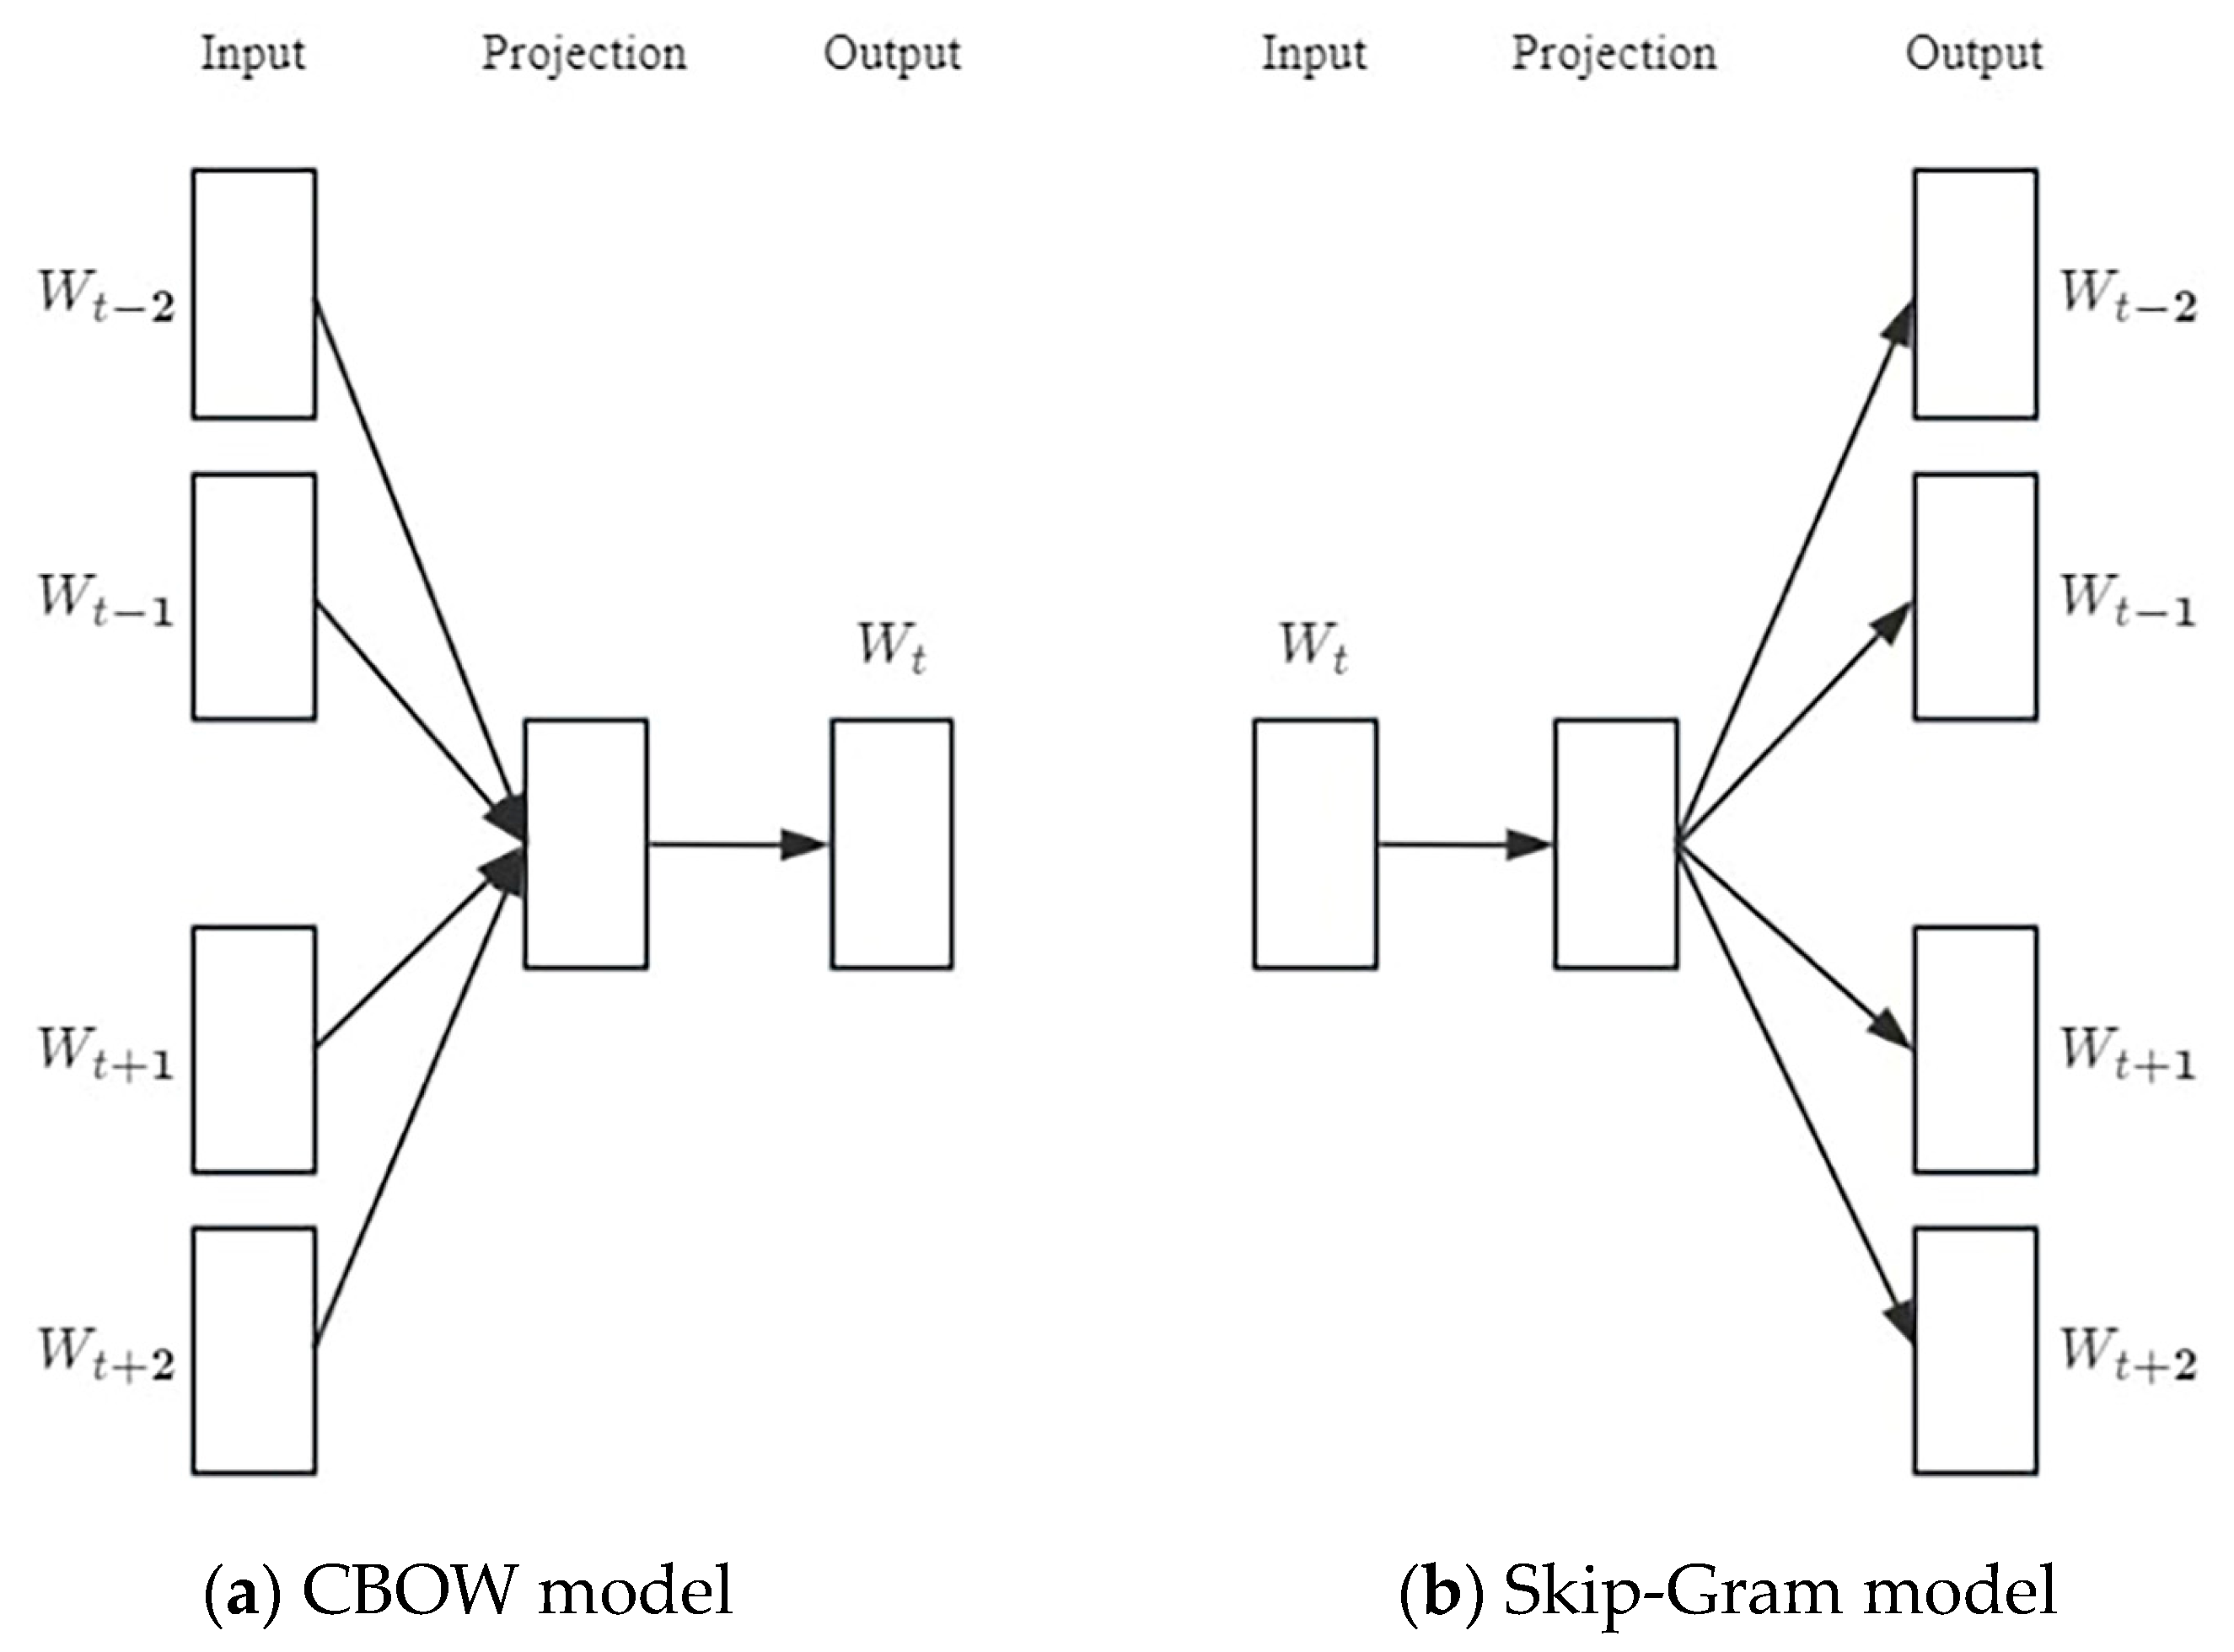
Word2vec is a model for efficiently training word vectors, which is based on the principle that two words with similar contexts should have similar word vectors [2,29]. To be precise, Word2vec is a way of encoding words one by one into vectors that reflect the relationships between them. This model mainly includes two models: the skip-gram model and the Continuous Bag of Words model (CBOW), as shown in Figure 1. The two models have the same model framework, with differences between the input and output, as shown in Figure 1. The CBOW model predicts the target word Wt in the middle through the content of the context (Wt−2, Wt−1, Wt+1, Wt+2), which makes it faster to train the word vectors. On the contrary, the skip-gram model predicts the words of its context through the target word Wt, which is slower to train, but the training effect is better than that achieved by the CBOW model [30]. In order to create a prediction model with better results, the skip-gram model was used to extract the product feature factors.

Figure 1.
Schematic sketch of CBOW and skip-gram models. Wt is the target word; Wt−1, Wt−2, Wt+1, and Wt+2 are the adjacent words of the target word, respectively.
3.2. Selection of Sentiment Analysis Tools
Sentiment analysis is used to identify the sentiment tendency of the comment text, that is, positive, negative, and neutral, so as to determine people’s attitudes towards people or things and find potential problems for improvement or prediction. At present, sentiment analysis methods include sentiment analysis based on sentiment lexicon and sentiment analysis based on supervised or semi-supervised learning. The sentiment analysis method based on an emotion dictionary is widely used and the analysis results are accurate [31], which is suitable for sentiment analysis of online reviews of beauty products.
Sentiment analysis based on a sentiment lexicon uses a pre-defined sentiment lexicon to give each word a certain sentiment tendency weight, then extracts all of the sentiment words from the text, calculates the sentiment value according to the sentence features (rhetorical questions, interrogative sentences, etc.), and judges the sentiment tendency of the text based on the sentiment value. The first task of this method is to judge whether the words are positive, negative, or neutral, and then construct a sentiment lexicon. The most common basic sentiment lexicons are the HowNet sentiment lexicon, National Taiwan University Sentiment Dictionary (NTUSD), and Li Jun Chinese Commendatory and Derogatory Dictionary of Tsinghua University. Online reviews are mostly the expression of consumers’ overall emotional tendencies towards a product. The positive and negative evaluation words provided by the HowNet sentiment lexicon are suitable as the basic dictionary of product evaluation.
3.3. Selection of Demand Forecasting Models
Demand forecasting models mostly apply the principle of regression analysis. The commonly used models are Support Vector Regression (SVR), Random Forest algorithm, Long Short Term Memory (LSTM), etc. The data of beauty products are nonlinear and diversified, which requires a strong nonlinear data processing ability in a demand forecasting model. SVR is a regression algorithm based on Support Vector Machine (SVM), which is more powerful in solving nonlinear data [32,33]. SVR not only considers the degree of data fitting but also considers the generalization of the model, which effectively solves the problem of model redundancy. At the same time, it has good accuracy in small sample demand forecasting [34] and can handle complex product characteristic and emotion data. Therefore, SVR was selected as the demand forecasting method.
As a branch of SVM, SVR is a powerful regression algorithm, especially in solving nonlinear regression problems. Its core is support vector and hyperplane, which can be regressed by finding the optimal hyperplane. Its optimization objective function is expressed as follows:
Among them, C is the penalty factor, and the penalty of error classification increases with an increase in C; is the input variable of the model; is the corresponding predicted value; w is the coefficient of in ; represents the loss function, which allows the sample points to exist outside of the hyperplane, but ensures that the value is as small as possible; is the sample points on the hyperplane; and ζ represents the relaxation variable, which represents the positional relationship between the sample point and the hyperplane. When solving the objective function, Lagrange dual transformation is usually required. The transformation formula is as follows:
where , denotes the Lagrange coefficient. In general, the input variables of a univariate SVR prediction model only rely on p time series data to predict the value of a certain time point in the future. At this time, there is a functional relationship between and the values at the previous time points. The expression of the functional relationship is as follows:
When solving nonlinear problems, SVR needs to introduce kernel functions to convert nonlinear data into linear data for regression analysis. Common SVR kernel functions include the Radial Basis Kernel function (RBF), gaussian function, polynomial kernel function, and so on.
4. Construction of a Multivariate SVR Demand Forecasting Model for Beauty Products Based on Online Reviews
In order to better predict demand changes for beauty products, the product feature factors and emotion factors of consumer perception in online reviews were introduced into the SVR model as variables, and a multivariable SVR demand prediction model was constructed.
4.1. Extraction of Factors Influencing Beauty Product Demand
4.1.1. Product Feature Factor Extraction
Using the text information processing model Word2vec, the feature factors of beauty products were extracted from the online comments on the product sales platform. The steps are as follows:
- Step 1: Central feature word extraction. Based on the statistics of word frequency and part of speech in online reviews, combined with analysis of the literature product characteristics, high-frequency words are selected as the central feature words of product characteristics.
- Step 2: Word2vec model training. Setting the Word2vec model parameters for model training.
- Step 3: Product feature factor extraction. According to the central feature words, the Word2vec model is used to cluster words many times, and words with high similarity are selected to form a feature thesaurus. Finally, the product feature factors of beauty product demand prediction are formed.
4.1.2. Product Emotion Factor Extraction
The sentiment lexicon was used to carry out the emotional tendency analysis of consumers’ overall perceptions of a product, so as to extract the product emotion influencing factors for beauty products. The specific steps are as follows:
- Step 1: Text data preprocessing. Add network hot words and beauty-related words in the word division tool, and carry out word division and lexical pre-labeling.
- Step 2: Construct an emotion dictionary. On the basis of the positive and negative evaluation words in the HowNet sentiment dictionary, combine the actual content of the text data to construct a sentiment lexicon in line with beauty products.
- Step 3: Sentiment value calculation rules. If the emotion value is positive, the larger the emotion, the more positive, and if the emotion value is negative, the larger the emotion, the more negative. The specific calculation rules are shown in Table 2.
Table 2. Sentiment value calculation rules.
- Step 4: Product sentiment factor construction. Each comment is aggregated by date, and the average of the sentiment value of each comment in each time is calculated, and the average of the sentiment values constitute the product sentiment influencing factors in the demand forecasting for beauty products.
4.2. Normalization of Factors Influencing Demand Forecasting for Beauty Products
The result obtained by Word2vec model training was the product feature thesaurus, which was composed of a large number of words as textual factors, while the prediction model needed to input numerical factors to run better, so the training results needed to be transformed into numerical factors. The Word2vec model was used to cluster the comments containing the product feature factors. Each feature word obtained by clustering reflected the consumers’ perception of a product feature. On this basis, the numerical conversion of text factors was realized. Assuming that the influencing factor of product characteristics formed by online comment data after clustering was (i = 1, 2, …, n), when a comment text contained words similar to factor , the comment text could be classified as , so as to obtain the number of comment texts contained in each factor and realize the quantification of text factors.
The emotion factors obtained from the emotion analysis based on the sentiment lexicon were composed of the average of the emotion values of each comment containing the overall emotional tendency of consumers toward the product in each time, so the value of the emotion factors was a set of time series data. It was assumed that emotion factors were of (i = n + 1) type.
In order to eliminate the influence of dimension on the prediction results, it was necessary to normalize all of the data and limit the data to a certain range using Z-score normalization. The calculation formula is as follows:
where denotes the factor of category i at the moment t (t = 1, 2, …, T), is the mean of the original data, and σ is the variance of the original data.
4.3. Multivariate SVR Demand Forecasting Model Construction
The multivariable SVR demand forecasting model for beauty products involved the input variables of daily sales volume time series data and the influencing factors of product demand. In this case, the demand was expressed by the relationship between T and multiple input variables as follows:
where denotes the daily sales on day t, denotes the nth type of product demand influencing factor variable on day t, and denotes the product demand on day t.
When constructing the SVR prediction model, the RBF kernel function was selected for approximate linear regression transformation. Because the RBF function can map feature space to infinite dimensions and has relatively few parameters, it is easy to calculate, so it was selected as the kernel function. With the help of the Lagrange dual transformation method, the transformed optimization objective function formula is expressed as:
where denotes the RBF function.
Finally, by inputting all of the influencing factors into the prediction model, the future demand for beauty products could be predicted.
4.4. Particle Swarm Optimization to Optimize SVR Model Parameters
The penalty factor C and insensitive loss function ε are important parameters that will have an impact on the prediction accuracy of the SVR model. The C value represents the fitting degree of the curve. If it is too large, it will be overfitted, and if it is too small, it will be underfitted. ε values represent the distribution of data in the new feature space. The larger the value, the less the support vector data, and vice versa. In order to quickly find the appropriate C and ε values, it was decided to introduce Particle Swarm Optimization (PSO) to optimize the model parameters. The specific process is as follows:
- Population initialization. Set the basic parameters such as iteration number, population size, learning silver, inertia segment, etc.
- Select R2 as the fitness function and calculate the function value.
- The individual and global optimal solutions of particles are calculated based on fitness function, and compared with historical values to update the speed and position of particles in the population.
- Judge whether the termination condition is satisfied; if yes, stop iterating, if not, keep updating the particle velocity and position until the termination condition is satisfied.
5. Example Analysis
In order to verify the accuracy of the multivariate SVR demand forecasting model for beauty products based on online reviews, a well-known brand of lipstick product on Taobao.com was selected as the object of the empirical research for model Z. Relevant product review data on Taobao.com and in the popular life-sharing platform Little Red Book (RED) were selected as the extracted samples for the product feature factors and product emotion factors, respectively.
5.1. Data Acquisition and Preprocessing
Octopus Collector [35] was utilized to collect the comment data for the product on the two platforms from 27 October 2022 to 28 February 2023, for a total of 125 days. The number of comments collected was 9847 and 9139, respectively. The collected review data were consumers’ random expressions of their subjective feelings, in which there was some useless non-text information (such as emoticons and useless symbols) and also some super-short text that was not related to the topic, so it was necessary to clean the review data beforehand to remove the irrelevant text data. After cleaning, the comment data were subjected to the operations of word splitting and deactivation to finally obtain the text corpus that could be analyzed. In addition, in this paper, the daily sales of beauty product Z was selected as the consumers’ daily demand, and daily sales of this product in the time period of 27 October 2022 to 28 February 2023 were collected to form a historical demand dataset.
5.2. Extraction of Factors Influencing Beauty Product Z Demand
5.2.1. Product Feature Factor Extraction
First, we initially observed the collected online reviews and found that the attributes of beauty products that were repeatedly mentioned in a large number of reviews were color code, packaging, logistics, etc. These product attributes were mostly expressed with nouns, noun phrases, and verbs, so we determined that the candidate ranges of the central feature words of the feature factors of beauty products were nouns, noun phrases, and verbs. Then, we counted the occurrences of different nouns, nominal phrases, and verbs in the online comments, and found the top 100 words from high to low according to occurrence to form a candidate feature thesaurus for beauty products. Finally, the word bank could not avoid the occurrence of words with similar meanings, so synonyms were manually screened and merged. After the above process, three types of central feature words for beauty products were obtained, which were “color”, “effect”, and “logistics.” These three central feature words were inputted into the Word2vec model, respectively, and the collection of words similar to the central feature words was obtained by calculation. Taking “effect” as an example, the top 20 word sets in similarity ranking are shown in Table 3.
Table 3.
The set of semantically related feature words for “effect” and their similarity to the central feature word.
By repeating the above process, it was found that the characteristics on which the consumers focused for beauty product Z were color (x1), effect (x2), and logistics (x3). The dataset of three influencing factors could be obtained by classifying the online comment text data according to the three feature word sets.
5.2.2. Product Emotion Factor Extraction
We constructed a sentiment lexicon that matched the actual product and a sentiment lexicon that contained internet buzzwords and beauty-specific terms from online review data. Human emotional tendencies are generally divided into three categories, positive, neutral, and negative, and there are also differences in the intensity of emotions. Therefore, we classified the emotional tendency of the words in the sentiment lexicon, and set the emotional intensity represented by different degree adverbs according to the Chinese language habit of “degree adverbs modify emotional intensity.” We set the values of emotional intensity corresponding to different degrees, as shown in Table 4.
Table 4.
Intensity values corresponding to different levels of words.
According to the rules for calculating emotion value, we retrieved the text content of each comment and calculated the emotion value one by one, categorized the comments according to the time, obtained the set of emotion values at the daily time point, and calculated the average value of the emotion values on a single day to form the time series data, thus completing the extraction of product emotional factors (x4).
5.2.3. Product Emotion Factor Extraction
After the extraction process of the above influencing factors, we determined four influencing factors of the demand for beauty product Z, which were color (x1), effect (x2), logistics (x3), and emotion (x4). The changes in these four factors over time would change the demand for beauty product Z over time. We sorted out the values of these four influencing factors at different time points, and some influencing factor data are shown in Table 5.
Table 5.
Selected data on influencing factors for beauty product Z.
5.3. Analysis of Model Run Results
After Section 5.1 and Section 5.2, the datasets of product feature factors and product emotion factors were obtained. In order to eliminate the influence of dimension on the prediction results, Z-score processing was applied to each dataset using Equation (4), which was used as the input variable of the model.
A total of 105 days of predicted influencing factors and corresponding historical demand data from 27 October 2022 to 8 February 2023 were selected as the training samples, and the optimal parameters of the model were solved to establish the demand prediction model. A total of 20 days of predicted influencing factors and corresponding historical demand data from 9 February 2023 to 8 February 2023 were selected as the test samples to test the accuracy of the model in predicting product demand. The SVR prediction model was built using MATLAB.2022b software to make predictions.
- Training data prediction results
Running the model based on the training sample data, the fitting plots of the prediction results of univariate SVR and multivariate SVR were obtained, as shown in Figure 2, Figure 3 and Figure 4.

Figure 2.
Univariate SVR training data prediction results fitting plot.
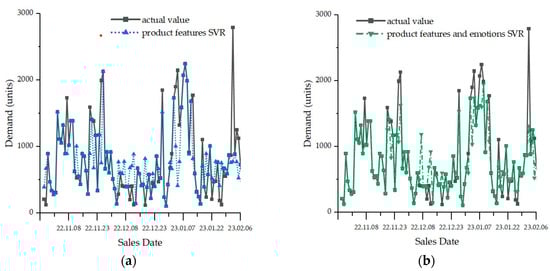
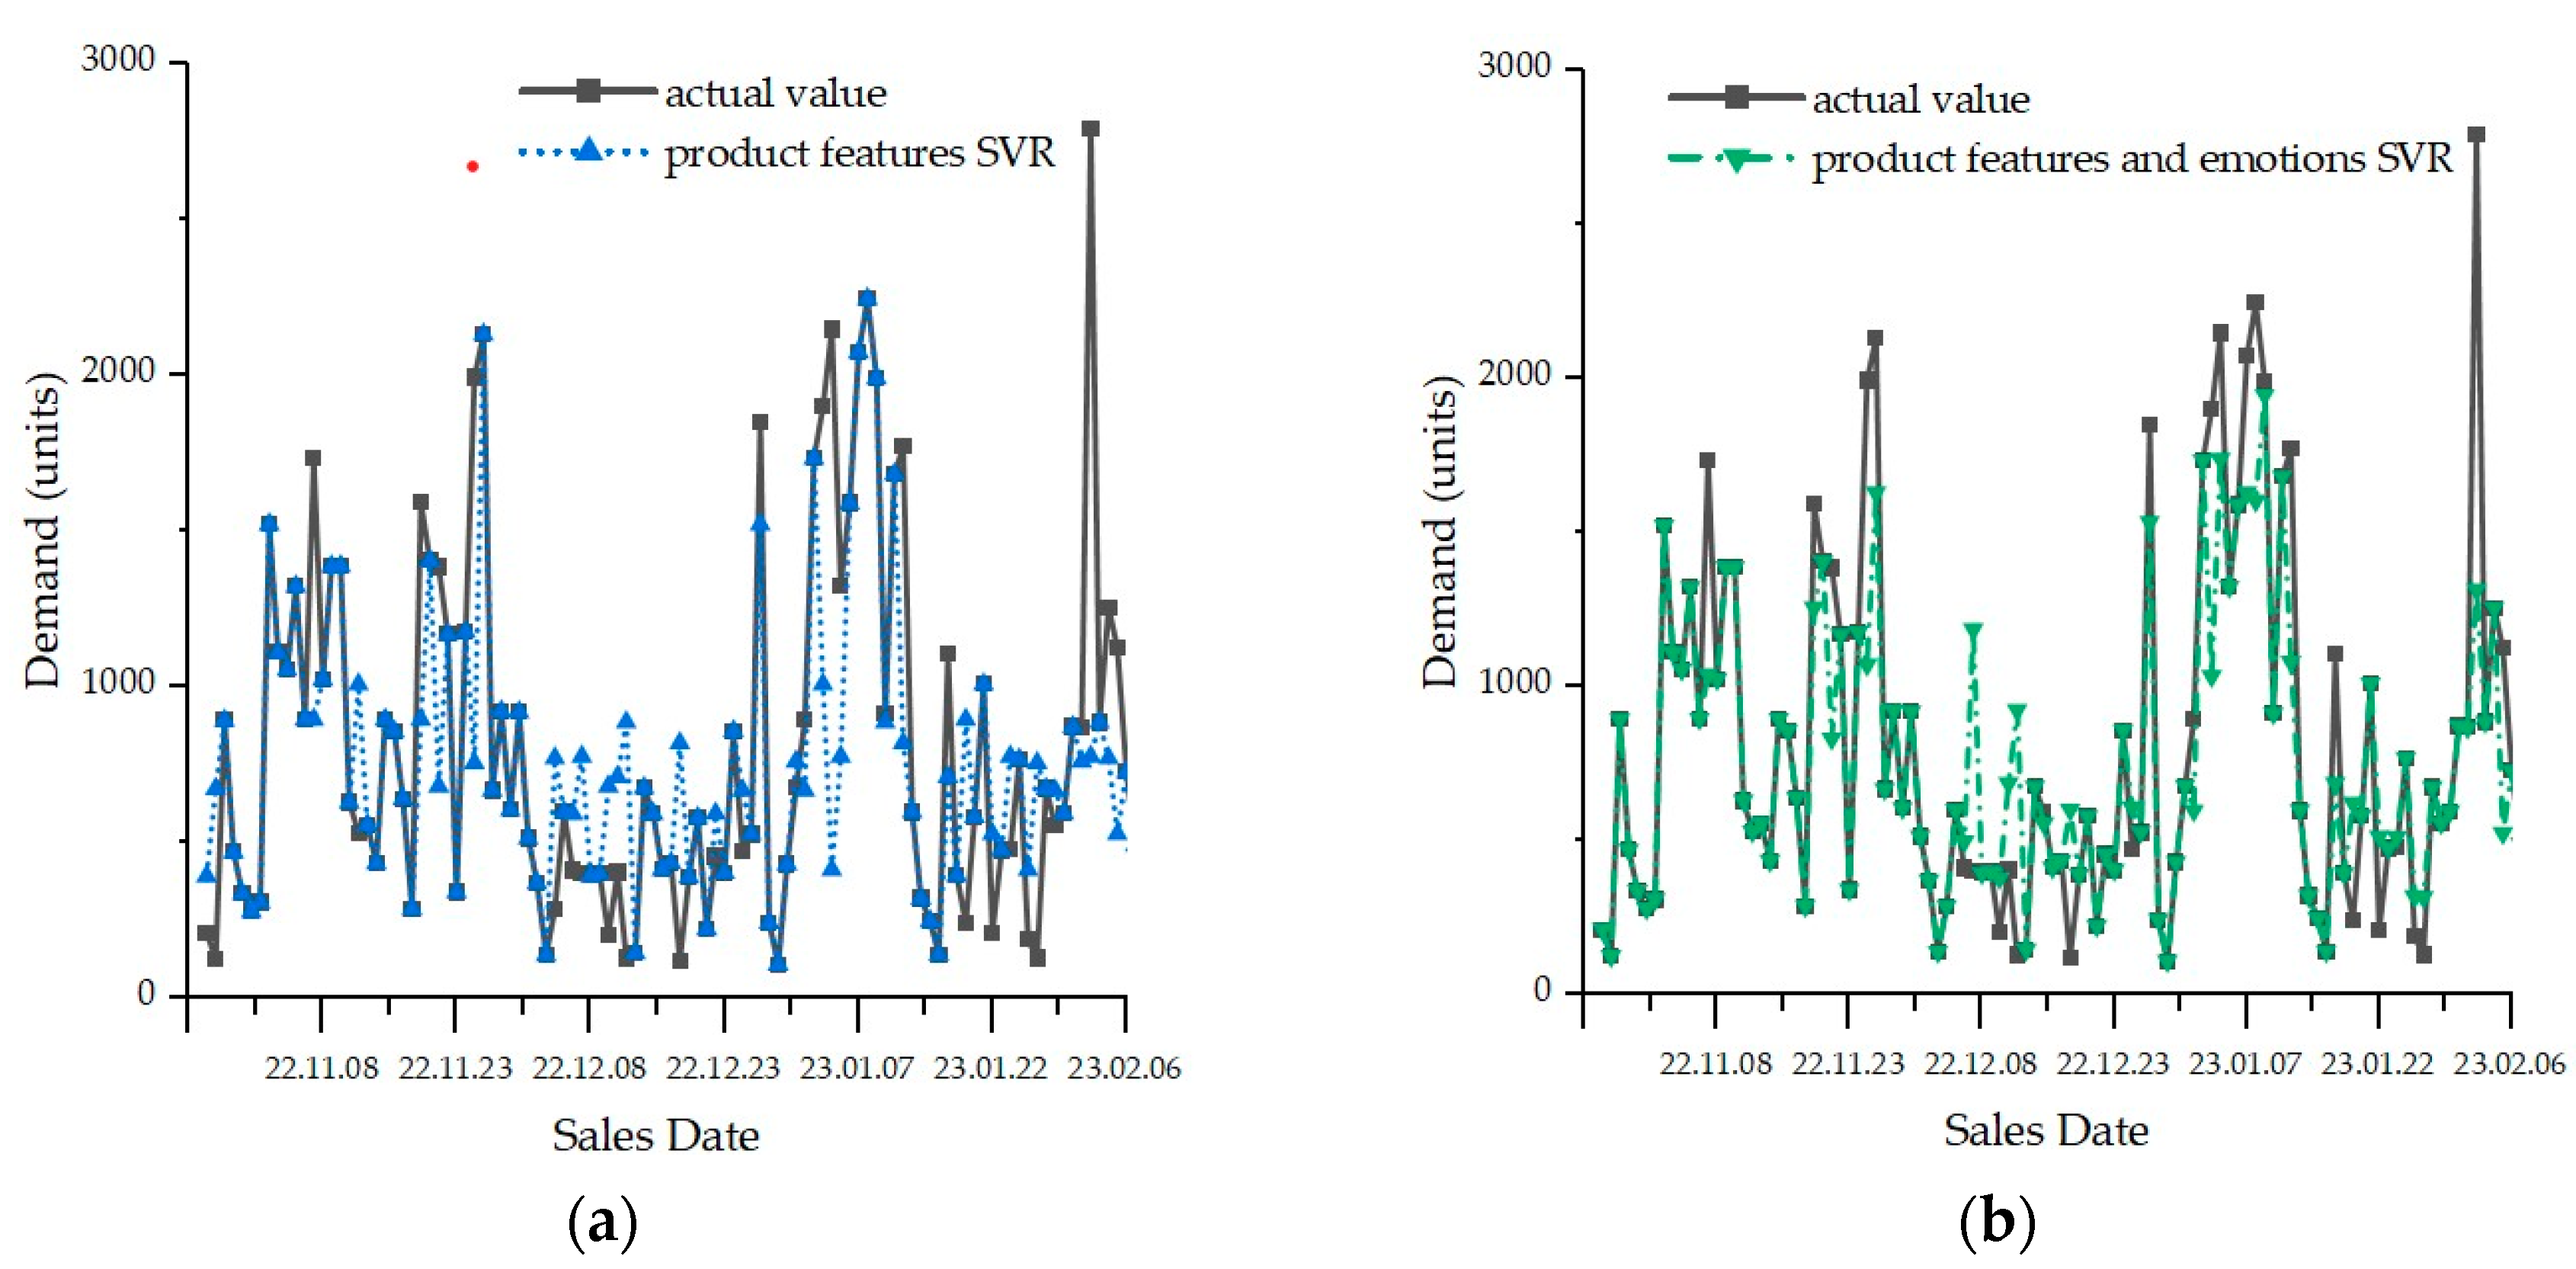
Figure 3.
Multivariate SVR training data prediction results fitting plot. (a) Incorporating only product feature influences. (b) Incorporating both product feature and product emotion influences.
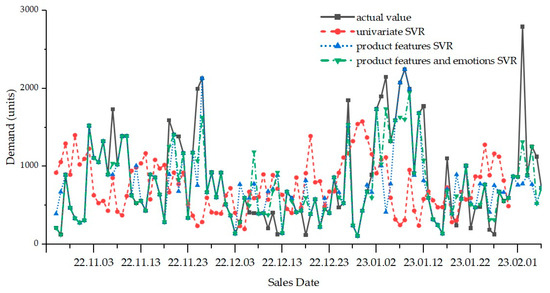
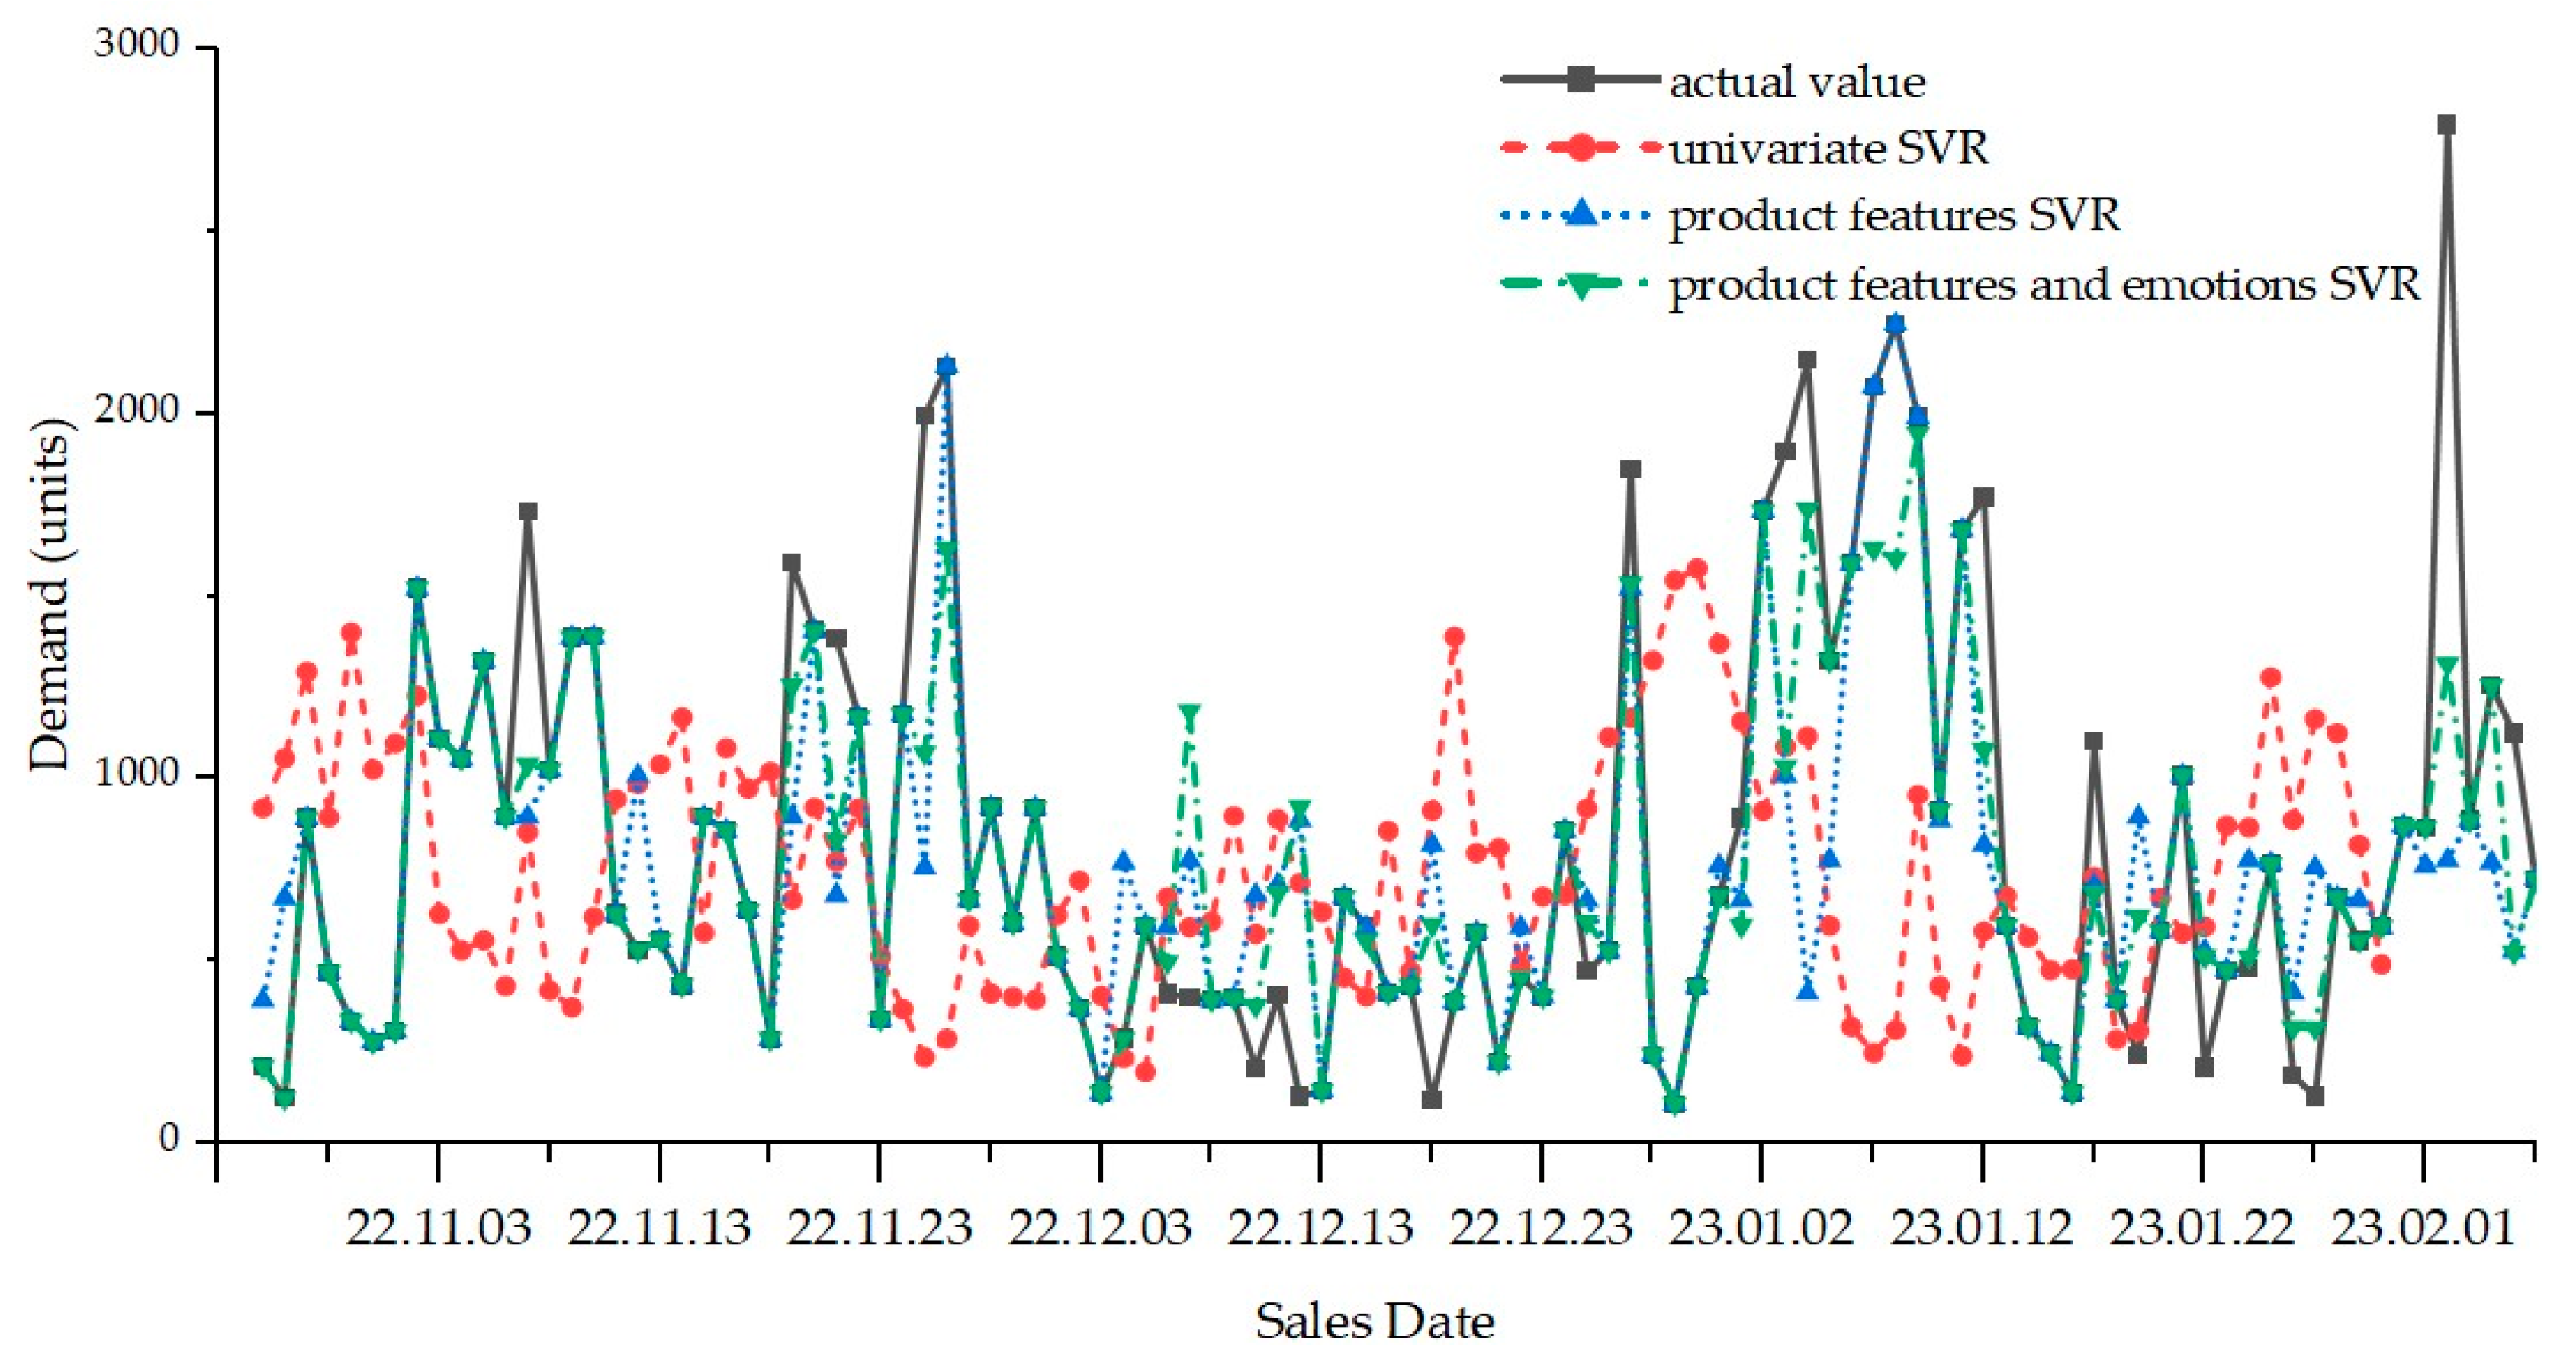
Figure 4.
Comparison of the fit of the training data prediction results.
As shown in the prediction fitting results in Figure 2, the prediction effect of the univariate SVR model was not ideal, the accuracy was not high, and the prediction deviation for extreme values was large. As shown in the prediction fitting results in Figure 3, the prediction results of the multivariable SVR model with only product characteristic factors fitted well with the real value and the fluctuation of the prediction value curve eased, but the deviation of extreme value prediction was not effectively solved. At the same time, the prediction results of the multivariate SVR model with product characteristics and product emotion factors basically coincided with the real value, and the deviation of extreme value prediction results from the real value was acceptable.
In Figure 4, the fitting of the predicted value curve and the real value of the three models are compared. The prediction fitting degree of the multivariable SVR model with product feature factors and product emotion factors was significantly better than that of the other two models, and the extreme value prediction result was also better than that of other models. Therefore, the multivariable SVR model established in this study with product characteristics and product emotion factors at the same time had better prediction ability. When predicting consumer demand, enterprises can take into account the product emotion factors of online reviews, which can be more in line with the actual needs of consumers, allowing them to make better production plans.
- 2.
- Test data prediction results
According to the prediction model parameters set in the training process, the multivariate SVR model adding product features and product emotion as influencing factors was established to predict the demand for beauty product Z based on the text data. The fitting chart of the prediction results is shown in Figure 5.
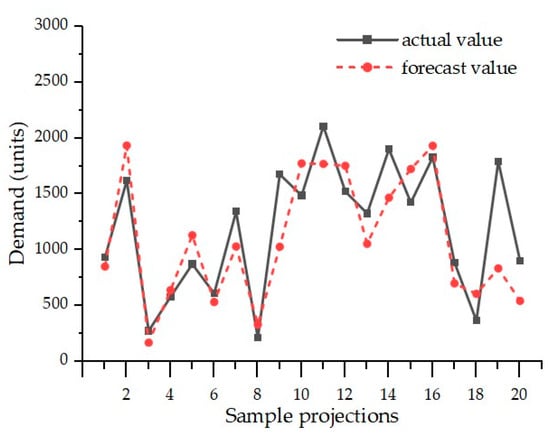
Figure 5.
Fitted plot of predicted results from beauty product test data.
In order to further illustrate the accuracy of the three models, the mean square error (MSE), mean absolute error (MAE), and determination coefficient (R2) of the demand forecasting values of the three models were calculated, respectively. The smaller the MSE and MAE, the greater the R2, indicating that the forecasting results were more accurate. The calculation results of MSE, MAE, and R2 of the three models are shown in Table 6.
Table 6.
Errors in demand forecasting for beauty products.
6. Discussion
6.1. Discussion about Research
Comparing the data in Table 6, we found that the multivariate SVR model with both product characteristics and product emotion as influencing factors had smaller MSE and MAE values and a larger R2 value. It was further established that the multivariate SVR model with the addition of product features and product emotion as influencing factors had better demand prediction errors than the other two models and higher prediction accuracy. Therefore, the multivariate SVR demand prediction model with the addition of product features and product emotion as influencing factors could better predict product demand in actual production operations. In other words, it was possible to improve demand prediction accuracy by extracting consumers’ product perception information from online reviews posted before and after purchase. From the results, it can also be found that the forecasting method could be applied to beauty products, adding a new application object to forecasting research.
6.2. Theoretical and Managerial Contributions
Our research has some theoretical contributions. We added the idea of prediction influence factor extraction; we extracted product feature factors and product emotion factors from shopping platforms and social platforms, respectively; and we considered the influence of adding both factors on prediction at the same time. This provides an idea for future prediction studies. We also extended the product object of prediction research to study beauty products, which are updated and iterated more quickly. This serves as a reference for subsequent studies to continue to expand the scope of demand forecasting research.
Our research also makes some contributions to management. Our research can help online retail enterprises better understand the needs of consumers. It can help enterprises understand the development trends of the future market, so as to better plan and adjust production and operation strategies.
First, it can help enterprises to make more accurate sales forecasts, as demand forecasting can help enterprises predict sales more accurately. Through the prediction of future demand, enterprises can better plan production and sales strategies, so as to improve sales performance and market share.
Second, it can help enterprises to formulate product strategies. For product development teams, understanding market demand and predicting future trends can help them formulate more effective product strategies. For example, if the forecast shows that sales of a product will increase significantly in the next few months, the enterprise may decide to increase investment and development of the product. Our research can help enterprises to predict consumer demand.
Third, it can help enterprises to adjust production and inventory management strategies, as demand forecasting can also help enterprises manage production and inventory more effectively. For example, if our research predicts that demand for a product will drop significantly in the next few weeks, the enterprise may choose to reduce production or adjust inventory management strategies to avoid overstocking.
Fourth, it can help enterprises to make better financial decisions, as our research can help enterprises understand market demand, predict future trends, and make better financial decisions. For example, if the forecast shows that sales will increase significantly in the coming months, the enterprise may choose to increase loans to expand production scale.
In short, demand forecasting is a very important part of business activities. Our research can help enterprises better grasp market opportunities, improve operational efficiency, and make more accurate sales plans to help enterprises develop.
6.3. Limitations
It is inevitable that our study has some limitations. On the one hand, it is possible that the best prediction method in this study is not a multivariable SVR prediction model. Multivariate SVR prediction models may be subject to the overfitting phenomenon in the prediction process, which makes the prediction result too ideal. On the other hand, the determination process of influencing factors in this study depended on some subjective steps, which will affect the prediction accuracy. The quality and quantity of online reviews may also have an impact on prediction accuracy. In addition, we encountered great difficulties in obtaining data. Most enterprises refuse to provide sales data, and online comments cannot be obtained and disclosed due to the privacy of platform users.
7. Conclusions
According to differences in online comments to which consumers pay attention on different platforms, the study combines text analysis technology with a demand forecasting model to establish a multivariable SVR demand forecasting model incorporating product characteristics and product emotion factors at the same time. This is a supply chain forecasting method centered on consumer demand, which can provide a method for online retail enterprises to better grasp the dynamics of consumer demand, make flexible and predictable production and marketing plans, arrange inventory more reasonably, and effectively reduce production costs. The following conclusions were obtained in this study.
- Compared with durable goods with long life cycles and less frequent replacement (such as mobile phones, cars, etc.), beauty products are easily affected by user experience, word of mouth, and media publicity, and they also have good performance in demand forecasting through online reviews, which can well fit changes in market demand.
- From the perspective of extracting the influencing factors for sales forecasting models, compared with the single variable sales forecasting model and the multivariate sales forecasting model considering either product characteristics or product emotion factors, the demand forecasting model based on the targeted extraction of product characteristics and product emotion factors from the online reviews on shopping platforms and “planting grass” platforms had a better forecasting effect.
- Through the case analysis of beauty product Z, it was found that the multivariable SVR sales prediction model for beauty products constructed in this study could effectively predict the demand for beauty products, but the prediction model constructed with SVR had high requirements on data and certain restrictions.
In summary, the demand forecasting method proposed in this study is very important for online retail enterprises. It can help enterprises better understand customers, improve sales and customer satisfaction, optimize production and supply chain strategies, and make better decisions.
At the same time, we hope that future research can find more objective factor extraction methods and select better models. Future research can try to find models or methods for predicting performance and also focus on solving the problem of product content recommendation prediction.
Author Contributions
Conceptualization, Y.W. and Y.Z.; methodology, Y.Z.; software, Y.Z.; validation, Y.W.; formal analysis, Y.Z.; investigation, Y.Z.; resources, Y.Z.; data curation, Y.Z.; writing—original draft preparation, Y.Z. and Y.W.; writing—review and editing, Y.Z. and Y.W.; visualization, Y.Z.; supervision, Y.W.; project administration, Y.W.; funding acquisition, Y.Z. All authors have read and agreed to the published version of the manuscript.
Funding
This research received no external funding.
Data Availability Statement
The data presented in this study are available upon request from the corresponding author. The data are not publicly available due to the privacy of users of the design software.
Conflicts of Interest
The authors declare no conflict of interest.
References
- Guven, I.; Simsir, F. Demand forecasting with color parameter in retail apparel industry using artificial neural networks (ANN) and support vector machines (SVM) methods. Comput. Ind. Eng. 2020, 147, 106678. [Google Scholar] [CrossRef]
- Zhang, Y.L.; Dai, P.P. Multi-variable SVR demand forecast model for fresh products: Factor extraction of customer perception based on online reviews. J. China Agric. Univ. 2022, 27, 275–282. [Google Scholar]
- Beak, H.; Ahn, J.H.; Choi, Y. Helpfulness of Online Consumer Reviews: Readers’ Objectives and Review Cues. Int. J. Electron. Commer. 2012, 17, 99–126. [Google Scholar] [CrossRef]
- Chen, T.; Samaranayake, P.; Cen, X.Y.; Qi, M.; Lan, Y.C. The Impact of Online Reviews on Consumers’ Purchasing Decisions. Evid. Eye-Track. Study 2022, 13, 865702. [Google Scholar]
- Ou-Yang, C.; Chou, S.C.; Juan, Y.C. Improving the Forecasting Performance of Taiwan Car Sales Movement Direction Using Online Sentiment Data and CNN-LSTM Model. Appl. Sci. 2022, 12, 1550. [Google Scholar] [CrossRef]
- Zhang, T.; Zhao, K.; Zhu, Z. A Study on the Trend of Web2.0 Research. Adv. Intell. Syst. Res. 2010, 14, 467–473. [Google Scholar]
- Iftikhar, R.; Khan, M.S. Social Media Big Data Analytics for Demand Forecasting: Development and Case Implementation of an Innovative Framework. J. Glob. Inf. Manag. 2019, 28, 103–120. [Google Scholar] [CrossRef]
- Moses, S.J.; Babu, L. Buyagain Grocery Recommender Algorithm for Online Shopping of Grocery and Gourmet Foods. Int. J. Web Serv. Res. 2018, 15, 1–17. [Google Scholar] [CrossRef]
- Yin, H.; Zheng, S.; Yeoh, W.; Ren, J. How online review richness impacts sales: An attribute substitution perspective. J. Assoc. Inf. Sci. Technol. 2021, 2, 901–917. [Google Scholar] [CrossRef]
- Nikbin, D.; Aramo, T.; Iranmanesh, M.; Ghobakhloo, M. Impact of brands’ Facebook page characteristics and followers’ comments on trust building and purchase intention: Alternative attractiveness as moderator. J. Consum. Behav. 2022, 3, 494–508. [Google Scholar] [CrossRef]
- Hmoud, H.; Nofal, M.; Yaseen, H.; Al-Masaeed, S.; Al Fawwaz, B. The effects of social media attributes on customer purchase intention: The mediation role of brand attitude. Int. J. Data Netw. Sci. 2022, 6, 1543–1556. [Google Scholar] [CrossRef]
- Choi, J.; Lee, H.J.; Choeh, J.Y. Harnessing the Predictive Value of Online Word-of-Mouth for Identifying Market Success of New Automobiles: Input Versus Output Word-of-Mouth Perspectives. EM Ekon. A Manag. 2022, 25, 183–201. [Google Scholar] [CrossRef]
- Dellarocas, C.; Awad, N.F.; Xiao, Q. Exploring the Value of Online Product Ratings in Revenue Forecasting: The Case of Motion Pictures. J. Interact. Mark. 2007, 9, 23–45. [Google Scholar] [CrossRef]
- Chern, C.-C.; Wei, C.-P.; Shen, F.-Y.; Fan, Y.-N. A sales forecasting model for consumer products based on the influence of online word-of-mouth. Inf. Syst. E-Bus. Manag. 2015, 13, 445–473. [Google Scholar] [CrossRef]
- Pai, P.E.; Liu, C.H. Predicting Vehicle Sales by Sentiment Analysis of Twitter Data and Stock Market Values. IEEE Access 2018, 6, 57655–57662. [Google Scholar] [CrossRef]
- Ampountoals, A.; Legg, M.P. A segmented machine learning modeling approach of social media for predicting occupancy. Int. J. Contemp. Hosp. Manag. 2021; ahead-of-print. [Google Scholar]
- Ruiz-Mafe, C.; Enrique, B.A.; Rafael, C.P. The effect of emotions, eWOM quality and online review sequence on consumer intention to follow advice obtained from digital services. J. Serv. Manag. 2020, 31, 465–487. [Google Scholar] [CrossRef]
- Chen, M.F.; Wu, W.C.; Zhang, Y.G.; Zhou, Z. Combining Adversarial Training and Relational Graph Attention Network for Aspect-Based Sentiment Analysis with BERT. In Proceedings of the 2021 14th International Congress on Image and Signal Processing, BioMedical Engineering and Informatics (CISP-BMEI), Shanghai, China, 23–25 October 2021; pp. 1–6. [Google Scholar]
- Jain, P.K.; Patel, A.; Kumari, S.; Pamula, R. Predicting airline customers’ recommendations using qualitative and quantitative contents of online reviews. Multimed. Tools Appl. 2022, 81, 6979–6994. [Google Scholar] [CrossRef]
- Jain, P.K.; Yekun, E.A.; Pamula, R.; Srivastava, G. Consumer recommendation prediction in online reviews using Cuckoo optimized machine learning models. Comput. Electr. Eng. 2021, 95, 107397. [Google Scholar] [CrossRef]
- Viverit, L.; Heo, C.Y.; Pereira, L.N.; Tiana, G. Application of machine learning to cluster hotel booking curves for hotel demand forecasting. Int. J. Hosp. Manag. 2023, 111, 103455. [Google Scholar] [CrossRef]
- Fan, Z.-P.; Che, Y.-J.; Chen, Z.-Y. Product sales forecasting using online reviews and historical sales data: A method combining the Bass model and sentiment analysis. J. Bus. Res. 2017, 72, 90–100. [Google Scholar] [CrossRef]
- Ding, Y.; Wu, P.; Zhao, J.; Zhou, L. Forecasting product sales using text mining: A case study in new energy vehicle. Electron. Commer. Res. 2023, 3, 1–33. [Google Scholar]
- Qu, F.; Wang, Y.T.; Hou, W.H.; Zhou, X.-Y.; Wang, X.-K.; Li, J.-B.; Wang, J.-Q. Forecasting of Automobile Sales Based on Support Vector Regression Optimized by the Grey Wolf Optimizer Algorithm. Mathematics 2022, 10, 2234. [Google Scholar] [CrossRef]
- Li, S.; Zhang, Y.; Li, Y.; Yu, Z. The user preference identification for product improvement based on online comment patch. Electron. Commer. Res. 2019, 21, 423–444. [Google Scholar] [CrossRef]
- Kumar, P.; Dayal, M.; Fenza, G.; Gallo, M. NSL-BP: A Meta Classifier Model Based Prediction of Amazon Product Reviews. Int. J. Interact. Multimed. Artif. Intell. 2021, 6, 95–103. [Google Scholar] [CrossRef]
- Xu, Q.; Li, Q.; Jiang, C.; Wu, J.; Zhang, X. Social media, interaction information and stock market efficiency: Evidence from the Shenzhen stock exchange easy interaction platform in China. Asia-Pac. J. Account. Econ. 2020, 29, 1469–1496. [Google Scholar] [CrossRef]
- Balakrishnan, V.; Shi, Z.; Law, C.L.; Lim, R.; Teh, L.L.; Fan, Y. A deep learning approach in predicting products’ sentiment ratings: A comparative analysis. J. Supercomput. 2022, 78, 7206–7226. [Google Scholar] [CrossRef]
- Mikolov, T.; Chen, K.; Corrado, G.; Dean, J. Efficient Estimation of Word Representations in Vector Space. arXiv 2013, arXiv:1301.3781. [Google Scholar]
- Mikolov, T.; Sutskever, I.; Chen, K.; Corrado, G.S.; Dean, J. Distributed Representations of Words and Phrases and their Compositionality. Adv. Neural Inf. Process. Syst. 2013, 26, 3111–3119. [Google Scholar]
- Liang, C.Y.; Ma, Y.C.; Chen, R.; Liang, Y. The daily forecasting tourism demand based on SVR-ARMA combination model. J. Ind. Eng. Eng. Manag. 2015, 29, 122–127. (In Chinese) [Google Scholar]
- Qi, F.Z.; Yu, T.T.; Zhu, G.R. PSO-SVR electricity demand forecasting model based on RFE feature selection. Appl. Res. Comput. 2020, 37, 105–1077. (In Chinese) [Google Scholar]
- Jing, H.; Liu, Y.; Tang, J.H. Supply chain demand forcasting based on multivariate support vector machine. Syst. Eng. 2018, 36, 121–126. (In Chinese) [Google Scholar]
- Xu, L.; Li, L.J.; Jiang, Z.; Sun, Z.; Wen, X.; Shi, J.; Sun, R.; Qian, X. A Novel Emotion Lexicon for Chinese Emotional Expression Analysis on Weibo: Using Grounded Theory and Semi-Automatic Methods. IEEE Access 2021, 7, 92757–92768. [Google Scholar] [CrossRef]
- Qiao, M.M. Analysis of the market potential of “fat boy water” based on data mining technology—Taking Octopus as an example. Comput. Knowl. Technol. 2019, 15, 17–19. (In Chinese) [Google Scholar]


Disclaimer/Publisher’s Note: The statements, opinions and data contained in all publications are solely those of the individual author(s) and contributor(s) and not of MDPI and/or the editor(s). MDPI and/or the editor(s) disclaim responsibility for any injury to people or property resulting from any ideas, methods, instructions or products referred to in the content. |
© 2023 by the authors. Licensee MDPI, Basel, Switzerland. This article is an open access article distributed under the terms and conditions of the Creative Commons Attribution (CC BY) license (https://creativecommons.org/licenses/by/4.0/).