Abstract
This paper discusses the Topp-Leone-G power series class of distributions. The greatest attention is paid to the investigation of intrinsic characteristic “saturation” to the horizontal asymptote in the Hausdorff sense. Some estimates for the value of the Hausdorff distance are obtained. We present a new family of recurrence generated adaptive functions with corresponding applications. The usefulness of the obtained results is demonstrated in a simulation study of some real data sets from the medical sector and insurance. Some suitable software modules within the programming environment CAS MATHEMATICA are proposed.
Keywords:
Topp-Leone distribution; power series distribution; generated family; saturation; Hausdorff distance; Heaviside step function; recurrent family MSC:
41A46
1. Introduction
One basic and very important practical problem is the construction of adequate, accurate and sufficiently flexible approximation models. In practice, for a given data set, a reliable statistical model can be developed from an appropriate probability distribution. Over the last few years, many authors have derived new compounding distributions by mixing continuous distributions with power series distributions, such as the generalized modified Weibull power series [1], the Gompertz-power series [2], the Inverse Weibull power series [3], the Exponentiated Burr XII power series [4], the Exponentiated generalized power series family [5], the odd power generalized Weibull-G power series [6] and others. In 1950, Albert Noack [7] introduced the family of discrete univariate distributions evolving in power series, although the earliest work on this topic was written by Kosambi (1949) [8]. Let us recall that the probability mass function (pmf), for a random variable distributed as a power series which excludes zero, is given by
where depends only on n, and is chosen such that is finite. The power series distributions are discrete and mainly used to model count data. The Topp-Leone is one of the most commonly used distributions. Its generalization, Topp-Leone-G, was proposed by Al-Shomran et al. [9] in 2016. It is very often used as a generator for numerous generalizations with the aim of increasing the versatility of new distributions such as the Topp-Leone generated family [10], the new power Topp-Leone generated family [11], the new Topp-Leone class [12], the Extended Topp-Leone family [13], the alpha power Topp-Leone-G [14] and the new extension of the Topp-Leone family [15].
In 2021, Makubate et al. [16] considered a new class of distributions called the Topp-Leone-G Power Series (TL-GPS). This model is obtained by compounding the Topp-Leone-G distribution with the power series distribution (see also [17]). Note that TL-GPS is an extension of the Topp-Leone power series distribution proposed by Roozegar and Nadarajah [18]. Similar distributions that involve Topp-Leone with power series are the reflected generalized Topp-Leone power series [19], the Topp-Leone generalized exponential Power series [20], the type II exponentiated half-logistic-Topp-Leone-G power series [21], the Exponentiated half Logistic-Topp-Leone-G power series [22] and the type II Topp-Leone-G power series [23].
Definition 1.
Topp-Leone-G Power Series (TL-GPS) distribution is associated with the following general form of CDF function
where is finite, and is the survival function of Topp-Leone-G that is defined by
for with the baseline CDF function depending on a parameter vector ξ.
Table 1 presents some sub-classes of Topp-Leone-G Power Series.

Table 1.
Sub-classes of Topp-Leone-G Power Series.
The main aim of this work is investigation of intrinsic characteristic “saturation” to the horizontal asymptote in the Hausdorff sense. This research can be very useful in choosing an appropriate model for approximating specific data and be applicable in various fields such as finance, economics, actuarial sciences, biostatistics and many others. We need a metric for measuring similarity between sigmoidal (cumulative) function and a step function. The Hausdorff distance can be considered as the highest optimal path between these curves as a smaller Hausdorff distance shows a higher closeness.
Definition 2.
The shifted Heaviside step function is defined by
We consider Euclidean space with the maximum norm namely for the points and in we have . Hence we can define the Hausdorff distance [24,25].
Definition 3.
The Hausdorff distance (the H-distance) between two interval functions on , is the distance between their completed graphs and considered as closed subsets of . More precisely,
The formal definition of saturation of distribution in Hausdorff sense is proposed by Zaevski and Kyurkchiev [26].
Definition 4.
Let be the CDF of a distribution with a left–finite domain , . Its saturation is the Hausdorff distance between the completed graph of and the curve consisting of two lines – one vertical between the points and and another horizontal between and .
Iliev et al. [27] investigated the Hausdorff approximation between the Heaviside step function and Topp -Leone cumulative sigmoids. Similar investigations for some modifications of Topp-Leone and their behavior in the Hausdorff sense can be found in related papers and monographs [28,29,30,31]. Examination of family containing power series distribution is proposed in [32].
The article is structured as follows: In Section 2, our attention is paid to investigation of intrinsic characteristic “saturation” to the horizontal asymptote in the terms of Hausdorff metric. We present in detail approximation analysis for Topp-Leone-Weibull-Poisson (TL-WP). Numerical and real data examples demonstrate the usefulness of obtained theoretical results. Furthermore, family of recurrence generated adaptive functions with corresponding applications is defined in Section 3. We propose a simple dynamic programming module implemented within the programming environment CAS Wolfram Mathematica for computation the Hausdorff distance.
2. Approximation Results
Let us focus on one special case of a Topp-Leone-G Power Series (TL-GPS), namely with a baseline distribution—Weibull and power series distribution—Poisson. We obtain Topp-Leone-Weibull-Poisson (TL-WP) with the CDF function given by
where , , b, and .
2.1. Hausdorff Approximation
We study the behavior of CDF in the Hausdorff sense and, more precisely, “saturation” to the horizontal asymptote . The methodology applied here can be used in a similar way for other special cases of proposed families using different baseline distributions and sub-classes of power series distribution with corresponding approximation problems. In detail, we present an examination of Topp-Leone-Weibull-Poisson CDF functions (3).
According to Definitions (3) and (4), we have that saturation of distribution is the side of the smallest unit square, centered at the point touching the graph of the cumulative function. Hence, the Hausdorff distance d between and the Heaviside function at the “median level” satisfies the following nonlinear equation:
where with
Note that (4) has a unique root since the function is increasing and continuous.
The next theorem gives some estimates for the saturation in terms of the Hausdorff metric of the TL-GPS CDF function.
Theorem 1.
The Hausdorff distance d between the Heaviside function and the CDF function defined by (3) satisfies
where
with , and .
Proof of Theorem 1.

We define function by
where the CDF function is defined by (3). It is easy to show that , i.e., , is monotony increasing. Now, we will show that can be approximated by
where A is defined by (6). From the Taylor expansion, we have
With simple calculations, we have
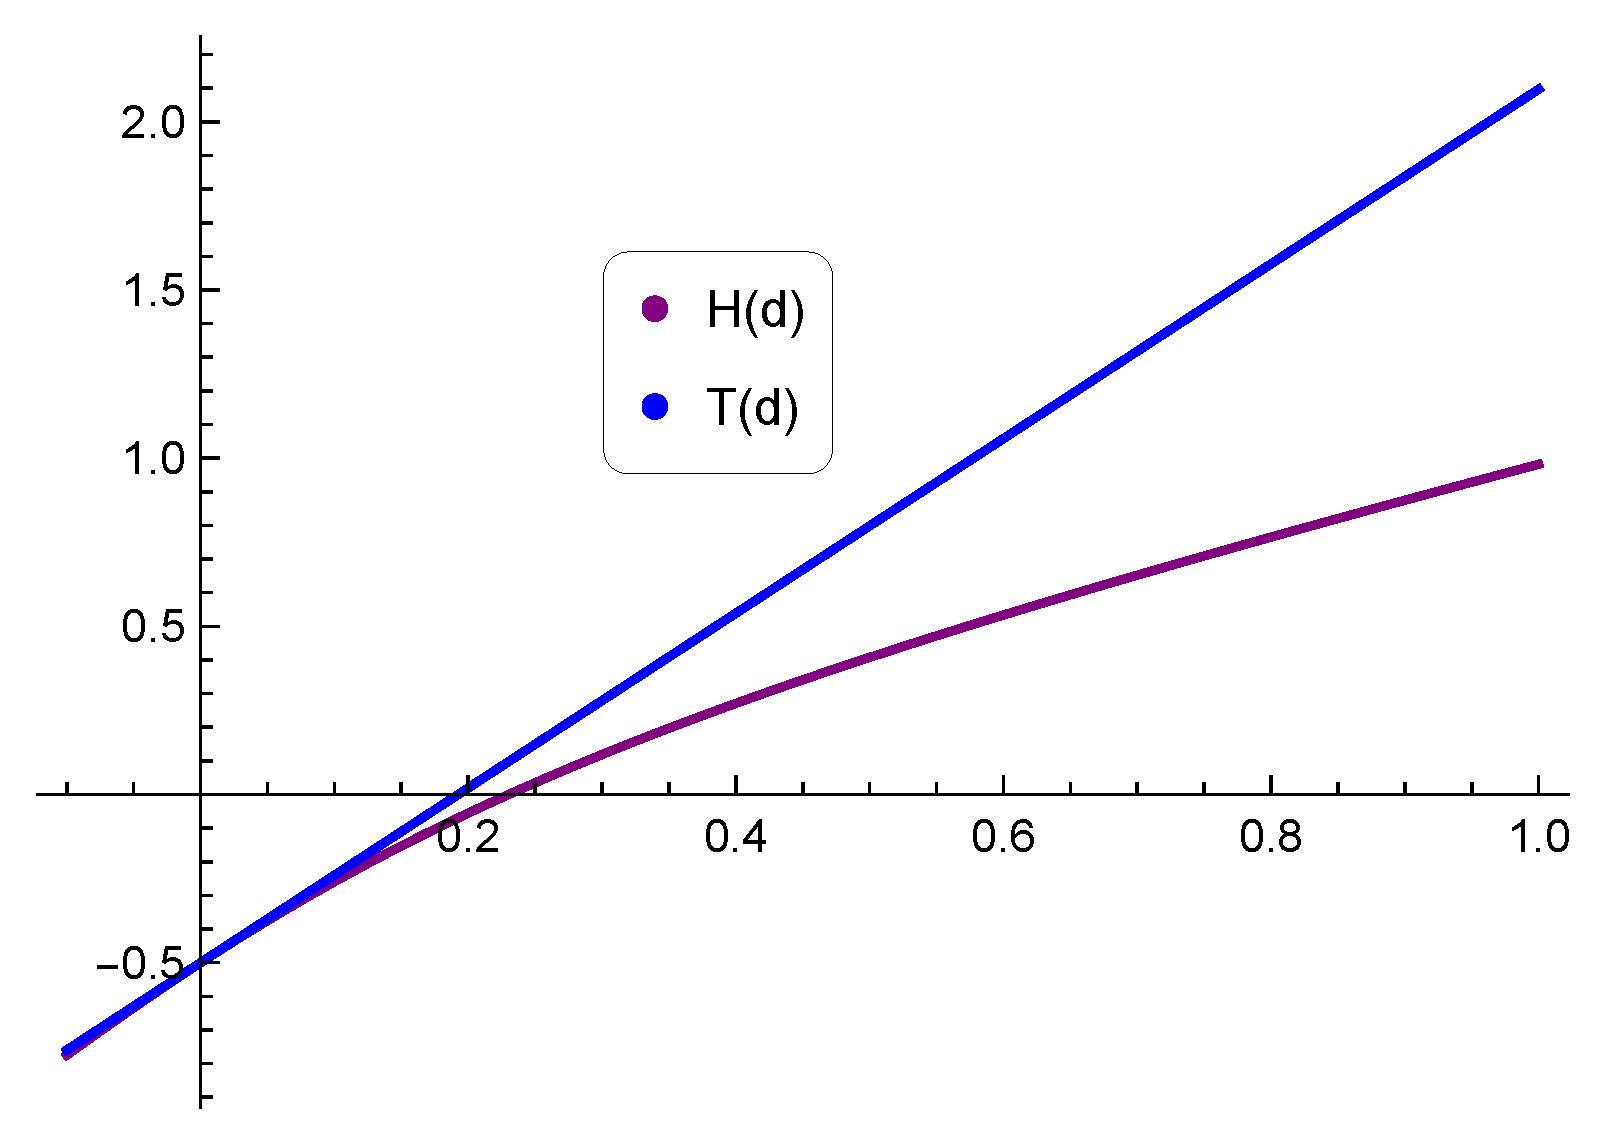
Hence, for defined by (5). Then, it follows from here that , so function approximates for with . In Figure 1, we present the graph of functions and for fixed values of parameters , , and . Function is also monotonically increasing since . If , then and , which completes the proof. □
Figure 1.
Functions and .
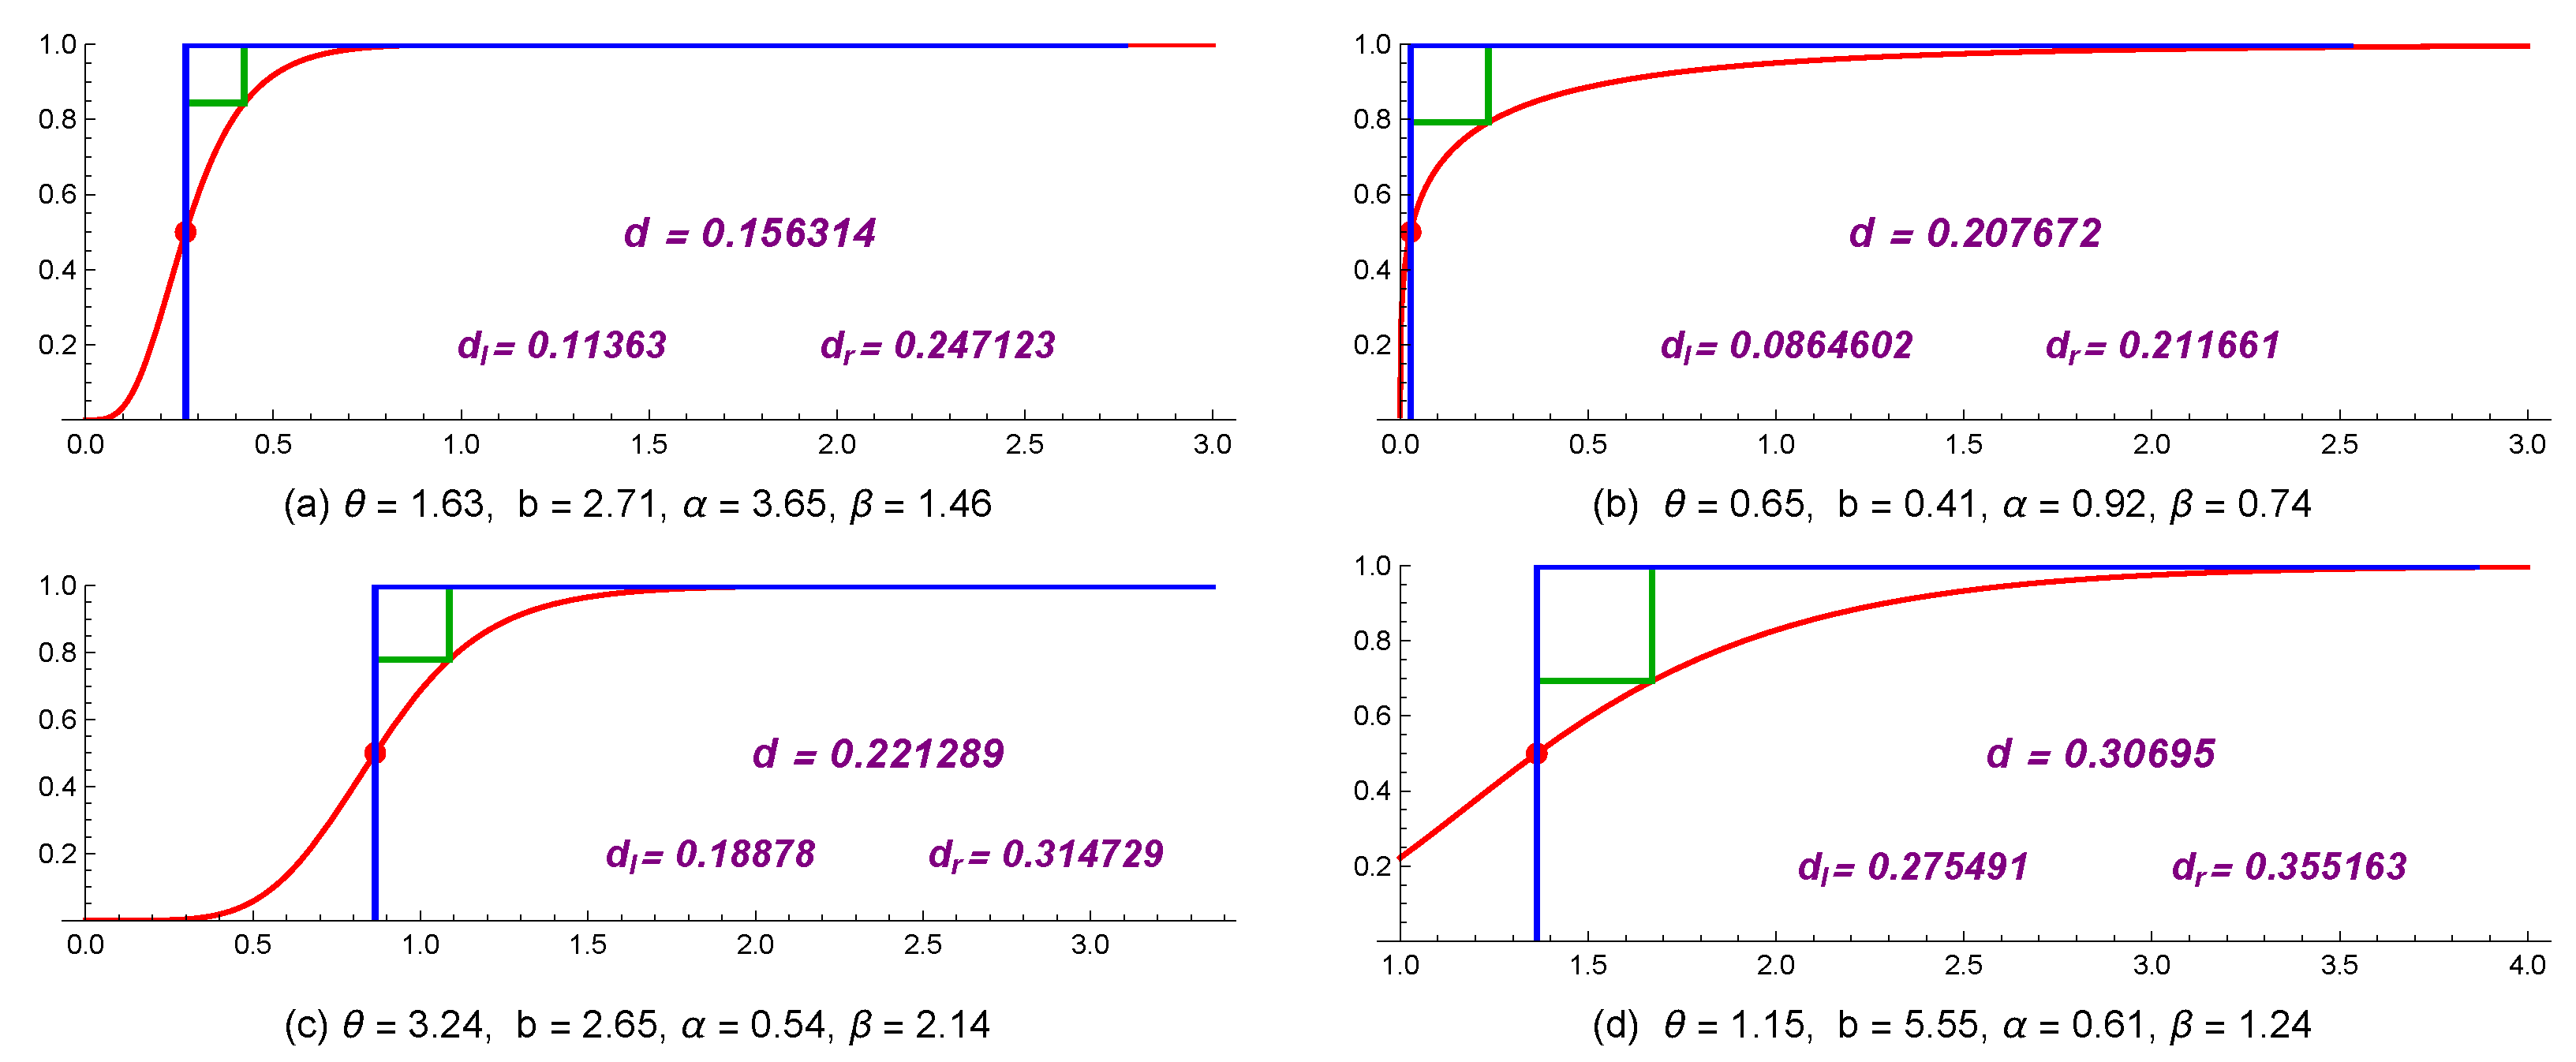
Table 2 presents some computational experiments for distinct combinations of distribution parameters , b, and . We calculate values of Hausdorff approximation d with its left and right estimations using Theorem 1. Furthermore, some graphical examples are shown in Figure 2.
Table 2.
Values of Hausdorff distance d and its estimations.
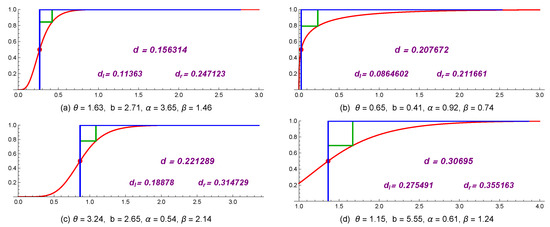
Figure 2.
Approximations of CDF function of TL-WP.
2.2. Some Applications
Let us consider one practical application using modeling data from the medical sector. The data set is a subset of the data corresponding to the survival times (in years) of a group of patients who received chemotherapy alone [33]. The data include the survival times (in years) for 45 patients.
| data—chemotherapy | |||||||||
| 0.047 | 0.115 | 0.121 | 0.132 | 0.164 | 0.197 | 0.203 | 0.260 | 0.282 | 0.296 |
| 0.334 | 0.395 | 0.458 | 0.466 | 0.501 | 0.507 | 0.529 | 0.534 | 0.540 | 0.641 |
| 0.644 | 0.696 | 0.841 | 0.863 | 1.099 | 1.219 | 1.271 | 1.326 | 1.447 | 1.485 |
| 1.553 | 1.581 | 1.589 | 2.178 | 2.343 | 2.416 | 2.444 | 2.825 | 2.830 | 3.578 |
| 3.658 | 3.743 | 3.978 | 4.003 | 4.033 | |||||
The data—chemotherapy can be approximated with the Topp-Leone-Weibull-Poisson (TL-WP) distribution with corresponding parameters , , and . This fact is not rejected from standard goodness-of-fit statistical tests. The estimated P-P graphic is displayed in Figure 3.
| Statistic | p-Value | |
| Anderson–Darling | 1.20184 | 0.266033 |
| Cramér–von Mises | 0.11562 | 0.513591 |
| Kolmogorov–Smirnov | 0.116999 | 0.530605 |
| Kuiper | 0.168146 | 0.360015 |
| Pearson | 6.33333 | 0.706149 |
| Watson | 0.0836651 | 0.38578 |
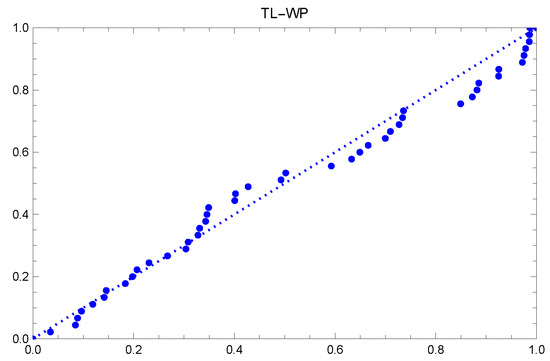
Figure 3.
Estimated P-P graphic for data—chemotherapy.
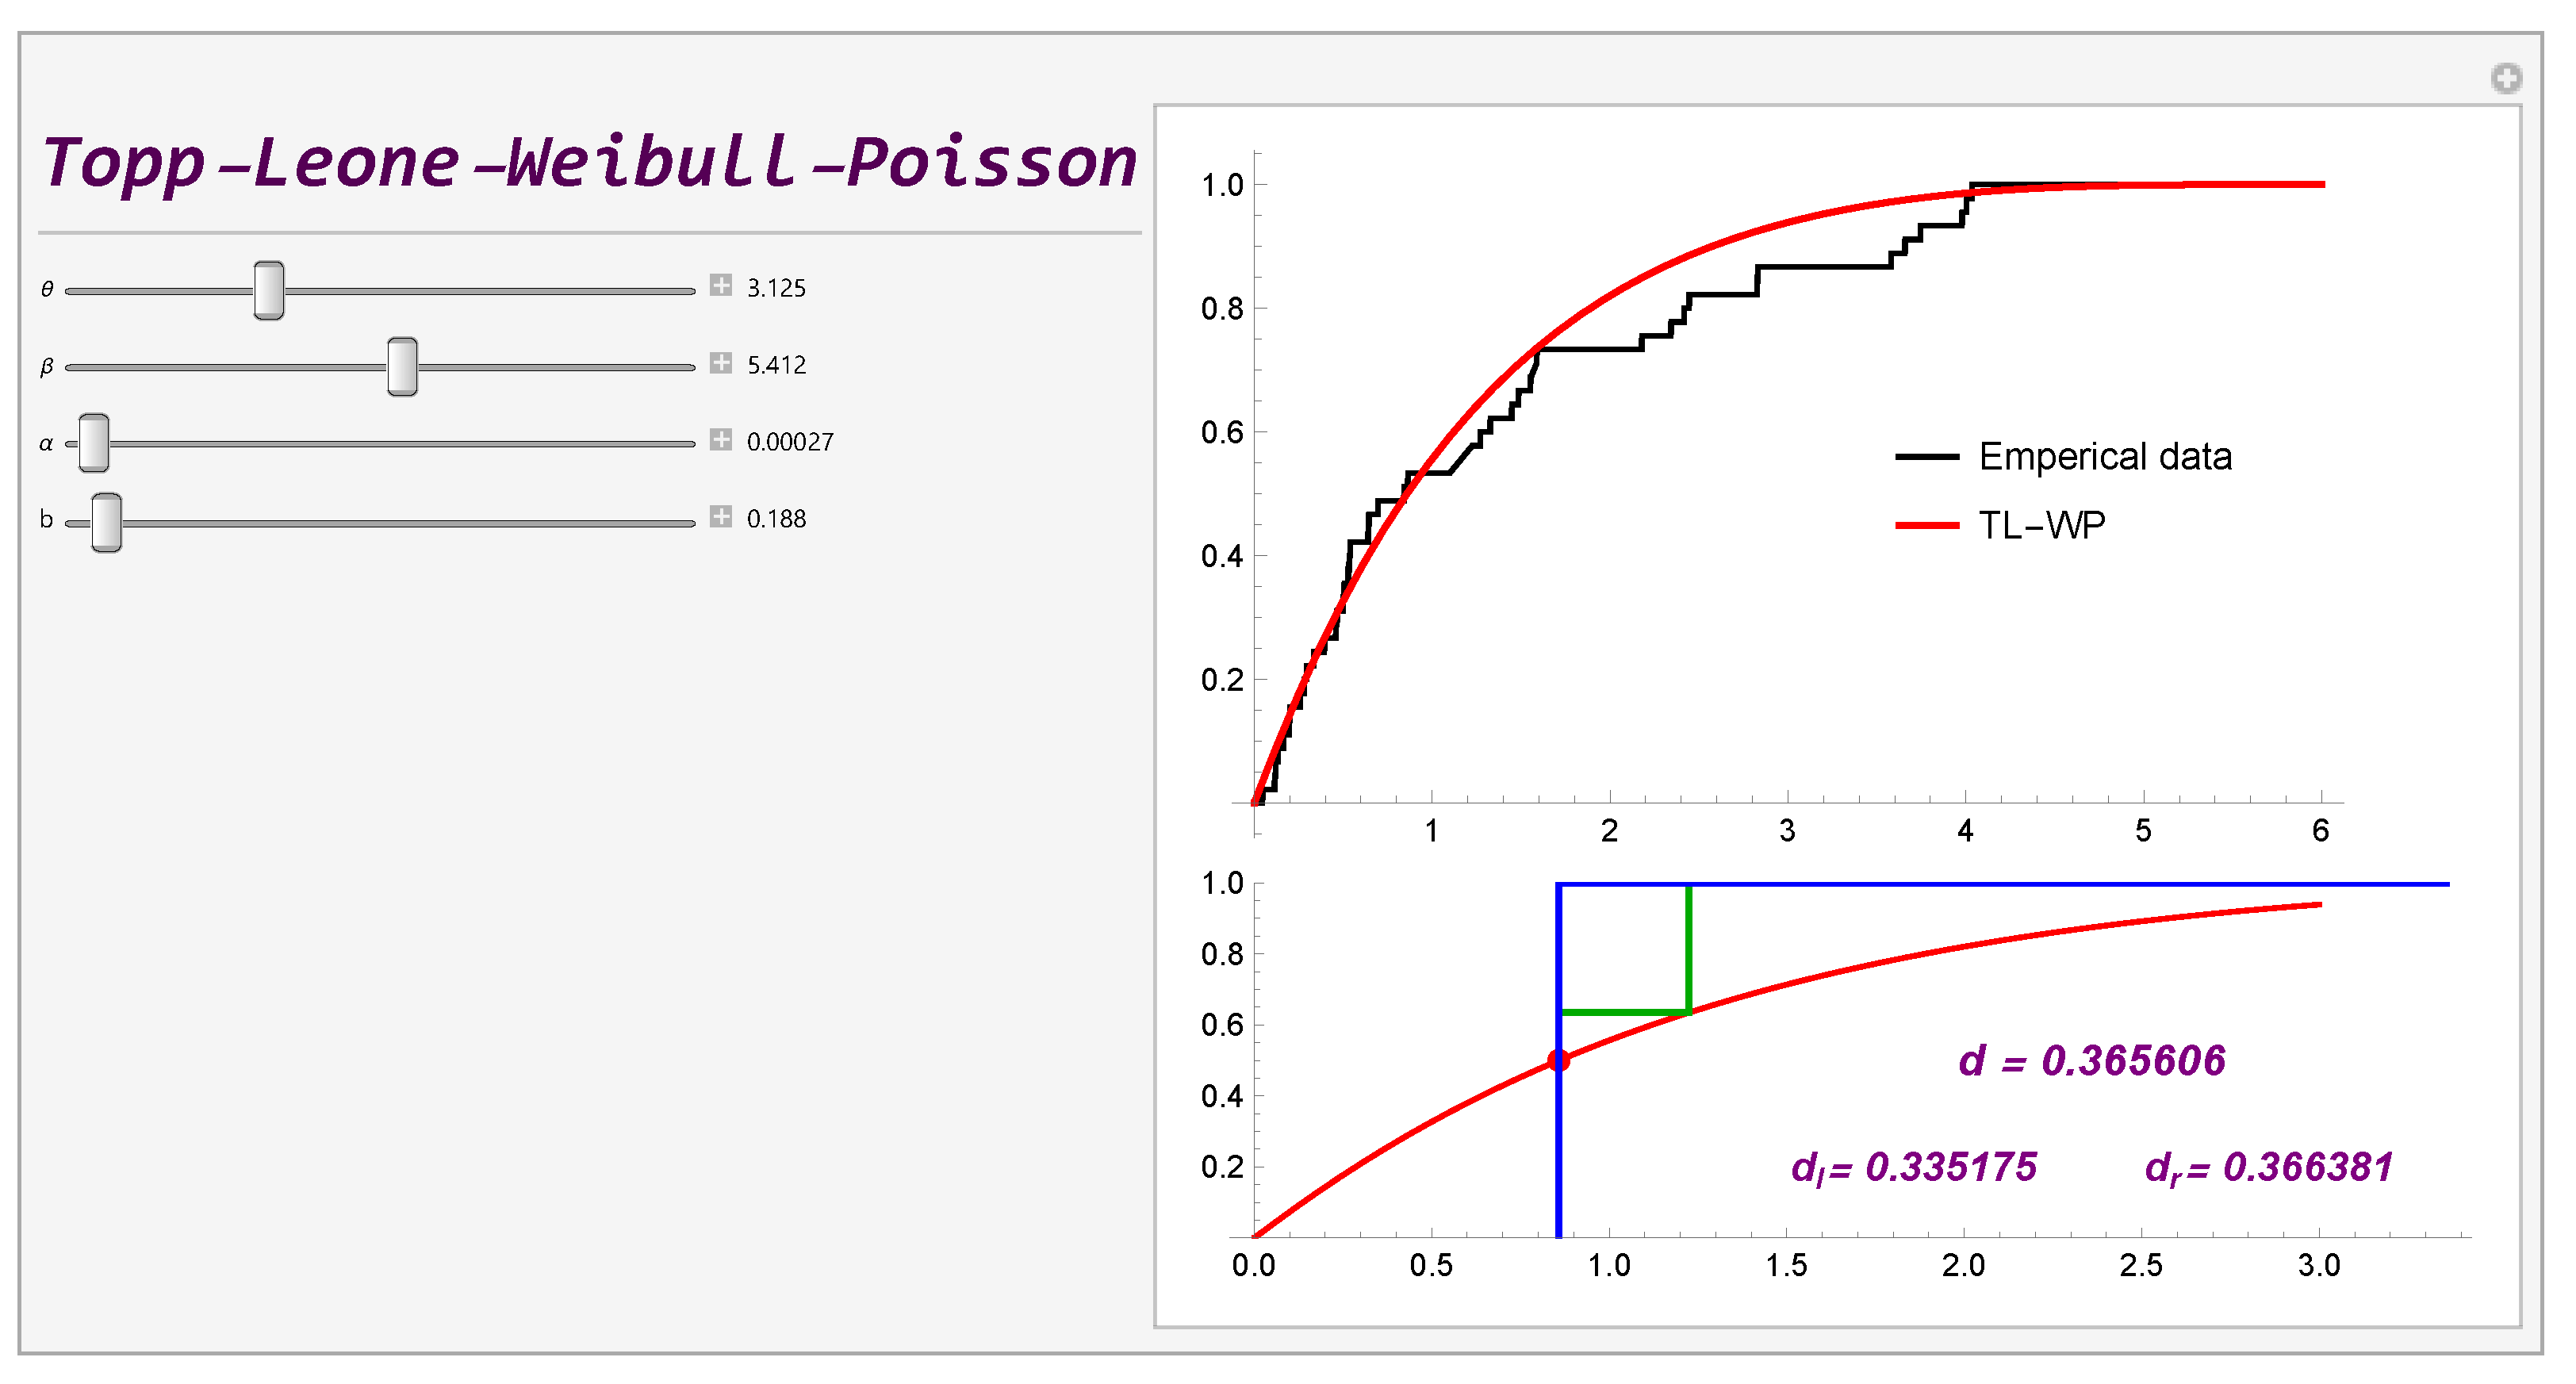
From Theorem 1, for the considered parameters we obtain the values of Hausdorff distance with estimates and , respectively. The obtained result are presented by the dynamic module in Figure 4.
| automobile insurance claims | ||||||||||
| 1103 | 1939 | 4339 | 1491 | 3801 | 387 | 1299 | 326 | 1789 | 3310 | 443 |
| 673 | 6524 | 1217 | 1526 | 109 | 1279 | 852 | 1285 | 417 | 1333 | 3231 |
| 493 | 2201 | 464 | 773 | 4746 | 2596 | 1724 | 2132 | 1715 | 879 | 2467 |
| 4631 | 1856 | 911 | 966 | 789 | 1115 | 1716 | 841 | 385 | 1326 | 450 |
| 66 | 46 | 419 | 2315 | 508 | 48 | 34 | 261 | 3314 | 558 | 86 |
| 308 | 255 | 467 | 822 | 514 | 3047 | 298 | 220 | 182 | 61 | 411 |
| 111 | 381 | 198 | 552 | 28 | 278 | 703 | 535 | 407 | 138 | 193 |
| 27 | 88 | 318 | 11 | 8 | 38 | 53 | 88 | 49 | 99 | 12 |
| 123 | 125 | 10 | 77 | 43 | 21 | 382 | 64 | 61 | 42 | 9 |
| 56 | 44 | 26 | 41 | 44 | 91 | 40 | 509 | 47 | 143 | 59 |
| 70 | 19 | 153 | 483 | 107 | 93 | 135 | 122 | 62 | 150 | 370 |
| 48 | 73 | 656 | 172 | 54 | 34 | 143 | 26 | 22 | 116 | 70 |
| 243 | 462 | 49 | 69 | 157 | 215 | 128 | 46 | 45 | 190 | 90 |
| 46 | 37 | 91 | 519 | 111 | 44 | 21 | 102 | 25 | 32 | 95 |
| 64 | 113 | 617 | 511 | 46 | 65 | 0 | 34 | 24 | 71 | 97 |
| 30 | 11 | 17 | 35 | 15 | 24 | 35 | 0 | 912 | 75 | 5 |
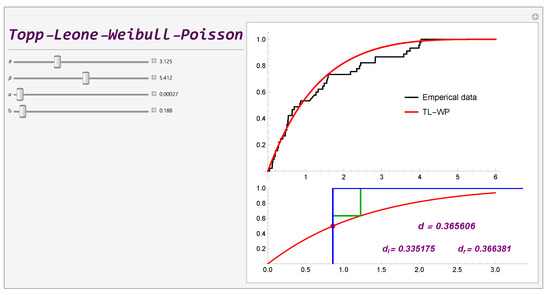
Figure 4.
Estimated CDF for TL-WP distribution for chemotherapy data.
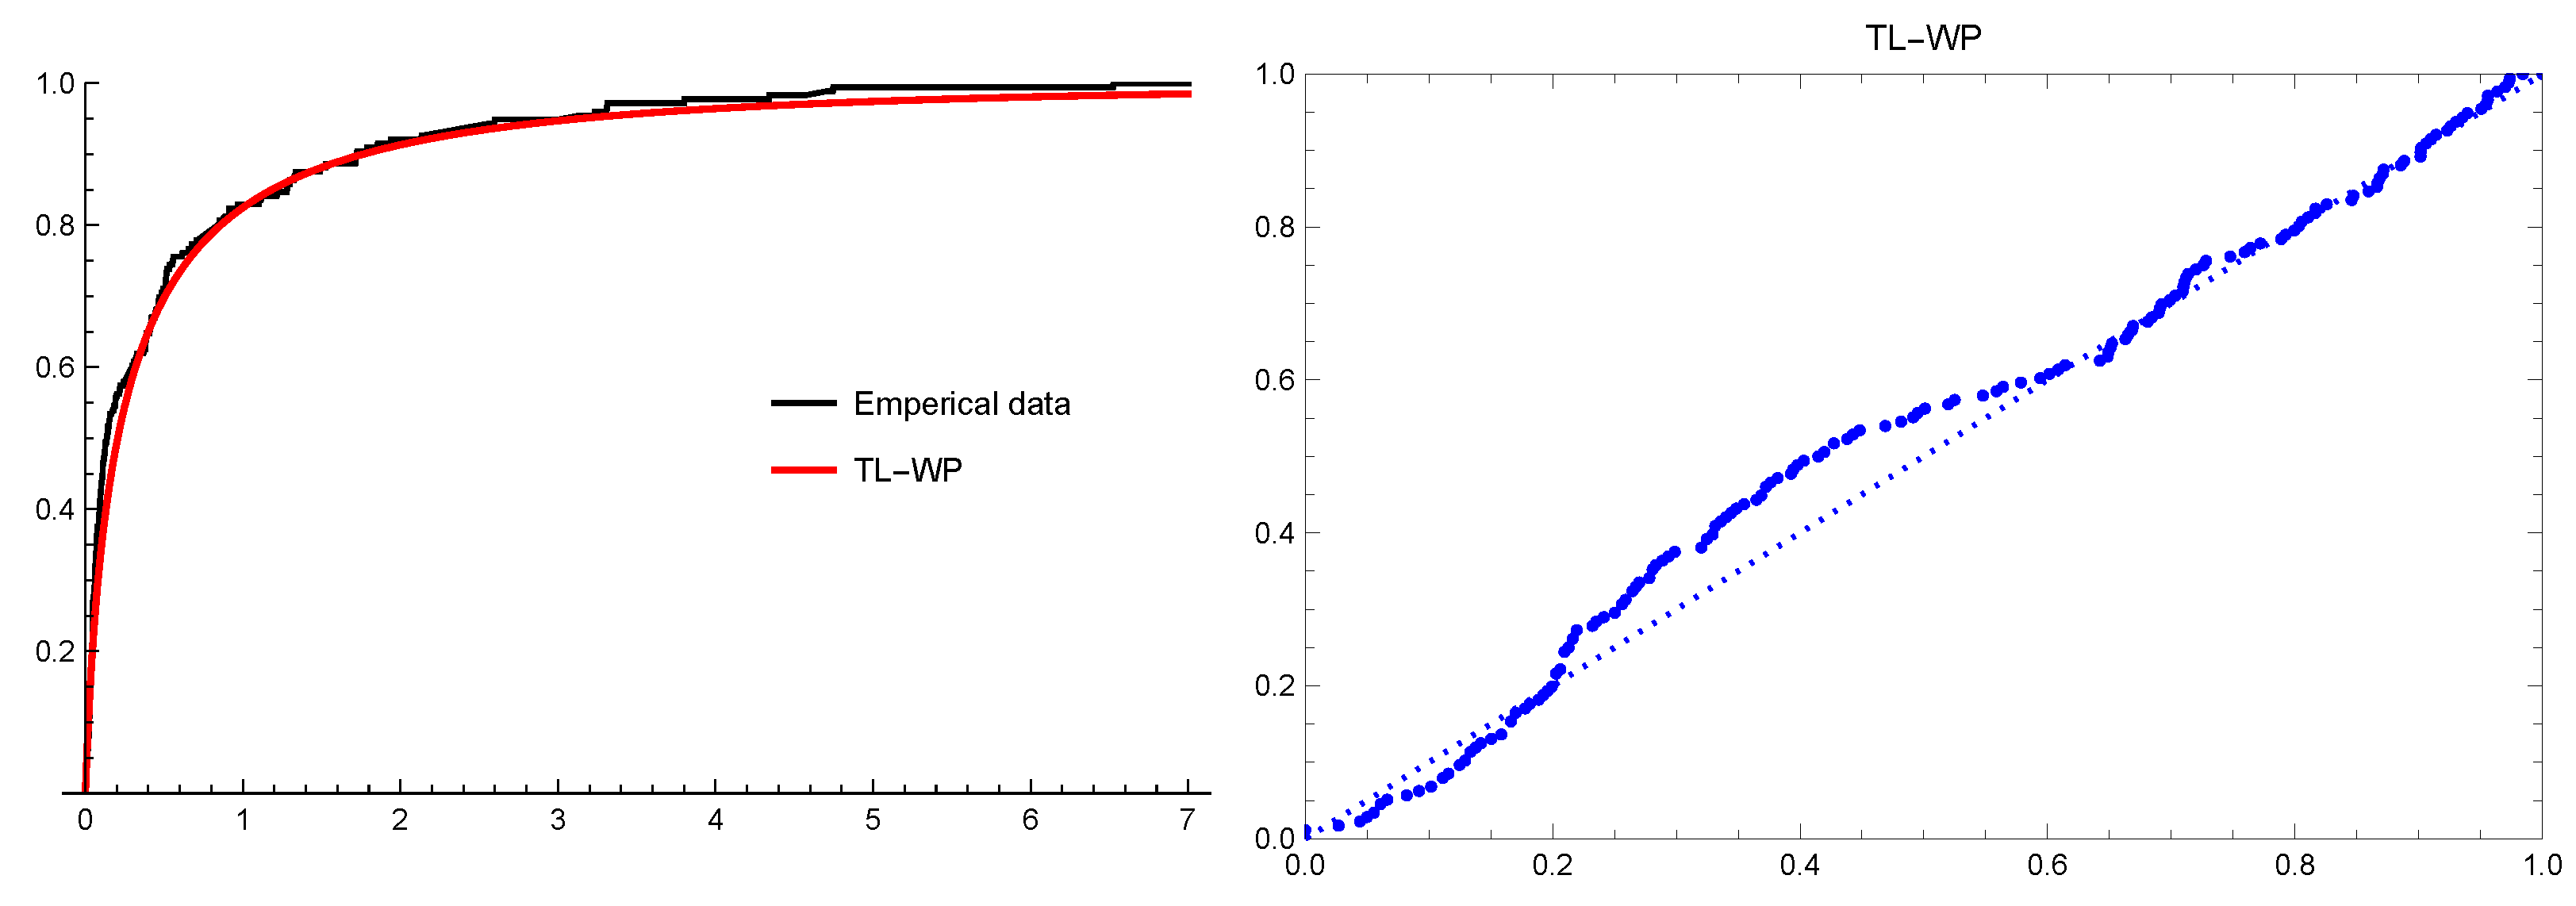
We continue to investigate applications by considering the automobile insurance claims taken from [34]. The Topp-Leone-Weibull-Poisson (TL-WP) model is applied to this data set (normalized). We obtain the following parameters: , , and . According to the Cramér-von Mises and Pearson statistical tests, the null hypothesis that the data are distributed according to the TL-WP is not rejected at the 5 percent level. The estimated CDF and the fitted TL-WP distribution as well as the estimated P-P for the automobile insurance claims data set are plotted in Figure 5. We apply Theorem 1 and obtain the saturation with corresponding estimates and .

Figure 5.
Estimated CDF and P-P graphics for TL-WP distribution for automobile insurance claims.
3. Family of Recurrence Generated Activation Functions
We define a family of recurrence generated activation functions based on Topp-Leone-Weibull-Poisson (TL-WP) distribution. Reader can consider a similar recurrence activation function based on TL-GPS distribution with different baseline distribution with relevant approximation models.
where , with
We can investigate the behavior of the CDF functions , in the Hausdorff sense. Hence, for the Hausdorff distance d we have
where is a positive solution of the equation .
The Hausdorff distance d for some combinations of parameters is shown in Table 3. From here, we see that the Hausdorff distance becomes smaller with how deep we go into the recursion.
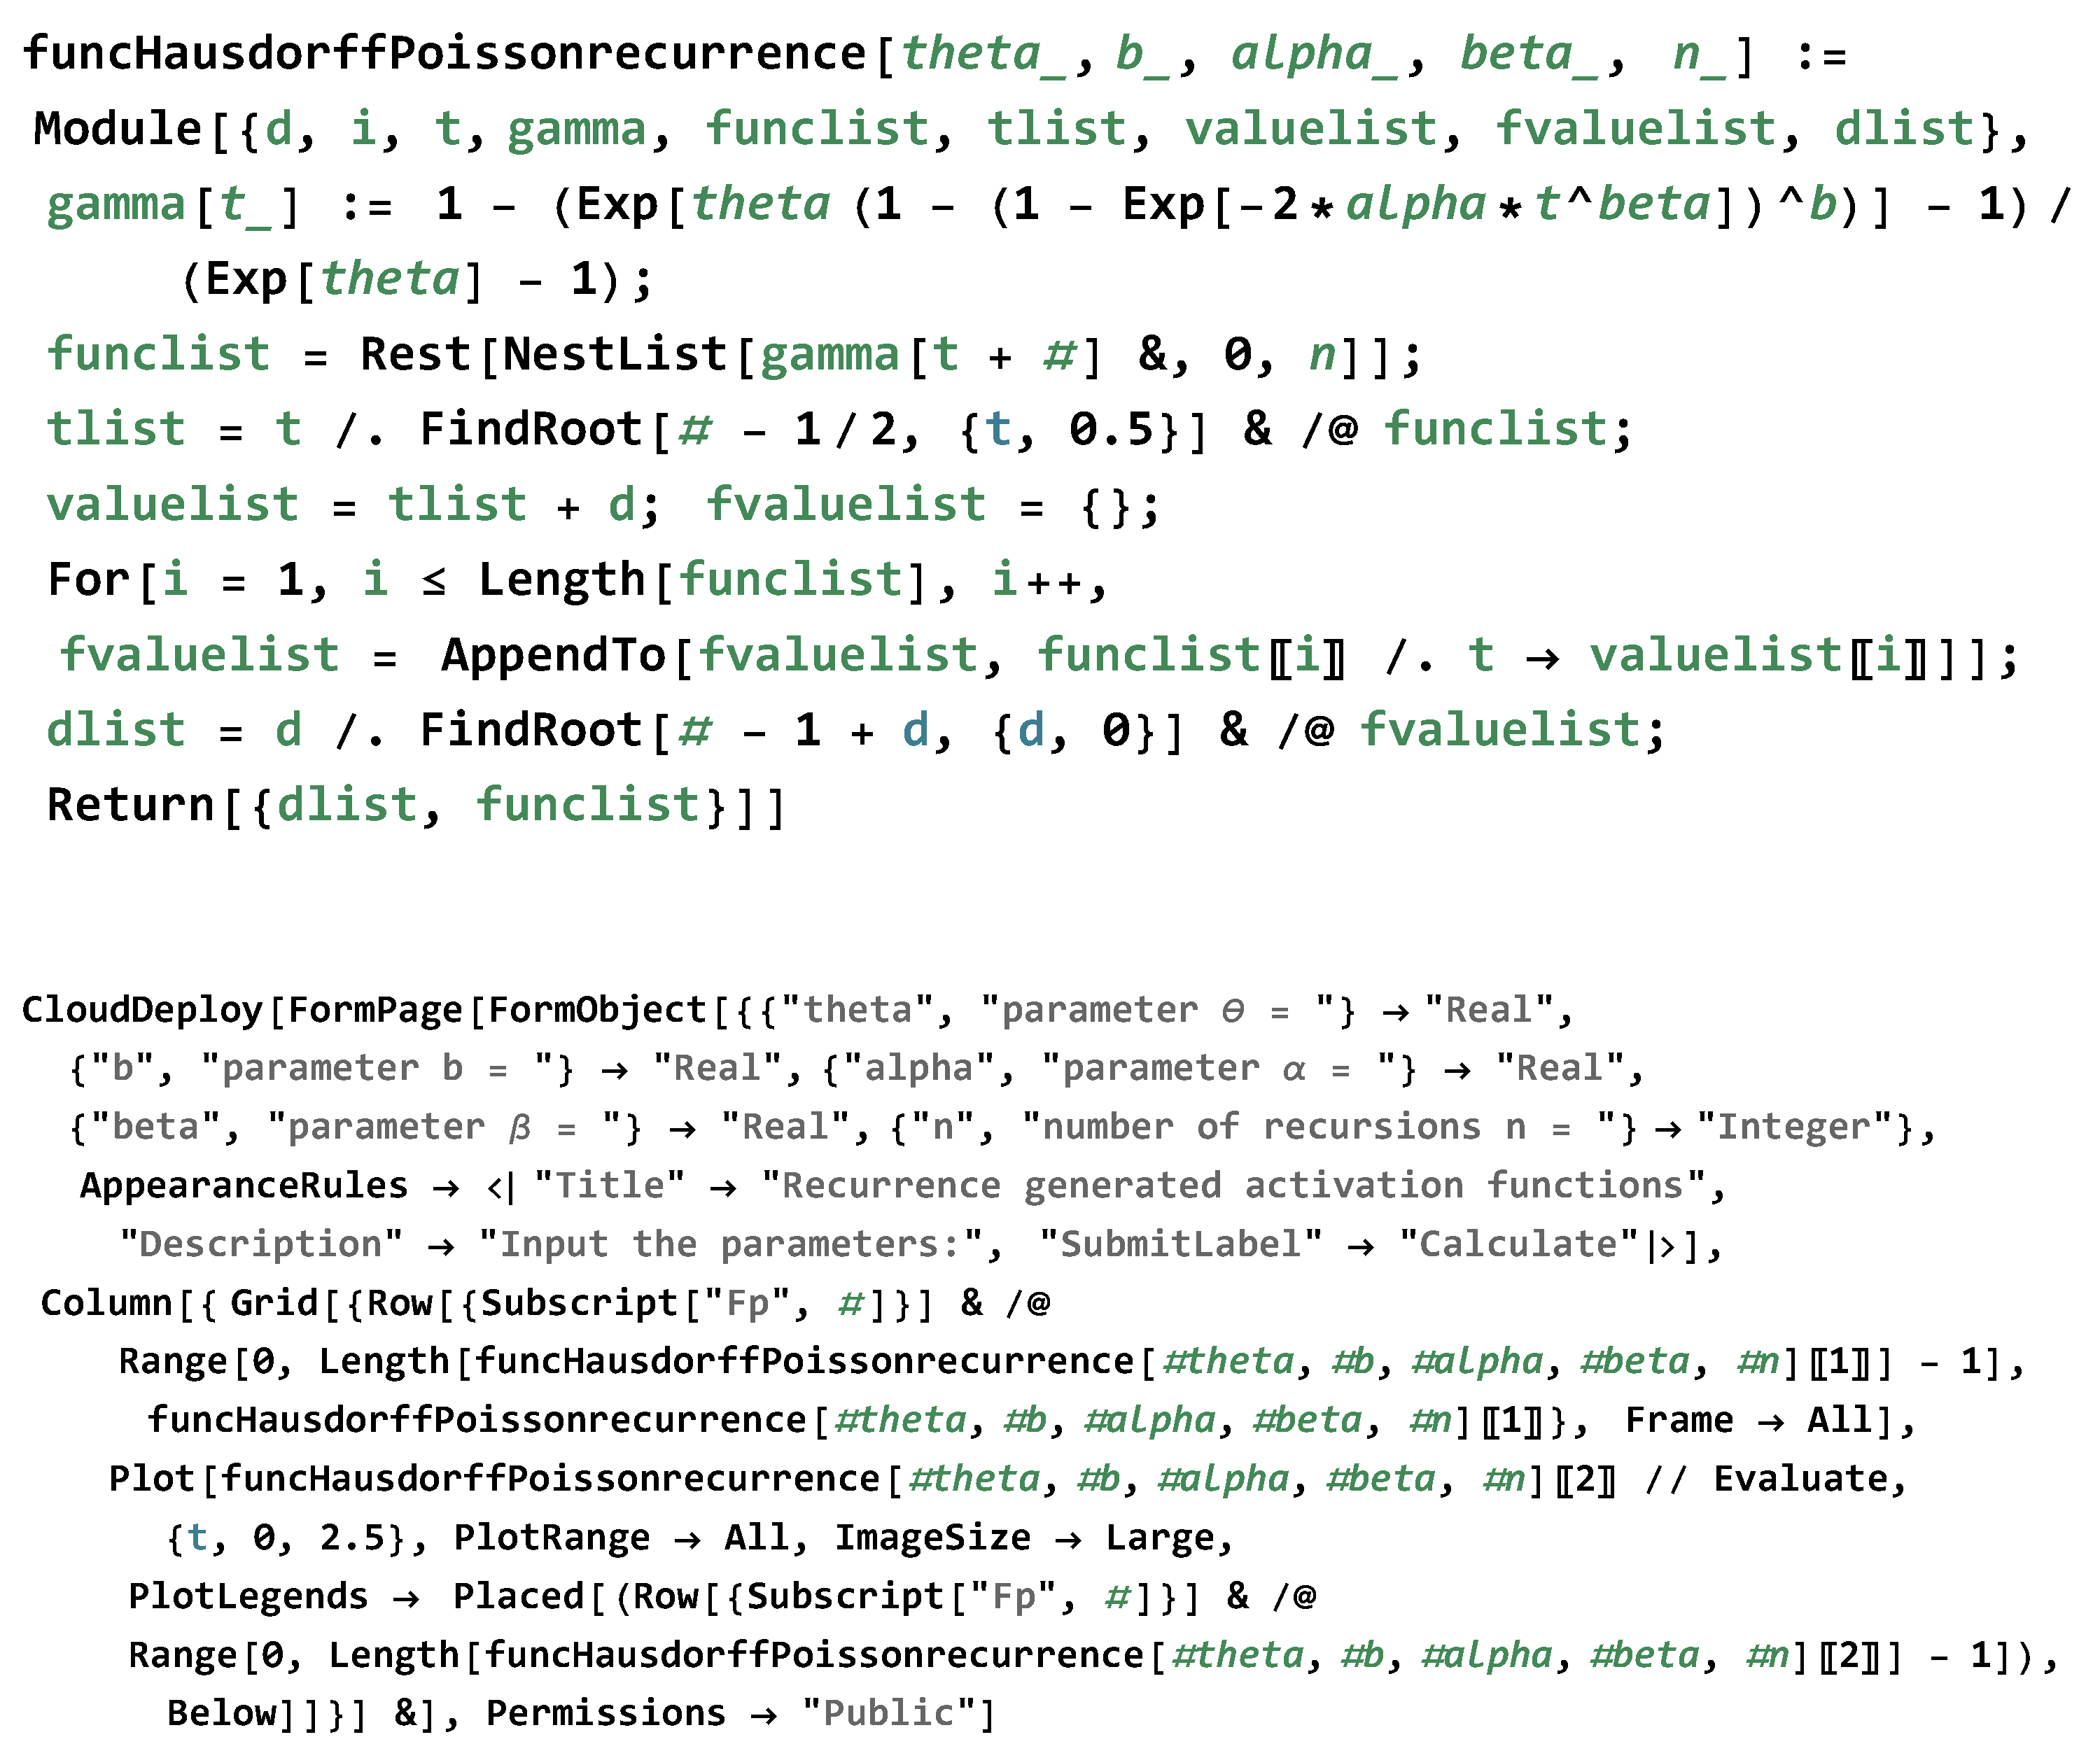
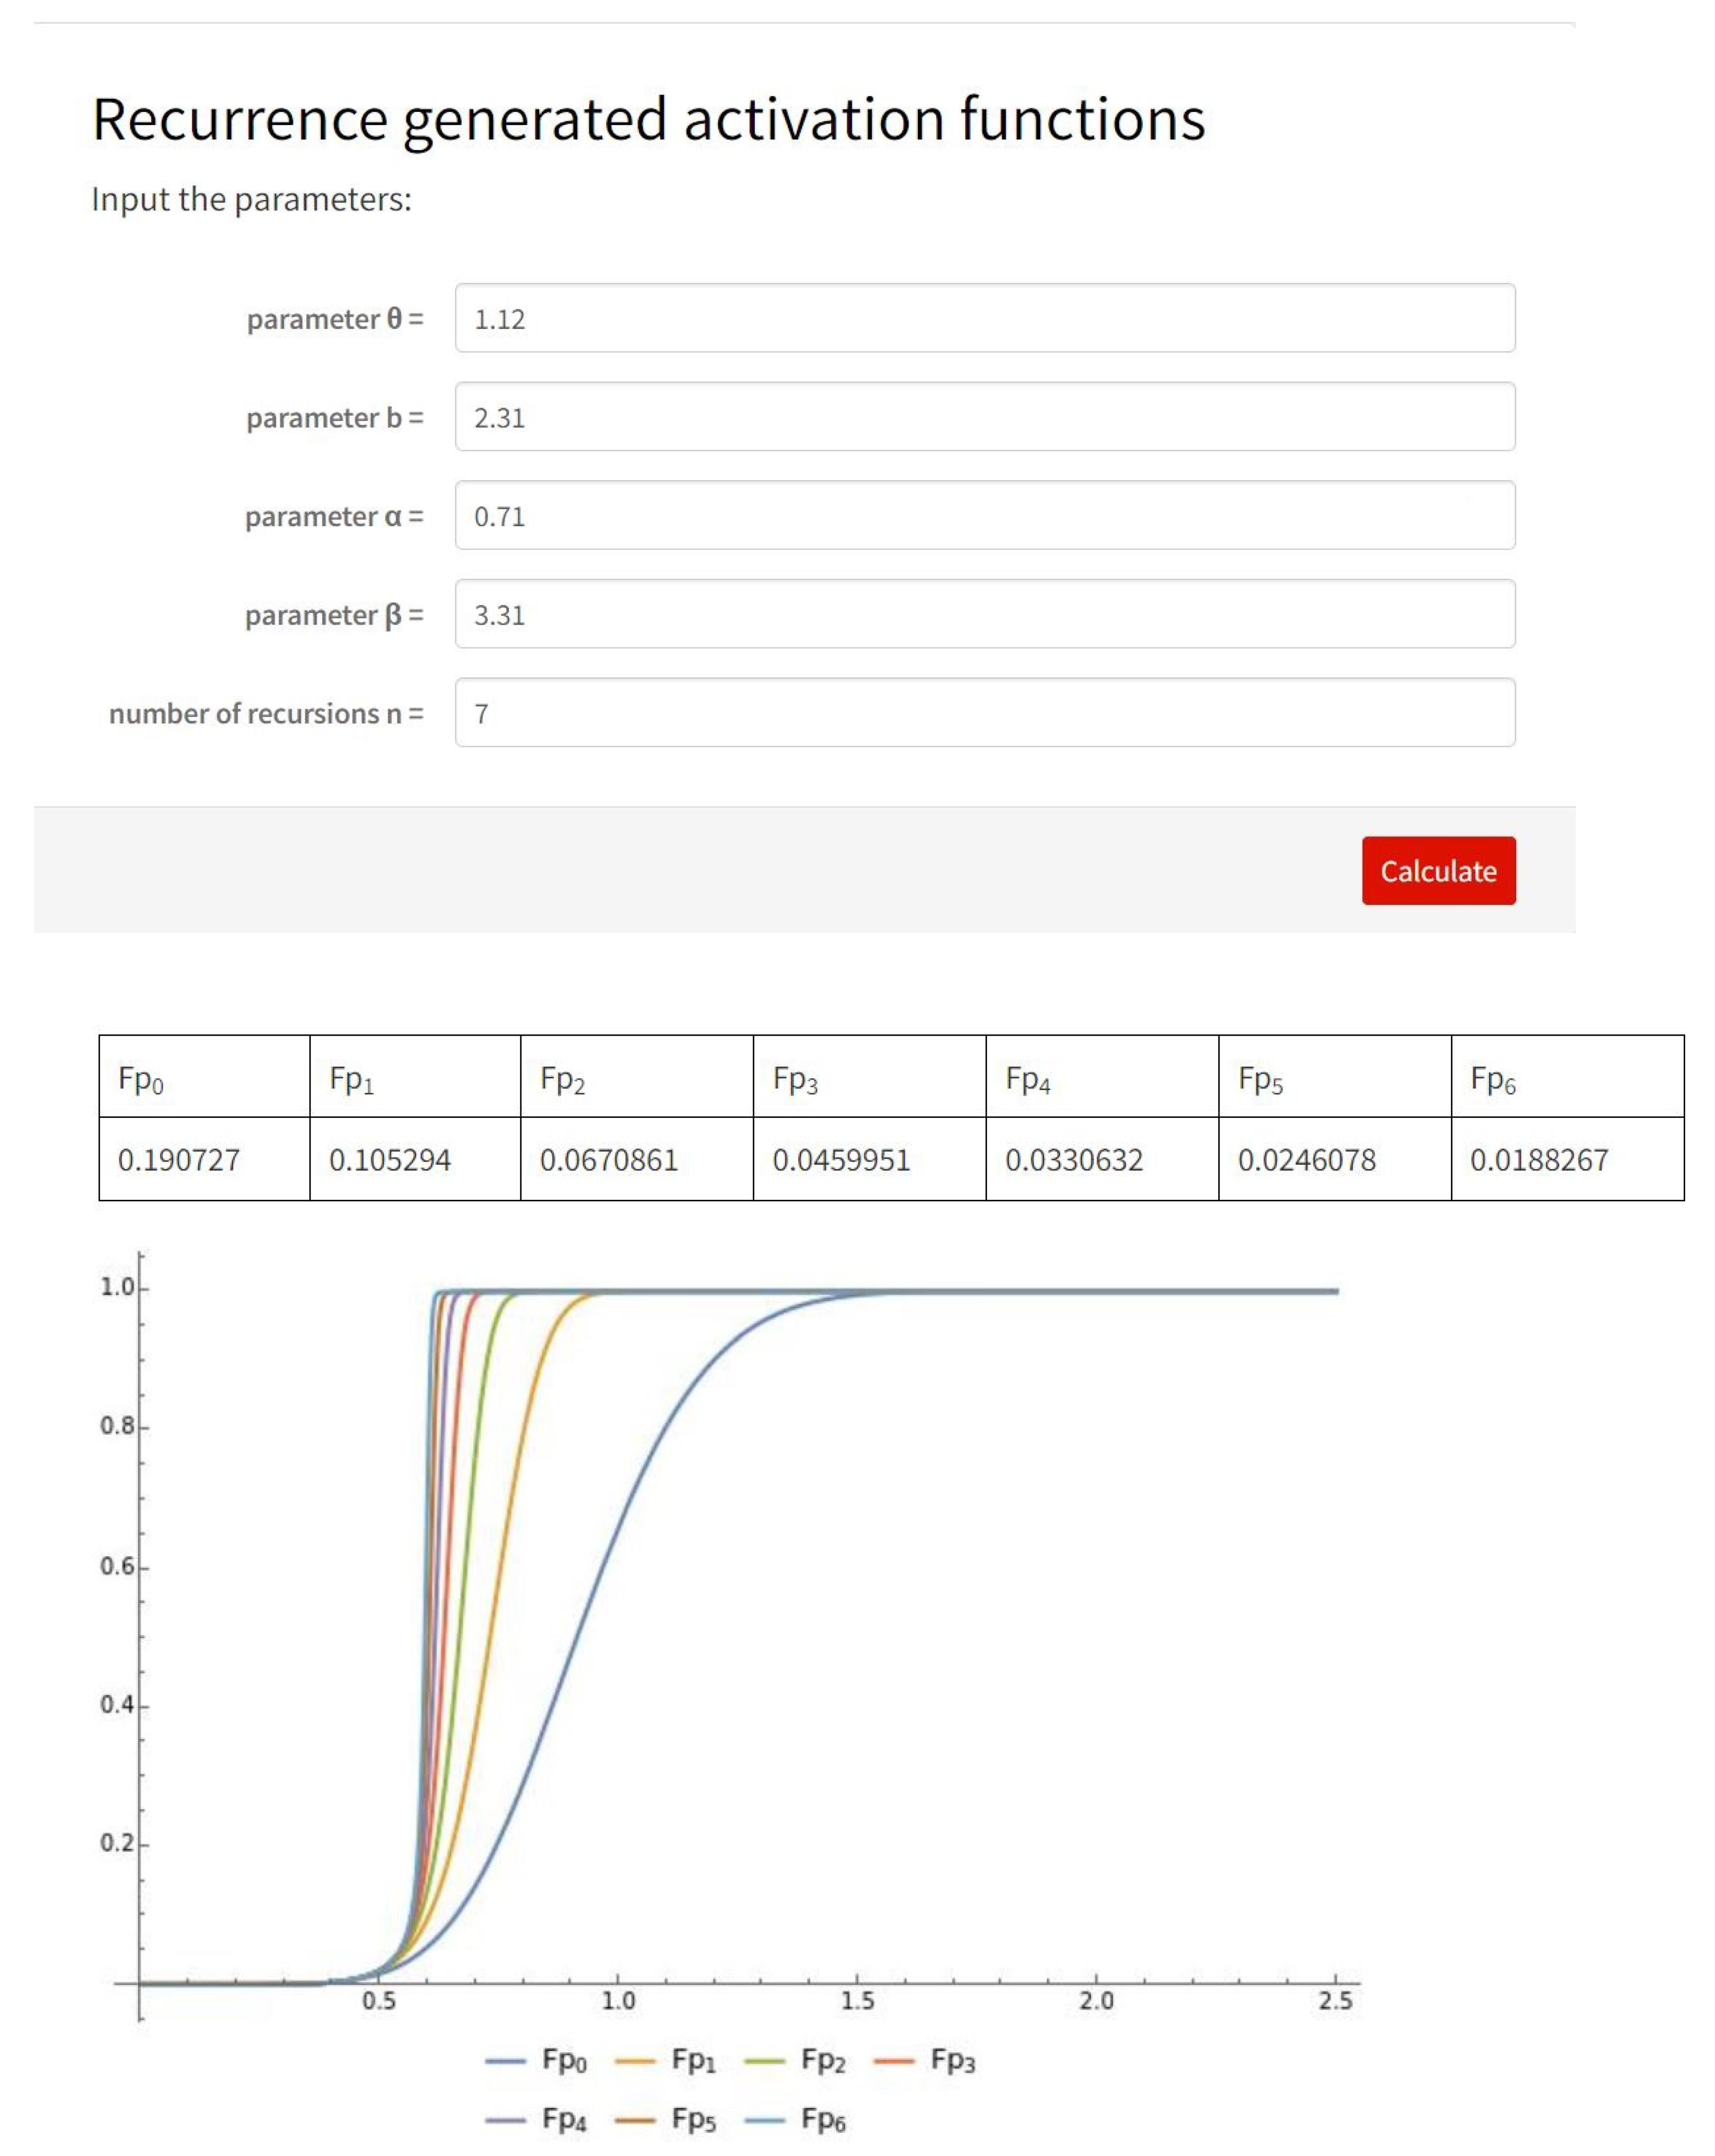
We propose a cloud software module implemented in the programming environment Wolfram Cloud for the computation of the Hausdorff distance for recurrence generated adaptive functions from family (7) (see Figure 6). This web (cloud) version of the module only requires browser and internet connection. The user defines the parameters of distribution and the number of recursions. The result is the calculated Hausdorff distance in table view with graphical representation of the generated recurrence adaptive functions.

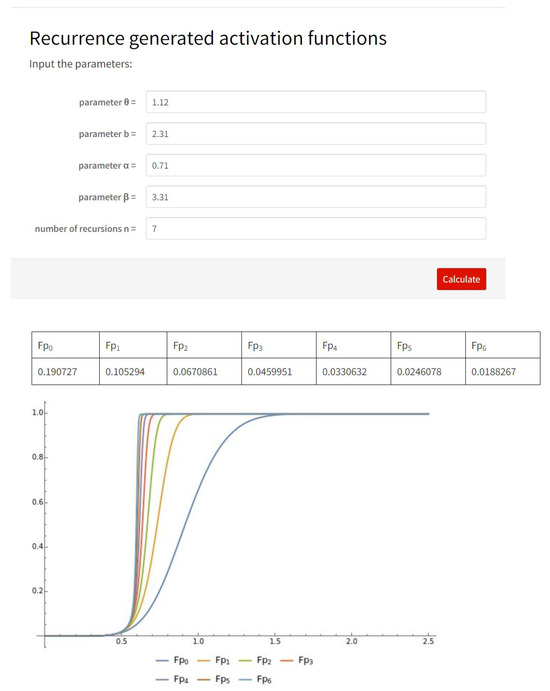
Figure 6.
Cloud module for recurrence generated adaptive functions (7).
4. Conclusions
This article is dedicated to an investigation of the characteristics of ”saturation“ in the Hausdorff sense for Topp-Leone-G power series. This research can help scientists in adequate construction and accurate and sufficiently flexible approximation models. We explore in detail the asymptotic behavior of the Hausdorff distance between the Heaviside step function and the Topp-Leone-Weibull-Poisson CDF function. For the considered Hausdorff approximation, some estimates are proved. Suitable numerical examples are shown. Additionally, we present modeling data from the medical sector and insurance. Furthermore, we discuss the application of new families of recurrence generated adaptive functions. The proposed methodology can be successfully applied to other sub-models of Topp-Leone-G power series as well as other commonly used CDFs in practice. Some related results can be found in [35,36,37,38,39]. Several dynamic modules implemented in CAS Wolfram Mathematica are included. A cloud version that only requires a browser and internet connection is offered for some of them. The proposed modules can be upgraded as well as adapted for other distributions and data sets.
Funding
This research was funded by project No. FP23-FMI-002, “Intelligent software tools and applications in research in Mathematics, Informatics, and Pedagogy of Education”, of the Scientific Fund of the Paisii Hilendarski University of Plovdiv, Bulgaria.
Data Availability Statement
Data are contained within the article.
Conflicts of Interest
The author declares no conflict of interest.
References
- Bagheri, S.; Bahrami Samani, E.; Ganjali, M. The generalized modified Weibull power series distribution: Theory and applications. Comput. Stat. Data Anal. 2016, 94, 136–160. [Google Scholar] [CrossRef]
- Jafari, A.; Tahmasebi, S. Gompertz-power series distributions. Commun. Stat. Theory Methods 2016, 45, 3761–3781. [Google Scholar] [CrossRef]
- Sobhan Shafiei, S.; Darijani, S.; Saboori, H. Inverse Weibull power series distributions: Properties and applications. J. Stat. Comput. Simul. 2016, 86, 1069–1094. [Google Scholar] [CrossRef]
- Nasir, A.; Yousof, H.M.; Jamal, F.; Korkmaz, M.Ç. The Exponentiated Burr XII power series distribution: Properties and applications. Stats 2019, 2, 15–31. [Google Scholar] [CrossRef]
- Nasiru, S.; Mwita, P.N.; Ngesa, O. Exponentiated generalized power series family of distributions. Ann. Data Sci. 2019, 6, 463–489. [Google Scholar] [CrossRef]
- Oluyede, B.; Moakofi, T.; Chipepa, F. The odd power generalized Weibull-G power series class of distributions: Properties and applications. Stat. Transit. New Ser. (SITNS) 2022, 23, 89108. [Google Scholar] [CrossRef]
- Noack, A. A class of random variables with discrete distributions. Ann. Math. Stat. 1950, 21, 127–132. [Google Scholar] [CrossRef]
- Kosambi, D. Characteristic properties of series distributions. Proc. Nat. Inst. Sci. India 1949, 15, 109–113. [Google Scholar]
- Al-Shomrani, A.; Arif, O.; Shawky, A.; Hanif, S.; Shahbaz, M. Topp-Leone family of distributions: Some properties and application. Pak. J. Stat. Oper. Res. 2016, 12, 443–451. [Google Scholar] [CrossRef]
- Rezaei, S.; Sadr, B.B.; Alizadeh, M.; Nadarajah, S. Topp–Leone generated family of distributions: Properties and applications. Commun. Stat. Theor. Methods 2017, 46, 2893–2909. [Google Scholar] [CrossRef]
- Bantan, R.; Jamal, F.; Chesneau, C.; Elgarhy, M. A new power Topp–Leone generated family of distributions with applications. Entropy 2019, 21, 1177. [Google Scholar] [CrossRef]
- Ali, Z.; Ali, A.; Ozel, G. A modification in generalized classes of distributions: A new Topp–Leone class as an example. Commun. Stat. Theory Methods 2020, 50, 1–23. [Google Scholar] [CrossRef]
- Chesneau, C.; Sharma, V.; Bakouch, H. Extended Topp–Leone family of distributions as an alternative to beta and Kumaraswamy type distributions: Application to glycosaminoglycans concentration level in urine. Int. J. Biomath. 2021, 14, 2050088. [Google Scholar] [CrossRef]
- Eghwerido, J.T.; Agu, F.I. The statistical properties and applications of the alpha power Topp-Leone-G distribution. Heliyon 2022, 8, e09775. [Google Scholar] [CrossRef]
- Muhammad, M.; Liu, L.; Abba, B.; Muhammad, I.; Bouchane, M.; Zhang, H.; Musa, S. A new extension of the Topp–Leone-family of models with applications to real data. Ann. Data Sci. 2023, 10, 225–250. [Google Scholar] [CrossRef]
- Makubate, B.; Rannona, K.; Oluyede, B.; Chipepa, F. The Topp Leone-G power series class of distributions with applications. Pak. J. Stat. Oper. Res. 2021, 17, 827–846. [Google Scholar]
- Ali, M.; Ali, I.; Yousof, H.; Ibrahim, M. G Families of Probability Distributions: Theory and Practices; CRC Press: Boca Raton, FL, USA, 2023. [Google Scholar]
- Roozegar, R.; Nadarajah, S. A new class of Topp–Leone power series distributions with reliability application. J. Fail. Anal. Prev. 2017, 17, 955–970. [Google Scholar] [CrossRef]
- Condino, F.; Domma, F. A new distribution function with bounded support: The reflected generalized Topp-Leone power series distribution. METRON 2017, 75, 51–68. [Google Scholar] [CrossRef]
- Kunjiratanachot, N.; Bodhisuwan, W.; Volodin, A. The Topp-Leone generalized exponential Power series distribution with applications. J. Prob. Stat. Sci. (JPSS) 2018, 16, 197–208. [Google Scholar]
- Moakofi, T.B.; Oluyede, B.; Chipepa, F. Type II exponentiated half-logistic-Topp-Leone-G power series class of distributions with applications. Pak. J. Stat. Oper. Res 2021, 17, 885–909. [Google Scholar] [CrossRef]
- Chipepa, F.; Oluyede, B.; Wanduku, D.; Moakofi, T. The Exponentiated half Logistic-Topp-Leone-G power series class of distributions: Model, properties and applications. In Methods of Mathematical Modelling and Computation for Complex Systems. Studies in Systems, Decision and Control; Singh, J., Dutta, H., Kumar, D., Baleanu, D., Hristov, J., Eds.; Springer: Cham, Switzerland, 2022; Volume 373, pp. 341–374. [Google Scholar]
- Makubate, B.; Matsuokwane, M.; Gabaitiri, L.; Oluyede, B.; Chamunorwa, S. The type II Topp-Leone-G power series distribution with applications on bladder cancer. J. Nig. Soc. Phys. Sci. 2022, 4, 848. [Google Scholar] [CrossRef]
- Hausdorff, F. Set Theory, 2nd ed.; Chelsea Publication: New York, NY, USA, 1962. [Google Scholar]
- Sendov, B.L. Hausdorff approximations. In Mathematics and Its Applications; Springer Science & Business Media: Berlin/Heidelberg, Germany, 1990; Volume 50, pp. 1–367. [Google Scholar]
- Zaevski, T.; Kyurkchiev, N. On some composite Kies families: Distributional properties and saturation in Hausdorff sense. Mod. Stoch. Theory Appl. 2023, 10, 1–26. [Google Scholar] [CrossRef]
- Iliev, A.; Rahnev, A.; Kyurkchiev, N.; Markov, S. A study on the Unit–logistic, Unit–Weibull and Topp–Leone cumulative sigmoids. Biomath Commun. 2019, 6, 1–16. [Google Scholar] [CrossRef]
- Kyukchiev, N. Selected Topics in Mathematical Modeling: Some New Trends. Dedicated to Academician Blagovest Sendov (1932–2020); LAP LAMBERT Academic Publishing: Saarbrucken, Germany, 2020. [Google Scholar]
- Kyurkchiev, N. A new class of activation functions. Some related problems andapplications. Biomath 2020, 9, 2005033. [Google Scholar] [CrossRef]
- Kyurkchiev, N.; Iliev, A.; Rahnev, A.; Terzieva, T. Properties of a Power Topp-Leone G-family with baseline Gompertz cumulative distribution function. Int. J. Differ. Equ. Appl. 2020, 19, 1–14. [Google Scholar]
- Malinova, A.; Pavlov, N.; Terzieva, T.; Rahneva, O.; Kumaraswamy, C.D.F. On the “saturation” by the type II Topp–Leone transmuted inverted. Neural Parallel Sci. Comput. 2020, 28, 27–35. [Google Scholar]
- Vasileva, M.; Rahneva, O.; Malinova, A.; Arnaudova, V. The odd Weibull-Topp-Leone-G power series family of distributions. Int. J. Differ. Equ. Appl. 2021, 20, 43–58. [Google Scholar]
- Oluyede, B.; Dingalo, N.; Chipepa, F. The Topp-Leone-Harris-G family of distributions with applications. Int. J. Math. Oper. Res. 2023, 24, 554. [Google Scholar] [CrossRef]
- Ahmad, Z.; Mahmoudi, E.; Hamedani, G. A class of claim distributions: Properties, characterizations and applications to insurance claim data. Commun. Stat. Theory Methods 2022, 51, 2183–2208. [Google Scholar] [CrossRef]
- Kyurkchiev, N. Some intrinsic properties of Tadmor–Tanner functions: Related problems and possible applications. Mathematics 2020, 8, 1963. [Google Scholar] [CrossRef]
- Vasileva, M. Some notes on the Omega distribution and the Pliant probability distribution family. Algorithms 2020, 13, 324. [Google Scholar] [CrossRef]
- Kyurkchiev, N.; Rahneva, O.; Iliev, A.; Malinova, A.; Rahnev, A. Investigations on Some Generalized Trigonometric Distributions. Properties and Applications; Plovdiv University Press: Plovdiv, Bulgaria, 2021; ISBN 978-619-7663-01-3. [Google Scholar]
- Vasileva, M. Some notes for two generalized trigonometric families of distributions. Axioms 2022, 11, 149. [Google Scholar] [CrossRef]
- Vasileva, M. Approximation Problems and Applications; Plovdiv University Press: Plovdiv, Bulgaria, 2023; ISBN 978-619-7663-77-8. [Google Scholar]

Disclaimer/Publisher’s Note: The statements, opinions and data contained in all publications are solely those of the individual author(s) and contributor(s) and not of MDPI and/or the editor(s). MDPI and/or the editor(s) disclaim responsibility for any injury to people or property resulting from any ideas, methods, instructions or products referred to in the content. |
© 2023 by the author. Licensee MDPI, Basel, Switzerland. This article is an open access article distributed under the terms and conditions of the Creative Commons Attribution (CC BY) license (https://creativecommons.org/licenses/by/4.0/).