Article

Analysis of Fluctuating Antenna Beamwidth in UAV-Assisted Cellular Networks

Department of Computer Engineering, Gachon University, Seongnam-si 13120, Republic of Korea
*
Authors to whom correspondence should be addressed.
Mathematics 2023, 11(22), 4706; https://doi.org/10.3390/math11224706
Submission received: 11 September 2023 / Revised: 7 November 2023 / Accepted: 17 November 2023 / Published: 20 November 2023
(This article belongs to the Section Mathematics and Computer Science)

Abstract

:
This paper investigates a cellular network assisted by unmanned aerial vehicles (UAVs) in the presence of a fluctuating 3-dimensional (3D) antenna beamwidth. The primary objective is to perform an analysis of typical user equipment (T-UE) performance with a specific focus on coverage probability and spectral efficiency (SE) in the presence of fluctuations of 3D antenna beamwidth. Within this analytical framework, the macro base stations (MBSs) are meticulously characterized through the application of an independent 2D homogeneous Poisson point process (PPP), while the low-altitude platforms (LAPs) are described using an independent 3D PPP. The study entails the derivation of association probabilities, determining the likelihood of the T-UE associating with MBSs, line-of-sight LAPs, and non-line-of-sight LAPs. Through rigorous mathematical analysis, the paper formulates precise analytical expressions that encapsulate the association and coverage probabilities, taking into account the inherent variability in the UAV antenna beamwidth. This research focuses on a thorough performance evaluation of the T-UE across diverse network configurations, encompassing LAP density, the transmission power of LAPs, and the critical signal-to-interference ratio threshold. The outcomes of this study distinctly underscore the substantial disruptive impact resulting from fluctuating beamwidth on the performance of the T-UE within the UAV-assisted cellular network. Additionally, this performance is further impacted by larger densities and transmission power of the LAP. Hence, it is imperative to take into account the influence of these fluctuations on network association, coverage, and SE whenever contemplating a UAV-assisted cellular network.

1. Introduction

A cellular network is a system of wireless communications that separates a geographical region in multiple disjoint cells, each of which comprises of a cellular base station. Each of these base stations operates together to offer coverage of the system, allowing the subscribers to initiate connections and utilize data services in a given region. The groundbreaking advancements and services ushered in by cellular networks beyond the fifth generation (5G) are anticipated to trigger a significant surge in wireless systems, the data demands of smartphones, and the diversity of system connections. Projections indicate that by 2030, there will be an estimated 97 billion machine-type clients and 17.1 billion mobile clients worldwide [1].
The imminent and massive expansion in the scale and scope of cellular data networks is recognized as a potential source of challenges, including shortages in system capacity and degradation in coverage performance of cellular networks [2]. Therefore, to improve the reliability and ubiquitous coverage for the beyond-5G wireless networks, particularly in disaster-stricken scenarios such as earthquakes and tsunamis, where conventional infrastructure may be compromised, unmanned aerial vehicle (UAV)-assisted cellular communications is indispensable. Similarly, during temporary scenarios, such as establishing and managing remote COVID-19 quarantine stations, musical concerts, and sporting events, where traditional infrastructure is disrupted or not present and which demands increased capacity and ubiquitous coverage, the consideration of cellular networks assisted by UAVs or drones becomes pertinent [3,4,5,6].
The classification of UAVs entails assessing a variety of essential properties. These characteristics include the UAV’s dimensions and mass, flying settings, payload ability, endurance with regard to the duration of flying, and highest achievable altitude. It is also critical to evaluate the amount of independence of a UAV, its embedded sensing devices, the efficacy of connectivity networks, and the involved management processes. UAVs perform a variety of functions in fields such as photographing from above, agriculture, surveillance, and warfare. As UAV advancements occur, they have improved their effectiveness and usefulness across several fields.
UAV-assisted cellular networks consist of macro base stations (MBSs) and UAVs, such as low-altitude platforms (LAPs). Typically, LAPs are characterized by lower payloads, endurance capabilities, and batteries, and they conventionally operate at lower altitudes, enabling rapid deployment at reduced costs while offering improved line-of-sight (LOS) links [7,8]. The quality of wireless communication links between a typical user equipment (T-UE) and either the LOS LAP or the non-LOS (NLOS) LAP can significantly influence network performance, impacting aspects such as device association, coverage, and spectral efficiency (SE). Consequently, examining the probability of T-UE association, coverage, and SE with the MBS, LOS LAP, and NLOS LAP links is crucial and a challenging task in UAV-assisted cellular networks. In this regard, several researchers have focused their efforts on evaluating and improving the T-UE’s coverage and SE performance for UAV-assisted cellular networks [9,10,11].

1.1. Poisson Point Processes and Their Applications

The assessment of a T-UE’s performance can be characterized using tools from the stochastic geometry. Employing stochastic geometry tools is a fundamental approach in modeling the base stations with a Poisson point process (PPP). Few of the applications of PPPs in the context of wireless networks consider the modeling of base stations as a PPP and are described in the following.

1.1.1. Applications of PPP in Device-to-Device Communications

The performance of a user equipment in device-to-device communications has been investigated in [12] by modelling the base stations and the user devices using PPP. The authors characterized the interference for the half- and full-duplex channels and improved the networks’ performance in terms of their data rates. Similarly, the authors of [13] investigated the user equipment’s performance in device-to-device communications. The authors modeled the base stations and users using PPP and derived the cumulative distribution function (cdf) for Nakagami and Rayleigh fading channels in terms of the transmission power.

1.1.2. Applications of PPP in Vehicular Communications

The performance of a user device in cellular-assisted vehicular communications is characterized in [14]. The authors modeled cellular base stations using PPP and improved the networks’ coverage as well as spectrum efficiency performance in the presence of vehicular, cellular, and jamming interference. Similarly, the authors of [15] considered UAV-assisted vehicular communications and focused on the vehicular nodes’ offload tasks to improve the network’s delay. Their research investigated the network’s computational capacity by modeling the vehicular base stations using PPP.

1.1.3. Applications of PPP in Cellular Communications

The performance of a user device in cellular communications is characterized in [16,17]. The authors considered cellular base stations as points and modeled them using PPP. The PPPs have the qualities of randomness (i.e., base stations can be placed randomly in the region of interest), independence (i.e., base stations assume no inter-dependence), stationarity (i.e., base station location does not depend upon time), homogeneity (i.e., base station placement is independent in the region of interest), and the density factor, λ , that governs the intensity of base stations in the region of interest. Modeling cellular base stations with a PPP entails determining a suitable setting for the density of base stations (i.e., λ ) and producing randomized base station configurations depending on this attribute.
The orientation of the main lobe of the antenna plays a crucial role in shaping the network’s performance. Recent research [18,19,20,21] has focused on the main lobe’s beamwidth of the antenna by modelling LAPs and MBSs as a three-dimensional (3D) PPP and a 2D PPP, respectively. These investigations showed that the network’s performance is severely influenced when the main lobe of the 3D beamwidth of the antenna is narrow. Typically, the side-lobe of the antenna can also influence the network’s performance [22,23]. System designers use a variety of practical approaches to reduce the adverse effects of the side-lobes of the antennas on the network’s performance. Side-lobe suppression is one of these solutions, which uses the reduced signal of side-lobes, thereby minimizing the disruption that they cause [24]. Furthermore, spatial interference management strategies are used to exploit modern beam forming, which allows the directing of the primary signal of the main beam towards the intended T-UE while simultaneously canceling interference from unwanted angles. Moreover, synchronized deployment of base stations along with frequency planning also helps in the goal of minimizing side-lobe interference in general.

1.2. Motivation and Challenge

A T-UE’s performance, considering a 3D beam forming antenna, has been characterized for a UAV-assisted cellular network in [18]. The authors in their analysis evaluated multiple integrals for computing the network’s coverage performance by considering that the T-UE has the ability to associate, connect, and communicate to MBSs, LOS LAPs, and NLOS LAPs with a 3D beam forming antenna and showed that the 3D beamwidth of the antenna should be carefully characterized for the network’s coverage performance. However, this performance is severely affected when the 3D beamwidth of the antenna fluctuates due to strong winds, high atmospheric pressure, etc. [25,26,27,28]. Therefore, the performance characterization of a UAV with a fluctuating 3D antenna beamwidth is crucially important but is not evaluated in the literature as it is a challenging task that involves multiple complex integral derivations. To this end, this paper is focused on evaluating the performance of UAV-assisted cellular networks, with a particular emphasis on a significant performance degradation factor, such as the 3D beamwidth of the UAV’s antenna. More specifically, the paper explores the role of the UAV’s 3D beamwidth on the association, coverage, and SE performance of the user’s device connected to MBS, LOS LAP, and NLOS LAP.
The rest of the article is structured as follows. In Section 2, we review recent work on cellular networks assisted by UAVs. Section 3 outlines the system model for UAV-assisted cellular networks. Section 4 provides probability density and cumulative distribution functions. Section 5 focuses on the likelihood of association of the MBS, LOS LAP, and NLOS LAP. In Section 6, we delve into analyzing the interference of MBSs, LOS LAPs, and NLOS LAPs. Section 7 is dedicated to the performance analysis of the T-UE, with a focus on coverage and SE. Section 8 presents the results and offers a discussion. Finally, in Section 9, we draw conclusions from the findings presented in this paper.
A nomenclature of important quantities used in this paper is given in Table 1.

2. Related Works

The performance of a UAV-assisted cellular network has been characterized by modeling the base stations using PPP. The researchers in [10,29,30,31] modeled UAV-assisted cellular networks that focused on the use of intelligent reflecting surfaces to improve network coverage. In their models, cellular base stations are characterized as a 2D PPP, while UAVs are characterized as a 3D PPP. The research has examined connectivity and coverage performance, demonstrating enhanced network performance when UAVs are equipped with intelligent reflecting surfaces. Additionally, in a similar vein, the study conducted in [5] focused on modeling non-orthogonal multiple access within a UAV-assisted cellular network. The authors adopted a framework where base stations and UAVs follow 2D and 3D PPPs. Their efforts resulted in improved coverage for the T-UEs in the network. In [32], the authors presented an overview of multiple security threats alongside their mitigation techniques for UAV communications. Additionally, the authors presented several studies that indicated the usage of PPP for modeling the base stations.
Performance evaluations of cellular networks assisted by UAVs have been primarily centered on the alleviation of data traffic congestion within overloaded networks [33,34]. In these investigations, the authors employed a modeling approach, wherein ground-based stations and aerial base stations were characterized using 2D PPPs and 3D PPPs, respectively. The results of these studies demonstrated that the network’s performance could be significantly enhanced through effective data offloading from overloaded cells. Similarly, in the works presented in [35,36,37,38], the focus was on modeling a UAV-assisted network, with a specific emphasis on enhancing the energy efficiency of T-UEs. The authors accomplished this by employing a modeling framework that represented cellular base stations as 2D PPPs and UAVs as 3D PPPs, resulting in notable improvements in the network’s overall energy efficiency. Furthermore, the research carried out in [39,40,41,42] introduced a method of network performance enhancement by modeling the base stations using PPP and considering decoupled access for the T-UEs associated with downlinks and uplinks with the nearby base stations. However, it is vital to remember that in all of the preceding research initiatives, the critical aspect of accounting for the fluctuating 3D beamwidths of antennae due to UAV vibrations in the context of UAV-assisted cellular networks remained unexplored. Table 2 presents a concise overview of recent works by focusing on the network model, as well as the outcomes and constraints of the studies.
The alignment and instability of antennas represent a pivotal determinant of network performance. In recent scholarly studies, as evidenced in references such as [18,19,20,21], researchers have undertaken the modeling of antenna beamwidth orientation for MBSs and UAVs (LAPs in a 3D setting and MBSs in a 2D setting). These investigations have elucidated that a network’s performance can witness enhancements when antennas feature a narrower beamwidth. However, it is imperative to underscore that these studies have omitted the examination of network performance within the context of fluctuating beamwidths. Such fluctuations, often attributable to factors such as robust winds, variations in air pressure, or the noise emanating from mechanical components engaged in the control of UAVs, remain unaddressed.
In contradistinction, research endeavors conducted by [25,26,27,28] have predominantly concentrated on the analysis of antenna beamwidth fluctuations within the domain of mm-wave communications for aerial networks. These inquiries have brought to light the detrimental impact of antenna variances on the effectiveness of a T-UE. Nevertheless, it is prudent to acknowledge the inherent limitations of these studies as they do not encompass an exploration of the probabilities associated with network connectivity, coverage, or spectrum efficiency for a T-UE linked with MBS, LOS LAP, and NLOS LAP when subject to the influence of fluctuations in the 3D beamwidths of the antenna. Therefore, this paper addresses the investigation of a cellular network assisted by UAVs encompassing fluctuating antenna 3D beamwidths. It conducts a comprehensive examination of T-UE performance, specifically focusing on the analysis of association probability, coverage probability, and SE.
Our work distinguishes itself from recent studies in the following aspects:
  • In the works conducted by [25,26,27,28] in 2022, the authors considered a fluctuating 3D beamwidth and meticulously modeled their UAV antenna’s orientation. Their research focused on the analysis of the fluctuating 3D beamwidth in aerial networks and investigated network performance by evaluating complex multiple integrals. Their research revealed that beamwidth fluctuations introduced inaccuracies in the UAV antenna alignment for aerial networks. However, this paper encompasses the analysis of fluctuations of the antenna 3D beamwidth for a UAV-assisted cellular network, which is un-explored previously, as it involves the complexity of addressing fluctuating beamwidth and involves intricate integrals, which restricted other researchers from performing this analysis. Thus, the contribution of this paper diverges from the above-mentioned studies in significant ways. Here, we derive the association probability, coverage probability, and SE for a T-UE connected to MBS, LOS LAP, and NLOS LAP in the presence of fluctuating 3D beamwidth by solving complex multiple integrals.
  • In the study presented in [48], the focus was on modeling a U-V2X network utilizing square array antennas while taking into account fluctuations in the 3D beamwidth. However, in the context of this paper, our investigation centers on a UAV-assisted cellular network.
  • In the research presented in [18], the authors constructed a model for a UAV-assisted network utilizing conical directional antennas. They assessed the outage performance of a T-UE in this context but did not account for UAV fluctuating beamwidths. In contrast, this paper adopts a different approach. We model a UAV-assisted cellular network by employing square array antennas while considering fluctuating beamwidths. Furthermore, our analysis include assessments of the association probability, coverage probability, and SE.
The following are the paper’s unique contributions:
  • An extensive architecture of a cellular network assisted by a platform of UAVs is investigated in the presence of a fluctuating beamwidth in terms of association probability, coverage probability, and SE.
  • The analytical expressions of association probability and coverage probability considering a fluctuating beamwidth for a T-UE linked with MBS, LOS LAP, and NLOS LAP are derived.
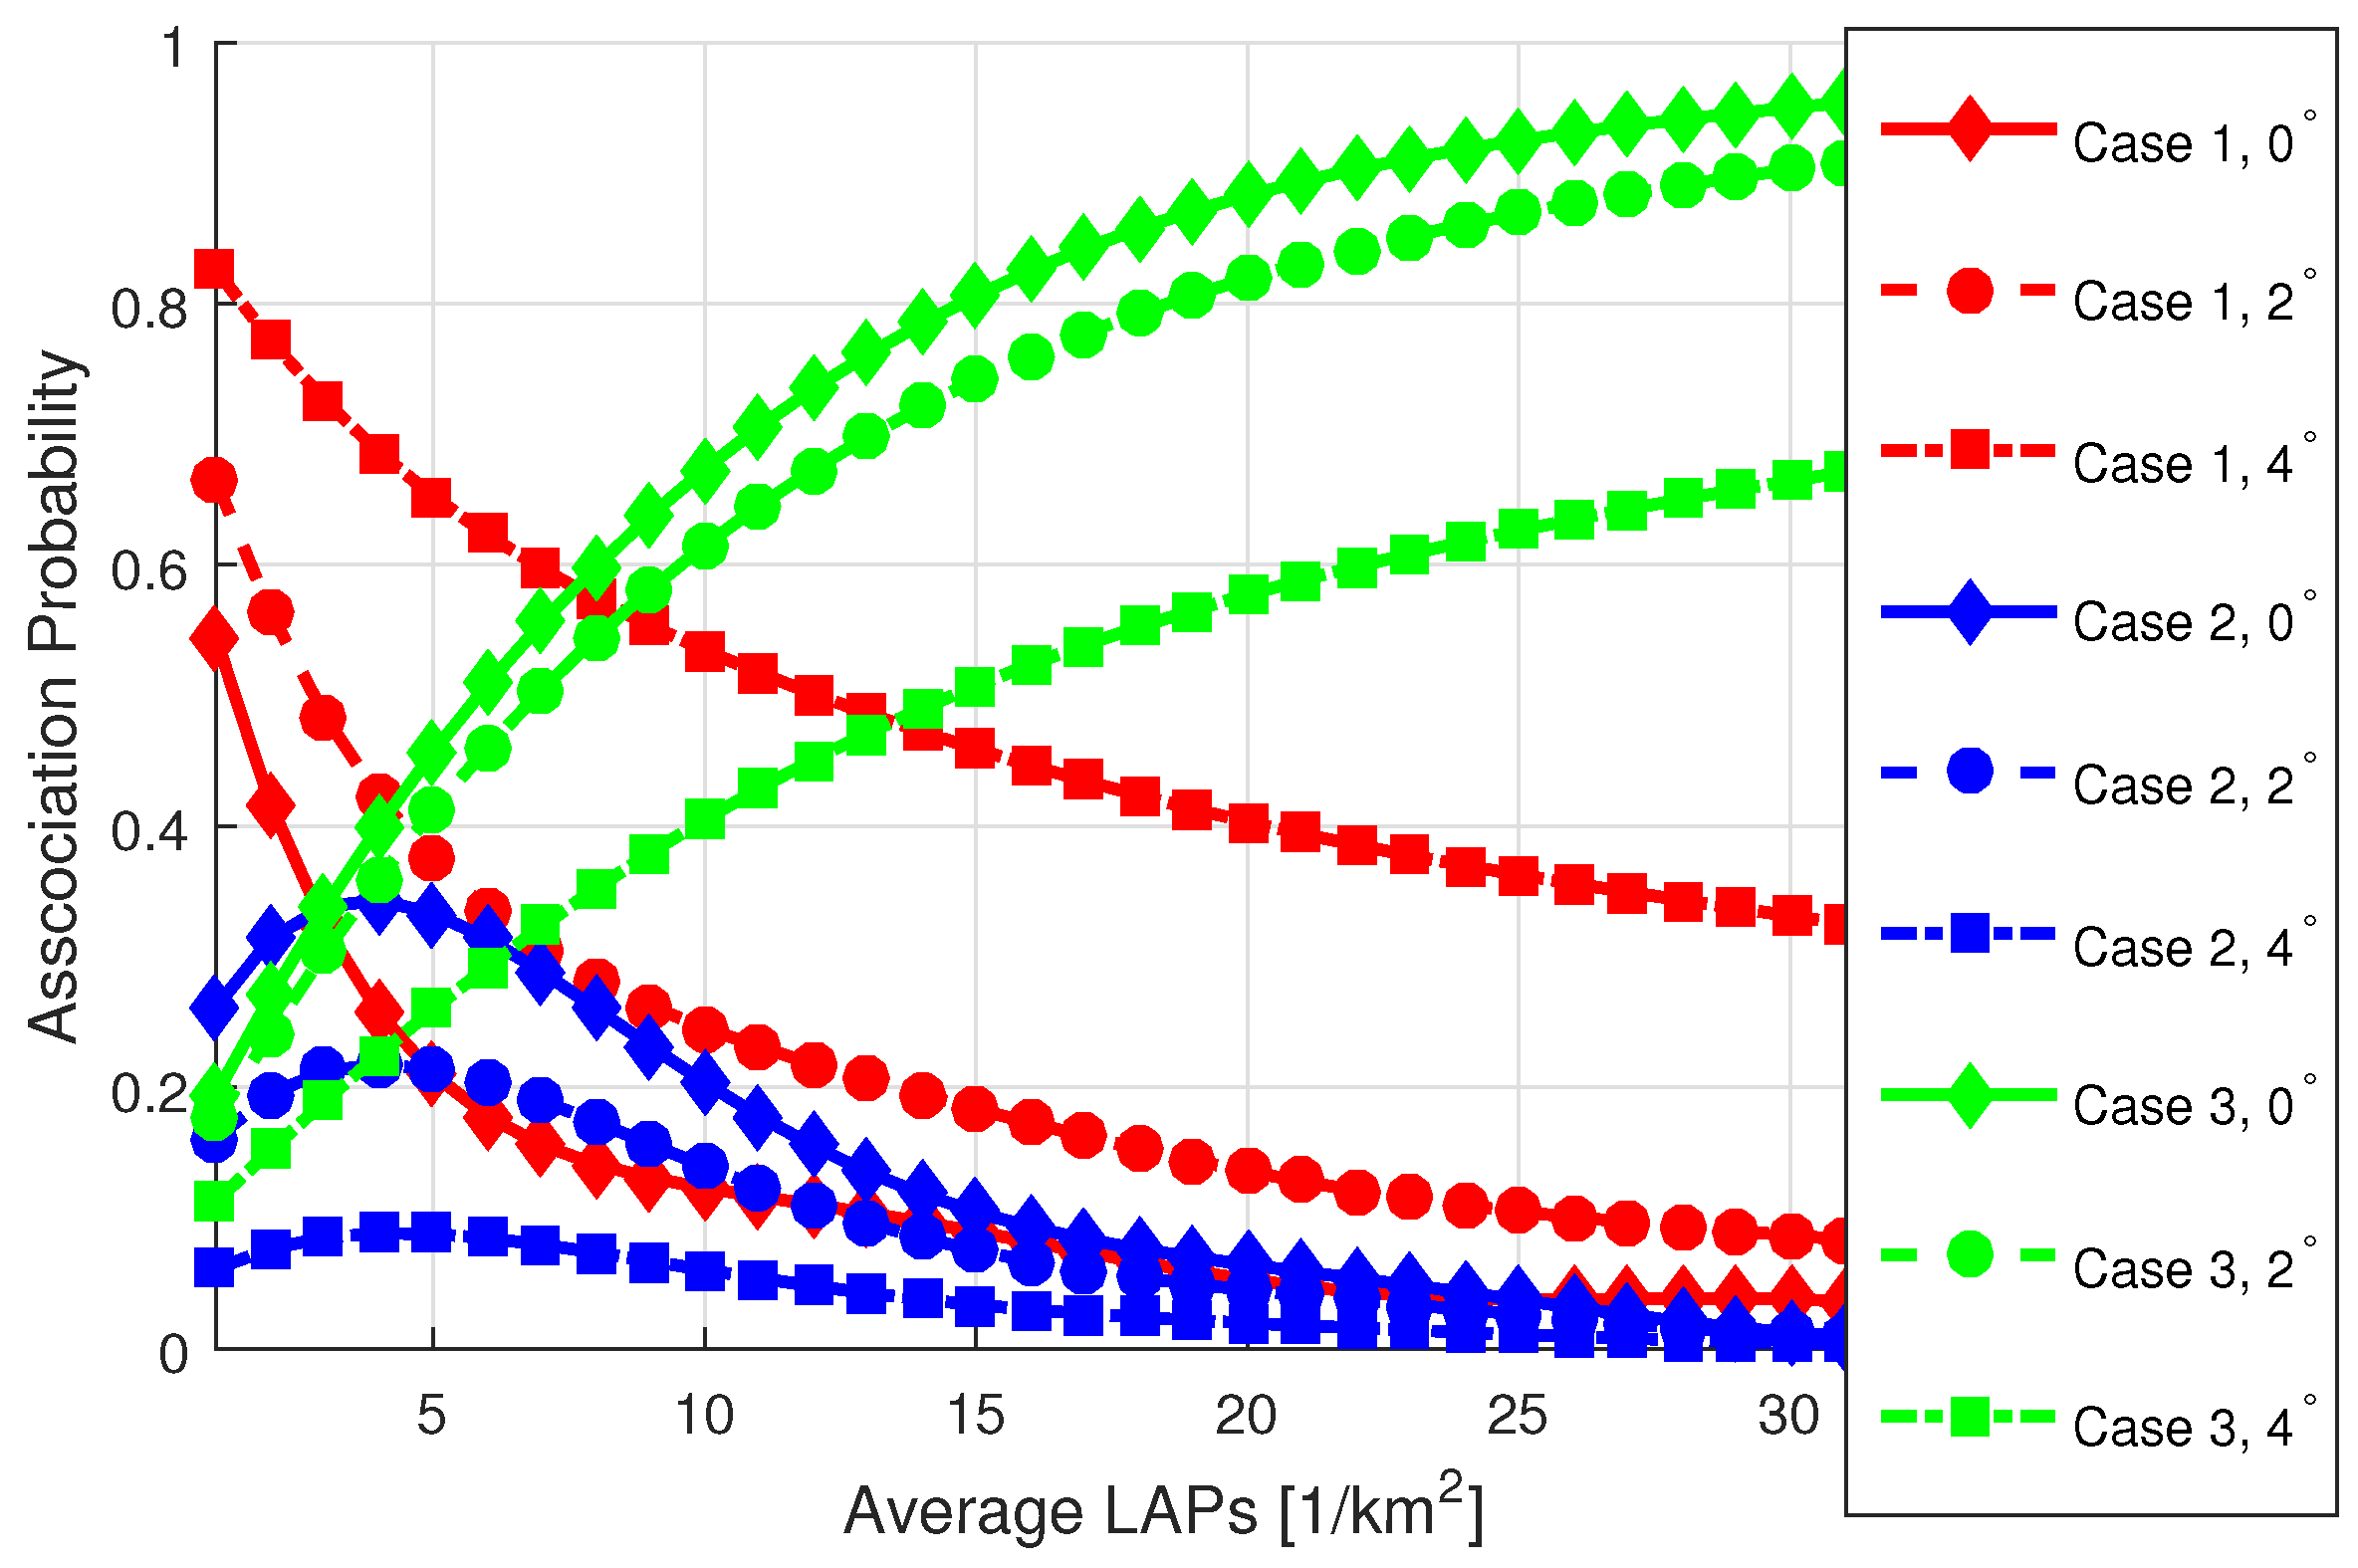
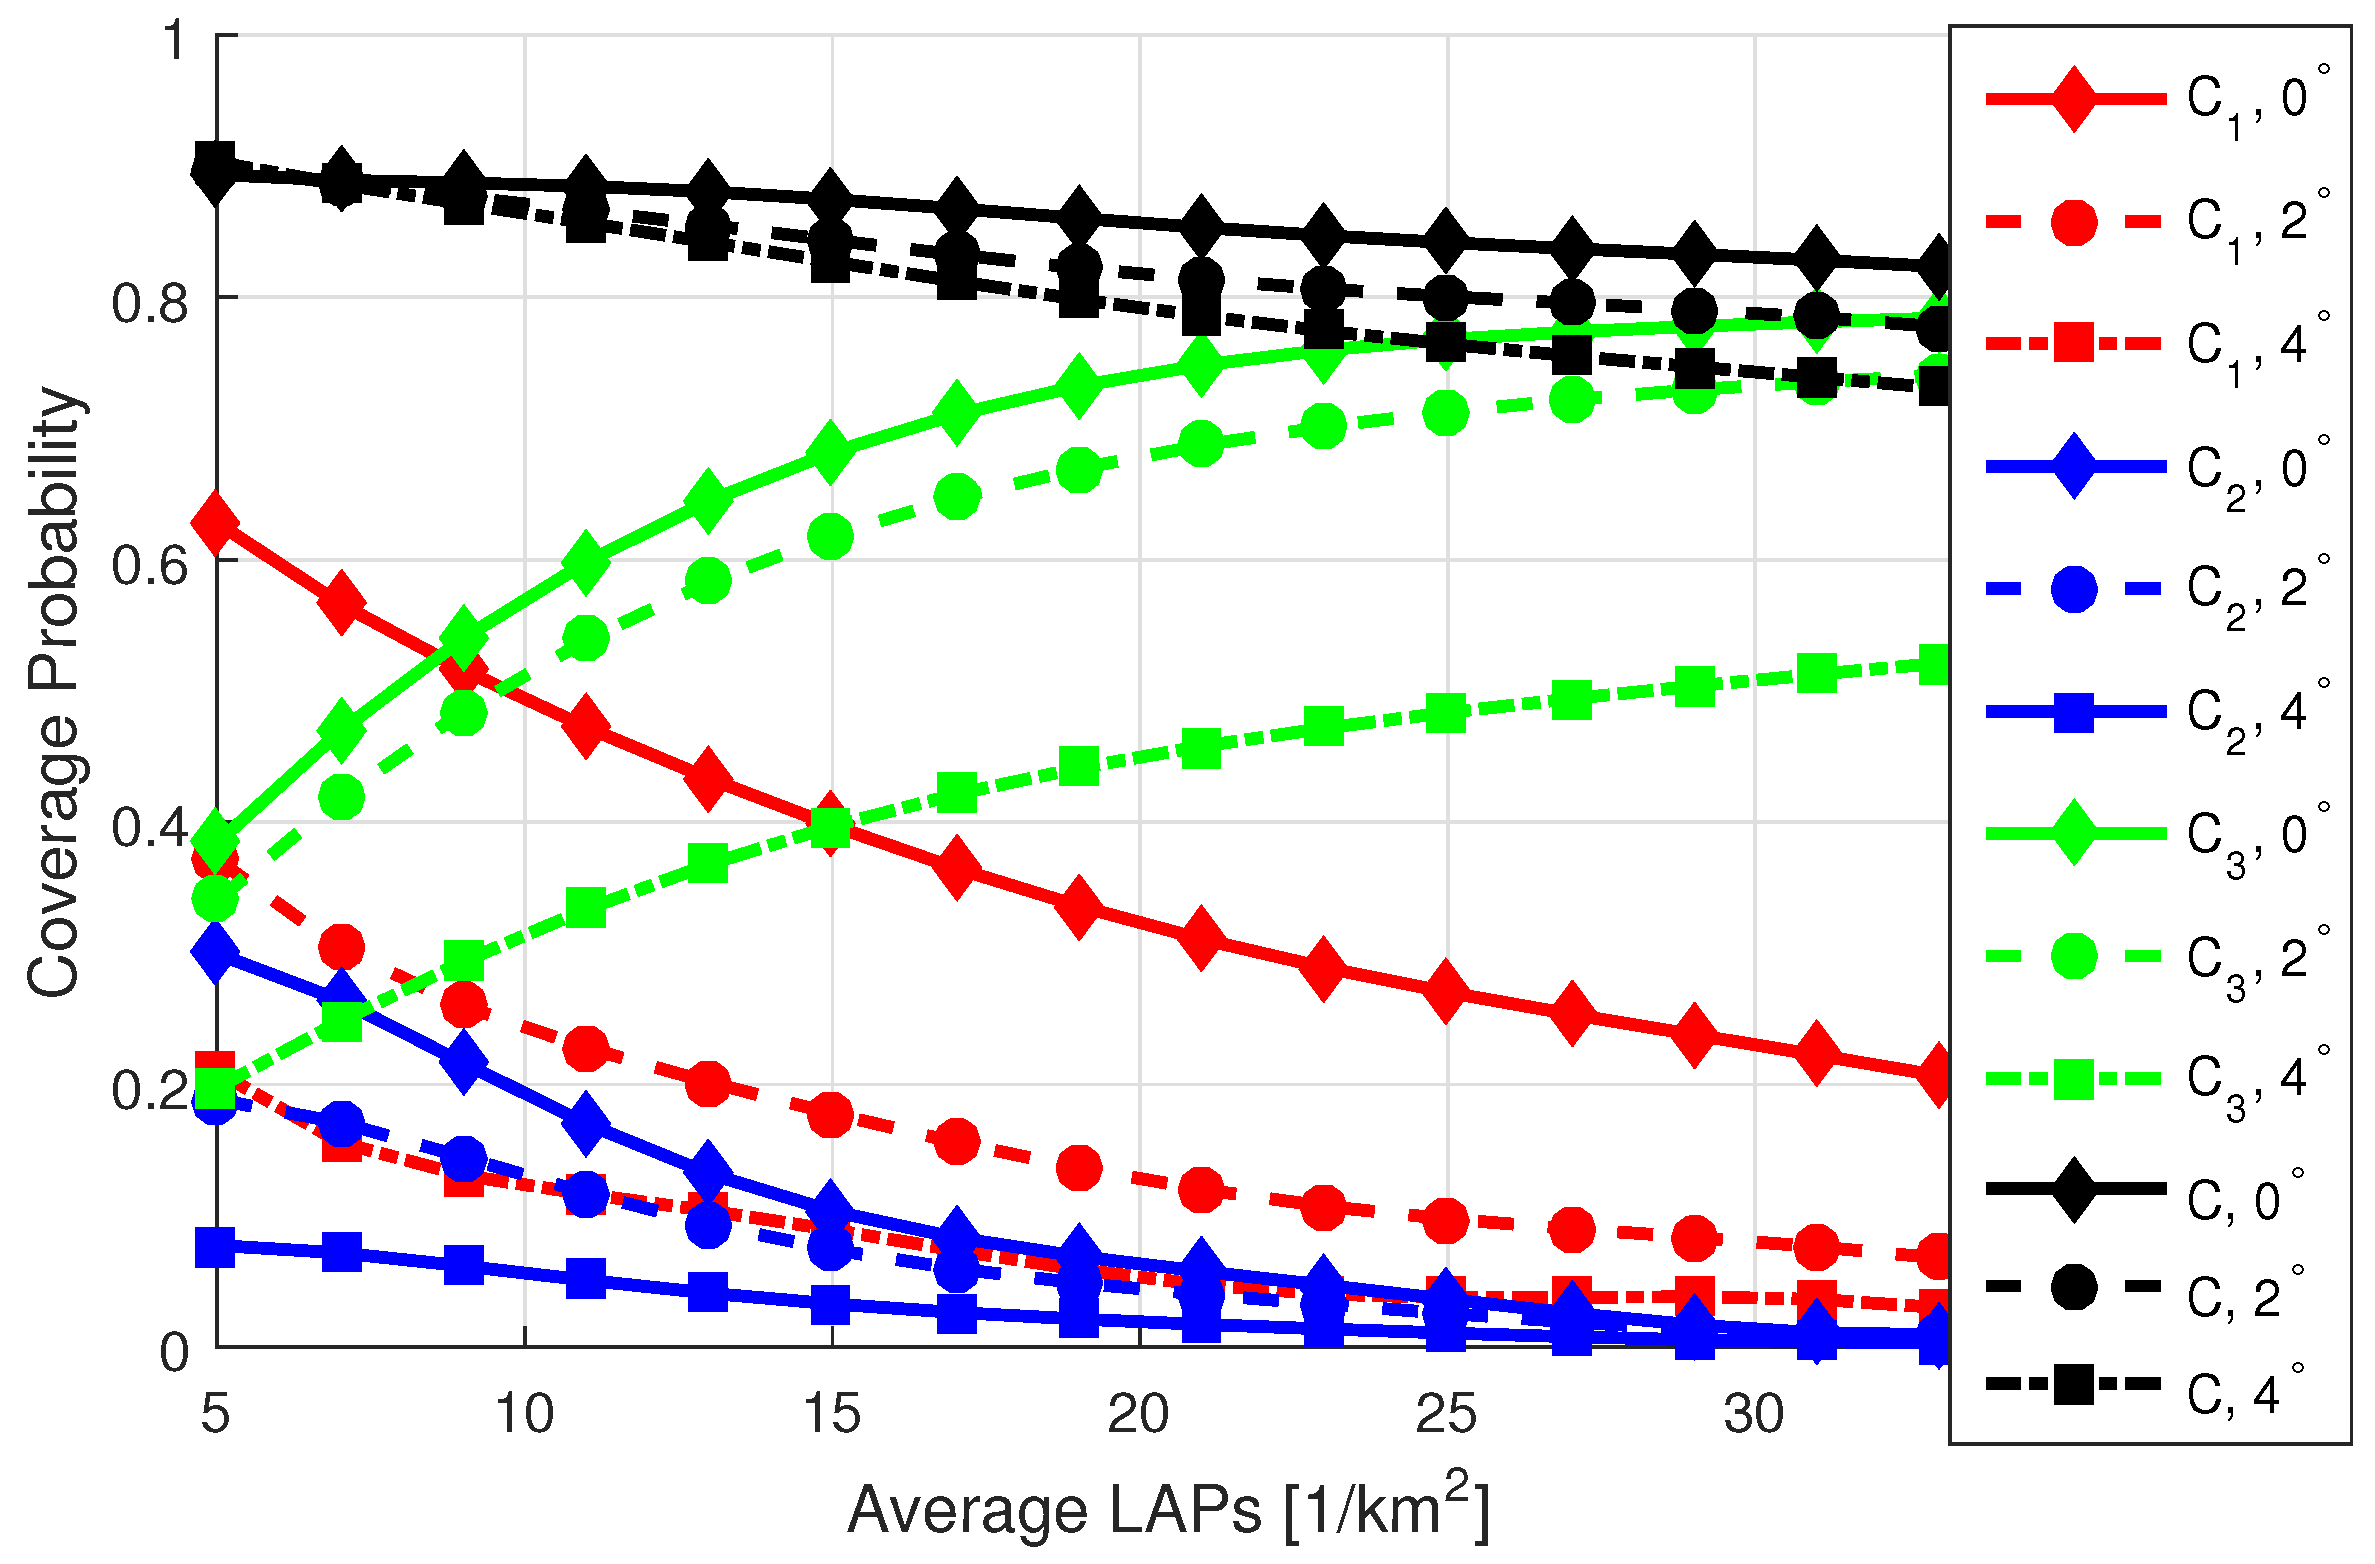
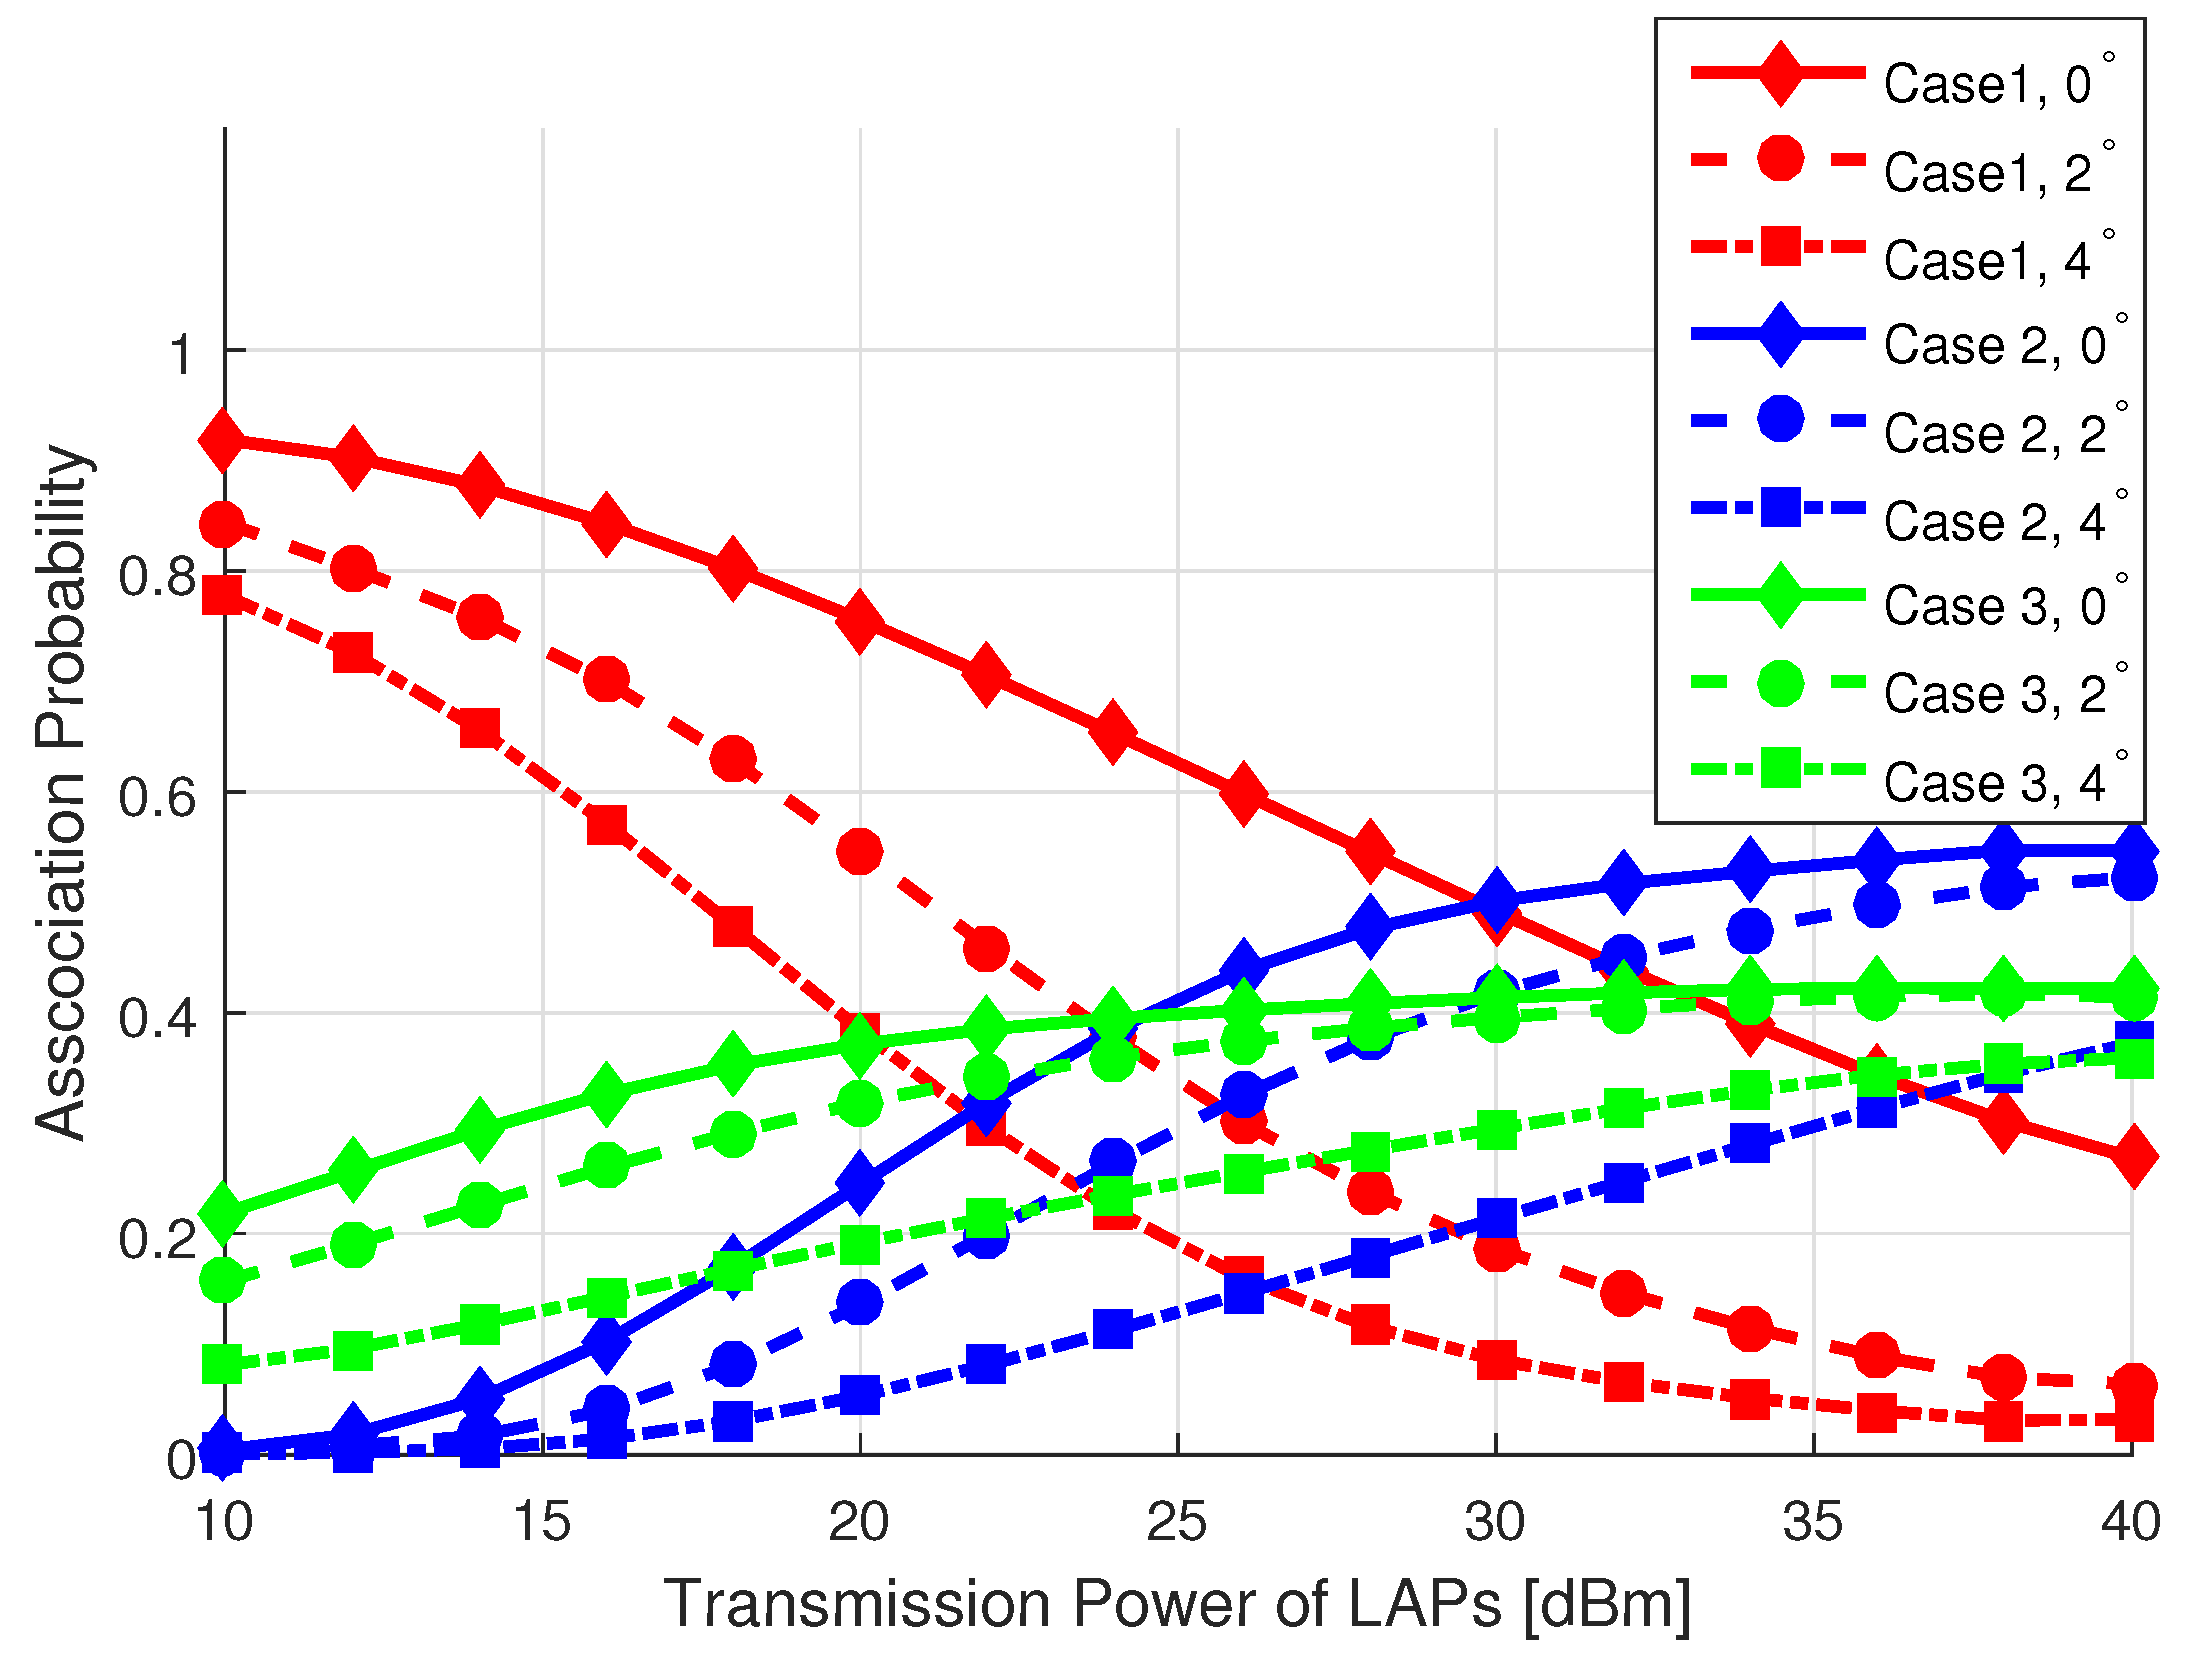
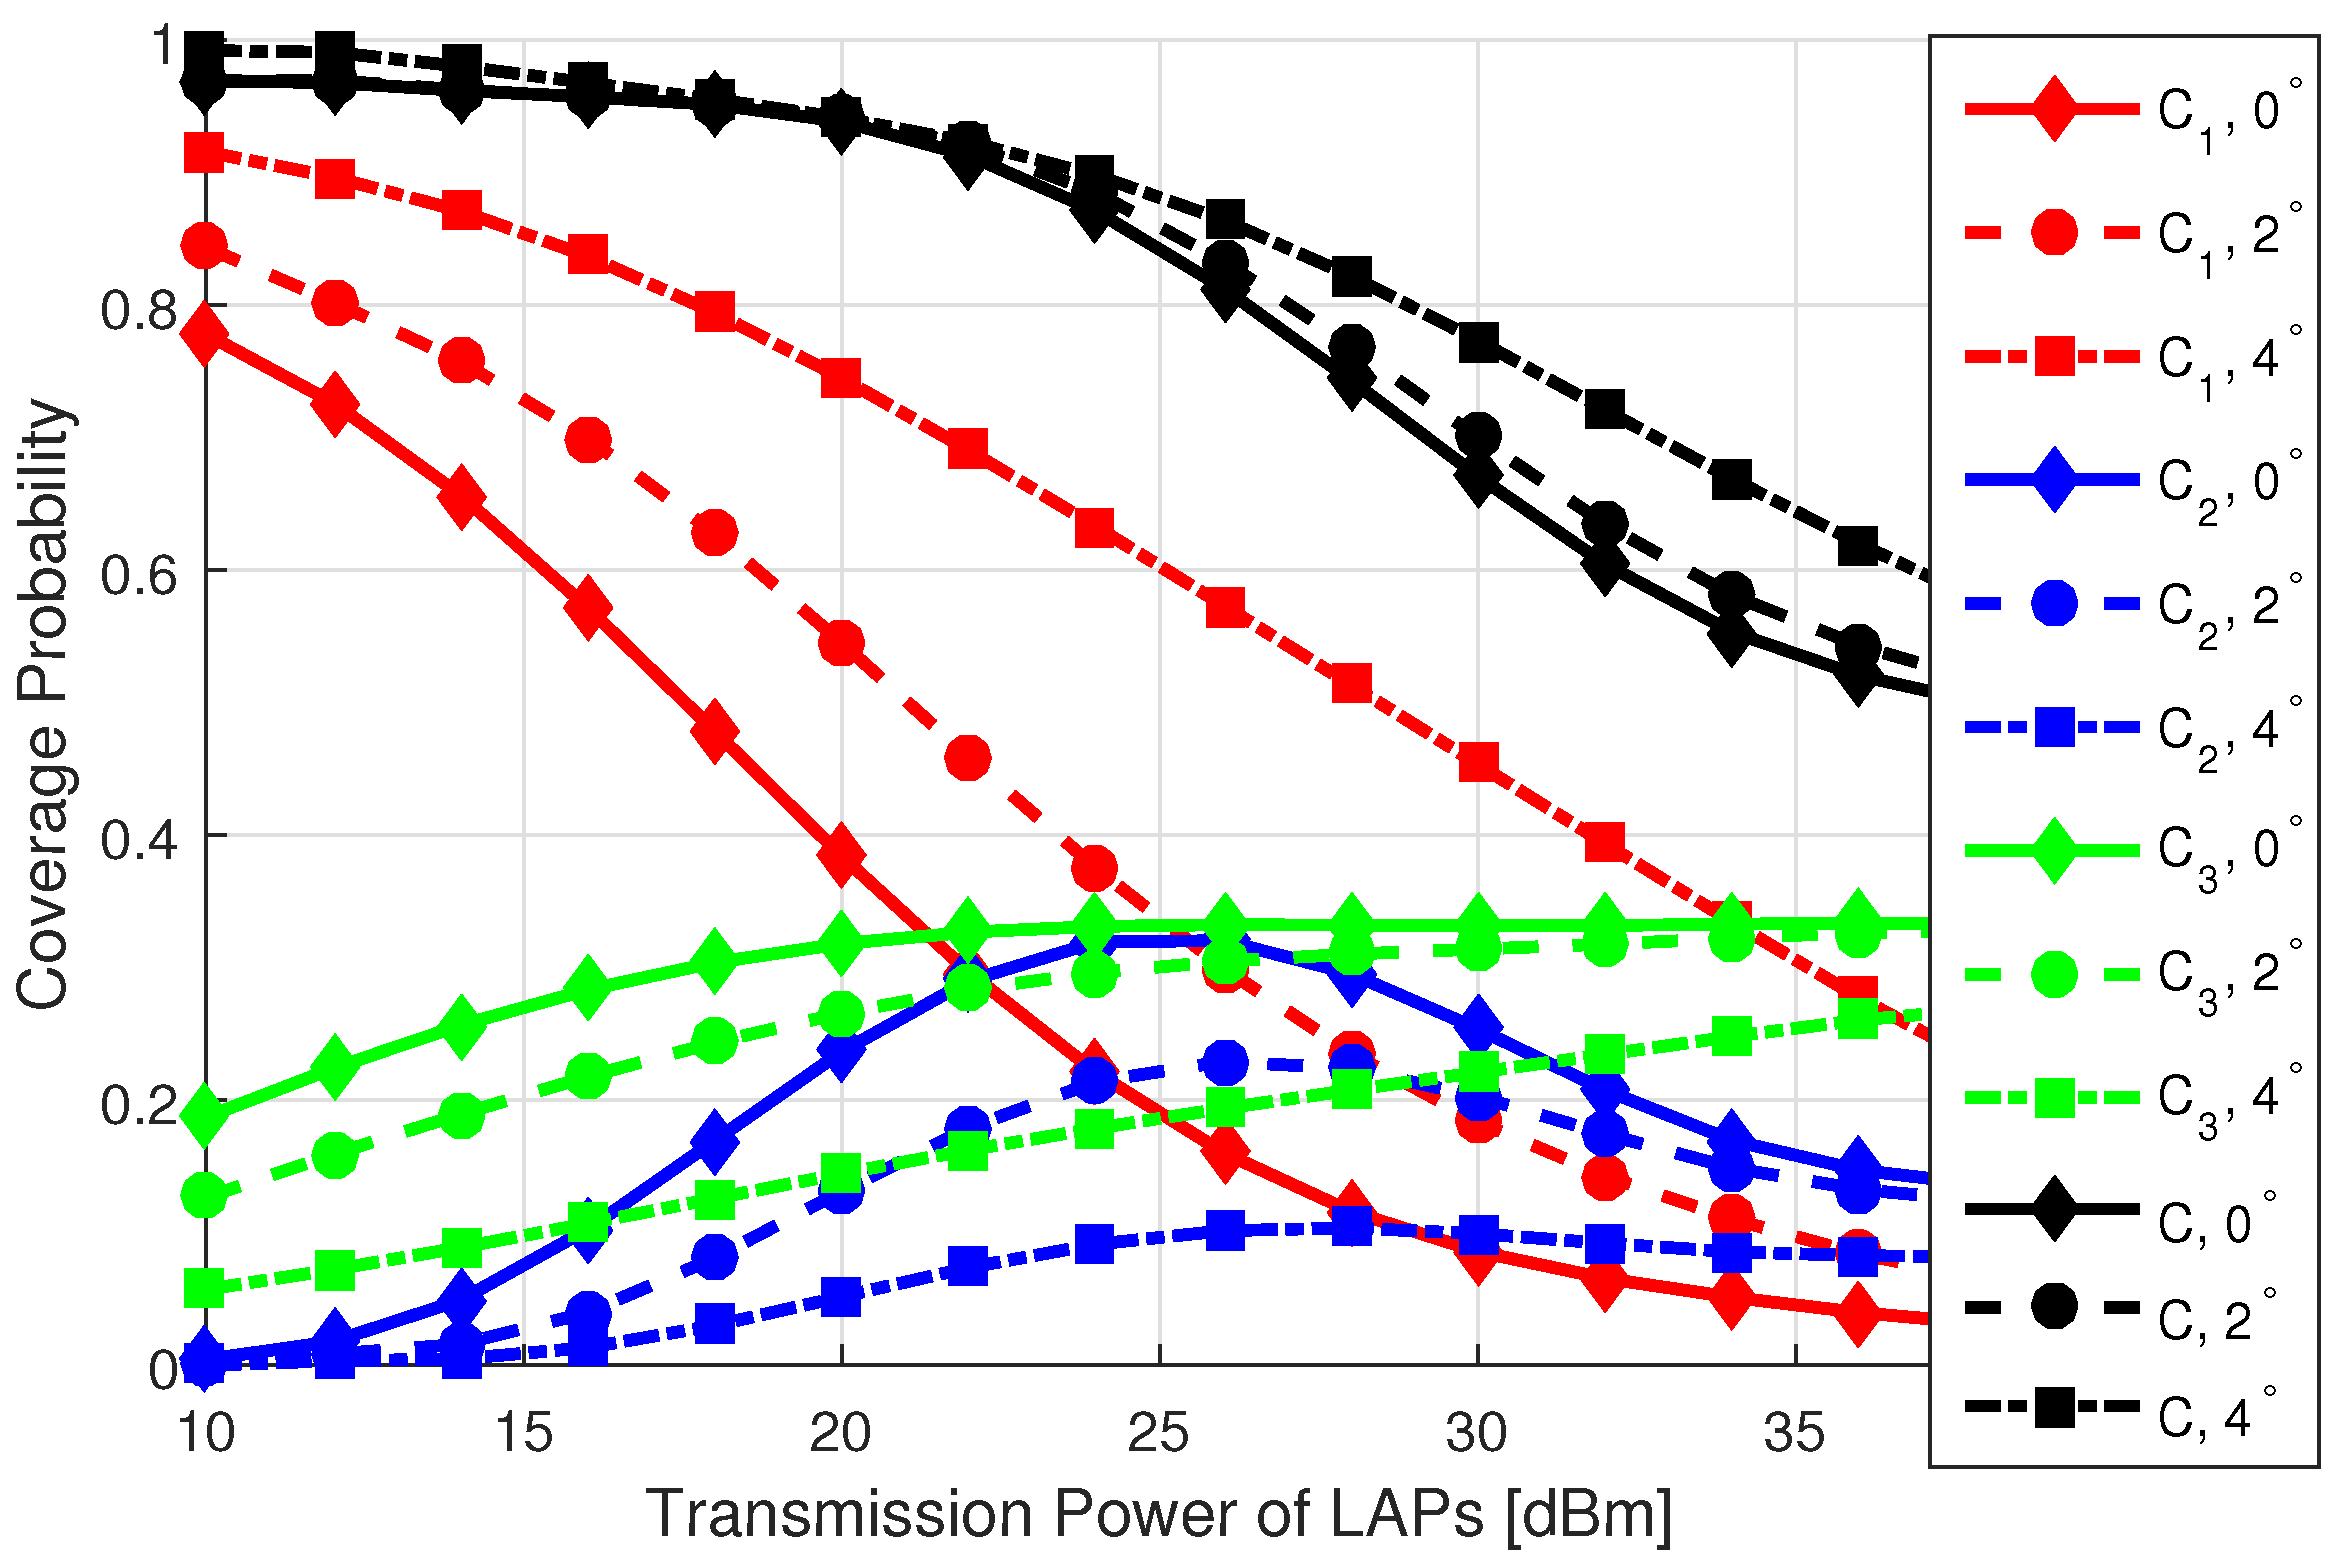
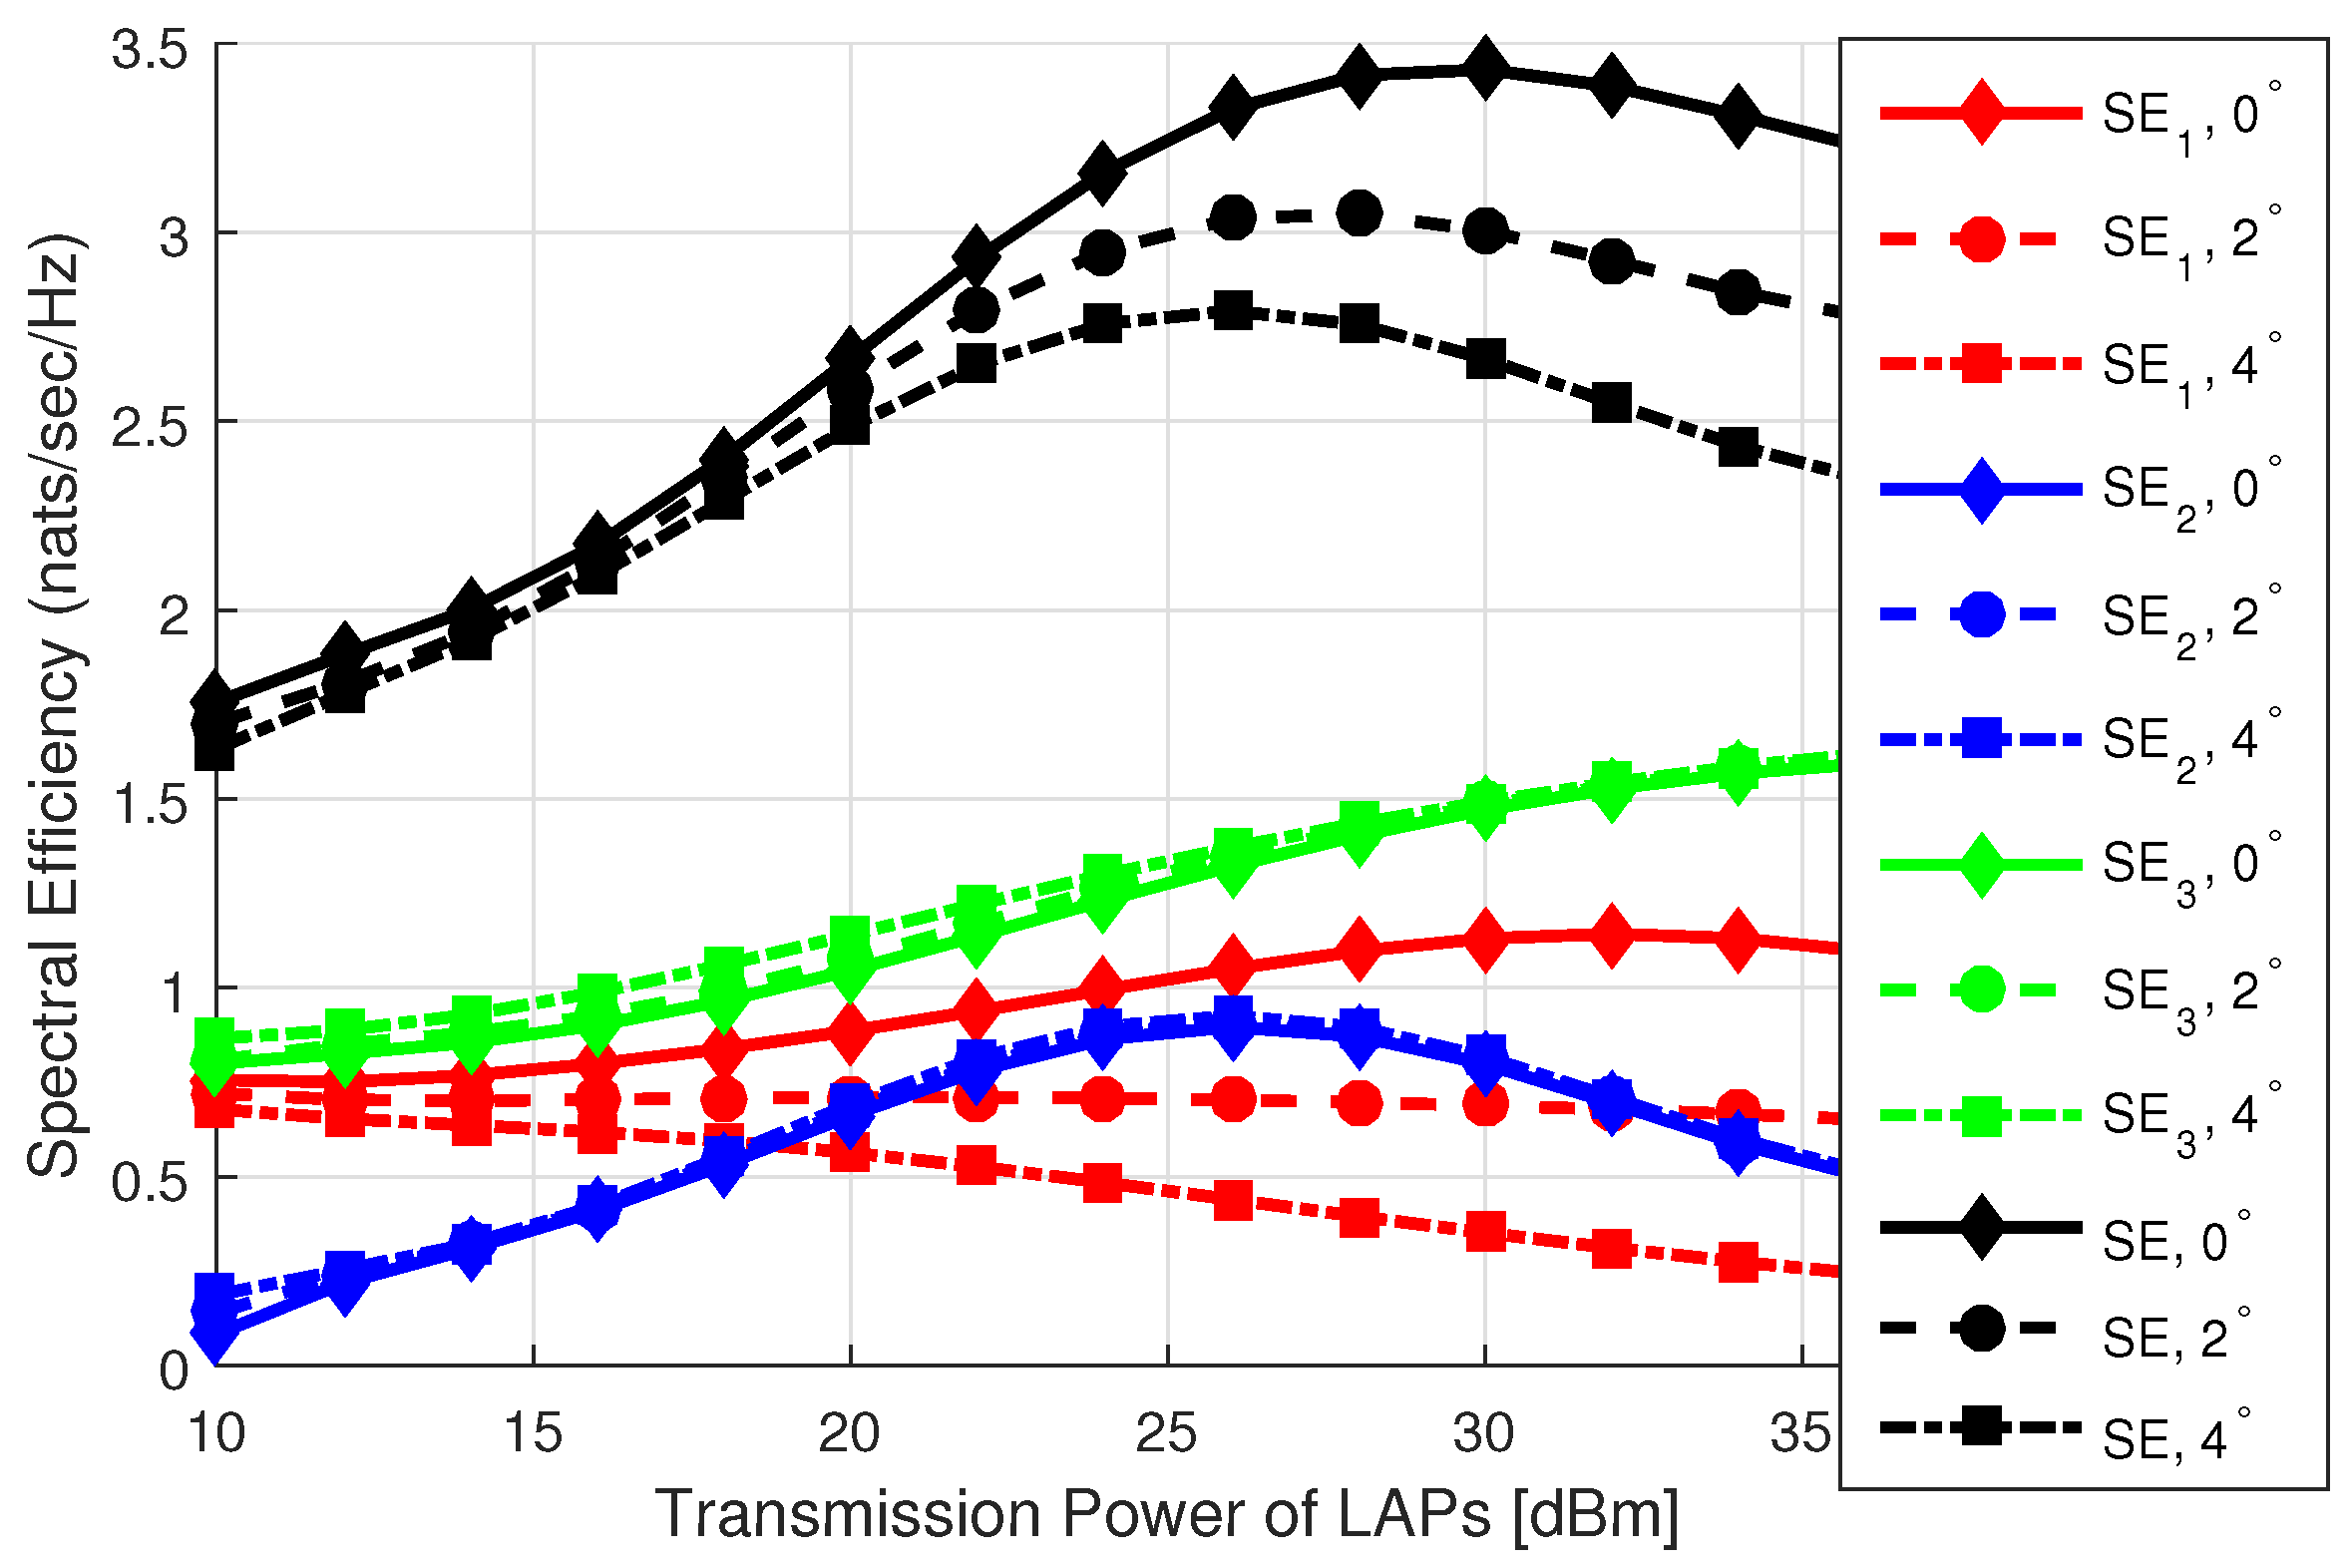
  • The coverage and SE performance of a T-UE linked with MBS, LOS LAP, and NLOS LAP is analyzed for various network settings, such as LAP density, LAP transmission power, and SIR threshold.
  • The findings from our analysis demonstrate a substantial degradation in the performance of thr T-UE within a UAV-assisted cellular network as fluctuations in the 3D antenna beamwidth increase. Furthermore, this adverse impact is exacerbated in scenarios characterized by higher densities of LOS LAPs and increased transmission power levels.

3. System Model

3.1. Network Deployment

A UAV-assisted cellular network consisting of MBSs and LAPs is considered as shown in Figure 1. The LAPs are modeled according to an independent 3D PPP, Φ U , with the density and height of LAPs given as λ U and h U , respectively. The MBSs have been represented using a 2D PPP, Φ M , with the density of MBSs given as λ M . The set of MBSs and LAPs is given as M = { 0 , 1 , 2 , , n 1 } and L = { 0 , 1 , 2 , , l 1 } . The number of MBSs in the 2D space are given by n, and the number of LAPs in the 3D space are given by l. The transmission power of the LAPs and MBSs is given as P U and P M , respectively. The path loss exponent associated with the MBSs, LOS LAPs, and NLOS LAPs is given as α M , α L , and α N , respectively, and the supplementary path loss associated with the MBSs, LOS LAPs, and NLOS LAPs is given as K, η L , and η N , respectively. The channel gain between a T-UE and an MBS is given as g M and follows the Rayleigh fading assumption, i.e., g M exp ( 1 ) . The channel’s gain across a user and the platform at the LOS is specified as g L , while the channel’s gain across a user and the platform at the NLOS is indicated as g N following the Nakagami m fading channel assumption with fading parameters m L and m N , respectively. A user is put at the geographic center of the coordinate framework without losing generalization. Based on Slivnayk’s theorem, if only one point is positioned in the exact center of the geographic coordinate system, the pattern of distribution remains identical [49].

3.2. Antenna Gain

The 3D gain for an N Q × N Q square antenna related to a set of antennas is indicated as G Q . In this case, Q can represent both the transmitting and receiving nodes, T and R, such that { T , R } { M B S ( M ) , L O S L A P ( L ) , N L O S L A P ( N ) } . The angular deflection of the antenna’s primary lobe in the elevation and azimuth directions is denoted by the symbols θ and ϕ . The antenna gain formulation is G Q = G Q , O · G Q , E ( θ , ϕ ) · G Q , A ( N Q , θ , ϕ ) , where G Q , O indicates the best gain possible within the main beamwidth. Additionally, G Q , A quantifies the enhancement supplied by the array of the respective antenna, whereas G Q , E describes the increase for a single component of the respective antenna. Similar to [22,45], this paper considers that the effect of the main lobe’s antenna gain is very large as compared to the side lobe’s antenna gain, and the impact of the side-lobe level of the antenna on the performance of the system is negligible.
For a constant-magnitude excitation, the antenna array component is presented as:
G Q , A ( N Q , θ , ϕ ) = sin N Q κ x ψ x χ x + Δ x 2 N Q sin κ x ψ x χ x + Δ x 2 sin N Q κ y ψ y χ y + Δ y 2 N Q sin κ y ψ y χ y + Δ y 2 2 .
In this context, χ x = sin ( θ ) cos ( ϕ ) and χ y = sin ( θ ) sin ( ϕ ) ; the equality κ x = κ y represents the wave number, calculated as 2 π f c , where f c denotes the frequency. Additionally, for the x-axis, the plate width is characterized by ψ x = c / 2 f c , while the progressive phase shift is denoted by Δ x = 0 . Similarly, for the y-axis, the plate width is defined as ψ y = c / 2 f c , and the progressive phase shift is expressed as Δ y = 0 . Here, c corresponds to the speed of light.
The enhancement in the gain for the respective single elements of the particular antenna can be described as [50]
G Q , E ( θ , ϕ ) = G E max min { G ( θ E ) + G ( θ x ) , η ¯ } ,
where G = min 12 θ E 90 V 2 , ζ ¯ and G = min 12 θ E H 2 , η ¯ .
θ E = arctan 1 + sin 2 ( θ x ) sin ( θ y ) 1 / 2 . The maximum gain, denoted as G E max , achieves a value of 8 dBi. The horizontal 3D beamwidth, designated as H , covers 65 , while the vertical 3D beamwidth, denoted as V , also encompasses 65 . Furthermore, the side-lobes are confined within a limit of ζ ¯ = 30 dB, and the antenna’s front-to-back ratio is specified as η ¯ = 30 dB.
Following Equation (2.22) of [51], the transfer of equivalent and comparable power can be obtained as
G Q , O = 4 π / 0 2 π 0 π G Q , A ( N Q , θ , ϕ ) sin ( θ ) d θ d ϕ .

3.3. Received Signal Power

The signal power derived obtained from the MBS at the geographical system’s center is given as S M = K 1 P M B g M G T G R z M α M , where B is the biasing factor with an MBS. The sending antenna strength is G T , while the recipient antenna strength is G R , and z M is the Euclidean distance across an MBS and a user device in 3D space. For an air-to-ground channel (AtG) [52,53], the signal power obtained from the LOS LAP at the geographic coordinate system’s center is given as S L = η L 1 P U g L G T G R z L α L , where z L is the Euclidean distance across the platform in LOS and a user device. Similarly, the signal power obtained from the NLOS LAP at the geographic coordinate system’s center is given as S N = η N 1 P U g N G T G R z N α N , where z N is the Euclidean distance across the platform in NLOS and a user device.
The probability that there is an LOS path available from LAP to a T-UE is given as
p L ( z L ) = 1 + a exp ( 180 π b · θ + a · b ) 1 .
The constants a and b depend upon the environmental scenario, and θ = arctan ( h U / r L ) , where r L is the Euclidean distance across the platform and a user device in 2D space. The probability that there is an NLOS path available from LAP to a T-UE is given as
p N ( z N ) = 1 p L ( z L ) .

3.4. Downlink SIR

The signal-to-interference ratio (SIR) of a T-UE in downlink (DL) is described as the ratio of instantaneous power obtained by a T-UE from the associated node (e.g., MBS, LOS LAP, or NLOS LAP) to the interference obtained from the nodes. The SIR for the MBS is given as
SIR M = P M B K 1 g T G T G R z M α M i = 1 , i 0 n 1 P M B K 1 g i G T , i G R , i z i α M + q j = 0 l 1 p q η q 1 P U g j , q G T , j G R , j z j α q ,
where q { L , N } such that L represents the LOS LAP and N represents the NLOS LAP, p q is the probability of the q-th LAP, i indicates the i-th MBS’s interference, and j indicates the j-th platform’s interference. The SIR for the LOS LAP is given as
SIR L = P U η L 1 g T G T G R z L α L q j = 1 , j 0 l 1 p q η q 1 P U g j , q G T , j G R , j z j α q + i = 0 n 1 P M B K 1 g i G T , i G R , i z i α M .
The SIR for the NLOS LAP is given as
SIR N = P U η N 1 g T G T G R z N α N q j = 1 , j 0 l 1 p q η q 1 P U g j , q G T , j G R , j z j α q + i = 0 n 1 P M B K 1 g i G T , i G R , i z i α M .

4. Probability Density Function

For the MBS distribution, according to PPP, the cdf for the user device and the cellular base station distance is given as [16,54]
F M ( z ) = 1 exp ( 2 π λ M z 2 ) .
The probability density function (pdf) for the distance of a user device and the MBS is given as
f M ( z ) = d F M ( z ) d z = 2 π λ M z exp ( 2 π λ M z 2 ) .
The cdf for the user device and the serving LOS and NLOS LAP distance, considering an AtG channel and considering the probability of LOS/NLOS (i.e., p q ), is given as [55]
F q ( z ) = 1 exp 2 π λ U h U z t p q t 2 h U 2 d t .
The pdf for the user device to the LOS and NLOS LAP distance considering an AtG channel is given as
f q ( z ) = 2 π λ U t p q t 2 h U 2 exp 2 π λ U h U z t p q t 2 h U 2 d t .

5. Association Probability Analysis

The investigation of the association of a user device with the cellular base station and platform in the LOS and NLOS in terms of likelihood is referred to as the analysis of association probability. The connection of a user device with the MBS, LOS LAP, and NLOS LAP is derived in the following cases.

5.1. Case 1

The likelihood of a user device associating with the MBS is defined as the association probability of a user device to the MBS and is given as Case 1. The user device connects with the cellular base station if the average power obtained from the MBS is larger than the LOS and NLOS LAP. The analytical expression for the association probability of a T-UE with an MBS is obtained in Appendix A and is expressed as
A M = h U exp 2 π λ U z M α M α L P U K G L P M B η L G M , O 1 α L 2 2 π λ M z M exp 2 π λ M z M 2 d z M h U exp 2 π λ U h U z M α M α N P U K G N P M B η N G M , O 1 α M p q z M α M α N P U K G N P M B η N G M , O 1 α M 2 h U 2 d t 2 π λ M z M exp ( 2 π λ M z M 2 ) d z M .

5.2. Case 2

The likelihood of a user device associating with the LOS LAP is defined as the association probability of Case 2. The user device connects with the LOS LAP if the average power obtained from the LOS LAP is larger than the MBS and NLOS LAP and is derived as
A L = Pr { S L > S M } × Pr { S L > S N } = a Pr z M > z L α L α M P M B η L G M , O P U K G L 1 α M × Pr z N > z L α L α N η L η N 1 α N = b h U 1 F M L ( z L ) f L ( z L ) d z L × h U 1 F N L ( z L ) f L ( z L ) d z L ,
where (a) is achieved by assuming that UAVs have energy and load constraints, while MBSs do not. As a result, G M , O represents the greatest gain of the antenna, i.e., G M , O = G M ( N Q , θ , ϕ ) . Furthermore, because of the air pressure, severe winds, mechanical controller noise, and other factors, the overall gain achieved by the LOS LAP and NLOS LAP is less than the optimum gain of the antenna. (b) is derived by taking the cdf and pdf of z L and aggregating them over the z L . The association probability of a user device with the LOS LAP is expressed as
A L = h U exp 2 π λ M z L α L α M P M B η L G M , O P U K G L 1 α M 2 2 π λ U t p L t 2 h U 2 exp 2 π λ U h U t p L t 2 h U 2 d t d z L h U exp 2 π λ U h U z L α L α N η L η N 1 α N p L z L α L α N η L η N 1 α N 2 h U 2 d t 2 π λ U t p L t 2 h U 2 exp 2 π λ U h U t p L t 2 h U 2 d t d z L .

5.3. Case 3

The probability of a user device associating with the NLOS LAP is defined as the association probability of Case 3. The user device connects with the NLOS LAP if the average power obtained from the NLOS LAP is larger than the MBS and LOS LAP and is derived by following similar steps as in Case 2.
A N = Pr { S N > S M } × Pr { S N > S L } = a Pr z M > z N α N α M P M B η N G M , O P U K G N 1 α M × Pr z L > z N α N α L η N η L 1 α L = b h U 1 F M N ( z N ) f N ( z N ) d z N × h U 1 F L N ( z N ) f N ( z N ) d z N ,
where (a) stems from the assumption that UAVs adhere to energy and load constraints, while MBSs do not share such restrictions. Consequently, G M , O embodies the highest attainable antenna gain, designated as G M , O = G M ( N Q , θ , ϕ ) . It is worth noting that due to factors such as air pressure, strong winds, mechanical controller noise, and related influences, the actual gain realized by both LOS LAP and NLOS LAP falls short of the antenna’s optimal performance. (b) emerges through a process of deducing the cdf and pdf for the variable z N , followed by aggregating these functions over z N . The final expression for Case 3 is expressed as
A N = h U exp 2 π λ M z N α N α M P M B η N G M , O P U K G N 1 α M 2 2 π λ U t p N t 2 h U 2 exp 2 π λ U h U t p N t 2 h U 2 d t d z N h U exp 2 π λ U h U z N α N α L η N η L 1 α L p N z N α N α L η N η L 1 α L 2 h U 2 d t 2 π λ U t p N t 2 h U 2 exp 2 π λ U h U t p N t 2 h U 2 d t d z N .

6. Interference Analysis

Here, the interference power of the MBSs, LOS LAPs, and NLOS LAPs is derived.

6.1. Interference of MBSs

The interference of MBSs is computed by a Laplace transform as L I M ( s ) = E exp ( s I ) , where I = k I M K 1 P M B g k G T , k G R , k z k α M and s = τ K z M α M / P M B G T G R . The Laplace transform of LOS LAP interference is derived in Appendix B and is given as
L I M ( s z Q ) = exp 2 π λ M t > h U s K 1 P M B G M , O G R z k α M 1 + s K 1 P M B G M , O G R z k α M t d t .

6.2. Interference of LOS LAPs

The interference of LOS LAPs is computed as L I L ( s ) = E exp ( s I ) , where I = k I L P U η L 1 g k G T , k G R , k z k α L and s = τ η L z L α L / P U G T G R . The interference is given by
L I L ( s z Q ) = E g , z k k I L exp s P U η L 1 g k G T , k G R , k z k α L = 1 E z k k I L E g exp s P U η L 1 g k G T , k G R , k z k α L = 2 E z k k I L 1 + s P U η L 1 G T , k G R , k z k α L m L m L = 3 exp 2 π λ L t > h U t p q t 2 h U 2 1 1 + s P U η L 1 G L , k G R z k α L m L m L d t ,
where (1) is founded on the utilization of the independent property of the PPP, where it is assumed that all nodes following PPP experience the same fading impact. Consequently, the expectation concerning the variable g can be incorporated within the multiplication notation. (2) relies on the fading assumption of the exponential distribution with a mean of 1, denoted as exp ( 1 ) . (3) is facilitated by applying the probability-generating functional (PGFL) for PPPs, transforming variables to polar co-ordinates, and assuming transmitters are LOS LAPs, as outlined in Reference [54], resulting in the equation: exp λ 2 1 f ( x 1 ) d x 1 = exp 2 π λ 2 f ( x 1 ) x 1 d x 1 .

6.3. Interference of NLOS LAPs

The interference of NLOS LAPs is computed as L I N ( s ) = E exp ( s I ) , where I = k I N P U η N 1 g k G T , k G R , k z k α N and s = τ η N z N α N / P U G T G R . Assuming NLOS LAPs are the transmitting devices, the Laplace transform of the interference of NLOS LAPs is obtained by following a similar approach as in (19) and is given as
L I N ( s z Q ) = exp 2 π λ L t > h U t p q t 2 h U 2 1 1 + s P U η N 1 G N , k G R z k α N m N m N d t .

7. Performance Analysis

A cellular network assisted by UAVs in the presence of a fluctuating UAV beamwidth can be characterized in terms of its coverage probability and SE performance.

7.1. Coverage Probability Analysis

A user device has a reliable link and is considered to be in a coverage region for the UAV-assisted cellular network if the instantaneous SIR of a user device is larger than the system’s pre-defined SIR threshold value and is given as C = 0 Pr { SIR τ } f z ( z ) d z .
The probability of coverage of a user device in an overall network is described as the coverage of a T-UE associated with the MBS, LOS LAP, and NLOS LAP and is given as C 1 , C 2 , and C 3 , respectively. The probability of coverage of a user device in a UAV-assisted cellular network is given as
C = A M C 1 + A L C 2 + A N C 3 .
The analytical expression for the probability of coverage of a user device connected with the MBS considering the fluctuating beamwidth of the antenna is derived in Appendix C and is given as
C 1 = 0 exp 2 π λ M t > h U s K 1 P M B G M , O G M , O z k α M 1 + s K 1 P M B G M , O G M , O z k α M t d t exp 2 π λ L t > h U t p q t 2 h U 2 1 1 + s P U η L 1 G L , k G M , O z k α L m L m L d t exp 2 π λ L t > h U t p q t 2 h U 2 1 1 + s P U η N 1 G N , k G M , O z k α N m N m N d t | s = τ K z M α M P M B G T G R 2 π λ M z M exp ( 2 π λ M z M 2 ) d z M .
The probability of coverage of a user device connected to the LOS LAP is derived as
C 2 = 0 Pr { SIR L τ } f L ( z L ) d z L = a 0 g L τ η L z L α L I P U G T G R f L ( z L ) d z L = b 0 k = 0 m L 1 1 k ! m L τ η L z L α L I P U G T G R k exp m L τ η L z L α L I P U G T G R f L ( z L ) d z L = c 0 k = 0 m L 1 1 k ! m L τ η L z L α L I P U G T G R k d k d z L k L I M ( s z L ) L I L ( s z L ) L I N ( s z L ) | s = τ η L z L α L P U G T G R f L ( z L ) d z L ,
where (a) follows simple mathematical computations, (b) follows by the ccdf of the gamma random variable, g L , and (c) follows by leveraging the incomplete gamma function’s simplification. Substituting the values of (18)–(20) and (12) in (23) and assuming q = L , the analytical expression for the probability of coverage of a user device with the LOS platform of UAVs considering the fluctuating beamwidth of the antenna is obtained and is given in (24).
C 2 = 0 exp 2 π λ M t > h U s K 1 P M B G M , O G L z k α M 1 + s K 1 P M B G M , O G L z k α M t d t exp 2 π λ L t > h U t p q t 2 h U 2 1 1 + s P U η L 1 G L , k G L z k α L m L m L d t exp 2 π λ L t > h U t p q t 2 h U 2 1 1 + s P U η N 1 G N , k G L z k α N m N m N d t | s = τ η L z L α L P U G T G R 2 π λ U t p L t 2 h U 2 exp 2 π λ U h U t p L t 2 h U 2 d t d z L .
The probability of coverage of a user device connected with the NLOS LAP is derived as
C 3 = 0 Pr { SIR N τ } f N ( z N ) d z N = a 0 g N τ η N z N α N I P U G T G R f N ( z N ) d z N = b 0 k = 0 m N 1 1 k ! m N τ η N z N α N I P U G T G R k exp m N τ η N z N α N I P U G T G R f N ( z N ) d z N = c 0 k = 0 m N 1 1 k ! m N τ η N z N α N I P U G T G R k d k d z N k L I M ( s z N ) L I L ( s z N ) L I N ( s z N ) | s = τ η N z N α N P U G T G R f N ( z N ) d z N ,
where (a) follows simple mathematical computations, (b) follows by the ccdf of the gamma random variable g N , and (c) follows by leveraging the incomplete gamma function’s simplification. Substituting the values of (18)–(20) and (12) in (25) and assuming q = N , the analytical expression for the probability of coverage of a user device connected with the NLOS LAP considering the fluctuating beamwidth of the antenna is obtained and is given in (26).
C 3 = 0 exp 2 π λ M t > h U s K 1 P M B G M , O G N z k α M 1 + s K 1 P M B G M , O G N z k α M t d t exp 2 π λ L t > h U t p q t 2 h U 2 1 1 + s P U η L 1 G L , k G N z k α L m L m L d t exp 2 π λ L t > h U t p q t 2 h U 2 1 1 + s P U η N 1 G N , k G N z k α N m N m N d t | s = τ η N z N α N P U G T G R 2 π λ U t p N t 2 h U 2 exp 2 π λ U h U t p N t 2 h U 2 d t d z N .
Substituting the values of A M , A L , A N , C 1 , C 2 , and C 3 in (21), the probability of coverage of a user device in a UAV-assisted cellular network considering the fluctuating beamwidth of the antenna is obtained.

7.2. Spectral Efficiency Analysis

The SE of a T-UE in DL is described as the ratio of the network’s capacity to the network’s bandwidth. It is given as
SE = 0 0 ln 1 + SIR f z ( z ) d t d z .
The SE of a user device connected with a cellular base station in DL considering the fluctuationg beamwidth of the antenna is defined by:
SE 1 = A M 0 0 SIR M > e t 1 f z M ( z M ) d t d z M = a A M 0 0 ( L I M ( s ¯ z M ) L I L ( s ¯ z M ) L I N ( s ¯ z M ) | s ¯ = e t 1 K z M α M P M G T G R ) f z M ( z M ) d t d z M ,
where (a) follows by substituting the values of S I R M , assuming Rayleigh channel fading having an exponential distribution with a mean power of unity, i.e., exp ( 1 ) , and assuming s ¯ = e t 1 K z M α M P M G T G R . Plugging the values of (18)–(20) and (10) into (28), the SE of a T-UE with an MBS is obtained. Similar to the derivation of (28), the SE of a T-UE associated with the LOS LAP considering the fluctuating beamwidth of the antenna can be expressed as
S E 2 = A L 0 0 ( L I M ( s ¯ z L ) L I L ( s ¯ z L ) L I N ( s ¯ z L ) | s ¯ = e t 1 η L z L α L P U G T G R ) f z L ( z L ) d t d z L ,
where the ccdf of the incomplete gamma distribution considers the fading parameter, m L = 1 , and assumes s ¯ = e t 1 η L z L α L P U G T G R . Plugging the values of (18)–(20) and (12) into (29) and considering q = L , the SE of a user device with the platform of UAVs in LOS is derived. Moreover, the SE of a user device associated with the platform of UAVs in NLOS considering the fluctuating beamwidth of the antenna can be derived following a similar approach as in (29).
S E 3 = A N 0 0 ( L I M ( s ¯ z N ) L I L ( s ¯ z N ) L I N ( s ¯ z N ) | s ¯ = e t 1 η N z N α N P U G T G R ) f z N ( z N ) d t d z N ,
where s ¯ = e t 1 η N z N α N P U G T G R and m N = 1 . Putting the values of (18)–(20) and (12) into (29) and assuming q = N , the SE of a T-UE with the NLOS LAP is obtained. The SE of a T-UE in an overall network considering the fluctuating beamwidth of the antenna is given by plugging S E 1 , S E 2 , and S E 3 in S E and is given as S E = S E 1 + S E 2 + S E 3 .

8. Results and Discussion

The analysis was validated by performing 50,000 Monte Carlo trials. The MBS’s and LAP’s transmission power, density, and number of antennas are given as P M = 40 dBm and P U = 23 dBm, λ M = 20 / km 2 and λ U = 4 / km 2 , and N M = 20 and N L = 20, respectively. The path loss exponent and additional path losses for MBSs, LOS LAPs, and NLOS LAPs are given as α M = 2.25, α L = 2, and α N = 4 and K = 1 dB, η L = 1 dB, and η N = 10 dB, respectively. The bias factor, SIR threshold value, bandwidth, and height of the LAPs is given as B = 0.001, τ = 20 dB, B = 3 GHz, and h U = 20 m, respectively. For urban, sub-urban, and high-rise building environments, the parameters ( a , b ) are given as ( 12.08 , 0.21 ) , ( 7.5 , 0.58 ) , and ( 24 , 0.1 ) , respectively. The red, blue, green, and black colors represent the MBS link, LOS LAP link, NLOS LAP link, and overall UAV-assisted cellular network link. The solid, dashed, and dotted–dashed lines represent links with an antenna fluctuation of σ = 0 , σ = 2 , and σ = 4 , respectively. Unless and until defined, the results are obtained by using the system parameters given in Table 3 [18].
The simulations were performed by performing independent Monte Carlo trials. Each trial considered that the cellular MBSs follow an independent and 2D homogeneous PPP in the region of interest. The LAPs follow an independent and 3D homogeneous PPP and a user device or subscriber (i.e., T-UE) is located at the center for each of the Monte Carlo trials. The probability of each of the LAPs being in LOS and NLOS with a T-UE is computed using (4) and (5), respectively. The received power of the MBSs, LOS LAPs, and NLOS LAPs is computed based on their distance from a T-UE and environmental path losses. The T-UE associates with the MBS, LOS LAP, or NLOS LAP if the maximum signal power is obtained at the T-UE from the MBS, LOS LAP, or NLOS LAP, respectively. After the connection of a user device with either the MBS, LOS LAP, or NLOS LAP, the T-UE computes its instantaneous DL SIR. For MBS association (Case 1), the coverage probability and SE are obtained using (22) and (28), respectively. For LOS LAP association (Case 2), the coverage probability and SE are obtained using (24) and (29), respectively, and for the NLOS LAP association (Case 3), the coverage probability and SE are obtained using (26) and (30), respectively.
Figure 2 indicates the likelihood of association of a user device with an MBS (in Case 1), LOS LAP (in Case 2), and NLOS LAP (in Case 3) as a function of the density of LAPs. It is shown in the figure that the probability of association of a user device in links (i.e., Case 1, Case 2, and Case 3) degrades by raising the fluctuating beamwidth deviation for the platform of UAVs (i.e., 0 , 2 , and 4 ). This is because whenever vibrations of the antenna’s 3D beamwidth rise, the antenna’s effectiveness falls, limiting the acquired strength of the received signal. Therefore, the power received and the association with a user device in all the links decrease by increasing the fluctuations of the antenna. It is also shown in the figure that the probability of association of a user device with the platform of UAVs in NLOS improves by increasing the density of LAP in the given space in comparison with the association probability of a user device with the MBS because of the decrease in the distance-dependent path loss of a user device and the platform of UAVs in comparison with the path loss of a user device and an MBS. The decrease in the path loss results in decreasing the received power as well as the association of a user device with the platform of UAVs when compared with the received power and connection of a user device with an MBS. However, the probability of connection of a user device with the platform of UAVs in LOS first increases and then starts decreasing with the increasing density of LAPs because, for a reduced density of LAPs, lower path loss is obtained between a user device and the platform of UAVs in LOS as compared with the higher density of LAPs.
Figure 3 shows the DL coverage performance for the MBS link (in C 1 ), LOS LAP link (in C 2 ), NLOS LAP link (in C 3 ), and overall link (in C) as a function of the density of LAPs. It is shown in the figure that the probability of coverage of a user device in all the links (i.e., C 1 , C 2 , C 3 , and C) reduces by raising the standard deviation of the LAPs (i.e., 0 , 2 , and 4 ) because with a vibrating beamwidth, the antenna’s amplification diminishes, resulting in a reduction in the perceived power of the signal. Thus, the received strength, DL SIR, and the probability of coverage of a user device in all the links decrease by increasing the vibrating beamwidth. Moreover, it is shown that the probability of coverage of the overall link decreases by increasing the density of LAPs because by increasing the average LAPs in the given space, LAP interference increases at the user device, resulting in decreases in the DL SIR and the probability of coverage. It is also shown in the figure that the probability of coverage of a user device with the platform of UAVs in NLOS increases when the density of LAPs increases in comparison with the MBS because of the decrease in the path loss of a user device and the NLOS LAP in comparison with the path loss of a user device and an MBS. The decrease in the path loss results in increases in the power obtained, as well as the probability of coverage of a user device and platform of UAVs in NLOS in comparison to the power obtained and the probability of coverage of a user device and an MBS. The probability of coverage of a user device and platform of UAVs in NLOS decreases with an increasing density of LAPs because, for a larger density of LAPs, larger path loss is obtained between a user device and the platform of UAVs in NLOS as compared with the lower density of LAPs.
Figure 4 indicates that the probability of coverage of a user device in DL for an overall network in urban, suburban, or high-rise building environments decreases when the pre-set SIR threshold value increases. It is also shown from the figure that the probability of coverage of a user device degrades when the fluctuation of the UAV’s antenna 3D beamwidth increases. This is because whenever the variation of the beamwidth of the platform of UAVs grows, the efficiency of the antenna falls, leading to a drop in the acquired signal, DL SIR, and the probability of coverage of a user device in UAV-assisted cellular networks.
Figure 5 indicates the probability of association of a user device with the MBS, LOS LAP, and NLOS LAP as a function of the platform of the UAVs’ transmit power. It is shown in the figure that the probability of association with a user device for all the links decreases by increasing the fluctuating LAP because whenever the oscillations of the UAV’s beamwidth rise, the antenna’s efficiency falls, reducing the acquired strength of the received signal. Therefore, the obtained power and the association with a user device in all the links degrades by raising the fluctuating beamwidth. It is also shown in the figure that the probability of association of a user device with the platform of UAVs in LOS and NLOS improves when the power of the platform of UAVs is increased when compared with the probability of association of a user device with the MBS because of the decrease in the path loss of a user device and the LOS and NLOS LAP when compared with the path loss of a user device and an MBS. The decrease in the path loss results in decreases in the obtained power and the association of a user device with the LOS and NLOS LAP in comparison with the obtained power and association of a T-UE with an MBS.
Figure 6 indicates the probability of coverage of a user device with an MBS, LOS LAP, NLOS LAP, and overall link as a function of the power of a platform of UAVs. It is shown in the figure that the probability of coverage of a user device for all the links decreases when increasing the LAP fluctuations because whenever the oscillations in the LAP’s beamwidth increase, its antenna efficiency drops, reducing the acquired strength of the signal and thereby the DL SIR. Thus, the DL SIR and the probability of coverage of a user device in all the links decrease by increasing the fluctuations of the antenna. Moreover, it is shown in the figure that the probability of coverage of the overall link degrades by increasing the power of the platform of UAVs because whenever the transmitting power of the LAP grows, so does the interference, resulting in a decrease in the DL SIR and the probability of coverage of a user device in the network. It is also shown in the figure that the probability of coverage of a user device with the platform of UAVs in NLOS increases whenever the LAP’s power of transmission grows in comparison to the probability of coverage of a user device with the MBS because of the decrease in the distance-dependent path loss of a user device and an NLOS LAP when compared with the path loss of a user device and an MBS. The decrease in the path loss results in decreases in the obtained power, DL SIR, and coverage probability of a user device with the NLOS LAP in comparison with the obtained power, DL SIR, and coverage probability of a user device with an MBS. However, the probability of coverage of a user device with the LOS LAP first increases and then starts decreasing by increasing the transmission power of the LAP. This is because as the power of the platform of UAVs increases, it also increases the obtained power, DL SIR, and coverage probability of a user device for the LOS LAP as compared with the obtained power, DL SIR, and probability of coverage of user device for an MBS link. However, after further increasing the transmission power, the DL interference for the LOS LAP increases, which results in a decrease in the probability of coverage of a user device for the LOS LAP link.
Figure 7 indicates the SE of a user device for the MBS, LOS LAP, and NLOS LAP links as a function of the LAP’s transmission power and beamwidth fluctuation. It is shown in the figure that the SE of a user device grows by boosting the LAP’s power transmission up to 25 dBm and then starts decreasing with the increase in the power of the platform of UAVs. This is because the association probability and DL SIR of a user device increase with increases in the power of the platform of UAVs. However, after further increasing the power of the platform of UAVs, the LAP’s interference increases, which degrades the DL SIR and the SE of the LOS LAP. It is also shown in the figure that the SE of the overall network decreases with increasing fluctuations of the LAP. This is because by increasing the variability of the LAP’s beamwidth, the antenna efficiency lowers, resulting in a fall in the acquired strength of the signal, DL SIR, and SE.

9. Conclusions

In this paper, a UAV-assisted cellular network characterized by the presence of fluctuations in the 3D antenna beamwidth is investigated. Our analysis is centered on evaluating the performance of a T-UE, with a specific focus on coverage probability and SE. To establish this model, we represent the MBSs using an independent 2D homogeneous PPP and the platform of UAVs using an independent 3D PPP. To this end, the association probability of a T-UE with the MBS, LOS LAP, and NLOS LAP is characterized. The analytical expressions of the association and coverage probabilities are derived for fluctuating UAV beamwidths. The user device’s performance is investigated for various system settings, such as the density of LAPs, the transmission power of LAPs, and the SIR threshold value. The results demonstrate that the performance of a T-UE in a UAV-assisted cellular network is severely degraded because of the fluctuating beamwidth of the platform of UAVs. As a result, it is critical to assess the impact of fluctuations in antenna beamwidth on the association probability, coverage probability, and SE of a T-UE for a UAV-assisted cellular network. Additionally, this performance is further impacted by the higher density and transmission power of the LAPs.

Author Contributions

Formal analysis, M.A.; funding acquisition, W.K.; investigation, M.A.; methodology, M.A.; software, M.A.; validation, M.A.; visualization, M.A.; writing—original draft, M.A.; writing—review and editing, M.A. and W.K. All authors have read and agreed to the published version of the manuscript.

Funding

This research was supported by a standard development project funded by the Ministry of Science under ICT grant number RS-2023-0022831612982076870001.

Data Availability Statement

No data were used for the research described in the article.

Conflicts of Interest

The authors declare no conflict of interest.

Appendix A. Derivation of (13)

The association probability of a T-UE associated with an MBS is derived as
A M = Pr { S M > S L } × Pr { S M > S N } = a Pr { K 1 P M B G T G R z M α M > η L 1 P U G T G R z L α L } × Pr { K 1 P M B G T G R z M α M > η N 1 P U G T G R z N α N } = b Pr z L > z M α M α L P U K G L P M B η L G M 1 α L × Pr z N > z M α M α N P U K G N P M B η N G M 1 α M = c Pr z L > z M α M α L P U K G L P M B η L G M , O 1 α L × Pr z N > z M α M α N P U K G N P M B η N G M , O 1 α M = d h U 1 F L M ( z M ) f M ( z M ) d z M × h U 1 F N M ( z M ) f M ( z M ) d z M ,
where (a) is obtained by substituting the values of the received power of the MBS, LOS LAP, and NLOS LAP, (b) is obtained by a simplification process and separating z L and z N , and (c) is obtained by assuming that UAVs have power as well as payload limitations; however, MBSs do not have power or payload limitations, and therefore, the maximum gain of the antenna can be expressed as G M , O = G M ( N Q , θ , ϕ ) . Moreover, higher atmospheric pressure, powerful winds, mechanical control unit noise, etc. can cause the UAV to vibrate its beamwidth. Therefore, the gain of the LOS LAP and NLOS LAP is less than the maximum gain of the antenna. (d) is obtained by considering the cdf and pdf of z M , and after averaging over z M , the final expression for the association probability of the MBS link is obtained.

Appendix B. Derivation of (18)

The Laplace transform of the interference of MBSs is derived as
L I M ( s z Q ) = E g , z k k I M exp s K 1 P M B g k G T , k G R , k z k α M = 1 E z k k I M E g exp s K 1 P M B g k G T , k G R , k z k α M = 2 E z k k I M 1 1 + s K 1 P M B G T , k G R , k z k α M = 3 exp λ M t > h U 1 1 1 + s K 1 P M B G T , k G R , k z k α M d t ,
where (1) follows by the application of the independent property of PPP (e.g., all the nodes following PPP will have the same impact of fading; therefore, expectations with respect to g can be brought inside the multiplication notation), (2) follows by the assumption of Rayleigh fading channels and assuming that the fading power is exponentially distributed with a mean power of one, i.e., exp ( 1 ) , and (3) follows by the application of applying PGFL for PPP [54] such that E c f ( c ) ) = exp λ 2 ( 1 f ( c ) ) d c . The final expression is obtained by transforming the coordinates from Cartesian to polar using exp λ 2 f ( x 1 ) d x 1 = exp 2 π λ 2 f ( x 1 ) x 1 d x 1 and assuming that MBSs do not have power or payload limitations. Therefore, the maximum gain of the antenna is given as G M , O . The final expression for the Laplace transform of the interference of MBSs is given in (18).

Appendix C. Derivation of (22)

The probability of coverage of a user device connected to a cellular base station is derived as
C 1 = 0 Pr { SIR M τ } f M ( z M ) d z M = a 0 g M τ K z M α M I P M B G T G R f M ( z M ) d z M = b 0 exp s I f M ( z M ) d z M = c 0 ( L I M ( s z M ) L I L ( s z M ) L I N ( s z M ) | s = τ K z M α M P M B G T G R ) f M ( z M ) d z M ,
where (a) follows by substituting the values of S I R M and by applying simple mathematical techniques, (b) follows by the assumption of s = τ K z M α M P M B G T G R and by the Rayleigh fading channel assumption for the MBS link such that the fading power is exponentially distributed with a mean power of unity, i.e., exp ( 1 ) , and (c) follows by assuming that I is constituted of the interference of MBSs, LOS LAPs, and NLOS LAPs given that a T-UE is associated with the MBS link. We can plug the values of (18)–(20) and (10) into (A3) to obtain the final expression for the coverage probability of the MBS link considering a fluctuating beamwidth.

References

  1. IMT Traffic Estimates for the Years 2020 to 2030. Report ITU-R M. 2370-0, ITU-R Radiocommunication Sector of ITU. 2015. Available online: https://www.itu.int/dms_pub/itu-r/opb/rep/R-REP-M.2370-2015-PDF-E.pdf (accessed on 1 September 2023).
  2. Nawaz, S.J.; Sharma, S.K.; Wyne, S.; Patwary, M.N.; Asaduzzaman, M. Quantum Machine Learning for 6G Communication Networks: State-of-the-Art and Vision for the Future. IEEE Access 2019, 7, 46317–46350. [Google Scholar] [CrossRef]
  3. Wang, Z.; Zheng, J. Performance modeling and analysis of base station cooperation for cellular-connected UAV networks. IEEE Trans. Veh. Technol. 2021, 71, 1807–1819. [Google Scholar] [CrossRef]
  4. Wang, Z.; Zheng, J. Performance Analysis of Location-based Base Station Cooperation for Cellular-Connected UAV Networks. IEEE Trans. Veh. Technol. 2023, 72, 14787–14800. [Google Scholar] [CrossRef]
  5. Liu, C.H.; Syed, M.A.; Wei, L. Toward ubiquitous and flexible coverage of UAV-IRS-assisted NOMA networks. In Proceedings of the 2022 IEEE Wireless Communications and Networking Conference (WCNC), Austin, TX, USA, 10–13 April 2022; pp. 1749–1754. [Google Scholar] [CrossRef]
  6. Wu, H.; Tao, X.; Zhang, N.; Shen, X. Cooperative UAV cluster-assisted terrestrial cellular networks for ubiquitous coverage. IEEE J. Sel. Areas Commun. 2018, 36, 2045–2058. [Google Scholar] [CrossRef]
  7. Zhao, Y.; Zhou, F.; Feng, L.; Li, W.; Sun, Y.; Imran, M.A. Backhaul-Constrained Coverage Analysis of Integrated High and Low Altitude Platforms Aerial Communication System in Post-Disaster Areas. IEEE Commun. Lett. 2023, 27, 1629–1633. [Google Scholar] [CrossRef]
  8. Wang, D.; He, Y.; Yu, K.; Srivastava, G.; Nie, L.; Zhang, R. Delay-sensitive secure NOMA transmission for hierarchical HAP–LAP medical-care IoT networks. IEEE Trans. Ind. Informatics 2021, 18, 5561–5572. [Google Scholar] [CrossRef]
  9. Shafique, T.; Feriani, A.; Tabassum, H.; Hossain, E. Intelligent Reflecting Surfaces (IRS)-Aided Cellular Networks and Deep Learning-Based Design. In Intelligent Reconfigurable Surfaces (IRS) for Prospective 6G Wireless Networks; Wiley: Hoboken, NJ, USA, 2022; pp. 149–170. [Google Scholar] [CrossRef]
  10. Banagar, M.; Dhillon, H.S. 3D two-hop cellular networks with wireless backhauled UAVs: Modeling and fundamentals. IEEE Trans. Wirel. Commun. 2022, 21, 6417–6433. [Google Scholar] [CrossRef]
  11. Ferdowsi, A.; Abd-Elmagid, M.A.; Saad, W.; Dhillon, H.S. Neural combinatorial deep reinforcement learning for age-optimal joint trajectory and scheduling design in UAV-assisted networks. IEEE J. Sel. Areas Commun. 2021, 39, 1250–1265. [Google Scholar] [CrossRef]
  12. Badri, S.; Rasti, M. Interference management and duplex mode selection in in-band full duplex D2D communications: A stochastic geometry approach. IEEE Trans. Mob. Comput. 2020, 20, 2212–2223. [Google Scholar] [CrossRef]
  13. Boumaalif, A.; Zytoune, O. Power Distribution of Device-to-Device Communications Under Nakagami Fading Channel. IEEE Trans. Mob. Comput. 2020, 21, 2158–2167. [Google Scholar] [CrossRef]
  14. Arif, M.; Kim, W.; Qureshi, S. Interference Characterization in Cellular-Assisted Vehicular Communications with Jamming. IEEE Access 2022, 10, 42469–42480. [Google Scholar] [CrossRef]
  15. Traspadini, A.; Giordani, M.; Zorzi, M. UAV/HAP-assisted vehicular edge computing in 6G: Where and what to offload? In Proceedings of the 2022 Joint European Conference on Networks and Communications & 6G Summit (EuCNC/6G Summit), Antwerp, Belgium, 3–6 June 2022; pp. 178–183. [Google Scholar] [CrossRef]
  16. Andrews, J.G.; Baccelli, F.; Ganti, R.K. A tractable approach to coverage and rate in cellular networks. IEEE Trans. Commun. 2011, 59, 3122–3134. [Google Scholar] [CrossRef]
  17. Shafique, T.; Tabassum, H.; Hossain, E. Stochastic geometry analysis of IRS-assisted downlink cellular networks. IEEE Trans. Commun. 2022, 70, 1442–1456. [Google Scholar] [CrossRef]
  18. Peng, J.; Tang, W.; Zhang, H. Directional Antennas Modeling and Coverage Analysis of UAV-Assisted Networks. IEEE Wirel. Commun. Lett. 2022, 11, 2175–2179. [Google Scholar] [CrossRef]
  19. Alkama, D.; Ouamri, M.A.; Alzaidi, M.S.; Shaw, R.N.; Azni, M.; Ghoneim, S.S. Downlink performance analysis in MIMO UAV-cellular communication with LOS/NLOS propagation under 3D beamforming. IEEE Access 2022, 10, 6650–6659. [Google Scholar] [CrossRef]
  20. Sun, H.; Ma, C.; Zhang, L.; Li, J.; Wang, X.; Li, S.; Quek, T.Q. Coverage Analysis for Cellular-Connected Random 3D Mobile UAVs With Directional Antennas. IEEE Wirel. Commun. Lett. 2023, 12, 550–554. [Google Scholar] [CrossRef]
  21. Rawat, M.; Giordani, M.; Lall, B.; Chaoub, A.; Zorzi, M. On the Optimal Beamwidth of UAV-Assisted Networks Operating at Millimeter Waves. In Proceedings of the 2023 IEEE Wireless Communications and Networking Conference (WCNC), Glasgow, UK, 26–29 March 2023; pp. 1–6. [Google Scholar] [CrossRef]
  22. Wang, H.; Wang, J.; Chen, J.; Gong, Y.; Ding, G. Network-connected UAV communications: Potentials and challenges. China Commun. 2018, 15, 111–121. [Google Scholar] [CrossRef]
  23. Chu, E.; Kim, J.M.; Jung, B.C. Interference analysis of directional UAV networks: A stochastic geometry approach. In Proceedings of the 2019 Eleventh International Conference on Ubiquitous and Future Networks (ICUFN), Zagreb, Croatia, 2–5 July 2019; pp. 9–12. [Google Scholar] [CrossRef]
  24. Liu, W.; Lu, Z.; Wang, Z.; Li, X.; Li, Z.; Xiao, W.; Ye, X.; Wang, Z.; Song, J.; Qiao, J.; et al. Sidelobes Suppression for Time Domain Anti-Jamming of Satellite Navigation Receivers. Remote Sens. 2022, 14, 5609. [Google Scholar] [CrossRef]
  25. Dabiri, M.T.; Hasna, M. Pointing Error Modeling of mmWave to THz High-Directional Antenna Arrays. IEEE Wirel. Commun. Lett. 2022, 11, 2435–2439. [Google Scholar] [CrossRef]
  26. Dabiri, M.T.; Hasna, M. 3D Uplink Channel Modeling of UAV-based mmWave Fronthaul Links for Future Small Cell Networks. IEEE Trans. Veh. Technol. 2022, 72, 1400–1413. [Google Scholar] [CrossRef]
  27. Dabiri, M.T.; Rezaee, M.; Yazdanian, V.; Maham, B.; Saad, W.; Hong, C.S. 3D channel characterization and performance analysis of UAV-assisted millimeter wave links. IEEE Trans. Wirel. Commun. 2020, 20, 110–125. [Google Scholar] [CrossRef]
  28. Badarneh, O.S.; Dabiri, M.T.; Hasna, M. Channel Modeling and Performance Analysis of Directional THz Links Under Pointing Errors and α-μ Distribution. IEEE Commun. Lett. 2023, 27, 812–816. [Google Scholar] [CrossRef]
  29. Savkin, A.V.; Huang, C.; Ni, W. On-Demand Deployment of Aerial Base Stations for Coverage Enhancement in Reconfigurable Intelligent Surface-Assisted Cellular Networks on Uneven Terrains. IEEE Commun. Lett. 2022, 27, 666–670. [Google Scholar] [CrossRef]
  30. Pang, X.; Mei, W.; Zhao, N.; Zhang, R. Intelligent reflecting surface assisted interference mitigation for cellular-connected UAV. IEEE Wirel. Commun. Lett. 2022, 11, 1708–1712. [Google Scholar] [CrossRef]
  31. Arif, M.; Wyne, S.; Navaie, K.; Haroon, M.S.; Qureshi, S. Dual Connectivity in Decoupled Aerial HetNets With Reverse Frequency Allocation and Clustered Jamming. IEEE Access 2020, 8, 221454–221467. [Google Scholar] [CrossRef]
  32. Pandey, G.K.; Gurjar, D.S.; Nguyen, H.H.; Yadav, S. Security threats and mitigation techniques in UAV communications: A comprehensive survey. IEEE Access 2022, 10, 112858–112897. [Google Scholar] [CrossRef]
  33. Wang, F.; Zhang, X. IRS/UAV-Based Edge-Computing/Traffic-Offloading Over RF-Powered 6G Mobile Wireless Networks. In Proceedings of the 2022 IEEE Wireless Communications and Networking Conference (WCNC), Austin, TX, USA, 10–13 April 2022; pp. 1272–1277. [Google Scholar] [CrossRef]
  34. Sriharsha, C.; Murthy, C.S.R. A Novel Cellular User Offloading via UAV-Borne IRS. IEEE Wirel. Commun. Lett. 2023, 12, 1736–1740. [Google Scholar] [CrossRef]
  35. Guan, Z.; Wang, S.; Gao, L.; Xu, W. Energy-Efficient UAV Communication with 3D Trajectory Optimization. In Proceedings of the 2021 7th International Conference on Computer and Communications (ICCC), Chengdu, China, 10–13 December 2021; pp. 312–317. [Google Scholar] [CrossRef]
  36. Liu, Y.; Huangfu, W.; Zhou, H.; Zhang, H.; Liu, J.; Long, K. Fair and energy-efficient coverage optimization for UAV placement problem in the cellular network. IEEE Trans. Commun. 2022, 70, 4222–4235. [Google Scholar] [CrossRef]
  37. Huq, K.M.S.; Otung, I.E.; Rodriguez, J. A study of coverage probability-based energy-efficiency analysis for UAV-aided THz-enabled 6G networks. IEEE Trans. Intell. Transp. Syst. 2022, 24, 7404–7411. [Google Scholar] [CrossRef]
  38. Tung, T.V.; An, T.T.; Lee, B.M. Joint Resource and Trajectory Optimization for Energy Efficiency Maximization in UAV-Based Networks. Mathematics 2022, 10, 3840. [Google Scholar] [CrossRef]
  39. Arif, M.; Wyne, S.; Navaie, K.; Nawaz, S.J.; Alvi, S.H. Decoupled Downlink and Uplink Access for Aerial Terrestrial Heterogeneous Cellular Networks. IEEE Access 2020, 8, 111172–111185. [Google Scholar] [CrossRef]
  40. Shi, Y.; Hamdan, M.Q.; Alsusa, E.; Hamdi, K.A.; Baidas, M.W. A decoupled access scheme with reinforcement learning power control for cellular-enabled UAVs. IEEE Internet Things J. 2021, 8, 17261–17274. [Google Scholar] [CrossRef]
  41. Arif, M.; Wyne, S.; Ahmed, J. Efficiency Analysis of a K-tier Clustered HCN using Dual Connectivity with DUDe Access. AEU Int. J. Electron. Commun. 2020, 123, 153291. [Google Scholar] [CrossRef]
  42. Arif, M.; Wyne, S.; Navaie, K.; Haroon, M.S.; Qureshi, S. Clustered Jamming in Aerial HetNets With Decoupled Access. IEEE Access 2020, 8, 142218–142228. [Google Scholar] [CrossRef]
  43. Qasim, M.; Haroon, M.S.; Imran, M.; Muhammad, F.; Kim, S. 5G cellular networks: Coverage analysis in the presence of inter-cell interference and intentional jammers. Electronics 2020, 9, 1538. [Google Scholar] [CrossRef]
  44. Haroon, M.S.; Chae, S.H.; Jeon, S.W. Outage analysis for multi-radio heterogeneous networks in the presence of aerial jammers. ICT Express 2023. [Google Scholar] [CrossRef]
  45. Dabiri, M.T.; Safi, H.; Parsaeefard, S.; Saad, W. Analytical channel models for millimeter wave UAV networks under hovering fluctuations. IEEE Trans. Wirel. Commun. 2020, 19, 2868–2883. [Google Scholar] [CrossRef]
  46. Althunibat, S.; Dabiri, M.T.; Hasna, M.O.; Qaraqe, K. Secrecy analysis of directional mmWave UAV-based links under hovering fluctuations. IEEE Open J. Commun. Soc. 2023, 1–9. [Google Scholar] [CrossRef]
  47. Arif, M.; Kim, W. Analysis of U-V2X Communications with Non-Clustered and Clustered Jamming in the Presence of Fluctuating UAV Beam Width. Mathematics 2023, 11, 3434. [Google Scholar] [CrossRef]
  48. Arif, M.; Hasna, M.O. Analysis of fluctuations of antenna pattern in U-V2X communications. Phys. Commun. 2023, 58, 102066. [Google Scholar] [CrossRef]
  49. Chiu, S.N.; Stoyan, D.; Kendall, W.S.; Mecke, J. Stochastic Geometry and Its Applications; John Wiley & Sons: Hoboken, NJ, USA, 2013. [Google Scholar] [CrossRef]
  50. 3GPP TR 38.901 V14.1.1. Study on channel model for frequencies from 0.5 to 100 GHz (Release 17). Technical Specification Group Radio Access Network. 2017. Available online: https://standards.iteh.ai/catalog/standards/etsi/64afdacf-0cab-4049-8c5e-e2fce650b30d/etsi-tr-138-901-v14.1.1-2017-08 (accessed on 1 September 2023).
  51. Balanis, C.A. Antenna Theory: Analysis and Design; John Wiley & Sons: Hoboken, NJ, USA, 2015. [Google Scholar]
  52. Al-Hourani, A.; Kandeepan, S.; Jamalipour, A. Modeling air-to-ground path loss for low altitude platforms in urban environments. In Proceedings of the IEEE Global Communications Conference (GLOBECOM), Austin, TX, USA, 8–12 December 2014; pp. 2898–2904. [Google Scholar] [CrossRef]
  53. Al-Hourani, A.; Kandeepan, S.; Lardner, S. Optimal LAP altitude for maximum coverage. IEEE Wirel. Commun. Lett. 2014, 3, 569–572. [Google Scholar] [CrossRef]
  54. Andrews, J.G.; Gupta, A.K.; Dhillon, H.S. A primer on cellular network analysis using stochastic geometry. arXiv 2016, arXiv:1604.03183. [Google Scholar] [CrossRef]
  55. Alzenad, M.; Yanikomeroglu, H. Coverage and rate analysis for unmanned aerial vehicle base stations with LoS/NLoS propagation. In Proceedings of the IEEE Globecom Workshops (IGCW), Abu Dhabi, United Arab Emirates, 9–13 December 2018; pp. 1–7. [Google Scholar] [CrossRef]
Figure 1. System model of a UAV-assisted cellular network.
Mathematics 11 04706 g001
Figure 2. Association probability of a T-UE with the MBS, LOS LAP, and NLOS LAP as a function of LAP density and beamwidth fluctuation.
Mathematics 11 04706 g002
Figure 3. DL coverage performance of a T-UE as a function of LAP density and beamwidth fluctuation.
Mathematics 11 04706 g003
Figure 4. DL coverage performance of a T-UE for suburban and high-rise building environments as a function of pre-defined SIR threshold value and LAP beamwidth fluctuation.
Mathematics 11 04706 g004
Figure 5. Association probability of a T-UE with the MBS, LOS LAP, and NLOS LAP as a function of the LAP’s transmission power and LAP’s beamwidth fluctuation.
Mathematics 11 04706 g005
Figure 6. DL coverage performance of a T-UE as a function of the LAP’s transmission power and LAP’s beamwidth fluctuation.
Mathematics 11 04706 g006
Figure 7. SE of a T-UE as a function of LAP transmission power and beamwidth fluctuation.
Mathematics 11 04706 g007
Table 1. List of quantities and their description.
SymbolDescriptionSymbolDescription
Φ U 3D PPP of LAPsLSet of LAPs
Φ M 2D PPP of MBSsMSet of MBSs
nTotal number of MBSslTotal number of LAPs
λ U Density of LAPs P U LAPs’ transmission power
λ M Density of MBSs P M MBSs’ transmission power
α M Path loss of MBSsKAdditional path loss of MBSs
α L Path loss of LOS LAPs η L Additional path loss of LOS LAPs
α N Path loss of NLOS LAPs η N Additional path loss of NLOS LAPs
g M MBSs’ channel gain h U Height of LAP
g L LOS LAPs’ channel gain g N NLOS LAPs’ channel gain
m L LOS LAPs’ Nakagami fading parameter m N NLOS LAPs’ Nakagami fading parameter
N T Number of transmitting antennas N R Number of receiving antennas
θ Elevation angle ϕ Azimuth angle
κ x Wave number for x-axis κ y Wave number for y-axis
f c Carrier frequencycSpeed of light
η ¯ Antenna front-to-back ratio ζ ¯ Antenna side-lobes limit
H Horizontal 3D beamwidth V Vertical 3D beamwidth
G T Gain of transmitter G R Gain of receiver
r2D Euclidean distance between LAP and UEz3D Euclidean distance between LAP and UE
qLOS or NLOS UAVQTransmitting or receiving node
p L LOS probability p N NLOS probability
B System bandwidthBBias factor
τ SIR pre-set thresholdMMBS
LLOS LAPNNLOS LAP
σ Standard deviation of beamwidth
Table 2. A concise overview of recent studies delineating the network model, its contributions, and inherent constraints.
Reference, Year    Network Model    Outcomes    Constraints
[43], 2020Impact of jamming signals of clustered grounddevices in cellular networks consisting of macro and small base stations is consideredInvestigation of coverage performanceModel does not consider a UAV-assisted wireless network
[44], 2023Impact of jamming signals of aerial devices in cellular networks consisting of macro and small base stations is consideredInvestigation of outage performanceImpact of fluctuating beamwidth on UAV-assisted wireless networks is not considered
[25,26,45], 2022The impact of the 3D beamwidth of fluctuating antenna for an aerial network is consideredInvestigation of coverage performanceImpact of a fluctuating beamwidth on UAV-assisted cellular networks is not considered
[46], 2023Impact of 3D beamwidth fluctuations of mm waves including an eavesdropper in an aerial network model is consideredInvestigation of secrecy capacityImpact of fluctuating beamwidths on the UAV-assisted cellular network is not considered
[18], 2022Impact of 3D antenna beam forming in a UAV-assisted wireless network is consideredInvestigation of coverage performanceImpact of a fluctuating beamwidth on the UAV-assisted cellular network is not considered
[47], 2023Impact of 3D beamwidth fluctuations for U-V2X communications is consideredInvestigation of coverage and spectrum efficiency performanceImpact of a fluctuating beamwidth on the UAV-assisted cellular network is not considered
This workImpact of 3D beamwidth fluctuations on UAV-assisted cellular networks is consideredInvestigation of coverage and spectrum efficiency performance
Table 3. Parameters and their values.
ParameterValueParameterValue
λ M 20/km 2 α M 2.25
λ U 4/km α L 2
τ −20 dB α N 4
h U 20 m N M 20
a12.08 N L 20
b0.21B0.001
P M 40 dBm B 3 GHz
P U 23 dBm m L , m N 1
η L 1 dB η N 10 dB
K1 dB σ , σ x , σ y 0
Disclaimer/Publisher’s Note: The statements, opinions and data contained in all publications are solely those of the individual author(s) and contributor(s) and not of MDPI and/or the editor(s). MDPI and/or the editor(s) disclaim responsibility for any injury to people or property resulting from any ideas, methods, instructions or products referred to in the content.

