Article

Modeling the Impact of Overcoming the Green Walls Implementation Barriers on Sustainable Building Projects: A Novel Mathematical Partial Least Squares—SEM Method

by
Ahmed Farouk Kineber
1,2,*,
Ayodeji Emmanuel Oke
3,4,5,
Mohammed Magdy Hamed
6,
Ehab Farouk Rached
7 and
Ali Elmansoury
7
1
Department of Civil Engineering, College of Engineering in Al-Kharj, Prince Sattam Bin Abdulaziz University, Al-Kharj 11942, Saudi Arabia
2
Department of Civil Engineering, Canadian International College (CIC), 6th October City, Zayed Campus, Giza 12577, Egypt
3
Department of Quantity Surveying, Federal University of Technology, Akure 340110, Nigeria
4
CIDB Centre of Excellence, Faculty of Engineering and Built Environment, University of Johannesburg, Johannesburg 2092, South Africa
5
School of Social Sciences, University Sains Malaysia, Penang 11800, Malaysia
6
Construction and Building Engineering Department, College of Engineering and Technology, Arab Academy for Science, Technology and Maritime Transport (AASTMT), B 2401 Smart Village, Giza 12577, Egypt
7
Islamic Architecture Department, Faculty of Engineering & Islamic Architecture, UMM AL QURA University, Mecca 24382, Saudi Arabia
*
Author to whom correspondence should be addressed.
Mathematics 2023, 11(3), 504; https://doi.org/10.3390/math11030504
Submission received: 19 December 2022 / Revised: 10 January 2023 / Accepted: 16 January 2023 / Published: 17 January 2023
(This article belongs to the Special Issue Mathematical Theories and Models in Environmental Science)

Abstract

:
The sustainable building concept must be implemented throughout the project lifecycle to achieve the highest proceeds without lowering the standard. Although implementing green walls in emerging nations is partial, such studies have concentrated on drivers for implementing green walls. Conversely, there is less proof to comprehensively study the impact of implementing green walls’ overall sustainable success (OSS) concerning the lifecycle of projects. This research focuses on the green wall adoption barriers in construction projects in third-world nations. It assesses the effect of addressing green wall (GW) adoption obstacles on OSS throughout the project lifespan. Therefore, a broader review of the literature is needed for conceptual model development. Structural equation modelling and partial least square (SEM-PLS) have been developed employing a survey evaluation tool (i.e., questionnaire). Information was derived from one hundred and five building professionals in Nigeria. The model output revealed that eradicating GWs barriers had a slight to intermediate influence on OSS during the construction scheme’s lifespan. These results offer the foundation for policymaking in third-world nations regarding successful project completion through evading barriers to green wall adoption. Similarly, green walls implementation will enhance the building project’s success.

1. Introduction

Rapid population growth and urbanization combined with amplified building projects have resulted in modifying the interior of municipalities, substituting plants with building and concrete materials [1]. Consequently, it causes the incidence of urban heat islands (UHI) [2]. Therefore, since the general increase in temperatures worldwide resulted from environmental change, the effect of heat waves is considerably more critical in built-up centres [3,4]. For example, buildings often cool in the urban centres at night very slowly compared to natural features, which can have severe health impacts on urban dwellers [5]. It can lead to increased energy demands for cooling [6,7]. Urban green infrastructure is the solution to this problem since it comprises green walls, green roofs and urban tree landscapes, which could lessen the harmful effects of UHI within urban centres [8,9].
Green walls (GWs), likewise referred to as vertical greenery systems and vegetated walls [10], are deemed as inactive project solutions for circumstances in which other variabilities of UGI cannot be used due to the absence of space or methodological drawbacks [11,12]. Moreover, GWs certainly underwrite all sustainability features by offering paybacks, including UHI reduction, water management, adding aesthetic value, increasing air quality, saving energy, and biodiversity provision [10,13,14]. The advantages of GWs in every facet differ and hinge on aspects including environmental backgrounds, vegetation type used, and maintenance style. It implied that there were no benefits of GWs for deterministic value [15]. For example, it was reported that GWs could save energy ranging from 33% to 66% [16]. The higher costs for maintenance and installation differed contingent on the designated type. Concerning sustainable development features, GWs have an excellent possibility for extensive installation, whether for refortified or new structures [2].
The GWs, compared to green roofs, can be used for a considerably greater surface expanse and have low methodological intricacy. This makes them an operative alternative for current buildings [11,17]. Notwithstanding the facts mentioned above, there are many barriers to implementing GWs [18]. There is a lack of comprehensive analyses that scrutinize GW implementation barriers based on the accessible literature. Additionally, the available research outputs concerning this topic have narrow scopes and have evaluated some barriers that might not be appropriate to other background situations, including climatic and governmental settings [19,20,21].
Since the impact of UHI on the safety of inhabitants and the milieu, especially in municipal zones and the dearth of research output concerning GWs adoption barriers, the need to analyse and identify GWs adoption barriers becomes more critical. Resolutions cannot be expressed when the question is not identified. Thus, evaluating these barriers could lay the foundation for upcoming research regarding how to solve these issues, and it is eventually a step towards raising GWs implementation. To narrow the existing gap, this study aimed to investigate the barriers to implementing GWs and analyse their significance in Nigeria. Having this in mind, we present the following research problems, which this study has newly formulated based on the accessible literature, together with their resultant objectives:
i.
What are the existing barriers concerning GWs adoption?
ii.
How could these barriers be copiously identified, and the significant ones reserved, given Nigeria’s context?
Consequently, this study employed the joined SEM-PLS technique, which has led to obtaining a complete list of barriers. After explaining the study problem to be attended to and the resultant objective, the remaining sections of this article were further subdivided into three sections. The literature review was summarised in Section 2. It relates to the GW barriers everting its installation research and pinpoints the possible barriers. The method used and their applications in this study have been described in detail in Section 3. Section 4 expounds and converses the research findings. Conclusions, limitations and future research directions were offered in Section 5.

2. Literature Review

2.1. Overall Sustainable Success

The sustainability concept has been intensely discussed in the literature [22,23]. Conversely, modernising the project’s tactical sustainability objectives and techniques is complex [24]. Balance essentials should be developed among environmental, economic, and social facets [22,25]. The growth of sustainability concepts in the building industry resulted in exploring persuasive techniques to incorporate this perception into general operational settings [26]. The significant drivers that can expedite the adoption of GWs in the preliminary strategic stages are the search for a standard of inventive corporate social responsibility that increases sustainability to be implemented by firms [27]. The influence of GWs on construction projects can be associated with three critical sustainability measurements: environmental, economic, and social.

2.1.1. Economic

The economic benefits are among the critical factors underwriting GWs implementation for sustainable construction. It is among the universal uses because of its undeviating role in the economic dimensions via estimation of risk management cost [28]. The estimation of project cost and the needed funds can be classified into various phases to envisage and compute the budget of respective phases [29]. Additionally, for GWs’ 3D depictions and the reduction of project expenditure, building administrators must integrate time in their itemization as 4D models to assess the project risk more professionally and effectually [30]. Although this method can help the scheme to be steady and profitable, it cannot be measured as a viable technique except if it consists of environmental benefits and facilitates the idea of the standard of living in its strategies by allowing for human well-being and values of collective orientation as their primary concern [31]. Moreover, the GWs’ adoption of other aspects of the projects might play a significant role in fiscal proficiency; for instance, future prediction enables discovery and promotes collaboration among concerned parties. Likewise, it can reduce waste, save time, cut project costs, and facilitate construction management [28,32].

2.1.2. Environmental

The required data for performance funding in GWs is taken as the project’s proposal process; engineers can analyse construction performance using GWs at the early stages of the project plan and establish that. Hence, they might rapidly evaluate proposal substitutes to make a perfect choice to echo an eco-friendlier design [33]. Most GWs gears have many structures for assessing material and energy intake examination and mechanical and electrical segments of the construction. Thus, it can produce comprehensive data on reducing energy and resource consumption [34].
Similarly, some forms of software, e.g., the Ecotect, Revit, and Autodesk, present conventional tools that process data and assess the project’s green features. Similarly, it helps architects and engineers monitor energy consumption and proficiently utilize resources. These software packages can assimilate data to realize a greener project by providing analysis of solar paths, shading plans, and analysing buildings’ heating, cooling and orientation [34,35].

2.1.3. Social

The Western Australian Council of Social Services defined the manifestation of social sustainability as: “…when the formal and informal processes; systems; structures; and relationships actively support the capacity of current and future generations to create healthy and liveable communities. Socially sustainable communities are equitable, diverse, connected and democratic and provide a good quality of life” [36].
The advantage of the social aspect of sustainability is measured to facilitate other sustainability facets that boost living standards, comfortability and healthy living [31,36]. Regarding sustainability, social principles have focused on various theories and descriptions. These can be categorized into two groups about the interface with GWs, dependent and autonomous attributes. The more qualitative the pendent social sustainability features that could be estimated via other dimensions, the more the GWs can proffer distinct facets of the environmental circumstance, e.g., energy performance and lightning.
Sassi [31] argued that enhancing some ecological structures via viable project design encourages performance and health promotion. However, dangerous circumstances can promote health disorders, including discomfort, stress and absenteeism. Therefore, the overall impacts of such analyses help the entire society and community. In addition, some modes of viable design can enhance the value of human life at the public level. For instance, it can increase eco-friendly features and knowledge transfer, reduce health hazards from contaminants related to the structure’s energy usage and environmental rebuilding [34].

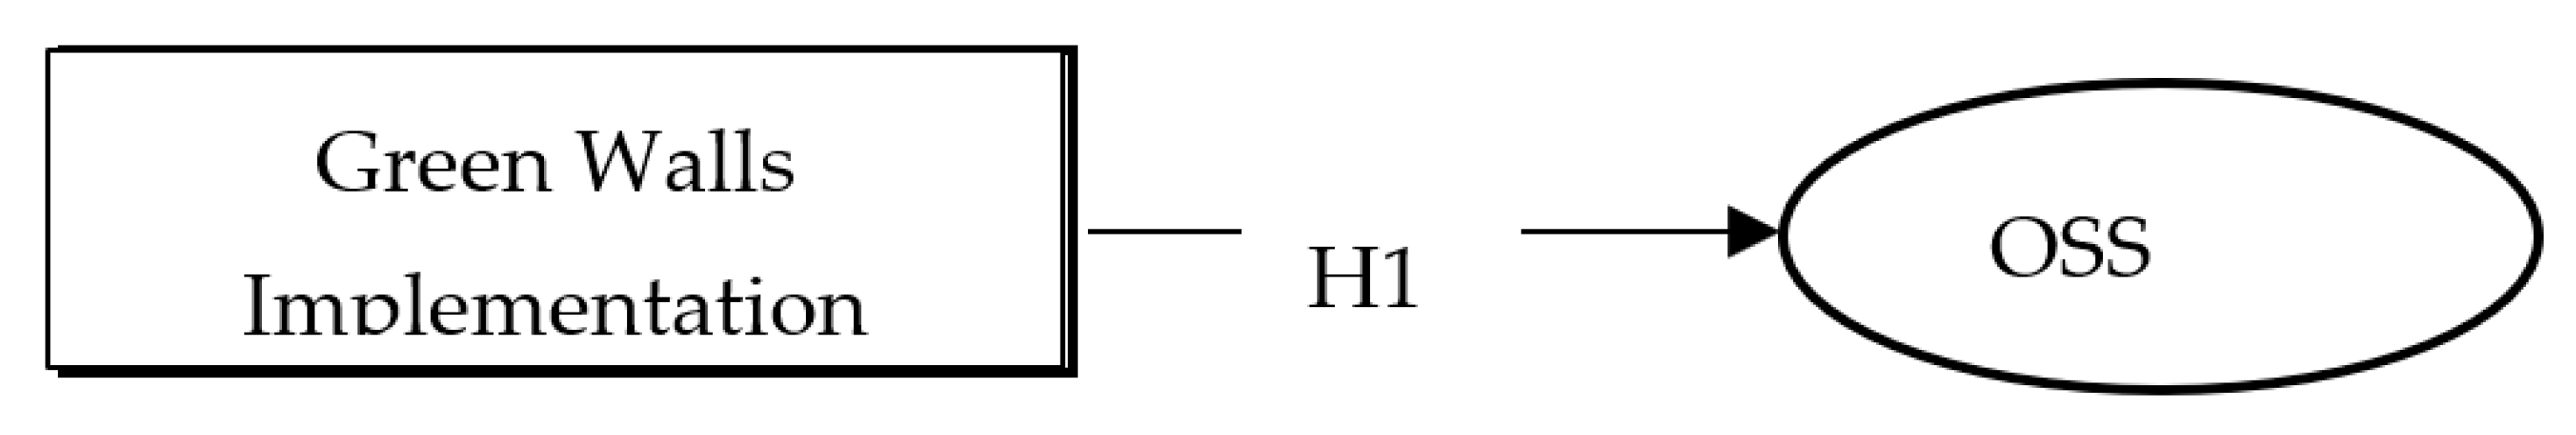
2.2. The Relationship between GWs Implementation on Overall Sustainable Success OSS

Green walls (GWs) are schemes that enable the greening of building vertical exteriors, including blind walls, walls, façade, and compartment walls, via various vegetal types [37]. Generally, GWs are categorized into two significant schemes, living walls and green facades [38]. Conventional green frontages typically use rising flowers that directly rise beside the wall, classified as straight green frontages [37]. However, direct green frontages comprise continuous modular and guide supports structures, e.g., wire mesh and trellis [39].
Permanent guides are built on a solitary backing building that points the direction of the plant lateral to the total surface, though green frontages with modular trellises include many segmental elements (basins for flower rooting) and a discrete support erection along the surface. Active walls are the up-to-date kind of GWs that support the incorporation of green facades in high-rise structures [40]. Besides the acceptance of different types of flowers, the speedy evolution and unvarying coverage of enormous perpendicular surfaces are the benefits of applying living walls [38]. Based on the presentation approaches, living walls are modular and incessant. Flowers are implanted in lightweight and permeable shades in continuous living walls referred to as perpendicular precincts [10].
Conversely, integrated living walls comprised exact measurements and a transitional layer for flower growing. Each component of the integrated active wall, i.e., vessels, dishes, flexible bags, or flowerpot tiles, is either indirectly or directly placed on the perpendicular surface [41]. Like other UGI methods employed in structures, including green roofs [42], the GWs adoption is influenced by some hurdles. Among the most critical hurdles to the GWs adoption is assumed to be the higher cost of their installation [43]. Likewise, the GWs’ associated maintenance cost is another critical constraint concerning their broader applications [20], i.e., GWs installation should be regularly pruned and irrigated. The procedure for GWs maintenance is regarded as complicated; thus, the maintenance labours and construction supervisors need a decent understanding of GWs to plan the process effectively [38]. The absence of appropriate maintenance might result in some critical concerns, such as the presence of numerous desiccated plants, which can expose the construction to the menace of fire, or possible damage, in the form of weakening of the back walls of green frontages.
Drinking water overconsumption also denotes another deterrent to GWs adoption; this obstacle has been neutralized through novel technologies [44]. Light and adverse climates are two additional barriers to the GWs adoption. The climate is bothered by the condition of the three significant standards in green wall design of buildings: temperature, humidity, wind and orientation. Conversely, light is concerned with adequate light for flowers [45]. Compatibly, the advents of pests on bugs frontages of buildings, such as yeast and bugs, are measured as an essential deterrent to the fitting of GWs. It chiefly influences the client’s decision to adopt GWs [46].
Even though the GW is measured as a sustainable alternative and option for traditional partitions in planning different structures (e.g., saleable and residential), the dearth of policies and incentives stipulated by qualified policymakers has been considered a deterrent that frustrates the broader adoption of GWs [12]. It is a severe barrier in third-world countries; construction policymakers and stakeholders put temporary attention over long-term and strategic achievements in delivering and defining projects in third-world nations. Similar to obstacles to UGI approaches’ adoption, the investors are diffident about choosing GWs instead of conventional approaches that they are more conversant with [47]. It is partly resultant of the uncertainties related to GWs as a novel technology, which also indicates the significance of government inducements to influence the investors’ perception when analysing the advantages and disadvantages of conventional approaches compared with GWs. Alternatively, a dearth of experience and expertise between engineers and the local access to methodological apparatuses have likewise been measured as obstacles to GWs implementation [19]. Because of the complex techniques needed for a practical GW application, i.e., demanding auxiliary structures, could expose labourers to additional latent risks [48].
A review concerning barriers to GWs adoption has identified many barriers, which are summarised in Table 1. Based on the existing literature, GWs adoption has received little attention. Besides, the existing studies on GWs adoption are dotted and contain an assortment of independent publications and papers. There has been an apparent lack of investigation; comprehensive research works that detect and scrutinize prevailing barriers are hard to access. Therefore, more investigation into this prolific area is justifiable and seems irrefutable. In practical terms, these studies will pave the way and improve the adoption of these green-based structures in the building business and may increase the relationship between policymakers and major investors. Thus, established on the initial literature review, this study, as indicated in Figure 1, theorized that:
H1: 
there is a significant correlation between trouncing hurdles to green walls adoption and OSS.

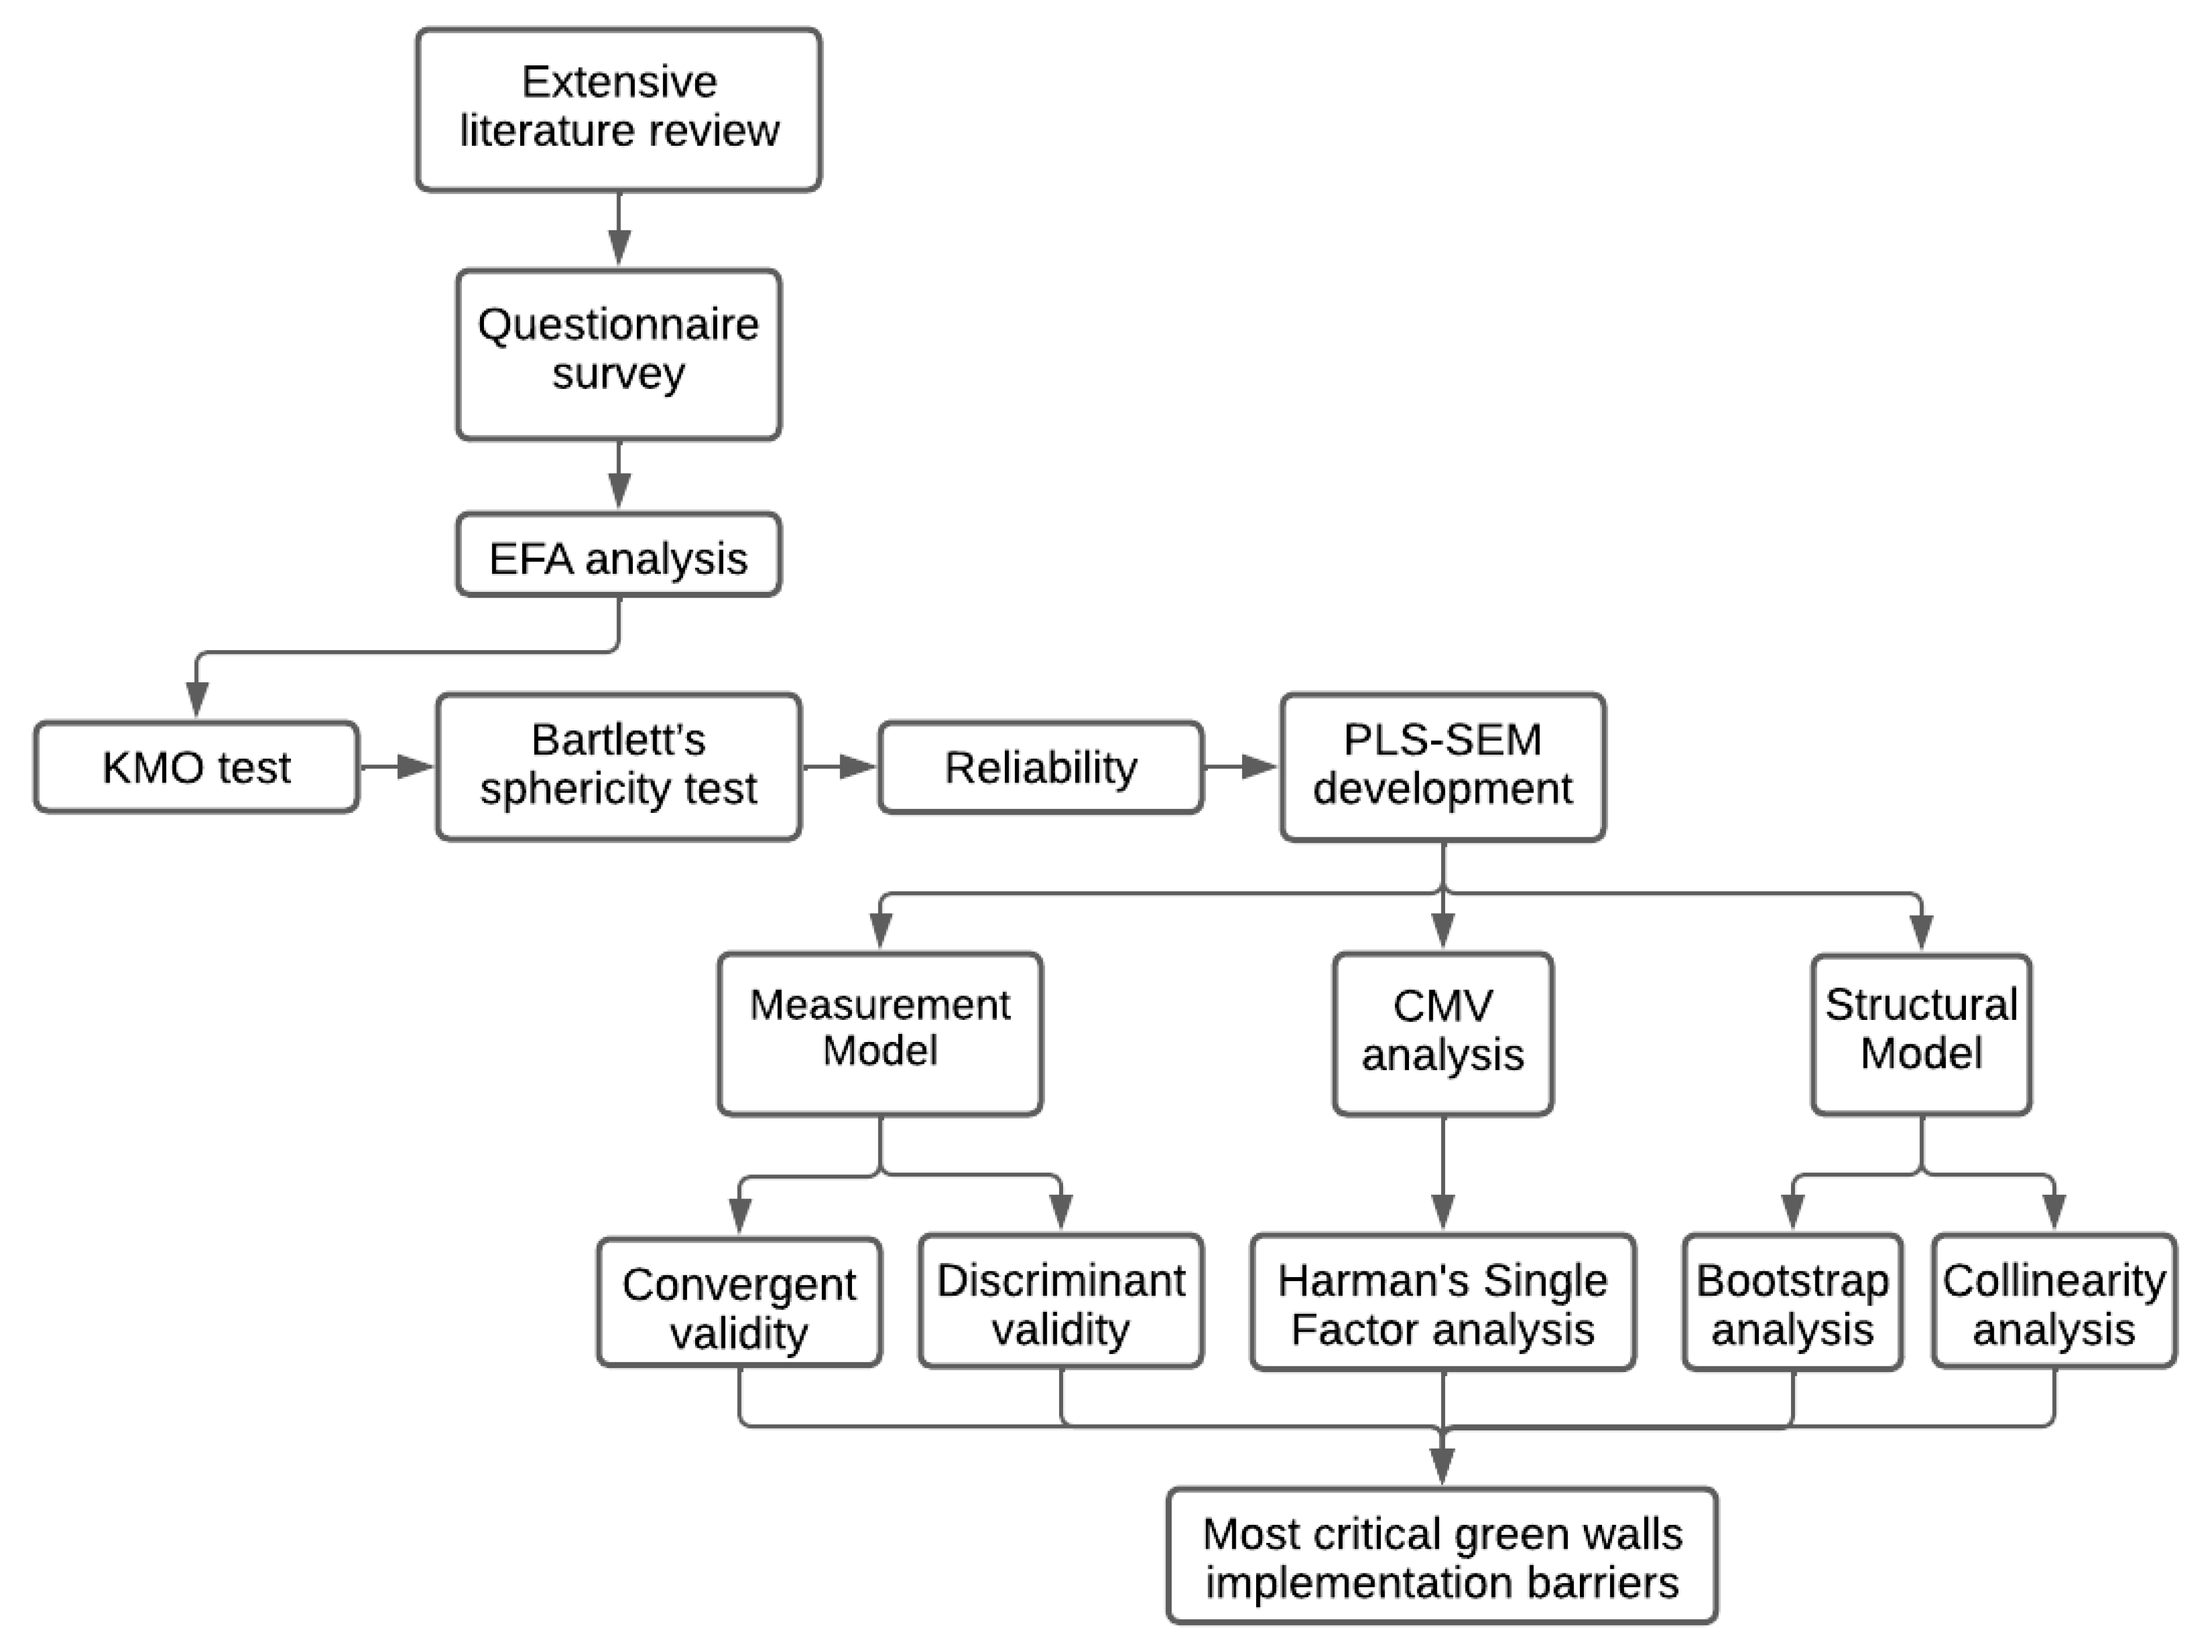
3. The Study Design and Methods

This study aims to raise the successful execution of building projects in Nigeria by detecting the hurdles to green wall application. Figure 2 illustrates this study’s analysis phases and was adopted from Othman et al. [54], Buniya et al. [55], Olanrewaju et al. [56] and Kineber et al. [23], illustrates the steps of the analysis.
The previous studies were carried out to identify the green walls’ implementation barriers. Consequently, a questionnaire survey tool was developed and employed for data collection concerning the green wall barriers. The questionnaire tool has assisted in measuring the following aspects:
i.
Commercial viewpoints, awareness and norms;
ii.
The connection between aspects, chiefly cause-and-effect interfaces [57].
The answers were gathered using the questionnaire concerning the respondents’ opinion of their participation in plan delivery, particularly constructors, designers, architects and quantity surveyors. Conventional constructors, supervision professionals, remarkable subcontractors, project managers, staff, and project site operators are all building industry participants.

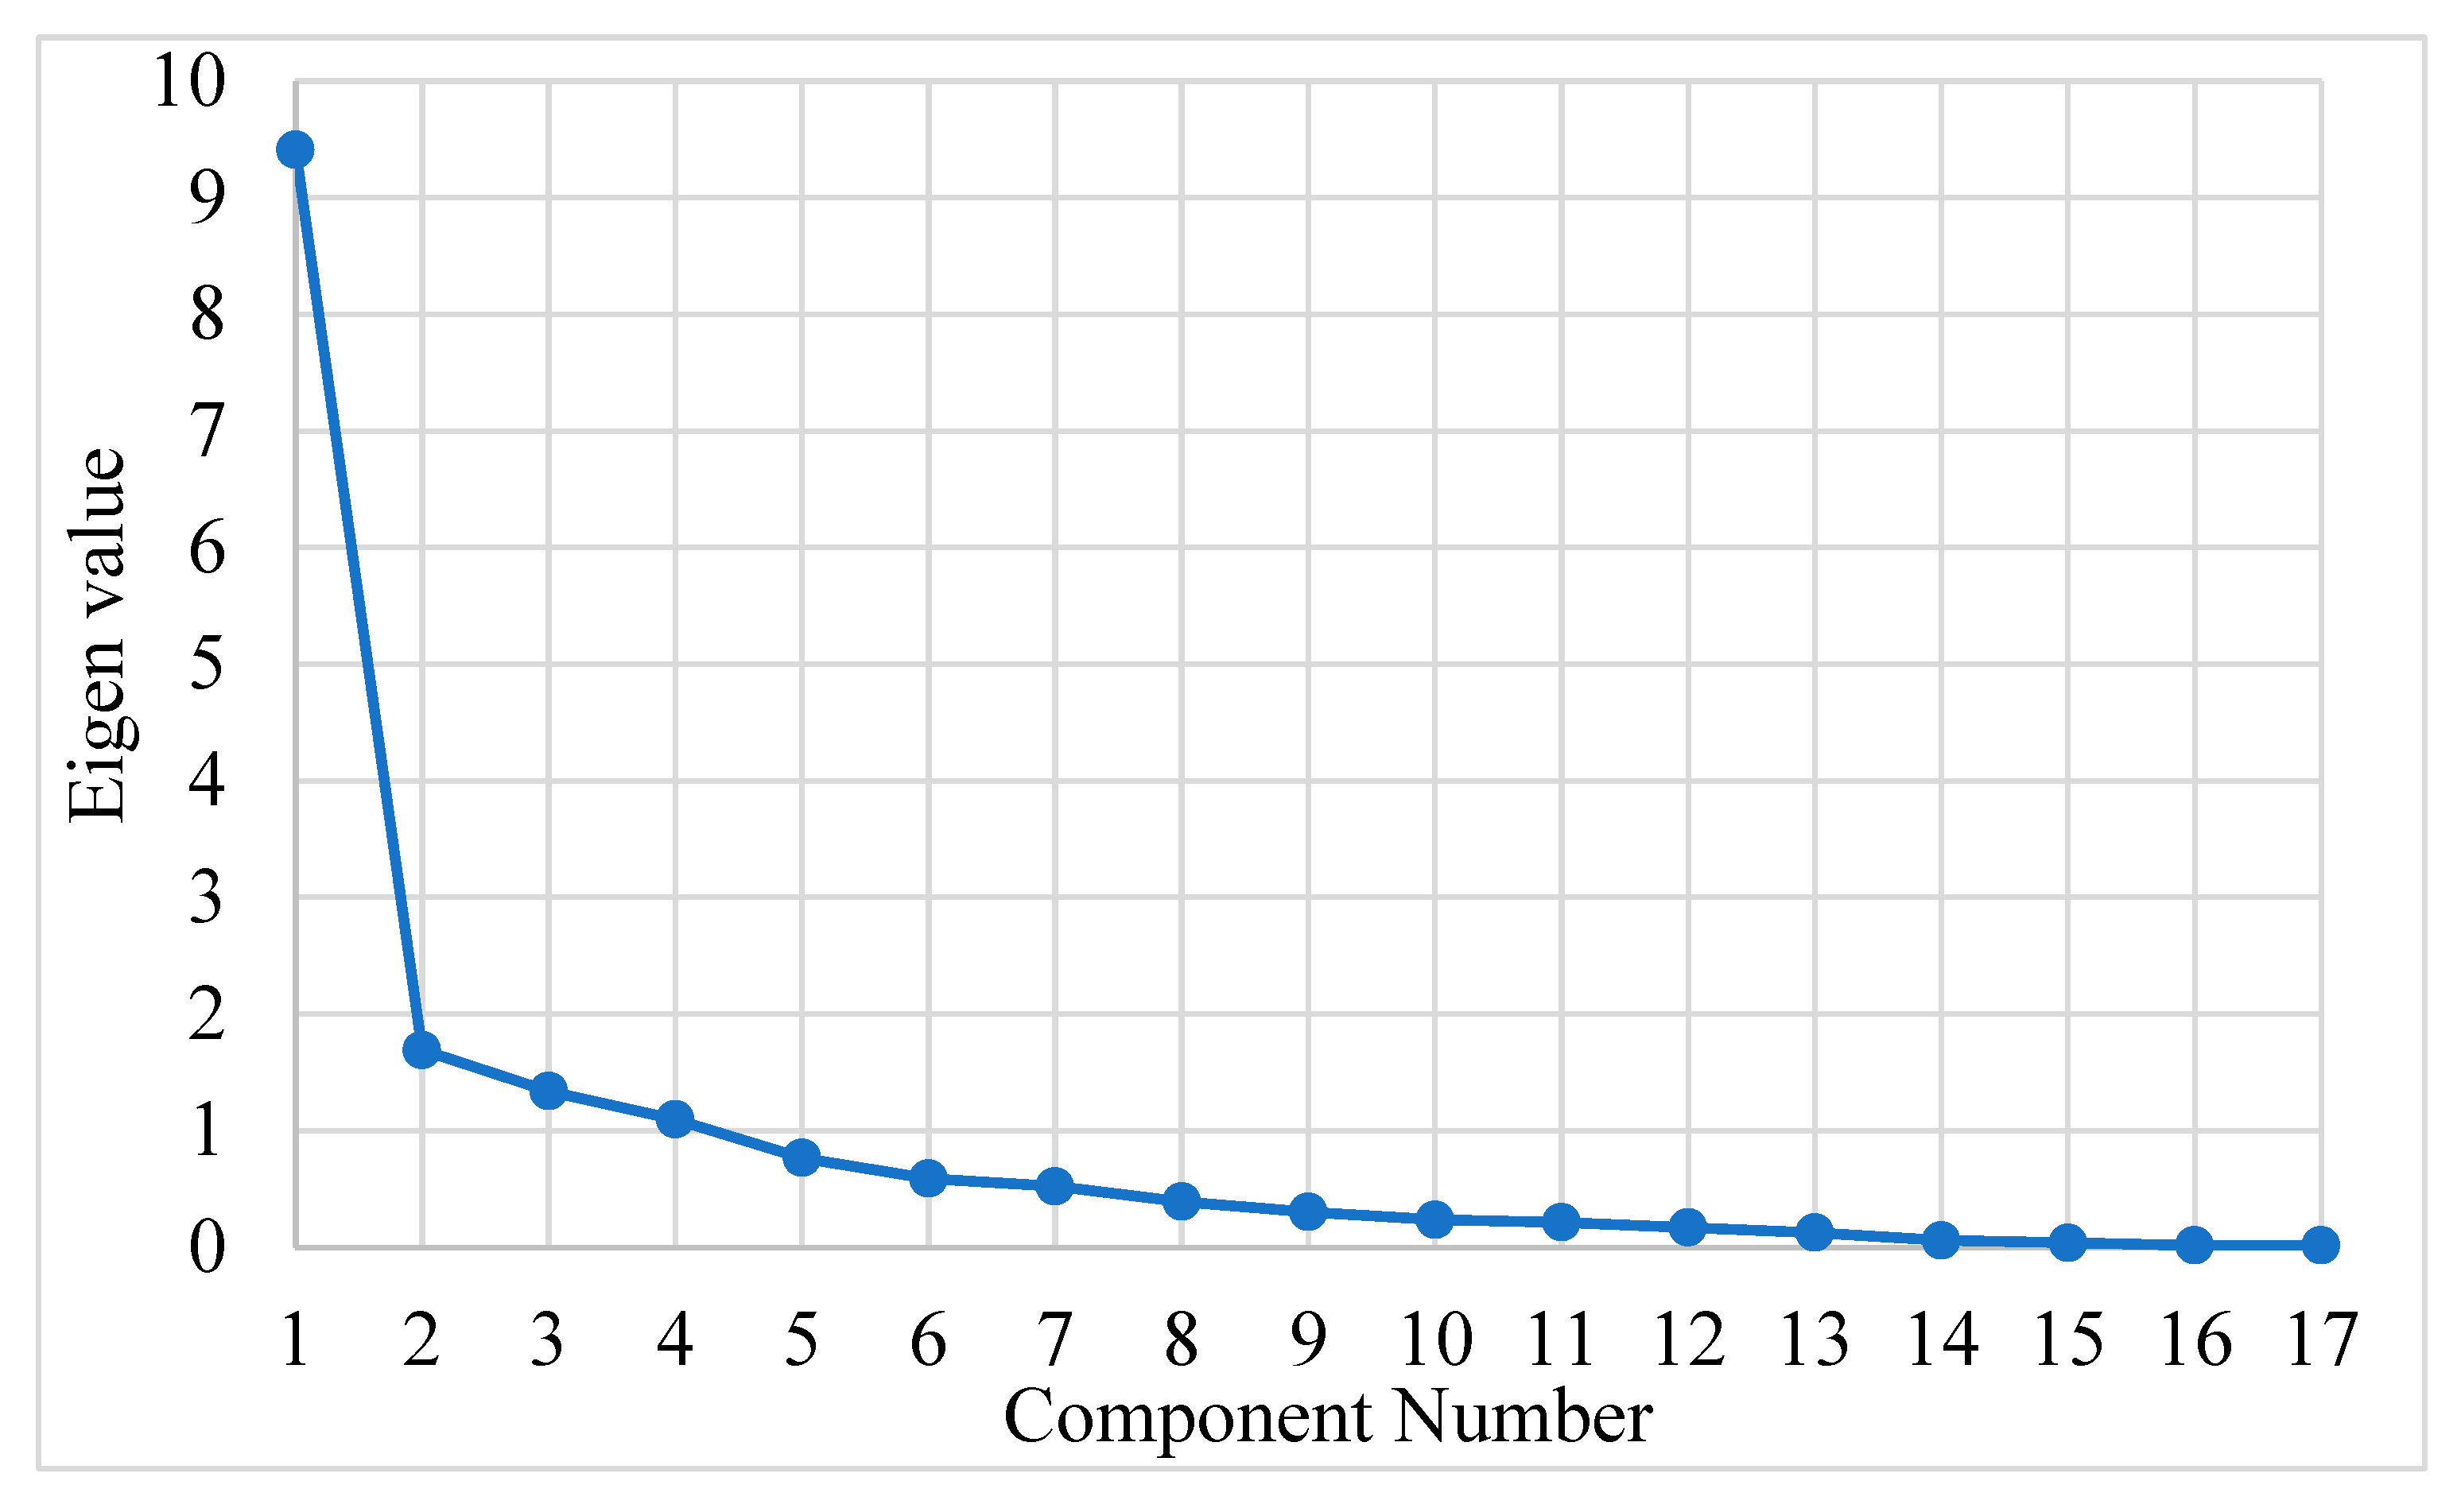
3.1. Analysis Construct Validity: EFA Assessment

The universally used factor analysis techniques are exploratory factor analysis (EFA) and confirmatory factor analysis (CFA) [58]. This study used the FCA to measure the significant composition of various variables in a specific hypothesis. Conversely, the EFA has applied gain knowledge concerning the relationships and numerous components to a few fundamental structures [59]. The principal component analysis (PCA) requires no prior hypothesis while defining the initial solution within EFA [60]. Thompson [61] indicated that PCA is a default form in different statistical software and, therefore, the most extensively used in EFA. The Varimax rotation method is essentially applied than direct Oblimin or Promax since the distribution of load between is reduced [62]. However, the Varimax rotation is more appropriate for factor analysis. It is an unexplained standard concept that reduces factors [63,64]. The variables can be measured as a different sample over relevant assortments [65]. Hence 10 considered factors, and the dispensed questionnaires to 90 respondents produced data for this study and are considered appropriate for factor analysis [58,66].

3.2. Development of SEM-PLS Model

Structural equation modelling and partial least squares (SEM-PLS) have attracted vast consideration over different disciplines, particularly business and social sciences research [67]. Numerous studies on the SEM-PLS approach have recently been accessible in trending SSCI journals [68,69,70,71]. The novel software package (SMART-PLS 3.2.7) was used for data analyses to model the significance of barriers to green walls via SEM. The SEM-PLS was first acclaimed for its exceptional principles over covariance-based SEM (CB-SEM) [72]. Though the variances between the two methods are relatively low [73]. The statistical analysis conducted in this study involved the structural and measurement technique.

3.2.1. Common Method Variance

Standard method variance (CMV) is a similar variance that can be assigned to constructs and the instrument category [74]. In some circumstances, the field data can be exaggerated or prevent the level of studied relationships and thus prompt challenges [75,76]. This can be critical for this study since all the analysed data is personal, subjective, and derived from a single source. Therefore, it is essential to attend to these problems to detect any variation in the data. A conventional one-factor test was explained and used in a study by Harman 1976 [77]. A particular factor was obtained from factor analysis which explained a more significant part of the variance [76].

3.2.2. Analytical Model

The analytical model shows the interrelationship between the variable and the underlying covert structure [78]. The analytical model’s convergent and discriminant validity are explained in the subsequent sections.

Convergent Validity

Convergent validity (CV) represents the level of agreement between two or more indicators or tolls of analogous constructs [79]. It is identified as a subset of CV. Concerning PLS, the calculated construct’s CV can be measured via three tests [80]. These are Cronbach’s alpha ( α ) Composite reliability scores ( P c ) and Average variance extracted ( A V E ) . Nunnally and Bernstein [81] suggested a ( P c ) value of 0.7 as the higher boundary of ‘modest’ composite reliability. For any type of study values above 0.60 and 0.70 are experimental analysis are deemed acceptable [82]. The last test was AVE. It is a conventional measure performed to assess the constructs’ CV in a model. Values greater than 0.50 shows an exceptional CV [82].

Discriminant Validity

Discriminant validity (DV) proposes that the evaluated incident is methodically exclusive and shows that any dimension does not identify the peculiarity measured in SEM [83]. Campbell and Fiske [84] posited that the correlations between indicators or tools must be atypical and highly high for DV to be executed.

Operational Model

The primary objective of this study is to highlight barriers to averting green walls (GWs) adoption using the SEM approach. Achieving this requires identifying and measuring path coefficients. Therefore, the path correlation or the underlying correlation was hypothesized between £ GWs adoption barriers and µ , i.e., barriers. Consequently, the structural relationship between £ ,   µ   a n d   1 rule in the operational model, which is identified as an internal relationship, can be represented as a linear equation [85]:
μ = β £ +   1
where the path coefficient linking GWs adoption barriers is ( β ) , ( 1 ) denotes the residual variance expected to reside in the structural intensity. The standardized regression weight is β , similar to β in a multiple regression model. The signs must be simultaneous to the model estimations and experientially significant. The major problem is how to validate the β s significance of the path coefficient. Concerning CFA, bootstrapping techniques are present in the SmartPLS3.2.7 software package was employed to estimate the standard errors of path coefficients. It was performed on 5000 subsamples based on Henseler et al. [67]’s recommendation. Conversely, Henseler et al. [67] describe the measurements of hypothesis testing. The suggested structural equations for constructs of GWs adoption barriers were conceived for the PLS model, suggesting the internal correlations of the constructs and Equation (1).

4. Results

4.1. EFA for Green Walls Implementation Barriers

This research concentrated on adopting green walls (GWs) and barriers to implementation, particularly in construction businesses in Nigeria. The study procedure was implemented because of the large sample of participants in the building industry in Nigeria. The EFA analysis sample needs to be 45 to 61 cases. It was appropriately measured using moderately short answers.
Similarly, all the appropriate tests were performed [66]. The participant’s demographic features were captured in the preliminary section of the survey tool (or questionnaire). The subsequent sections were connected to barriers to GWs implementation and overall Sustainable Success (OSS). A five-point Linkert Scale was used. The answers were categorized as 5 (very high), 4 (high), 3 (average), 2 (low) and 1 (very low). This survey tool has been extensively reported in the literature [64,86,87,88].
Various well-defined constructs for the factorability of correlation have been applied. The Kaiser-Meyer-Olkin Measure of Sampling Adequacy (KMO) can be adapted to measure the similarity of factor(s), and it is extensively applied to check whether partial correlations of parameters are possible [89]. The data retrieved were deemed suitable for performing factor analysis. Similarly, it was deemed apt for Bartlett’s Test of Sphericity for correlation suitability between the incredibly momentous tools. The test indicates whether a sampling approach or suitable set of data for factor analysis. The KMO = 0.63 was used to perform the sampling adequacy test, indicating that 63% of the acquired data were appropriate for factor analysis [89]. Likewise, the findings revealed that the p-values considered were <0.001, giving a degree of freedom of 136 and a calculated Chi2 of 742. Bartlett’s test (p < 0.001) was measured as necessary for this study. Thus, it suggests a substantial correlation within the data matrix. It further indicated that all the itemized item’s correlation matrix is correlated significantly at a 5% level. Therefore, the EFA was deemed suitable, and these results agreed with the existing literature [65,90]. The total variance explained the domains of GWs adoption barriers in the building industry. The PCA revealed the existence of four factors (or components) with eigenvalues >1. These components explained 38.2%, 13.74%, 16.92%, 13.4%, and 10.6% of the total variance. The evaluation of the scree-test revealed a pure break after the second component as shown by Figure 3. The contact where the slope of the curve is evidently levelling off imply that the many factors that must be produced by the analysis. The rotated varimax factor matrix of GWs adoption barriers in Nigeria’s building sector. The model comprises four major barriers and fit for expressing the impact of GWs in Nigeria’s building industry. The component clustering founded on alternated varimax is summarised in Table 2. Every variable has profoundly weighed in one of the collections only. The earlier interpretation of the four major groups indicates the significance of mentioning these factors. Conversely, there is no strict procedure for factor identification. Hence, meditatively classifying these components or factors was deemed fit for this analysis. Respective factors were identified and inferred, as presented in Table 3. These barriers comprised policy, environment, guidelines, technical and standards.

4.2. Common Method Bias (CMB)

The single-factor analysis was employed in this article to assess the standard technique’s variance [91]. Suppose the total variance of the factor is less than 50%; the CMB does not affect the data [77]. The results revealed that the first set of factors or components explained 48.4% of the total variance. It implied that the CMB did not affect the current findings because it was below 50% [77].

4.3. Analytical Model

The assessment of the theoretical analytical models or tools in the SEM-PLS involves the computation of convergent validity (CV), discriminant validity (DV), and internal consistency (IC). Based on this analysis, all the constructs in the analytical model have fulfilled the requisite limit of Pc and α, which is deemed acceptable [92]. Similarly, Table 4 indicated that all the analytical constructs had passed the AVE test. The appropriate AVE level needs to be above 0.5 [80]. The values of AVE computations were above 50%, as indicated in Table 4. These results have indicated that the investigative model is internally reliable and convergent. It further suggested that the methodical constructs are correctly computed for each model construct and do not compute any other construct. The higher external loadings for model constructs suggest a strong correlation between the significant variables of each construct. The rule is that variables with external loads below 0.4 must be regularly eliminated from the measurement scale [73]. The external loading higher than 0.70 are presented in Figure 4.
The assessment of discriminant validity (DV) is increasingly becoming popular and necessary in SEM studies [93,94]. It is usually applied to validate that the assessed constructs are distinct empirically or exclusive [83]. In this paper, the DV was evaluated using the methods below:
i.
Cross loading;
ii.
Hetrotrait-Monotrait Criterion Ratio (HTMT);
iii.
Fronell-Larcker Criteria.
The computed DV of OSS and GWs constructs using Fprnell and Larker’s criterion, as summarised in Table 5, are within the acceptable range because the EVE’s square root was more significant than the relationship between the indicators and variables of the construct [80,95].
The second approach used in this study was the Hetrotrait-Monotrtait Criterion Ratio (HTMT). It is a new technique for assessing the DV of variance-based SEMs by computing the accurate correlation between the binary constructs that are evaluated satisfactorily. Hair et al. [76] suggested that the values be lower than 0.85 and 0.90. they are denoting that the binary constructs were dissimilar. Supposedly the constructs of the model are theoretically and remarkably analogous; the HTMT values should be below 0.90 and 0.85 if the constructs of the model are theoretically different. The HTMT analysis revealed that all the studied constructs or variables have good DV (Table 6).
The cross-loading criteria analysis was also conducted to measure the GWs’ DV adoption barriers and OSS constructs. It was used to validate whether the latent construct’s variable loading is greater than the remaining cross-loadings obtained from other models’ constructs [96]. Based on the findings summarised in Table 7, it can be noticed that all the loadings on the indicators of the construct are above the other concealed variables cross-loading by row. Hence the one-dimensionality of every model’s construct can be tested.

4.4. Second-Order Analysis

Meanwhile, the constructs for GW barriers in this study were determinative (or formative), and high correlations among the evaluations of determinative analytical models are usually unpredictable. Similarly, the significant relationship between determinative variables suggests collinearity and is therefore considered knotty [96]. Hence, the study detected collinearity between the formative variables in the model’s construct by evaluating the variable inflation factor (VIF) value, since this study deals with the reflective-determinative form of the first-order concept. Based on the results, the absolute values of VIF were below 3.5. It suggested that the model’s constructs have autonomously contributed to GWs adoption barriers. Conversely, four first-order sub-scales for GW barriers, such as business and technology, people and training, standard and cost, and economic and procedure, all had a momentous path coefficient (β).
It suggested that the model constructs contributed independently to green walls’ implementation barriers. Conversely, four-first-order subscales of GW obstacles, mainly business and technology, cost and criterion, training and parties, economic and approach, have a robust outer weight (or path coefficients) β as indicated by Figure 5.

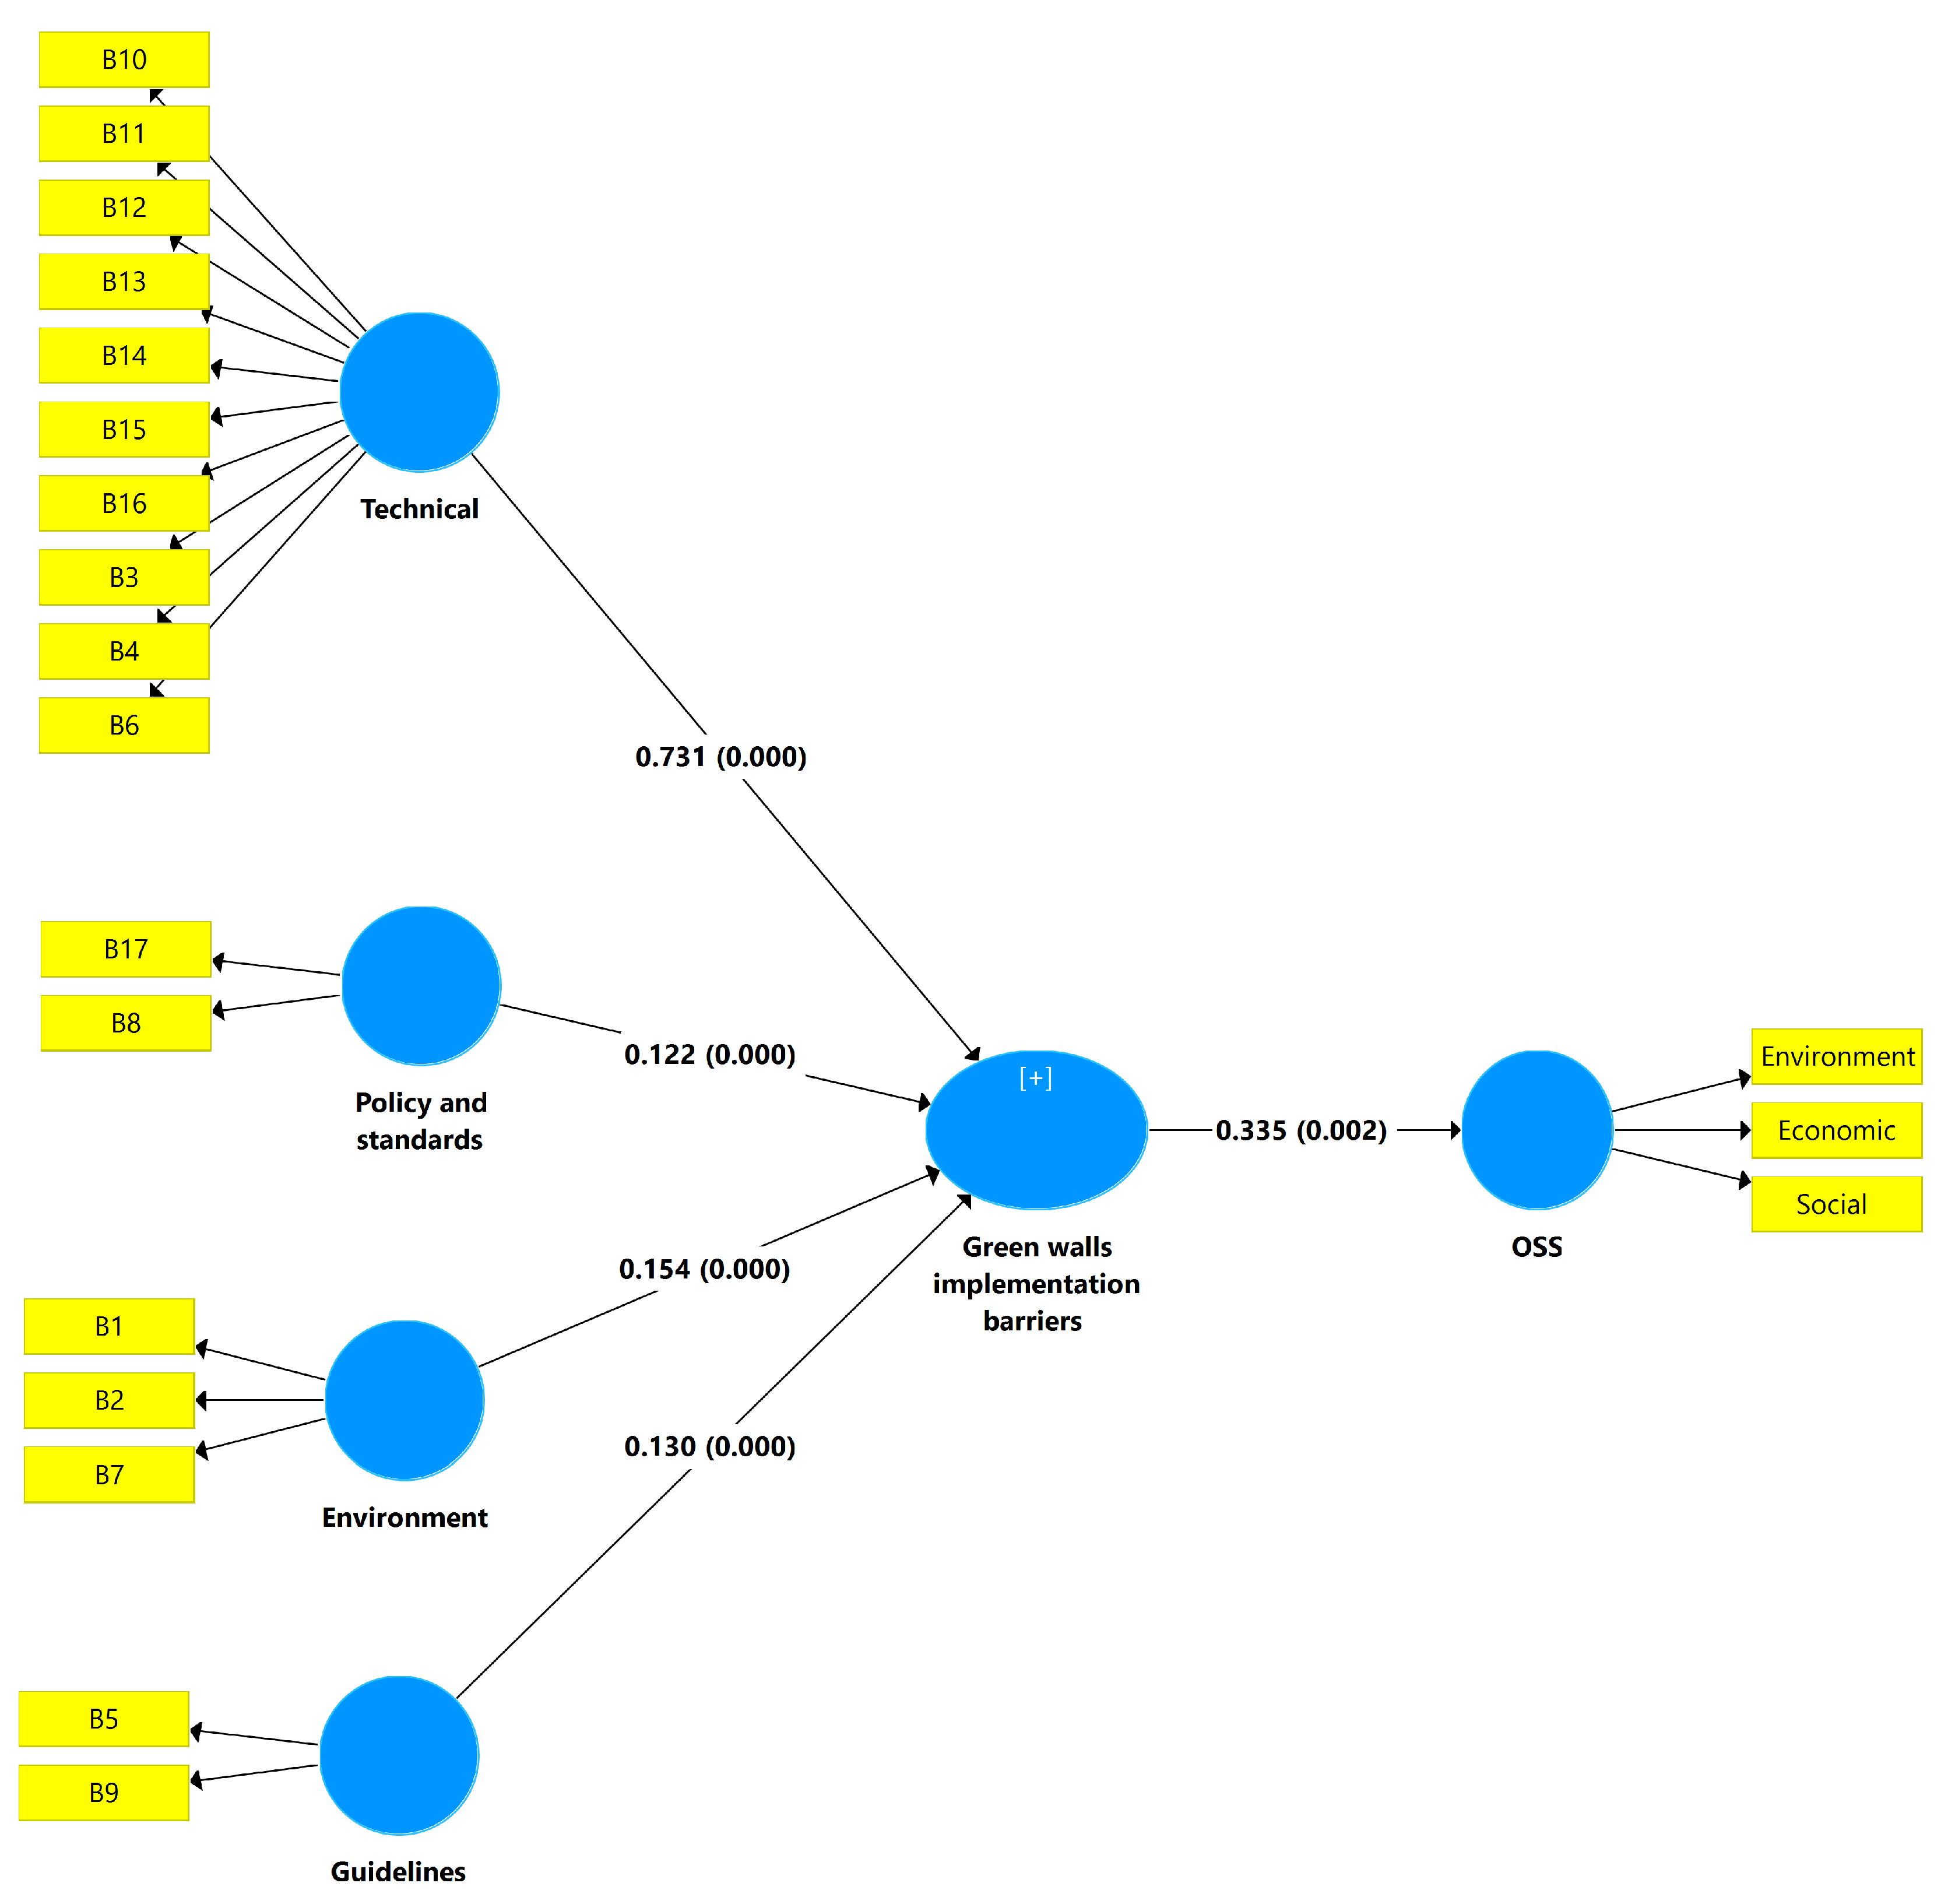
4.5. Analysis of the Structural Model

Another vital component of this analysis includes validation of the proposed hypothesis of the study. The implication of the model’s premise was verified in the framework and from the bootstrapping process’s viewpoint [72]. The numerical significance and data set’s reliability can be tested using the bootstrapping approach. Thus, the path coefficient (i.e., outer weight and p-value) was measured at a 95% confidence interval (CI0.95) [72,97]. The bootstrapping technique allows for random resampling involving the original data to generate different samples of comparable size with an initial set of data [98,99]. It aids in testing the data set’s reliability, and therefore the error of the path coefficient can be measured [100]. The value between each path shows the path coefficient. It estimates one variable’s influence level on another [101]. The natural connexion was theorized between OSS and £ (i.e., overcoming GW adoption barriers construct) as depicted in Figure 5. Thus, the structural connexion amongst µ, £, and €1 equations within the structural model has been identified as the inner connexion. It is denoted as a linear equation [85]:
µ = β   £ + 1
where at the structural level, the path coefficient linking overcoming GW adoption barriers is constructed is represented by β, 1 epitomizes the expected accumulated residual variance. Hence, the standardized regression weight is comparable to the multiple regression analysis’s weight. Its footprint must concur with the model’s forecast and be significant statistically. So, the problem remained concerning how to measure the impact of the path coefficient (β). Regarding CFA, a bootstrapping method was employed in the SmartPLS3.2.7 package to compute the errors of the path coefficient. Five thousand sun samples were used in this study based on Henseler et al. [67]’s recommendation. Thus, it was used to establish the t-test statistics for hypothesis testing.
To summarise, a single structural equation for tackling GW adoption hurdles was developed for the PLS model. It characterized the internal connexion between Equation (1) and the construct. Hence, the significance of the pathway and the standardized p-values (β) for the internal were also established (Figure 4). The bootstrapping analysis’ results are depicted in Figure 4. The effects of overcoming GWs adoption barriers and OSS were significant and positive (β = 0.5, p = 0.0005). Consequently, the two significant features in this analysis, i.e., tackling GW adoption hurdles and OSS, are consistent.

4.6. The Structural Model’s Exploratory Power

One of the critical PLS-SEM assessments involves estimating the value of R2 for the internal variables [102]. The model’s results revealed that the values of R2-adjusted and R2 for OSS as the primary conditional variable in this analysis were 0.11. it suggested that the internal dependent variable (GW adoption obstacles) can account for 11% of OSS. Hence, the size marked by GW barriers is sufficient and considered a small-moderate impact [97,103,104].

4.7. Importance Performance Matrix Analysis (IPMA)

The SEM-PLS technique shows the independent construct’s value in describing the model’s dependent construct [73,92]. IPMA magnifies the SEM-PLS output by reflecting the variable performance. The IPMA findings can be depicted from two features, i.e., performance and significance, which are particularly important for supervision planning [92]. The total structural model’s effects (or significance) and the optimum value constructs variable ranks (or performance) were betrothed to highlight the critical parts for improving management actions. The IPMA was used as a conditional construct for GWs adoption barriers. The suggested model shows the internal variable (GWs adoption barriers) level of performance and significance on OSS as the pursued variable. Therefore, it was discovered that the entire variables have excellent relative performance (64.25) and importance (0.335).

5. Discussion

Association between the constructs was investigated using a partial least squares structural equation model (overcoming green walls and OSS). Surmounting the GW obstacles, “Environment, Guidelines, Policy and standards, Technical” in that order of influence, was not unexpected. Our research shows that removing just 11% of these GW roadblocks can significantly improve OSS. Improving OSS depends crucially on overcoming the GW obstacles. However, the numbers showed that to break through the 1 GW barrier, a value of β = 0.335 is required. The OSS enhancement level will rise because of this as well. The proposed paradigm, however, draws attention to the key challenges associated with green walls that must be addressed.
Initial building expenses due to energy-efficient systems, the difficulty of sourcing green materials locally, the greater cost of green construction materials, the higher cost of the development and installation of green features, and the time needed to adopt green design techniques, are all significant financial and time barriers [105]. Findings from a study conducted in Malaysia indicated that one of the main obstacles was the absence of financial incentives to pay the substantial outlay of capital required to get started [106]. Similarly, Bandy et al. [107] concluded that the high upfront cost resulting from novel design and technology represents the most significant barrier to green building growth in the United States. According to a paper published by Analytics [108], formerly McGraw-Hill Construction, four major obstacles stand in the way of the widespread use of GBFs. First, there is the notion that initial expenses will be greater; second, there is a lack of public knowledge; third, there is a lack of political backing or incentives; and fourth, there is a belief that going green is reserved for more expensive initiatives.
Several studies have found that the high cost of implementing green building practices is the primary deterrent for many building owners and managers [109,110,111,112]. In comparison to other considerations, cost-effectiveness is deemed paramount [113]. Construction expenses for green buildings are known to be greater than those of traditional buildings [114,115]. Additionally, green technologies’ development and authorization processes are fraught with risks and uncertainties, necessitating a sizable buffer in the allocated budget [116]. Similarly, a study focused on the United States and Hong Kong also indicated that the initial investment was the most important factor in green implementations [117]. Generally, developers choose conventional buildings because of green buildings’ extended payback period [118].
High ongoing maintenance expenditures are another hindrance [119]. For instance, the requirement for routine watering and trimming might drive up the price of a green roof. Developing and deploying cutting-edge project management approaches, tools practises, and procedures is essential for the effective rollout of green initiatives [120]. One of the largest obstacles is the sophistication of the technologies involved in green applications [113]. Both Zhang et al. [121] and Zhang et al. [122] illustrated the complexity of the building techniques and procedures related to the adoption of green technology, confirming this notion. As a result, it is crucial to check that everyone working on the project management side is knowledgeable and skilled at what they do. In addition, governments play a significant role in encouraging green characteristics by offering financial and other benefits. A major obstacle to the development of environmentally friendly structures is the absence of support from governments and other responsible parties in the form of financial rewards and education campaigns [112].

6. Conclusions

This study has shown that GW adoption hurdles may be removed in order to reduce this danger. On the other hand, this approach is not often used in the building sector of third-world countries. A questionnaire survey instrument was used in this research’s quantitative methodology in Nigeria. Participants from Nigeria’s construction sector participated in this study, which used the SEM-PLS approach to present an experientially validated model. The model’s findings would assist construction industry players in removing obstacles that prevent the adoption of GWs, similar to how they will reduce project costs and improve building success in Nigeria and other developing countries. Although the examination of GW adoption hurdles in Nigeria’s construction industry is the exclusive focus of these studies, the conclusions are transferable to other developing countries with similar conditions to Nigeria and where comparable assessments are lacking. The following are some of the conceptual and empirical consequences of this study.

6.1. Empirical and Conceptual Contributions

The suggested analytical approach highlights the need of removing barriers to GW adoption, particularly in third-world countries. The model emphasizes the crucial adoption obstacles for GWs. In order to create an action plan to facilitate the deployment of GWs in the AECO sector, policymakers and relevant authorities can thus have an impact on overcoming these acknowledged GWs challenges. The study also evaluated the interaction between OSS and GW adoption barriers in Nigeria’s construction industry. This study began by evaluating all of the significant obstacles to the implementation of GWs in the construction industry. This study has established a solid foundation on which further studies on the obstacles to GW adoption in the AECO may be created. As a result, the hypothetical theories from this research offered a statistical framework for identifying GW adoption barriers that must be eradicated to improve sustainable implementation in Nigeria and similar developing countries. Likewise, many empirical and theoretical contributions made by this research are as follows:
  • Conceptually, this study contributes by conceptualizing and identifying other concepts that can be added to the theoretical context, including the influence of GW adoption barriers on OSS throughout the lifecycle of projects.
  • There is extensive literature on GWs adoption from advanced countries. In contrast, there is a dearth of good literature from developing nations, including Nigeria. This study has lessened this gap by assessing the major obstacles to GWs implementation with OSS.
  • The research results, i.e., the proposed model, is a novel estimating model generated for the construction industry to envisage the effect of GW adoption hurdles on OSS in the building project lifecycle in the AECO industry.
  • This model is expected to propel the adoption of GWs in third-world nations. This experiential contribution focuses on analysing the conceptual relationships among the binary constructs, i.e., GW adoption barriers and OSS in building project lifecycle. The existing literature has not fully explored this.

6.2. Managerial Implications

Building experts can employ the resulting decision-making inferences in assessing the effect of GW adoption barriers on OSS during the building project lifecycle as follows:
  • It offers AECO companies major barriers that could be eradicated to tackle the problems and barriers linked to GWs adoption, improving client satisfaction via quality visualization.
  • It aids decision-making concerning analysing GW adoption barriers on OSS throughout the building project lifecycle.

6.3. Research Limitations and Future Direction

Notwithstanding the crucial contributions made by this research, it has many limitations worthy of being documented to guide future research directions, as follows:
  • Firstly, this study has geographical limits. Thus, the current results may be difficult to generalize. The survey tool applied in this research was administered to building experts in Southwestern Nigeria. Hence, future studies are needed to expand the geographical scope beyond this study by incorporating more regions in Nigeria and similar developing nations for a more valid generalization of research results.
  • Secondly, this study was cross-sectional and did not incorporate historical and organizational perspectives on GWs adoption. Therefore, upcoming research works ought to be longitudinal to enable a profound perception of the interface among GW adoption hurdles and OSS in building project lifecycle.
  • Thirdly, it concentrated on the PLS-SEM application to assess the connexion concerning GW adoption hurdles and OSS in building project lifecycle via theoretical conceptualization. Therefore, upcoming research should concentrate on the identification of the extent of sustainable implementation via theory adoption, including the technology acceptance model (TAM), technology organization and environment model (TOEM), and innovation diffusion theory (IDT).

Author Contributions

Conceptualization, A.F.K. and A.E.O.; methodology, A.F.K. and A.E.O.; software, A.F.K.; validation, A.F.K. and A.E.O.; formal analysis, A.F.K.; investigation, A.F.K.; resources, A.F.K. and A.E.O.; data curation, A.F.K. and A.E.O.; writing—original draft preparation, all authors; writing—review and editing, A.F.K. and M.M.H.; visualization, A.F.K. and M.M.H.; supervision, A.F.K. and A.E.; project administration, E.F.R. and A.E.; funding acquisition, A.F.K. All authors have read and agreed to the published version of the manuscript.

Funding

This study is supported via funding from Prince Sattam bin Abdulaziz University project number (PSAU/2023/R/1444).

Data Availability Statement

All the data derived from the study have been presented in the paper. However, further inquiries could be directed to either the first or corresponding authors.

Conflicts of Interest

The authors declare no conflict of interest.

References

  1. Aidy, A.; Rady, M.; Mashhour, I.M.; Mahfouz, S.Y. Structural Design Optimization of Flat Slab Hospital Buildings Using Genetic Algorithms. Buildings 2022, 12, 2195. [Google Scholar] [CrossRef]
  2. Castiglia Feitosa, R.; Wilkinson, S.J. Small-scale experiments of seasonal heat stress attenuation through a combination of green roof and green walls. J. Clean. Prod. 2020, 250, 119443. [Google Scholar] [CrossRef]
  3. Imran, H.M.; Kala, J.; Ng, A.W.M.; Muthukumaran, S. Effectiveness of green and cool roofs in mitigating urban heat island effects during a heatwave event in the city of Melbourne in southeast Australia. J. Clean. Prod. 2018, 197, 393–405. [Google Scholar] [CrossRef]
  4. Fabijańczyk, P.; Zawadzki, J. Spatial correlations of NDVI and MSAVI2 indices of green and forested areas of urban agglomeration, case study Warsaw, Poland. Remote Sens. Appl. Soc. Environ. 2022, 26, 100721. [Google Scholar] [CrossRef]
  5. Gabriel, K.M.A.; Endlicher, W.R. Urban and rural mortality rates during heat waves in Berlin and Brandenburg, Germany. Environ. Pollut. 2011, 159, 2044–2050. [Google Scholar] [CrossRef] [PubMed]
  6. Perini, K.; Rosasco, P. Is greening the building envelope economically sustainable? An analysis to evaluate the advantages of economy of scope of vertical greening systems and green roofs. Urban For. Urban Green. 2016, 20, 328–337. [Google Scholar] [CrossRef]
  7. Helman, D.; Yungstein, Y.; Mulero, G.; Michael, Y. High-Throughput Remote Sensing of Vertical Green Living Walls (VGWs) in Workplaces. Remote Sens. 2022, 14, 3485. [Google Scholar] [CrossRef]
  8. Gomez-Martinez, F.; de Beurs, K.M.; Koch, J.; Widener, J. Multi-Temporal Land Surface Temperature and Vegetation Greenness in Urban Green Spaces of Puebla, Mexico. Land 2021, 10, 155. [Google Scholar] [CrossRef]
  9. Moreno, R.; Ojeda, N.; Azócar, J.; Venegas, C.; Inostroza, L. Application of NDVI for identify potentiality of the urban forest for the design of a green corridors system in intermediary cities of Latin America: Case study, Temuco, Chile. Urban For. Urban Green. 2020, 55, 126821. [Google Scholar] [CrossRef]
  10. Tabatabaee, S.; Ashour, M.; Mohandes, S.R.; Sadeghi, H.; Mahdiyar, A.; Hosseini, M.R.; Ismail, S. Deterrents to the adoption of green walls: A hybrid fuzzy-based approach. Eng. Constr. Archit. Manag. 2022, 29, 3460–3479. [Google Scholar] [CrossRef]
  11. Koch, K.; Ysebaert, T.; Denys, S.; Samson, R. Urban heat stress mitigation potential of green walls: A review. Urban For. Urban Green. 2020, 55, 126843. [Google Scholar] [CrossRef]
  12. Liberalesso, T.; Oliveira Cruz, C.; Matos Silva, C.; Manso, M. Green infrastructure and public policies: An international review of green roofs and green walls incentives. Land Use Policy 2020, 96, 104693. [Google Scholar] [CrossRef]
  13. Radić, M.; Brković Dodig, M.; Auer, T. Green Facades and Living Walls—A Review Establishing the Classification of Construction Types and Mapping the Benefits. Sustainability 2019, 11, 4579. [Google Scholar] [CrossRef] [Green Version]
  14. Rady, M.; Mahfouz, S.Y. Effects of Concrete Grades and Column Spacings on the Optimal Design of Reinforced Concrete Buildings. Materials 2022, 15, 4290. [Google Scholar] [CrossRef]
  15. Mahdiyar, A.; Tabatabaee, S.; Sadeghifam, A.N.; Mohandes, S.R.; Abdullah, A.; Meynagh, M.M. Probabilistic private cost-benefit analysis for green roof installation: A Monte Carlo simulation approach. Urban For. Urban Green. 2016, 20, 317–327. [Google Scholar] [CrossRef]
  16. Shen, L.; Zhang, Z.; Long, Z. Significant barriers to green procurement in real estate development. Resour. Conserv. Recycl. 2017, 116, 160–168. [Google Scholar] [CrossRef]
  17. Rady, M.; Mahfouz, S.Y.; Taher, S.E.-D.F. Optimal Design of Reinforced Concrete Materials in Construction. Materials 2022, 15, 2625. [Google Scholar] [CrossRef]
  18. Morakinyo, T.E.; Lai, A.; Lau, K.K.-L.; Ng, E. Thermal benefits of vertical greening in a high-density city: Case study of Hong Kong. Urban For. Urban Green. 2019, 37, 42–55. [Google Scholar] [CrossRef]
  19. Ascione, F.; De Masi, R.F.; Mastellone, M.; Ruggiero, S.; Vanoli, G.P. Green Walls, a Critical Review: Knowledge Gaps, Design Parameters, Thermal Performances and Multi-Criteria Design Approaches. Energies 2020, 13, 2296. [Google Scholar] [CrossRef]
  20. Riley, B. The state of the art of living walls: Lessons learned. Build. Environ. 2017, 114, 219–232. [Google Scholar] [CrossRef]
  21. Rosasco, P.; Perini, K. Evaluating the economic sustainability of a vertical greening system: A Cost-Benefit Analysis of a pilot project in mediterranean area. Build. Environ. 2018, 142, 524–533. [Google Scholar] [CrossRef]
  22. Oke, A.; Aghimien, D.; Olatunji, S. Implementation of value management as an economic sustainability tool for building construction in Nigeria. Int. J. Manag. Value Supply Chain. 2015, 6, 55–64. [Google Scholar]
  23. Kineber, A.F.; Othman, I.; Oke, A.E.; Chileshe, N.; Zayed, T. Exploring the value management critical success factors for sustainable residential building—A structural equation modelling approach. J. Clean. Prod. 2021, 293, 126115. [Google Scholar] [CrossRef]
  24. Aarseth, W.; Ahola, T.; Aaltonen, K.; Økland, A.; Andersen, B. Project sustainability strategies: A systematic literature review. Int. J. Proj. Manag. 2017, 35, 1071–1083. [Google Scholar] [CrossRef]
  25. Martens, M.L.; Carvalho, M.M. Key factors of sustainability in project management context: A survey exploring the project managers’ perspective. Int. J. Proj. Manag. 2017, 35, 1084–1102. [Google Scholar] [CrossRef]
  26. Abidin, N.Z.; Pasquire, C.L. Revolutionize value management: A mode towards sustainability. Int. J. Proj. Manag. 2007, 25, 275–282. [Google Scholar] [CrossRef]
  27. Fewings, P.; Henjewele, C. Construction Project Management: An Integrated Approach; Routledge: Abingdon, UK, 2019. [Google Scholar]
  28. Hartmann, T.; Van Meerveld, H.; Vossebeld, N.; Adriaanse, A. Aligning building information model tools and construction management methods. Autom. Constr. 2012, 22, 605–613. [Google Scholar] [CrossRef]
  29. Halpin, D.; Woodhead, R. Construction Management; Wiley: New York, NY, USA, 1998. [Google Scholar]
  30. Zhang, J.; Hu, Z. BIM-and 4D-based integrated solution of analysis and management for conflicts and structural safety problems during construction: 1. Principles and methodologies. Autom. Constr. 2011, 20, 155–166. [Google Scholar] [CrossRef]
  31. Sassi, P. Strategies for Sustainable Architecture; Taylor & Francis: Abingdon, UK, 2006. [Google Scholar]
  32. Eastman, C.M.; Eastman, C.; Teicholz, P.; Sacks, R.; Liston, K. BIM Handbook: A Guide to Building Information Modeling for Owners, Managers, Designers, Engineers and Contractors; John Wiley & Sons: Hoboken, NJ, USA, 2011. [Google Scholar]
  33. Azhar, S.; Carlton, W.A.; Olsen, D.; Ahmad, I. Building information modeling for sustainable design and LEED® rating analysis. Autom. Constr. 2011, 20, 217–224. [Google Scholar] [CrossRef]
  34. Wong, K.d.; Fan, Q. Building information modelling (BIM) for sustainable building design. Facilities 2013, 31, 138–157. [Google Scholar] [CrossRef]
  35. Azhar, S.; Brown, J.; Farooqui, R. BIM-Based Sustainability Analysis: An Evaluation of Building Performance Analysis Software, Proceedings of the 45th ASC Annual Conference, 2009; Citeseer: Princeton, NJ, USA, 2009; pp. 276–292. [Google Scholar]
  36. Soltani, S. The contributions of building information modelling to sustainable construction. World J. Eng. Technol. Soc. 2016, 4, 193. [Google Scholar] [CrossRef]
  37. Manso, M.; Teotónio, I.; Silva, C.M.; Cruz, C.O. Green roof and green wall benefits and costs: A review of the quantitative evidence. Renew. Sustain. Energy Rev. 2021, 135, 110111. [Google Scholar] [CrossRef]
  38. Manso, M.; Castro-Gomes, J. Green wall systems: A review of their characteristics. Renew. Sustain. Energy Rev. 2015, 41, 863–871. [Google Scholar] [CrossRef]
  39. Vox, G.; Blanco, I.; Schettini, E. Green façades to control wall surface temperature in buildings. Build. Environ. 2018, 129, 154–166. [Google Scholar] [CrossRef]
  40. Wood, A.; Bahrami, P.; Safarik, D. Green Walls in High-Rise Buildings: An Output of the CTBUH Sustainability Working Group; Images Publishing: Alfreton, UK, 2014. [Google Scholar]
  41. Perini, K.; Ottelé, M.; Haas, E.M.; Raiteri, R. Vertical greening systems, a process tree for green façades and living walls. Urban Ecosyst. 2013, 16, 265–277. [Google Scholar] [CrossRef]
  42. Zakeri, S.M.; Mahdiyar, A. The Hindrances to Green Roof Adoption in a Semi-Arid Climate Condition. Sustainability 2020, 12, 9542. [Google Scholar] [CrossRef]
  43. Perini, K.; Ottelé, M.; Haas, E.M.; Raiteri, R. Greening the building envelope, facade greening and living wall systems. Open J. Ecol. 2011, 1, 1. [Google Scholar] [CrossRef] [Green Version]
  44. Terblanché-Greeff, A.C. Ubuntu and Environmental Ethics: The West Can Learn from Africa When Faced with Climate Change. In African Environmental Ethics: A Critical Reader; Chemhuru, M., Ed.; Springer International Publishing: Cham, Switzerland, 2019; pp. 93–109. [Google Scholar]
  45. Chiquet, C.; Dover, J.W.; Mitchell, P. Birds and the urban environment: The value of green walls. Urban Ecosyst. 2013, 16, 453–462. [Google Scholar] [CrossRef]
  46. Fleck, R.; Gill, R.L.; Pettit, T.; Irga, P.J.; Williams, N.L.R.; Seymour, J.R.; Torpy, F.R. Characterization of fungal and bacterial dynamics in an active green wall used for indoor air pollutant removal. Build. Environ. 2020, 179, 106987. [Google Scholar] [CrossRef]
  47. Daoud, A.O.; Omar, H.; Othman AA, E.; Ebohon, O.J. Integrated Framework Towards Construction Waste Reduction: The Case of Egypt. Int. J. Civil Eng. 2023, 1–15. [Google Scholar] [CrossRef]
  48. Pérez, G.; Rincón, L.; Vila, A.; González, J.M.; Cabeza, L.F. Green vertical systems for buildings as passive systems for energy savings. Appl. Energy 2011, 88, 4854–4859. [Google Scholar] [CrossRef]
  49. Hopkins, G.; Goodwin, C. Living Architecture: Green Roofs and Walls; Csiro Publishing: Clayton, Australia, 2011. [Google Scholar]
  50. Ottelé, M.; Perini, K.; Fraaij, A.L.A.; Haas, E.M.; Raiteri, R. Comparative life cycle analysis for green façades and living wall systems. Energy Build. 2011, 43, 3419–3429. [Google Scholar] [CrossRef]
  51. Bongaerts, P.; Ridgway, T.; Sampayo, E.M.; Hoegh-Guldberg, O. Assessing the ‘deep reef refugia’ hypothesis: Focus on Caribbean reefs. Coral Reefs 2010, 29, 309–327. [Google Scholar] [CrossRef]
  52. Kontoleon, K.J.; Eumorfopoulou, E.A. The effect of the orientation and proportion of a plant-covered wall layer on the thermal performance of a building zone. Build. Environ. 2010, 45, 1287–1303. [Google Scholar] [CrossRef]
  53. Pérez, G.; Coma, J.; Martorell, I.; Cabeza, L.F. Vertical Greenery Systems (VGS) for energy saving in buildings: A review. Renew. Sustain. Energy Rev. 2014, 39, 139–165. [Google Scholar] [CrossRef] [Green Version]
  54. Othman, I.; Kineber, A.; Oke, A.; Zayed, T.; Buniya, M. Barriers of value management implementation for building projects in Egyptian construction industry. Ain Shams Eng. J. 2021, 12, 21–30. [Google Scholar] [CrossRef]
  55. Buniya, M.K.; Othman, I.; Sunindijo, R.Y.; Kineber, A.F.; Mussi, E.; Ahmad, H. Barriers to safety program implementation in the construction industry. Ain Shams Eng. J. 2021, 12, 65–72. [Google Scholar] [CrossRef]
  56. Olanrewaju, O.I.; Kineber, A.F.; Chileshe, N.; Edwards, D.J. Modelling the Impact of Building Information Modelling (BIM) Implementation Drivers and Awareness on Project Lifecycle. Sustainability 2021, 13, 8887. [Google Scholar] [CrossRef]
  57. Saunders, M.; Lewis, P.; Thornhill, A. Research Methods for Business Students, 6th ed.; Pearson: London, UK, 2012. [Google Scholar]
  58. Buniya, M.K.; Othman, I.; Durdyev, S.; Sunindijo, R.Y.; Ismail, S.; Kineber, A.F. Safety Program Elements in the Construction Industry: The Case of Iraq. Int. J. Environ. Res. Public Health 2021, 18, 411. [Google Scholar] [CrossRef]
  59. Oke, A.E.; Kineber, A.F.; Akindele, O.; Ekundayo, D. Determining the Stationary Barriers to the implementation of Radio Frequency Identification (RFID) technology in an emerging construction industry. J. Eng. Des. Technol. 2023, in press.
  60. Williams, B.; Onsman, A.; Brown, T. Exploratory factor analysis: A five-step guide for novices. Australas. J. Paramed. 2010, 8, 42. [Google Scholar] [CrossRef] [Green Version]
  61. Thompson, B. Exploratory and confirmatory factor analysis: Understanding concepts and applications. Appl. Psychol. Meas. 2007, 31, 245–248. [Google Scholar]
  62. Oke, A.E.; Kineber, A.F.; Albukhari, I.; Othman, I.; Kingsley, C. Assessment of Cloud Computing Success Factors for Sustainable Construction Industry: The Case of Nigeria. Buildings 2021, 11, 36. [Google Scholar] [CrossRef]
  63. Costello, A.B.; Osborne, J. Best practices in exploratory factor analysis: Four recommendations for getting the most from your analysis. Pract. Assess. Res. Eval. 2005, 10, 7. [Google Scholar]
  64. Oke, A.E.; Kineber, A.F.; Al-Bukhari, I.; Famakin, I.; Kingsley, C. Exploring the benefits of cloud computing for sustainable construction in Nigeria. J. Eng. Des. Technol. Soc. 2021. ahead-of-print. [Google Scholar] [CrossRef]
  65. Tabachnick, B.G.; Fidell, L.S.; Ullman, J.B. Using Multivariate Statistics; Pearson: Boston, MA, USA, 2007; Volume 5. [Google Scholar]
  66. Robert, O.K.; Dansoh, A.; Ofori–Kuragu, J.K. Reasons for adopting public–private partnership (PPP) for construction projects in Ghana. Int. J. Constr. Manag. 2014, 14, 227–238. [Google Scholar] [CrossRef]
  67. Henseler, J.; Hubona, G.; Ray, P.A. Using PLS path modeling in new technology research: Updated guidelines. Ind. Manag. Data Syst. 2016, 116, 2–20. [Google Scholar] [CrossRef]
  68. Banihashemi, S.; Hosseini, M.R.; Golizadeh, H.; Sankaran, S. Critical success factors (CSFs) for integration of sustainability into construction project management practices in developing countries. Int. J. Proj. Manag. 2017, 35, 1103–1119. [Google Scholar] [CrossRef]
  69. Lee, C.; Hallak, R. Investigating the moderating role of education on a structural model of restaurant performance using multi-group PLS-SEM analysis. J. Bus. Res. 2018, 88, 298–305. [Google Scholar] [CrossRef]
  70. Hult, G.T.M.; Hair Jr, J.F.; Proksch, D.; Sarstedt, M.; Pinkwart, A.; Ringle, C.M. Addressing endogeneity in international marketing applications of partial least squares structural equation modeling. J. Int. Mark. 2018, 26, 1–21. [Google Scholar] [CrossRef]
  71. Kineber, A.F.; Kissi, E.; Hamed, M.M. Identifying and Assessing Sustainability Implementation Barriers for Residential Building Project: A Case of Ghana. Sustainability 2022, 14, 15606. [Google Scholar] [CrossRef]
  72. Hair Jr, J.F.; Matthews, L.M.; Matthews, R.L.; Sarstedt, M. PLS-SEM or CB-SEM: Updated guidelines on which method to use. Int. J. Multivar. Data Anal. 2017, 1, 107–123. [Google Scholar] [CrossRef]
  73. Hair, J.F.; Ringle, C.M.; Sarstedt, M. PLS-SEM: Indeed a silver bullet. J. Mark. Theory Pract. 2011, 19, 139–152. [Google Scholar] [CrossRef]
  74. Podsakoff, P.M.; MacKenzie, S.B.; Lee, J.-Y.; Podsakoff, N.P. Common method biases in behavioral research: A critical review of the literature and recommended remedies. J. Appl. Psychol. 2003, 88, 879. [Google Scholar] [CrossRef] [PubMed]
  75. Williams, L.J.; Cote, J.A.; Buckley, M.R. Lack of method variance in self-reported affect and perceptions at work: Reality or artifact? J. Appl. Psychol. 1989, 74, 462. [Google Scholar] [CrossRef]
  76. Strandholm, K.; Kumar, K.; Subramanian, R. Examining the interrelationships among perceived environmental change, strategic response, managerial characteristics, and organizational performance. J. Bus. Res. 2004, 57, 58–68. [Google Scholar] [CrossRef]
  77. Podsakoff, P.M.; Organ, D.W. Self-reports in organizational research: Problems and prospects. J. Manag. 1986, 12, 531–544. [Google Scholar] [CrossRef]
  78. Al-Ashmori, Y.Y.; Othman, I.; Rahmawati, Y.; Amran, Y.M.; Sabah, S.A.; Rafindadi, A.D.u.; Mikić, M. BIM benefits and its influence on the BIM implementation in Malaysia. Ain Shams Eng. J. 2020, 11, 1013–1019. [Google Scholar] [CrossRef]
  79. Hulland, J. Use of partial least squares (PLS) in strategic management research: A review of four recent studies. Strateg. Manag. J. 1999, 20, 195–204. [Google Scholar] [CrossRef]
  80. Fornell, C.; Larcker, D.F. Evaluating structural equation models with unobservable variables and measurement error. J. Mark. Res. 1981, 18, 39–50. [Google Scholar] [CrossRef]
  81. Nunnally, J.C.; Bernstein, I. The role of university in the development of entrepreneurial vocations: A Spanish study. In Psychometric Theory; McGraw-Hill: New York, NY, USA, 1978. [Google Scholar]
  82. Wong, K.K.-K. Partial least squares structural equation modeling (PLS-SEM) techniques using SmartPLS. Mark. Bull. 2013, 24, 1–32. [Google Scholar]
  83. Hair, J.F.; Anderson, R.E.; Babin, B.J.; Black, W.C. Multivariate Data Analysis: A Global Perspective; Pearson: Upper Saddle River, NJ, USA, 2010; Volume 7. [Google Scholar]
  84. Campbell, D.T.; Fiske, D.W. Convergent and discriminant validation by the multitrait-multimethod matrix. Psychol. Bull. 1959, 56, 81. [Google Scholar] [CrossRef] [PubMed] [Green Version]
  85. Alkilani, S.G.R.Z. Performance Measurement and Improvement Model for Small and Medium Contractors in Developing Countries. Ph.D. Thesis, School of Construction Management and Property, University of New South Wales, Kensington, Australia, 2018. [Google Scholar]
  86. Kineber, A.F.; Othman, I.; Oke, A.E.; Chileshe, N.; Alsolami, B. Critical Value Management Activities in Building Projects: A Case of Egypt. Buildings 2020, 10, 239. [Google Scholar] [CrossRef]
  87. Al-Mekhlafi, A.-B.A.; Isha, A.S.N.; Chileshe, N.; Abdulrab, M.; Kineber, A.F.; Ajmal, M. Impact of Safety Culture Implementation on Driving Performance among Oil and Gas Tanker Drivers: A Partial Least Squares Structural Equation Modelling (PLS-SEM) Approach. Sustainability 2021, 13, 8886. [Google Scholar] [CrossRef]
  88. Kineber, A.F.; Siddharth, S.; Chileshe, N.; Alsolami, B.; Hamed, M.M. Addressing of Value Management Implementation Barriers within the Indian Construction Industry: A PLS-SEM Approach. Sustainability 2022, 14, 16602. [Google Scholar] [CrossRef]
  89. Sharma, S. Applied Multivariate Techniques; John Wiley Sons: Hoboken, NJ, USA, 1996. [Google Scholar]
  90. Tavakol, M.; Dennick, R. Making sense of Cronbach’s alpha. Int. J. Med. Educ. 2011, 2, 53. [Google Scholar] [CrossRef] [PubMed]
  91. Harman, H.H. Modern Factor Analysis; University of Chicago: Chicago, IL, USA, 1967. [Google Scholar]
  92. Hair, J.F., Jr.; Hult, G.T.M.; Ringle, C.; Sarstedt, M. A Primer on Partial Least Squares Structural Equation Modeling (PLS-SEM); Sage publications: Thousand Oaks, CA, USA, 2016. [Google Scholar]
  93. Shah, R.; Goldstein, S.M. Use of structural equation modeling in operations management research: Looking back and forward. J. Oper. Manag. 2006, 24, 148–169. [Google Scholar] [CrossRef]
  94. Shook, C.L.; Ketchen, D.J., Jr.; Hult, G.T.M.; Kacmar, K.M. An assessment of the use of structural equation modeling in strategic management research. Strateg. Manag. J. 2004, 25, 397–404. [Google Scholar] [CrossRef]
  95. Chin, W.W.; Newsted, P.R. Structural equation modeling analysis with small samples using partial least squares. Stat. Strateg. Small Sample Res. 1999, 1, 307–341. [Google Scholar]
  96. Hair, J.F.; Ringle, C.M.; Sarstedt, M. Partial least squares structural equation modeling: Rigorous applications, better results and higher acceptance. Long Range Plan. 2013, 46, 1–12. [Google Scholar] [CrossRef]
  97. Daoud, A.O.; Othman AA, E.; Ebohon, O.J.; Bayyati, A. Overcoming the limitations of the green pyramid rating system in the Egyptian construction industry: A critical analysis. Architec. Eng. Des. Manag. 2022, 18, 114–127. [Google Scholar] [CrossRef]
  98. Kineber, A.F.; Othman, I.; Oke, A.E.; Chileshe, N.; Buniya, M.K. Impact of Value Management on Building Projects Success: Structural Equation Modeling Approach. J. Constr. Eng. Manag. 2021, 147, 04021011. [Google Scholar] [CrossRef]
  99. Kineber, A.F.; Oke, A.E.; Hamed, M.M.; Rached, E.F.; Elmansoury, A.; Alyanbaawi, A. A Partial Least Squares Structural Equation Modeling of Robotics Implementation for Sustainable Building Projects: A Case in Nigeria. Sustainability 2023, 15, 604. [Google Scholar] [CrossRef]
  100. Chin, W.W. Commentary: Issues and Opinion on Structural Equation Modeling; JSTOR: New York, NY, USA, 1998. [Google Scholar]
  101. Adabre, M.A.; Chan, A.P.; Edwards, D.J.; Adinyira, E. Assessing Critical Risk Factors (CRFs) to Sustainable Housing: The Perspective of a sub-Saharan African Country. J. Build. Eng. 2021, 41, 102385. [Google Scholar] [CrossRef]
  102. Suprapto, M.; Bakker, H.L.; Mooi, H.G.; Hertogh, M.J. How do contract types and incentives matter to project performance? Int. J. Proj. Manag. 2016, 34, 1071–1087. [Google Scholar] [CrossRef]
  103. Cohen, J. Statistical Power for the Behavioural Sciences; Lawrence Erlbaum: Hilsdale, NY, USA, 1988. [Google Scholar]
  104. Al-Mekhlafi, A.-B.A.; Isha, A.S.N.; Chileshe, N.; Abdulrab, M.; Saeed, A.A.H.; Kineber, A.F. Modelling the Relationship between the Nature of Work Factors and Driving Performance Mediating by Role of Fatigue. Int. J. Environ. Res. Public Health 2021, 18, 6752. [Google Scholar] [CrossRef] [PubMed]
  105. Tam, V.W.Y.; Hao, J.L.; Zeng, S.X. What affects implementation of green buildings? An empirical study in Hong Kong. Int. J. Strateg. Prop. Manag. 2012, 16, 115–125. [Google Scholar] [CrossRef]
  106. Samari, M.; Godrati, N.; Esmaeilifar, R.; Olfat, P.; Shafiei, M.W.M. The investigation of the barriers in developing green building in Malaysia. Mod. Appl. Sci. 2013, 7, 1. [Google Scholar] [CrossRef] [Green Version]
  107. Bandy, R.; Danckaert, C.; Fetscher, G.; Holmes, B.; Gale, M.; Mirsky, M.; Stewart, S. Leed in upstate New York: An exploration of barriers, resources and strategies. USGBC New York Upstate Chapter Environ. Financ. Cent. EPA Reg. 2007, 2, 2007. [Google Scholar]
  108. ISMAIL, ELHASSAN REDA MOHAMED ABDULLAH. Towards Automated Construction for Safe Disposal of Materials Waste in the Egyptian Construction Industry. Ph.D. Thesis, Faculty of Engineering, The British University in Egypt, El Sherouk City, Egypt, 2022. [Google Scholar]
  109. Hwang, B.-G.; Ng, W.J. Project management knowledge and skills for green construction: Overcoming challenges. Int. J. Proj. Manag. 2013, 31, 272–284. [Google Scholar] [CrossRef]
  110. Alrashed, F.; Asif, M. Prospects of renewable energy to promote zero-energy residential buildings in the KSA. Energy Procedia 2012, 18, 1096–1105. [Google Scholar] [CrossRef] [Green Version]
  111. Iwaro, J.; Mwasha, A. A review of building energy regulation and policy for energy conservation in developing countries. Energy Policy 2010, 38, 7744–7755. [Google Scholar] [CrossRef]
  112. Duda, J. Incentives and Barriers Impacting the Implementation of Green Building Exteriors. Bachelor’s Thesis, University of New South Wales, Kensington, Australia, 2009. Unpublished. [Google Scholar]
  113. Hasan, M.S.; Zhang, R.-J. Critical barriers and challenges in implementation of green construction in China. Int. J. Curr. Eng. Technol. 2016, 6, 435–445. [Google Scholar]
  114. Turner Construction Company. Green building market barometer. Retrieved Sept. 2008, 15, 2009. [Google Scholar]
  115. McGraw-Hill, C.; Council, U.S.G.B. Green Building Smartmarket Report; McGraw Hill Construction in conjunction with US Green Building Council: Irvine, CA, USA, 2006. [Google Scholar]
  116. Qian, Q.K.; Chan, E.H.W.; Khalid, A.G. Challenges in delivering green building projects: Unearthing the transaction costs (TCs). Sustainability 2015, 7, 3615–3636. [Google Scholar] [CrossRef] [Green Version]
  117. Ahn, Y.H.; Pearce, A.R.; Wang, Y.; Wang, G. Drivers and barriers of sustainable design and construction: The perception of green building experience. Int. J. Sustain. Build. Technol. Urban Dev. 2013, 4, 35–45. [Google Scholar] [CrossRef]
  118. Mosly, I. Barriers to the diffusion and adoption of green buildings in Saudi Arabia. J. Mgmt. Sustain. 2015, 5, 104. [Google Scholar] [CrossRef]
  119. Latief, Y.; Berawi, M.A.; Basten, V.; Budiman, R.; Riswanto. Premium Cost Optimization of Operational and Maintenance of Green Building in Indonesia Using Life Cycle Assessment Method; AIP Publishing LLC: Melville, NY, USA, 2017; p. 020007. [Google Scholar]
  120. Sabini, L.; Alderman, N. The paradoxical profession: Project management and the contradictory nature of sustainable project objectives. Proj. Manag. J. 2021, 52, 379–393. [Google Scholar] [CrossRef]
  121. Zhang, X.; Platten, A.; Shen, L. Green property development practice in China: Costs and barriers. Build. Environ. 2011, 46, 2153–2160. [Google Scholar] [CrossRef]
  122. Zhang, X.; Shen, L.; Wu, Y. Green strategy for gaining competitive advantage in housing development: A China study. J. Clean. Prod. 2011, 19, 157–167. [Google Scholar] [CrossRef]
Figure 1. A theorized influence of green walls implementation barriers on the OSS.
Mathematics 11 00504 g001
Figure 2. Research design.
Mathematics 11 00504 g002
Figure 3. Screen plot.
Mathematics 11 00504 g003
Figure 4. The PLS initial model.
Mathematics 11 00504 g004
Figure 5. Path analysis.
Mathematics 11 00504 g005
Table 1. Major deterrents to the adoption of GWs.
CodeBarriersStudies
B1Adaptability to climate[49]
B2Great ecological liability of some materials[50]
B3High cost of maintenance[20]
B4High cost of installation[43]
B5Hi-tech application[48]
B6High nutrients and water consumption[44]
B7Hesitation to accept a novel technology[47]
B8The dearth of standards and policy[47]
B9The dearth of printed costs specified in the recommendations[44]
B10Inadequate lightening for the flowers[51]
B11Potential harm to the back fence[38]
B12Scarcity of methodological tools[19]
B13The requirement for skilled engineers[19]
B14Fire inducement[38]
B15Susceptibility of insects and fungi[46]
B16Little or lack of incentives from regulators or the government[12]
B17Maintenance difficulty[52,53]
Table 2. Factor loadings of green walls implementation barriers.
BarriersComponent
EnvironmentPolicy and StandardsTechnicalGuidelines
B1 0.881
B2 0.600
B3 0.751
B4 0.764
B5 0.825
B6 0.749
B7 0.588
B8 0.797
B9 0.611
B10 0.852
B11 0.753
B12 0.759
B13 0.694
B14 0.819
B15 0.809
B16 0.744
B17 0.902
Table 3. The result of convergent validity.
ConstructsCronbach’s AlphaComposite ReliabilityAverage Variance Extracted (AVE)
Environment0.7650.8630.678
Green walls implementation barriers0.9470.9540.552
Guidelines0.7890.9040.826
OSS0.8240.8930.735
Policy and standards0.8670.9380.883
Technical0.9530.9590.703
Table 4. Discriminant validity analysis (Fornell-Larcker).
ConstructsEnvironmentGuidelinesOSSPolicy and StandardsTechnical
Environment0.823
Guidelines0.5020.909
OSS0.1480.2980.857
Policy and standards0.5760.6190.1250.94
Technical0.6340.6040.350.5130.838
Note: Values in bold indicate the AVE’s Square root.
Table 5. Discriminant validity (HTMT).
ConstructsEnvironmentGuidelinesOSSPolicy and
Standards
Technical
Environment
Guidelines0.633
OSS0.1920.375
Policy and standards0.6650.7390.161
Technical0.7240.6940.3780.564
Table 6. Cross loadings results.
BarriersGuidelinesEnvironmentPolicy and StandardsTechnicalOSS
B90.9190.5560.6680.5550.336
B50.8980.3450.4460.5430.198
B10.3740.7930.2060.3950.08
B20.5710.8360.610.5430.169
B70.2870.840.5350.5980.106
B170.5430.4250.9350.4840.134
B80.6180.6490.9440.4810.102
B100.550.4350.3810.8720.229
B110.570.5630.3320.8360.195
B120.4910.680.4570.8580.281
B130.6030.5310.4390.8190.392
B140.4350.5370.3240.8540.364
B150.580.5730.5530.9090.356
B160.40.4040.5730.7820.294
B30.3830.4550.3150.7620.183
B40.5680.5980.4930.8820.343
B60.4580.5150.420.7990.284
Economic0.352−0.0210.1250.2460.813
Environment0.2560.2020.040.3790.86
Social0.1620.1650.1840.2440.897
Table 7. Determinative constructs analysis. p value < 0.001.
PathOuter Weight (β)SEVIF
Environment→ Green walls implementation barriers0.32070.03431.95
Guidelines→ Green walls implementation barriers0.24460.04621.981
Policy and standards→ Green walls implementation barriers0.45940.04671.916
Technical→ Green walls implementation barriers0.26280.03262.049
Disclaimer/Publisher’s Note: The statements, opinions and data contained in all publications are solely those of the individual author(s) and contributor(s) and not of MDPI and/or the editor(s). MDPI and/or the editor(s) disclaim responsibility for any injury to people or property resulting from any ideas, methods, instructions or products referred to in the content.

