Abstract
The purpose of this paper is to identify the emergence of indirect trade flows prompted by the export interaction of the world’s economies. Using data on exports from the United Nations Conference on Trade and Development (UNCTAD) for the period 2016–2021, we construct an international trade network which is analyzed through the “forgotten effects theory” that identifies tuples of countries with an origin, intermediary countries, and a destination. This approach intends to spotlight something beyond the analysis of the direct trade network by the identification of second and third-order paths. The analysis using both network analyses, as well as the forgotten effect approaches, which show that the international trade network presents a hub-and-spoke behavior in contrast to most extant research finding a core-periphery structure. The structure is then comprised of three almost separated trade networks and a hub country that bridges commerce between those networks. The contribution of this article is to move the analysis forward from other works that utilize trade networks, including those of econometric nature—such as the ones based on gravity models—by incorporating indirect relationships between countries, which could provide distinctive and novel insights into the study of economic networks.
MSC:
05C21; 91B60; 05C12; 05C40; 05C38
1. Introduction
The international trade network can be pictured as a complex economic system where economies—the nodes—are related to each other among their trade flows—the edges. Approaching international trade through network analysis has been gaining increasing attention in the literature, and most of the influential work on the matter has been related to the complexity of the economies, regarded as how complex and diversified a country’s trade matrix is. The analysis of economic networks allows for superior insights on national internal production dynamics than those provided by GDP measures, as it better depicts connectivity and economic integration [1,2,3,4,5,6].
An established property of networks has been the “core-periphery” structure. In the context of international trade, such a structure implies the existence of a group of countries located in the center of the networks, which concentrate the most extensive flows of exports. At the same time, other economies remain at the periphery only with modest connections [2,4,7]. In accordance with the core-periphery structure, as argued for instance by the “dependency theory”, economies located at the periphery present low technological sophistication based on resource exploitation, so countries end up exporting to the more specialized core countries that manufacture products with higher added value [8].
In a global economy with several free trade agreements (FTA), there is a behavior known as “hub-and-spoke” that refers to FTA regions that act as hubs connecting the participating countries, i.e., the spokes [9]. Note here that it is states who sign FTAs. Accordingly, in this article, we discuss states as actors of trade hubs and spokes and as the origins and destinations of trade flows. However, it should be borne in mind that when signing an FTA, a state mainly seeks to generate incentives for private parties located in that state to trade with others located in other states that signed the FTA. Thus, private parties choose their trading partners and generate trade flows that contribute to creating hubs and spokes.
Behind the analysis of complex systems in international trade is the study of systemic effects within the trade network. However, the methodological analysis usually relies on standard centrality measures, clustering techniques, and the study of other general graph properties [10]. In this research, we argue that there has been an understudied phenomenon usually seen in complex networks: identifying higher-order or indirect incidences between countries. Our conceptualization of a higher-order effect, and in particular, a second-order effect, refers to the indirect relationship that a given country A—the origin—affects C the destination through a third country B, the intermediary (see Section 2.2 for a further explanation). This conceptualization is somewhat similar to that of [11], but the edges and the interpretation of the flows are different for our case, as we are exploring the incidences of exports. Hence, the purpose of this research is to characterize the international trade network of export flows by identifying higher-order effects. We hypothesize that, due to the complexity and density of the international trade network, there are indirect effects that need to be properly identified and which could contribute to new insights regarding its structure.
In the context of international markets, the economics literature has approached the indirect effect concept as the “third-country” or “spillover” effect, mainly referring to indirect incidences of foreign direct investments (FDI) [12,13,14], FTAs, and exchange rates. Regarding the latter, the third country effect has been used to test whether trade flows for a given country with a commercial partner can be affected by the volatility in the exchange rate of another partner. Then, a spillover effect emerges from the exchange rate of an economy that affects the third party indirectly [15,16]. On the FTA applications, it has been shown that given a triplet of countries, if two of them already have an existing FTA, the incentives of joining into an FTA with the third one differ [17]. Additionally, the FTA context has been applied to analyze whether signing them harms non-members indirectly [18]. A work closely related to ours is that of [11], which deals with the indirect effects of FDI by accounting that such investments can indirectly reduce FDI costs through tax burden reductions, coordination costs, and market entry barriers. In addition to these streams of the literature, the concept of “extended gravity” has been proposed, explaining that the trade policies of a given country will affect not only its market, but also those connected through it [19]. In this sense, we can point to the work in [20], which uses the betweenness centrality in an econometric context to measure the gate-keeping power that a hub has in an indirect trade relation.
Another methodological approach little discussed in the literature is that of multiple layers of trade networks. In [21], the concepts of multiplex and multi-layer are used to analyze the entropy of trade networks, in which each layer represents a different industry. Since trade flows change over time, the multiplex approach seems appropriate to incorporate into our methodological framework.
Identifying higher-order incidences appears appropriate, given the increasing openness of the markets and the higher integration of economies. [22] suggested that an incidence—the effect of an entity among others—propagates in a chained series of effects through the interaction of agents, where some of these incidences end up being forgotten and leading to unexpected secondary effects, which they referred to as “forgotten effects”. Then, the forgotten effects theory allows the recovery of indirect effects—also known as higher-order effects—that emerge in social networks. Furthermore, except for the work in [23], the concept of a multiple-layered analysis based on the forgotten effects theory has been underexplored. Our framework extends Kauffmann and Gil-Aluja’s [22] concept of experton, a mathematical way for aggregating information from different sources. Nevertheless, their use in forgotten effects theory requires the application of an expected value operator. Hence, variance is lost. Instead, our approach computes both the expected value and the variance (or standard deviation) of the forgotten effects through bootstrap.
The forgotten effects theory has been used in other social contexts mainly to study the cause and effects of different economic phenomena, such as entrepreneurship [24,25], tourism [26,27], innovation [28], and other specific industry studies [29,30]. The application of this theory to the international trade network allows for identifying the maximum value of exports that an exporter country could have with a third party through an intermediary. Hence, it can explain to some extent whether and how an economy is indirectly tied to another in commercial terms. Thus, the contribution of our research is the incorporation of an issue that was at the core of the seminal work by Kauffman and Gil-Aluja: complex networks need to include higher levels of reasoning that are usually forgotten, especially when they are subject to the realm of decision making and policy development [22] (p. 8). Due to the increased attention over the last decade on applying social network analysis to economic relationships, our research offers a novel approach to extending the literature on the issue, which can serve to find empirical regularities and offer guidelines for theoretical propositions of the trade interdependence evolution and policy implications [2].
A work that has used forgotten effects theory closely related to ours is [23]. There, the authors assessed the effects of the Belt and Road Initiative for a sample of 20 economies during 2011–2015. They identified some indirect flows that supported a core-periphery structure behavior and also found evidence to support, in some instances, the effectiveness of the economic initiative. In their work, some economies were aggregated to somewhat balance the trade network. Furthermore, they build an empirical distribution for each edge using the multiplex data and Monte Carlo simulations to assess the volatility of the indirect relationships through bootstrapping replicates. Their results only show second-order effects. Our work differs from theirs as our objective is to characterize the international trade network using country-level exports rather than regional or aggregated exports. We find not only second-order effects, but also third-order effects. Moreover, in methodological terms, we use each layer in the multiplex to calculate second and third-order effects. Hence, the number of layers in the multiplex limits the frequency of indirect relations.
To identify higher-order effects, we first construct networks of direct export flows and then calculate their respective centrality measures for 2016–2021. Afterward, we calculate the indirect effects that emerge from those direct incidences. The computation of the results captures the higher order incidence(s)—namely, second and third-order effects—with the respective origin, intermediaries, and destinations. The concept of a third-order effect considers an origin and a destination, but two intermediaries. Furthermore, the conceptualization of multiple data layers allows us to offer additional information, such as the frequency of such effect in the period, its mean, confidence intervals, and standard errors.
The analysis of the direct effects shows the presence of three principal hubs of trade: a North American one (led by the United States), an Asia-Pacific one (led by China), and a European one (led by Germany). We do not find evidence supporting the known structure of core-periphery as in previous studies. Instead, we found a hub-and-spoke behavior with a recognized country on each hub that mainly connects with the other hubs. Then, the analysis of the higher incidences shows the appearance of both second and third-order effects that better characterize the behavior of intensive trade between the hubs through their leading countries and the indirect connections of the spokes with other hubs and spokes.
It is important to note that our approach is rooted in network analysis and not in econometric estimations —as the gravity model, which explains exports by the economic size of the countries, their populations, geographical distances, and other institutional-related features [31,32]. However, the direct trade relations analysis is not necessarily exclusive to gravity models and other econometric estimations that explain worldwide commerce by geographical patterns, e.g., [33]. Though [34] found that gravity models are suitable for estimating trade flows, they also concluded that they lack a proper explanation of why flows in the international trade network are formed and persist through time. Furthermore, [31] explained that gravity models were a proper tool suited for analyzing potential counterfactuals and predictions of trade among the countries, which is not necessarily the point of our investigation. Thus, an essential difference between our work and that based on the gravity model is that the latter has not been applied to identify indirect trade relations, which becomes a pivotal contribution to our finding that the trade network has a hub-and-spoke behavior.
The rest of the paper is structured as follows: in Section 2, we explain the source of data, as well as the forgotten effects methodology and some computational particularities for the analysis. Then, in Section 3, we show the main findings from our approach, which are subsequently discussed in Section 4. Some general considerations and future research guidelines end the article in Section 5.
2. Materials and Methods
2.1. Data
Data on exports were obtained from the United Nations Conference on Trade and Development (UNCTAD) statistics website. Initially, we considered a total of 218 countries in the 2016–2021 period from the UNCTAD database, where a detailed list can be found in Appendix A.1. For the subsequent figures and tables, countries were coded under the standard ISO 3166-1.
2.2. Methodology
Preliminaries
As standard in the complex network literature [35], we model the export flows network as a graph where each country represents a node, and the exports value that goes from an origin country to a destination country corresponds to a normalized weighted directed edge. The normalization of flows is not uncommon in this type of study, given that there is too much disparity in some trade flows due to the magnitude of the commerce for larger economies when compared to some smaller ones [36].
Let be the export (flow) volume from country i to the country j during the year t. We normalize the edge weights by the maximum trade volume during that year as follows:
so , and it represents the normalized export from country i to j on year t. As the analysis is intended to be made for data throughout a period of T years, then the analysis requires a broader definition, as follows:
where denote a multiplex of nodes represented by its T slices, and each slice is a square reflexive matrix defined as
so corresponds to the matrix of annual exports containing from every country i to every destination j, for a total of n countries. The effect of an economy on itself is represented in the diagonal of , and it is set to 1. Hence, this “direct-effect” matrix conforms a network of direct incidences as in Figure 1.
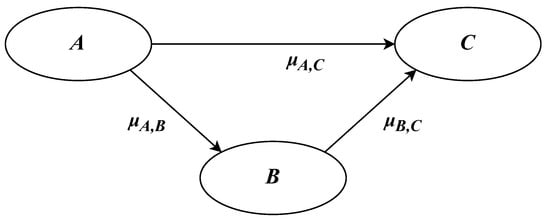
Figure 1.
Direct effects.
As mentioned above, the analysis was carried out from 2016 to 2021, so the entire analysis can be regarded as a multiplex (see Figure 2).
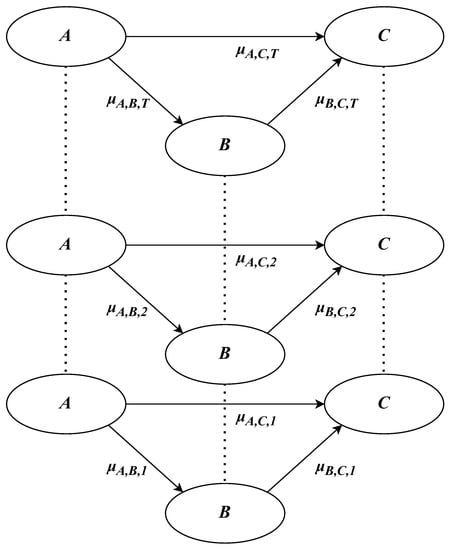
Figure 2.
Structure of relationships with multiple layers.
The conceptualization of an indirect—forgotten—incidence can be depicted by exploring Figure 1. Intuitively, this is represented whenever:
where is a minimum threshold, and then the indirect effect originating from A to C through B is stronger than the direct effect from A to C. Hence, this difference is the maximum normalized indirect trade volume between A and C given the trade capacities flows between A and B, between B and C, and the direct trade flow between A and C. The same logic follows for Figure 2, where the analysis explores the appearance of the indirect effect throughout the years. By accounting for several years, we can identify the frequency of appearance of incidences in the period under study, explaining to some extent whether the effect is stable or not.
2.3. Edge Analysis
Given the incidences for a given set of edges between nodes i and j, we first establish a unilateral left contrast as follows:
where is the average incidence computed with , and is the minimum incidence value at which an edge is considered insignificant. For such statistical contrast, a t-test is applied through bootstrap [37] with bias-corrected and accelerated (BCa) confidence intervals [38]. Thus, any edge for which the null hypothesis is rejected will be considered insignificant, and in consequence, the edge is set to zero.
2.4. Cause and Effect Analysis
In interconnected system analysis, it is also possible to keep reducing systemic complexity by identifying variables within the system’s structure that are relatively disconnected. This group was defined in [39] (p. 99) as “excluded variables,” in our case, countries whose total trade value is below some fixed threshold. This process does not mean that if we do not exclude that node from the analysis, it generates no effects, but rather that these would appear very infrequently.
From country i to all other countries in the slice t, the average normalized export flow is computed as:
Conversely, the average import flow to node j from all other countries in slice t is computed as:
Remember that, due to (4), we should not include in our calculations all edges that were previously considered significantly smaller than the thresholds.
Then, we compute two additional bilateral contrasts. The first one tests the significance of the average export flow from node i:
where is the threshold at which the average export flow from node i is considered insignificant. The second one tests the significance of the average import flow to node j:
where is the threshold at which the average import flow to node j is considered insignificant. For the contrast computation, as in (4), the t-test with BCa confidence interval bootstrapping is used. Those countries whose average exports flow and average imports flow are significantly smaller than the thresholds are, hence, removed from the network.
2.5. Forgotten Effects
For each that composes the multiplex after removing edges (flows) and nodes (countries) according to Section 2.3 and Section 2.4, we apply the forgotten effect method proposed by [22], which computes a second-order effects matrix as:
where is a “convoluted” matrix that contains both first (direct) and second-order (indirect) effects. Hence, to recover the second-order effects, we subtract the original matrix from . The convoluted matrix is calculated as:
where ∘ is “max-min convolution” operator. The elements of the convoluted matrix are defined as:
With this operator, for a combination of row i and column k in , we first obtain all the minimum between the values in the j-th position of row i and column k. Their maximum will then be the value assigned to .
It is possible to further extend this operator to compute the -th indirect effects by the following:
where:
Then, -order effects are those for which: where is a given minimum threshold to consider the indirect effect as greater than the direct one. In our work, the -order effect represents the maximum normalized indirect trade volume from i to k, not the actual normalized indirect trade volume. Notice that if a -order effect appears, the effects of a higher order with the same origin and destination countries will not appear. Hence, this process has a “diminishing returns” effect, in which the number of effects appearing in the -order is smaller than those in the -order. For all -order effects identified in the slices of the multiplex, we calculated BCa confidence intervals through bootstrap.
2.6. Paths
As previously stated, an indirect effect shows the maximum normalized export flow from an origin country to a destination economy through one or many intermediary countries. The forgotten effect theory is also able to identify the intermediary countries as well. We refer to this sequence as a path. Trade in the path implies feeding a country’s economy through imports, which allows this country to export other goods to the next country in the path.
Finding the path of the -order effect from i to k needs checking the previous -order effects to see if either: (i) a path between i and j exists and a significant direct edge between j and k exists; or (ii) a path between j and k exists and a significant direct edge between i and j exists.
3. Results
3.1. Software and Parameters
For the computation described in the methodology, we used “foRgotten” [40], a package for GNU R (version 4.2.2) [41]. The parameters were set up so that at least one country from most continents appeared in our analysis. Regarding the election of the values, as a robustness check, we applied different thresholds both for edge () and cause and effect analysis (). With smaller thresholds, more relations are not disregarded. Consequently, more countries appear in the paths, although only the USA, China, and Germany act as intermediate countries in second- and third-order paths. This important result will be explained in the following sections. With more stringent thresholds, fewer countries appear in the analysis, completely removing South American and African countries. Central American and Caribbean countries do not appear in the results for any combination of the thresholds. Again, the same hubs appear. Hence, the election of the thresholds allows for the appearance of at least one country of each continent, with the exception of Central American and Caribbean countries. Hence, the threshold () to consider an edge as significantly small—according to (4)—was fixed at 5% of the exports from China to the USA (the largest weight for all edges in any given year). The thresholds to identify countries whose trade is non-significant ( and ) were fixed at the same value, %, i.e., countries that have average normalized imports and exports significantly smaller than this value—according to (7) and (8)—were removed from the analysis. For indirect effects, the threshold for the maximum normalized trade export flow from the origin to the destination countries () was set at . We used 1000 replicates for all bootstrap tests. Network plotting used the GNU R implementation of “igraph” (version 1.3.5) [42].
3.2. Direct Effects
To first characterize the international trade network of exports, a centrality measure is required. In our case, we use the PageRank [43] algorithm, which captures the importance of a node within a network concerning the number of connections and their importance and has also been used in similar research [3,23,44,45]. We also provide the betweenness centrality as a complementary measure of centrality. For a given node, this indicator, which is relevant to studies on trade networks, is also used [2,45], showing the amount of shortest paths including it.
We plotted the network of export flows for the first and last year of the studied period, i.e., 2016 in Figure 3 and 2021 in Figure 4. The color depicts the continent to which the node belongs, which can be North America (NA), Asia (AS), Europe (EU), Oceania (OC), South America (SA), and Africa (AF). As seen from these figures, the network structure seems stable throughout the years, so the remaining figures are left in Appendix A.3.
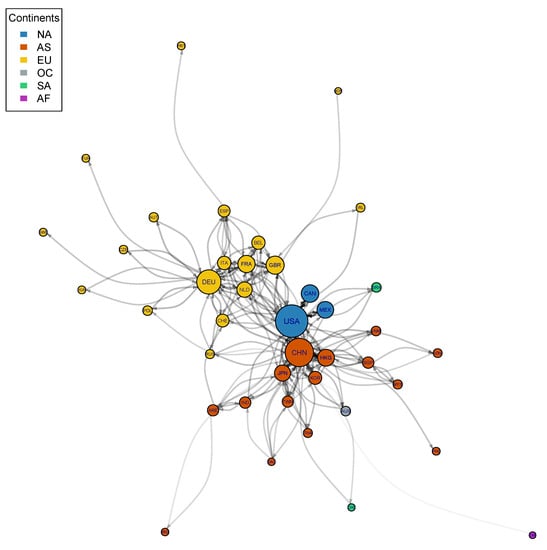
Figure 3.
Network of Exports—2016.
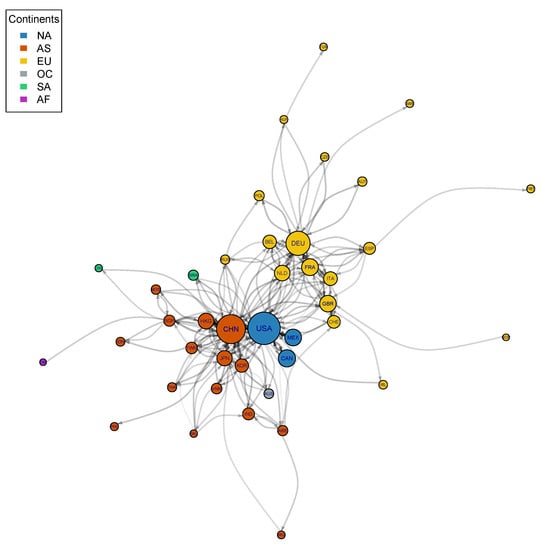
Figure 4.
Network of Exports—2021.
After applying the contrasts in (4), (7), and (8), most countries that remain in our network belong to either Asia or Europe. For the African continent, only South Africa (ZAF) appears throughout the six years studied. This issue is empirically related to the gradual decrease in the centrality of African economies since the 1960s (see Figure 3 in [46] (p. 1433)). South America and Oceania share this trait with Africa, so Brazil (BRA), Chile (CHL), and Australia (AUS) are the only economies remaining from those continents. Given the integration in the North American continent, the three countries that belong to it remain in our network. No Central American countries amount to significant trade for subsequent analysis.
The countries with higher PageRank centralities, identified as the hubs throughout this work, are the USA, China, and Germany (see Appendix A.2). The remaining countries are regarded as spokes. Despite that, no structural change can be appreciated visually in the trade network (see Figure 3 and Figure 4). Though there are changes in the betweenness centrality, the PageRank centrality measure appears less sensitive to changes in the edges with lower values and better depicts the observed stability.
In Table 1, we show the normalized trade value proportion between hubs, spokes, and hubs and spokes. The proportion of normalized commerce is greater between hubs and spokes, followed by commerce between hubs and, finally, between spokes. Although the network is stable, trade between hubs dropped about one percentage point in 2019 (compared to 2018). There is also a drop of about half a percentage point in the same year in trade between spoke. The cumulated drop increases the trade between hubs and spokes by 1.5 percentage points. The drop in trade between hubs rebounded in 2020 by about 1.5 percentage points, while the trade between spokes dropped by 1.2 percentage points, and the trade between hubs and spokes dropped by 0.4 percentage points. Hence, trade between spokes has not recovered to pre-pandemic levels, while trade between hubs is above those before the pandemic. Trade between hubs and spokes rose but fell again, although it is still above pre-pandemic levels.

Table 1.
Normalized trade value proportion between hubs, between spokes, and between hubs and spokes.
3.3. Indirect Effects
Second-order effects throughout 2016–2021 are presented in Table 2. As explained above, the forgotten effects methodology allows the identification of the origin (column “From”), intermediary (“Through”), and destination (“To”) countries of the trade path. Then, the remaining columns show how many times in the 2016–2021 period, an indirect effect appears (“Freq.”), the mean of the greatest possible normalized indirect trade volume throughout the six years (“Effect”), lower (“LCI”) and upper (“UCI”) confidence intervals, and standard error (“SE”). We ordered this table by the “Effect” column. Hence, the greatest possible indirect trade relation is that between Mexico (MEX) and Canada (CAN) through the USA, while the smallest is that between Germany and Japan (JPN) through China (CHN).
Table 2.
Second Order Effects.
The methodology identified 33 possible significant second-order incidences, with the intermediaries being mostly China (20 times) and the USA (10 times), with Germany appearing in only three significant indirect trade relations. Notably, 19 of these second-order incidences appeared throughout the entire period studied, so they are generating recurring and stable incidences in the trade networks over the last years.
We present third-order effects in Table 3 using the same columns as in the previous table, but with an additional intermediary. They all have spokes as origins and destinations and hubs as intermediate countries. The third-order incidences with the two greater values depict a trade relationship from Eastern economies to Western countries, an incidence that appears throughout the entire period. This result reinforced evidence of the hub-and-spoke behavior presented in the introduction, as both effects occur through China and the USA, the two largest exporting economies.
Table 3.
Third-Order Effects.
The methodology identifies nine third-order incidences. As noted before, its diminishing returns behavior makes it increasingly infrequent to find higher-order relations. Thus, we find fewer third-order effects than second-order effects and no fourth-order or higher trade relations.
4. Discussion
The three principal economies are the leaders of their respective hubs, with the USA heading the North American one, China the Asian one, and Germany the European one. These three nodes have the higher centrality (see Table A1 and Table A2), which is a similar result to other studies those in [4,45]. Then, most trade flows through these leaders, so mainly, the hub’s accompanying countries (the spokes) appear to be mostly indirectly trading with each other. For example, the countries in the United States–Mexico–Canada Agreement (USMCA)—previously the North American Free Trade Agreement (NAFTA)—appear to be highly dominant in the American continent. Nevertheless, there is no significant trade between Canada and Mexico, so trade toward Asia or Europe moves along through the USA and not directly.
The North American economies undoubtedly assemble the most prominent economic region. Additionally, the trade relations of the larger Asian countries are highly interconnected. However, the regional trade somewhat mirrors the results of the BRI found in [23], i.e., China is the trade hub for this region. The Western European trade network is also highly interconnected, although Germany is a clear regional hub. The remaining European countries trade primarily to and from Germany. These results point to the assertion in [47] (pp. 15–16): China works as the factory of the world, and Germany is Europe’s network hub.
At the macro level, [48] argued that the COVID-19 pandemic structurally changed the trade network. Nevertheless, our findings are more akin to those in [49] for 2017, showing that even with the pandemic, the export network structure appears stable up to 2021. A likely explanation is that even if absolute worldwide trade volumes contracted from 2019 (around US$19 trillion) to 2020 (around US$17.6 trillion), the effect seemed proportional for every country. The subsequent rebound in 2021 (around US$22.3 trillion) has the same behavior. The changes observed in Table 1 did not affect the trade network for the greatest trade flows in the studied period.
The forgotten effects theory allowed the recovery of both second and third-order relations of the international trade network, i.e., the indirect links of countries (as shown in Table 2 and Table 3). These indirect trade flows are the main findings of this article. These results become engaging in the context of the analysis of complex social networks, particularly for economic systems, as the nodes that comprise them are usually highly interconnected. Through our approach, the removal of non-significant edges in the temporal aggregation of trade networks seems to unveil a hub-and-spoke structure. In contrast, other studies using denser networks find a core-periphery structure [8,50,51]. Our results might indicate that, at the macro aggregated level, three core-periphery regional networks—such as the one found by [52]—jointly form a hub-and-spoke network.
The greatest and most prevalent second-order incidences are those related to the USMCA and Asian economies, so the USA and China serve as bridges for indirect trade flows. China mainly trades with Canada (CAN) and Mexico (MEX) through the USA, an effect that appeared throughout the six years of study. The same phenomenon appears in the indirect trade between Hong Kong and the USA, where China acts as the intermediate node. Interestingly, Germany also generates second-order effects through the United States, reaching its two main commercial partners, Canada and Mexico. It also generates a stable second-order incidence in Asian countries, mediated by China to Hong Kong and Korea. The long-lasting effect of the Netherlands (NLD) through Germany towards the United States and China also depicts a hub-and-spoke behavior where one of the spokes directly trades with the hub’s leading economy, generating commercial connections with other continents. Although direct trade appears to be not too significant for Australia besides its connection with Asian countries, it does generate an indirect connection with the USA, as well as indirect relations with Hong Kong (HKG), Korea (KOR), and Vietnam (VNM) through China.
We can interpret the third-order effects presented in Table 3 as pointing to an even more evident hub-and-spoke behavior. For example, the two most significant and stable incidences show that Hong Kong follows the trade route that links China with the USA, then Canada and Mexico. Conversely, Canada and Mexico reach Vietnam through the same hubs but in reverse order. Similarly, the Netherlands indirectly reaches Canada and Mexico through Germany and the USA.
In general terms, results relate to the discussion of globalization and regionalization in [53], who found a relationship where the global dynamics are highly related to the regional ones, pointing to the extant debate on them being contradictory phenomena. In our case, by identifying a hub-and-spoke behavior that is supported by the emergence of the indirect effects we previously identified, we show that despite globalization leading to an alleged higher economic integration of every market, it still appears that regional dynamics are highly prevalent when explaining the worldwide trade network. Identifying these dynamics underlying the structure of the network allows understanding related economic phenomenon as globalization, economic integration and growth, better explaining different macroeconomic dynamics [2,54]. Part of the hub-and-spoke structure cannot be adequately explained if we think that international trade consists mainly of finished goods for final consumption. A more appropriate way of explaining it would be to understand that trade flows are part of regional value chains. In our results, value chains do not seem to be global, or at least not for the most part. For example, the commercial relationship between the USA, Canada, and Mexico obeys this logic, with the USA acting as a regional trade hub and as a port for relations with other regions.
5. Conclusions
As economies around the globe are highly interconnected, the study of international trade networks has been gaining increasing attention over the last decades. This systemic approach to international trade has under-emphasized indirect effects between the economies, primarily relying on first-order incidences. The forgotten effects approach contributes to this issue, as it can characterize the international export network and identify the indirect trade flows that might emerge from direct commercial relationships. This method allows for the recovery of indirect incidences originating from direct relationships so that we can identify the origin, intermediary(ies), and destination of such an effect. We found higher-order incidences in the trade relationship among countries for 2016–2021, providing evidence to support the hub-and-spoke behavior of the international trade network. The research also contributes to understanding whether the economies that form international trade networks can have indirect relationships, identifying the paths that link up those economies.
The principal limitation of our work is that, although data are disaggregated into the different economic sectors of both the exporter and importer countries, we do not have data on the actual trade flows among exporting and importing sectors. Once exports enter a country, obtaining detailed information about the destiny of those particular exports is lost. Furthermore, some imports could be end-products consumed by households or services. Computationally, such a dataset would prove more complex, requiring more processing resources, probably with GPU computation through CUDA. We leave this idea as potential research for future endeavors.
Overall, our methodological approach allows us to extend the systemic view of international trade present in the literature by putting the forgotten effects theory at the front of the discussion. In this sense, recovering higher order incidences for trade networks should be incorporated into future analysis on trade, considering the increasing relevance that the network analysis methods have acquired over the last years. Then, higher-order incidences could provide deeper insights into the usual economic network analysis by moving towards unveiling how commerce between indirectly related countries is.
For additional further research, we are left with the interesting question about the usefulness of free trade agreements between spokes. With a few exceptions, the trade volume between them is limited. The trade volume between spokes and their regional hub is considerably higher and might generate a higher volume of indirect relationships, such as those observed in this paper. Taking trade volumes as they currently are, free trade agreements among spokes and their hub then seem to make more sense than free trade agreements among spokes. Nevertheless, the Comprehensive and Progressive Agreement for Trans-Pacific Partnership (CPTPP) is surprising, since it was initially promoted by the USA, but it has finally been signed between spokes of different hubs. Thus, an open question is whether free trade agreements among spokes may increase direct trade flows among spokes, hence reducing indirect flows via the hub. While our data do not support that conclusion, it is an open question for future research.
Author Contributions
Conceptualization, F.C.-B., E.M.-A., J.R.-M. and J.T.-I.; data curation, E.M.-A. and J.R.-M.; investigation, F.C.-B., E.M.-A. and J.R.-M.; methodology, F.C.-B., E.M.-A. and J.R.-M.; software, E.M.-A. and J.R.-M.; validation, F.C.-B., E.M.-A., J.R.-M. and J.T.-I.; visualization E.M.-A.; writing F.C.-B., E.M.-A., J.R.-M. and J.T.-I. All authors have read and agreed to the published version of the manuscript.
Funding
This research received no external funding.
Institutional Review Board Statement
Not applicable.
Informed Consent Statement
Not applicable.
Data Availability Statement
Data used in this research are available at the UNCTADstat website https://unctadstat.unctad.org/EN/ (accessed on 22 August 2022). Processed data and results data are provided at https://github.com/ElliottMardones/International-trade-network-data (accessed on 22 August 2022).
Conflicts of Interest
The authors declare no conflict of interest.
Appendix A
Appendix A.1. List of Countries
The countries available in the data are the following: “Afghanistan”, “Albania”, “Algeria”, “American Samoa”, “Andorra”, “Angola”, “Anguilla”, “Antigua and Barbuda”, “Argentina”, “Armenia”, “Aruba”, “Australia”, “Austria”, “Azerbaijan”, “Bahamas”, “Bahrain”, “Bangladesh”, “Barbados”, “Belarus”, “Belgium”, “Belize”, “Benin”, “Bermuda”, “Bhutan”, “Bolivia (Plurinational State of)”, “Bonaire, Sint Eustatius and Saba”, “Bosnia and Herzegovina”, “Botswana”, “Brazil”, “British Virgin Islands”, “Brunei Darussalam”, “Bulgaria”, “Burkina Faso”, “Burundi”, “Cabo Verde”, “Cambodia”, “Cameroon”, “Canada”, “Cayman Islands”, “Central African Republic”, “Chad”, “Chile”, “China”, “China, Hong Kong SAR”, “China, Macao SAR”, “China, Taiwan Province of”, “Colombia”, “Comoros”, “Congo”, “Congo, Dem. Rep. of the”, “Cook Islands”, “Costa Rica”, “Côte d’Ivoire” “,Croatia”, “Cuba”, “Cyprus”, “Czechia”, “Denmark”, “Djibouti”, “Dominica”, “Dominican Republic”, “Ecuador”, “Egypt”, “El Salvador”, “Equatorial Guinea”, “Eritrea”, “Estonia”, “Eswatini”, “Ethiopia”, “Falkland Islands (Malvinas)”, “Faroe Islands”, “Fiji”, “Finland”, “France”, “French Polynesia”, “Gabon”, “Gambia”, “Georgia”, “Germany”, “Ghana”, “Gibraltar”, “Greece”, “Greenland”, “Grenada”, “Guam”, “Guatemala”, “Guinea”, “Guinea-Bissau”, “Guyana”, “Haiti”, “Honduras”, “Hungary”, “Iceland”, “India”, “Indonesia”, “Iran (Islamic Republic of)”, “Iraq”, “Ireland”, “Israel”, “Italy”, “Jamaica”, “Japan”, “Jordan”, “Kazakhstan”, “Kenya”, “Kiribati”, “Korea, Dem. People’s Rep. of”, “Korea, Republic of”, “Kuwait”, “Kyrgyzstan”, “Lao People’s Dem. Rep.”, “Latvia”, “Lebanon”, “Lesotho”, “Liberia”, “Libya”, “Lithuania”, “Luxembourg”, “Madagascar”, “Malawi”, “Malaysia”, “Maldives”, “Mali”, “Malta”, “Marshall Islands”, “Mauritania”, “Mauritius”, “Mexico”, “Micronesia (Federated States of)”, “Moldova, Republic of”, “Mongolia”, “Montenegro”, “Montserrat”, “Morocco”, “Mozambique”, “Myanmar”, “Namibia”, “Nauru”, “Nepal”, “Netherlands”, “New Caledonia”, “New Zealand”, “Nicaragua”, “Niger”, “Nigeria”, “Niue”, “North Macedonia”, “Northern Mariana Islands”, “Norway”, “Oman”, “Pakistan”, “Palau”, “Panama”, “Papua New Guinea”, “Paraguay”, “Peru”, “Philippines”, “Poland”, “Portugal”, “Qatar”, “Romania”, “Russian Federation”, “Rwanda”, “Saint Helena”, “Saint Kitts and Nevis”, “Saint Lucia”, “Saint Pierre and Miquelon”, “Saint Vincent and the Grenadines”, “Samoa”, “Sao Tome and Principe”, “Saudi Arabia”, “Senegal”, “Serbia”, “Seychelles”, “Sierra Leone”, “Singapore”, “Sint Maarten (Dutch part)”, “Slovakia”, “Slovenia”, “Solomon Islands”, “Somalia”, “South Africa”, “South Sudan”, “Spain”, “Sri Lanka”, “State of Palestine”, “Sudan”, “Suriname”, “Sweden”, “Switzerland, Liechtenstein”, “Syrian Arab Republic”, “Tajikistan”, “Tanzania, United Republic of”, “Thailand”, “Timor-Leste”, “Togo”, “Tokelau”, “Tonga”, “Trinidad and Tobago”, “Tunisia”, “Turkey”, “Turkmenistan”, “Turks and Caicos Islands”, “Tuvalu”, “Uganda”, “Ukraine”, “United Arab Emirates”, “United Kingdom”, “United States of America”, “Uruguay”, “Uzbekistan”, “Vanuatu”, “Venezuela (Bolivarian Rep. of)”, “Viet Nam”, “Wallis and Futuna Islands”, “Yemen”, “Zambia”, “Zimbabwe”.
Appendix A.2. Centrality Tables
Table A1.
Centrality Measures—2016.
Table A1.
Centrality Measures—2016.
| PageRank | Betweenness | |
|---|---|---|
| USA | 326 | |
| CHN | 563 | |
| DEU | 319 | |
| GBR | 123 | |
| CAN | 0 | |
| FRA | 0 | |
| HKG | 0 | |
| MEX | 0 | |
| JPN | 70 | |
| NLD | 8 | |
| ITA | 60 | |
| BEL | 48 | |
| KOR | 34 | |
| CHE | 0 | |
| ESP | 136 | |
| SGP | 50 | |
| IND | 4 | |
| ARE | 98 | |
| TWN | 45 | |
| VNM | 25 | |
| AUS | 0 | |
| POL | 0 | |
| BRA | 0 | |
| AUT | 0 | |
| MYS | 0 | |
| THA | 20 | |
| RUS | 89 | |
| IRL | 0 | |
| IDN | 12 | |
| CZE | 0 | |
| SWE | 0 | |
| PRT | 0 | |
| HUN | 0 | |
| PHL | 0 | |
| TUR | 0 | |
| IRQ | 0 | |
| SAU | 50 | |
| CHL | 0 | |
| NOR | 0 | |
| ZAF | 0 |
Table A2.
Centrality measures—2021.
Table A2.
Centrality measures—2021.
| PageRank | Betweenness | |
|---|---|---|
| USA | 393 | |
| CHN | 458 | |
| DEU | 328 | |
| CAN | 0 | |
| FRA | 0 | |
| MEX | 0 | |
| GBR | 173 | |
| HKG | 20 | |
| NLD | 12 | |
| JPN | 157 | |
| ITA | 53 | |
| BEL | 53 | |
| KOR | 54 | |
| CHE | 25 | |
| ESP | 111 | |
| IND | 15 | |
| TWN | 6 | |
| SGP | 79 | |
| VNM | 0 | |
| BRA | 0 | |
| ARE | 142 | |
| POL | 0 | |
| AUS | 0 | |
| MYS | 0 | |
| AUT | 0 | |
| RUS | 28 | |
| THA | 67 | |
| IDN | 0 | |
| IRL | 0 | |
| CZE | 0 | |
| PHL | 0 | |
| PRT | 0 | |
| HUN | 0 | |
| SWE | 0 | |
| IRQ | 0 | |
| TUR | 0 | |
| SAU | 61 | |
| CHL | 0 | |
| NOR | 0 | |
| ZAF | 0 |
Appendix A.3. Figures
The networks of international trade for the period 2017–2020 (Figure A1, Figure A2, Figure A3 and Figure A4, respectively) are presented here.

Figure A1.
Network of Exports—2017.
Figure A1.
Network of Exports—2017.


Figure A2.
Network of Exports—2018.
Figure A2.
Network of Exports—2018.


Figure A3.
Network of Exports—2019.
Figure A3.
Network of Exports—2019.


Figure A4.
Network of Exports—2020.
Figure A4.
Network of Exports—2020.

References
- Hidalgo, C.A.; Hausmann, R. The building blocks of economic complexity. Proc. Natl. Acad. Sci. USA 2009, 106, 10570–10575. [Google Scholar] [CrossRef]
- Fagiolo, G.; Reyes, J.; Schiavo, S. The evolution of the world trade web: A weighted-network analysis. J. Evol. Econ. 2010, 20, 479–514. [Google Scholar] [CrossRef]
- Tacchella, A.; Cristelli, M.; Caldarelli, G.; Gabrielli, A.; Pietronero, L. A new metrics for countries’ fitness and products’ complexity. Sci. Rep. 2012, 2, 723. [Google Scholar] [CrossRef]
- Fan, Y.; Ren, S.; Cai, H.; Cui, X. The state’s role and position in international trade: A complex network perspective. Econ. Model. 2014, 39, 71–81. [Google Scholar] [CrossRef]
- Morrison, G.; Buldyrev, S.V.; Imbruno, M.; Doria Arrieta, O.A.; Rungi, A.; Riccaboni, M.; Pammolli, F. On economic complexity and the fitness of nations. Sci. Rep. 2017, 7, 15332. [Google Scholar] [CrossRef]
- Teza, G.; Caraglio, M.; Stella, A.L. Growth dynamics and complexity of national economies in the global trade network. Sci. Rep. 2018, 8, 15230. [Google Scholar] [CrossRef] [PubMed]
- Yaveroğlu, Ö.N.; Malod-Dognin, N.; Davis, D.; Levnajic, Z.; Janjic, V.; Karapandza, R.; Stojmirovic, A.; Pržulj, N. Revealing the hidden language of complex networks. Sci. Rep. 2014, 4, 4547. [Google Scholar] [CrossRef] [PubMed]
- Kostoska, O.; Mitikj, S.; Jovanovski, P.; Kocarev, L. Core-periphery structure in sectoral international trade networks: A new approach to an old theory. PLoS ONE 2020, 15, e0229547. [Google Scholar] [CrossRef] [PubMed]
- Chong, S.Y.; Hur, J. Small hubs, large spokes and overlapping free trade agreements. World Econ. 2008, 31, 1625–1665. [Google Scholar] [CrossRef]
- Gómez-Hernández, L.Y.; Ramos-Ramírez, A.D. Las relaciones comerciales en América Latina en 1995 y 2015: Un análisis de redes complejas. Semest. Econ. 2017, 20, 163–185. [Google Scholar] [CrossRef]
- Metulini, R.; Riccaboni, M.; Sgrignoli, P.; Zhu, Z. The indirect effects of foreign direct investment on trade: A network perspective. World Econ. 2017, 40, 2193–2225. [Google Scholar] [CrossRef]
- Baltagi, B.H.; Egger, P.; Pfaffermayr, M. Estimating models of complex FDI: Are there third-country effects? J. Econom. 2007, 140, 260–281. [Google Scholar] [CrossRef]
- Chou, K.H.; Chen, C.H.; Mai, C.C. The impact of third-country effects and economic integration on China’s outward FDI. Econ. Model. 2011, 28, 2154–2163. [Google Scholar] [CrossRef]
- Regelink, M.; Paul Elhorst, J. The spatial econometrics of FDI and third country effects. Lett. Spat. Resour. Sci. 2015, 8, 1–13. [Google Scholar] [CrossRef]
- Berg, K.A.; Mark, N.C. Third-country effects on the exchange rate. J. Int. Econ. 2015, 96, 227–243. [Google Scholar] [CrossRef]
- Bahmani-Oskooee, M.; Aftab, M. A new perspective on the third-country effect: The case of Malaysia–US industry-level trade. J. Int. Trade Econ. Dev. 2018, 27, 607–637. [Google Scholar] [CrossRef]
- Chen, M.X.; Joshi, S. Third-country effects on the formation of free trade agreements. J. Int. Econ. 2010, 82, 238–248. [Google Scholar] [CrossRef]
- Neary, J.P. Putting the “new” into new trade theory: Paul Krugman’s Nobel Memorial Prize in economics. Scand. J. Econ. 2009, 111, 217–250. [Google Scholar] [CrossRef]
- Morales, E.; Sheu, G.; Zahler, A. Extended gravity. Rev. Econ. Stud. 2019, 86, 2668–2712. [Google Scholar] [CrossRef]
- Sopranzetti, S. Overlapping free trade agreements and international trade: A network approach. World Econ. 2018, 41, 1549–1566. [Google Scholar] [CrossRef]
- Alves, L.G.A.; Mangioni, G.; Rodrigues, F.A.; Panzarasa, P.; Moreno, Y. Unfolding the complexity of the global value chain: Strength and entropy in the single-layer, multiplex, and multi-layer international trade networks. Entropy 2018, 20, 909. [Google Scholar] [CrossRef]
- Kaufmann, A.; Aluja, J.G. Modelos Para la Investigación de Efectos Olvidados; Milladoiro: Vigo, Spain, 1988. [Google Scholar]
- Rojas-Mora, J.; Chávez-Bustamante, F.; Mondaca-Marino, C. Forgotten effects in trade relations: A view from the Belt and Road Initiative (BRI). Asian Educ. Dev. Stud. 2020, 10, 410–420. [Google Scholar] [CrossRef]
- Lafuente, F.J.M.; Lafuente, A.M.G.; Guzman-Parra, V.F.; Lafuente, J.G. Key factors for entrepreneurial success. Manag. Decision 2013, 51, 1932–1944. [Google Scholar] [CrossRef]
- Blanco-Mesa, F.; Leon-Castro, E.; Bermudez-Mondragon, D.; Castro-Amado, M. Forgotten motivational factors of boyacense Colombian entrepreneurs: A subjective analysis of second-generation incidences. Mathematics 2021, 9, 973. [Google Scholar] [CrossRef]
- Flores-Romero, M.B.; Pérez-Romero, M.E.; Álvarez-García, J.; del Río-Rama, M.d.l.C. Fuzzy techniques applied to the analysis of the causes and effects of tourism competitiveness. Mathematics 2021, 9, 777. [Google Scholar] [CrossRef]
- González-Morcillo, S.; Horrach-Rosselló, P.; Valero-Sierra, O.; Mulet-Forteza, C. Forgotten effects of active tourism activities in Spain on sustainable development dimensions. Environ. Dev. Sustain. 2022, 24, 1–21. [Google Scholar] [CrossRef]
- Barcellos-Paula, L.; De la Vega, I.; Gil-Lafuente, A.M. The Quintuple Helix of innovation model and the SDGs: Latin-American countries’ case and its forgotten effects. Mathematics 2021, 9, 416. [Google Scholar] [CrossRef]
- Martorell-Cunill, O.; Gil-Lafuente, A.M.; Socias Salvà, A.; Mulet Forteza, C. The growth strategies in the hospitality industry from the perspective of the forgotten effects. Comput. Math. Organ. Theory 2014, 20, 195–210. [Google Scholar] [CrossRef]
- Nicolas, C.; Rojas-Mora, J.; Valenzuela-Fernandez, L. Causal relationships between economic activity and the mining industry in Chile. J. Intell. Fuzzy Syst. 2020, 38, 5405–5412. [Google Scholar] [CrossRef]
- Egger, P. An econometric view on the estimation of gravity models and the calculation of trade potentials. World Econ. 2002, 25, 297–312. [Google Scholar] [CrossRef]
- Martinez-Zarzoso, I. Gravity model: An application to trade between regional blocs. Atl. Econ. J. 2003, 31, 174–187. [Google Scholar] [CrossRef]
- Defever, F.; Heid, B.; Larch, M. Spatial exporters. J. Int. Econ. 2015, 95, 145–156. [Google Scholar] [CrossRef]
- Duenas, M.; Fagiolo, G. Modeling the international-trade network: A gravity approach. J. Econ. Interact. Coord. 2013, 8, 155–178. [Google Scholar] [CrossRef]
- Garlaschelli, D.; Loffredo, M.I. Structure and evolution of the world trade network. Phys. A Stat. Mech. Its Appl. 2005, 355, 138–144. [Google Scholar] [CrossRef]
- Tzekina, I.; Danthi, K.; Rockmore, D.N. Evolution of community structure in the world trade web. Eur. Phys. J. B 2008, 63, 541–545. [Google Scholar] [CrossRef]
- Efron, B. Computers and the theory of statistics: Thinking the unthinkable. SIAM Rev. 1979, 21, 460–480. [Google Scholar] [CrossRef]
- Efron, B. Better bootstrap confidence intervals. J. Am. Stat. Assoc. 1987, 82, 171–185. [Google Scholar] [CrossRef]
- Coates, J.F.P.; Godet, M. From Anticipation to Action: A Handbook of Strategic Prospective; UNESCO Publishing: Paris, France, 1994. [Google Scholar]
- Mardones-Arias, E.; Rojas-Mora, J. foRgotten. Available online: https://github.com/ElliottMardones/foRgotten (accessed on 22 August 2022).
- R Core Team. R: A Language and Environment for Statistical Computing; R Foundation for Statistical Computing: Vienna, Austria, 2022. [Google Scholar]
- Csardi, G.; Nepusz, T. The igraph software package for complex network research. InterJ. Complex Syst. 2006, 1695, 1–9. [Google Scholar]
- Page, L.; Brin, S.; Motwani, R.; Winograd, T. The PageRank Citation Ranking: Bringing Order to the Web; Technical Report; Stanford InfoLab. 1999. Available online: http://ilpubs.stanford.edu:8090/422/ (accessed on 22 August 2022).
- Del Río-Chanona, R.M.; Grujić, J.; Jeldtoft Jensen, H. Trends of the world input and output network of global trade. PLoS ONE 2017, 12, e0170817. [Google Scholar] [CrossRef] [PubMed]
- De Andrade, R.L.; Rêgo, L.C. The use of nodes attributes in social network analysis with an application to an international trade network. Phys. A Stat. Mech. Its Appl. 2018, 491, 249–270. [Google Scholar] [CrossRef]
- De Benedictis, L.; Tajoli, L. The world trade network. World Econ. 2011, 34, 1417–1454. [Google Scholar] [CrossRef]
- Baldwin, R.; Di Mauro, B.W. Innovation and Intellectual Property Rights. In Economics in the Time of COVID-19; Baldwin, R., Di Mauro, B.W., Eds.; CEPR Press: London, UK, 2020; pp. 1–30. [Google Scholar]
- Vidya, C.; Prabheesh, K. Implications of COVID-19 pandemic on the global trade networks. Emerg. Mark. Financ. Trade 2020, 56, 2408–2421. [Google Scholar] [CrossRef]
- Li, X.; Meng, B.; Wang, Z. Recent patterns of global production and GVC participation. Glob. Value Chain Dev. Rep. 2019, 2019, 9. [Google Scholar]
- Kali, R.; Reyes, J. The architecture of globalization: A network approach to international economic integration. J. Int. Bus. Stud. 2007, 38, 595–620. [Google Scholar] [CrossRef]
- Gala, P.; Camargo, J.; Freitas, E. The Economic Commission for Latin America and the Caribbean (ECLAC) was right: Scale-free complex networks and core-periphery patterns in world trade. Camb. J. Econ. 2018, 42, 633–651. [Google Scholar] [CrossRef]
- Zhang, C.; Fu, J.; Pu, Z. A study of the petroleum trade network of countries along “The Belt and Road Initiative”. J. Clean. Prod. 2019, 222, 593–605. [Google Scholar] [CrossRef]
- Zhu, Z.; Cerina, F.; Chessa, A.; Caldarelli, G.; Riccaboni, M. The rise of China in the international trade network: A community core detection approach. PLoS ONE 2014, 9, e105496. [Google Scholar] [CrossRef]
- Almog, A.; Squartini, T.; Garlaschelli, D. The double role of GDP in shaping the structure of the International Trade Network. Int. J. Comput. Econ. Econom. 2017, 7, 381–398. [Google Scholar] [CrossRef]


Disclaimer/Publisher’s Note: The statements, opinions and data contained in all publications are solely those of the individual author(s) and contributor(s) and not of MDPI and/or the editor(s). MDPI and/or the editor(s) disclaim responsibility for any injury to people or property resulting from any ideas, methods, instructions or products referred to in the content. |
© 2023 by the authors. Licensee MDPI, Basel, Switzerland. This article is an open access article distributed under the terms and conditions of the Creative Commons Attribution (CC BY) license (https://creativecommons.org/licenses/by/4.0/).