Article

Column-Type Prediction for Web Tables Powered by Knowledge Base and Text

1
College of Computer Science and Technology, Hangzhou Dianzi University, Hangzhou 310018, China
2
College of Computer Science and Technology, Nanjing University of Aeronautics and Astronautics, Nanjing 210016, China
3
Jubang Group Co., Ltd., Yueqing 325600, China
*
Author to whom correspondence should be addressed.
Mathematics 2023, 11(3), 560; https://doi.org/10.3390/math11030560
Submission received: 25 December 2022 / Revised: 17 January 2023 / Accepted: 18 January 2023 / Published: 20 January 2023
(This article belongs to the Special Issue Big Data Mining and Analytics with Applications)

Abstract

:
Web tables are essential for applications such as data analysis. However, web tables are often incomplete and short of some critical information, which makes it challenging to understand the web table content. Automatically predicting column types for tables without metadata is significant for dealing with various tables from the Internet. This paper proposes a CNN-Text method to deal with this task, which fuses CNN prediction and voting processes. We present data augmentation and synthetic column generation approaches to improve the CNN’s performance and use extracted text to get better predictions. The experimental result shows that CNN-Text outperforms the baseline methods, demonstrating that CNN-Text is well qualified for the table column type prediction.

1. Introduction

In recent years, the information contained in the vast data ocean has been mixed with the exponential growth of web data. Thus, the way by which to extract useful information from web data and put it into practice has become a hotspot. In data analytics, understanding web table content’s semantic structure and meaning are invaluable in popular areas such as data integration, data cleaning, machine learning, and knowledge discovery. Tables on the web page are high-value data because they are often used to present important information in an organized and easily readable way. Thus, the organization and structure of tables on a web page make them a valuable source of data for many applications. However, web tables may lack essential information, making information collection difficult.
Example 1. 
Figure 1 shows a web table example crawled on the Internet, which doesn’t have a column header, column schema, and table title. It is unclear what the data in each column represents, making it difficult to understand the table content.
To reasonably use the table’s contents without column name information, it is possible to understand the semantic information in the table with the help of additional and sufficient relevant information, such as tabular master data [1], domain experts [2], and crowdsourcing [3]. However, these resources may be scarce and are usually costly to employ. Fortunately, there exists an increasing availability of knowledge bases (KBs) such as Yago [4], DBpedia [5], and Freebase [6], which are well-curated and cover a large portion of web data. Thus, we can annotate table elements with entity or type information in the KBs to understand the semantics of each column in the web table.
Challenges. However, dealing with the column-type prediction task with the help of KBs suffers from several issues. First, because the web tables often come from complex semistructured webpages, metadata (such as table names and column names) are often missing, incomplete, or ambiguous. The lack of such semantically rich information poses a vast challenge to existing column-type prediction approaches [7,8,9]. Secondly, the performance of a model varies with the specific architecture and hyperparameters used, as well as the quality and amount of training data. Existing methods [10,11] that use a single model to complete column-type prediction tasks are not compelling enough. Thirdly, the metadata and the cells in the table lack contextual information; thus, it is difficult to predict correct column names.
In this paper, we propose a CNN-Text model for tackling these challenges. First, we use the lookup method to provide more semantic information related to tabular contents and propose a data augmentation approach to generate additional data for robustness. For the second challenge, we introduce the method of combining CNN with voting to obtain more accurate results. For the third challenge, we rationally use the text extracted from the knowledge base to provide contextual information of entities to help improve prediction accuracy.
Contributions. We summarize our contributions as follows.
  • We propose a novel model CNN-Text, which contains the CNN and voting modules, which makes the column-type prediction results more accurate.
  • We propose a data augmentation method for column-type prediction, which enables the CNN model to have better generalization ability.
  • We conducted a series of experiments to demonstrate that CNN-Text is effective and the performance has been significantly improved compared with the baseline methods.

2. Related Work

The tabular data-prediction task aims to match table elements with semantic types, including cell-entity and column-type predictions. Recent methods mainly focus on column-type prediction [7,8,9,11,12,13], except that PGM [10], TabGCN [14], and Meimei [15] simultaneously finish these two tasks. However, TabGCN requires a complex algorithm to transform data into graphs and is sensitive to dirty data. Furthermore, PGM and Meimei use the Markov random field framework for prediction, which uses costly handcrafted features. Tabbie [8] averages embedding of rows and columns for obtaining embedding of cells. TURL [7] and Doduo [11] utilize the transformer to build features with respective pretraining methods. The above techniques need large quantities of artificially labeled corpora for training. Colnet [12] and TCN [9] capture features by convolutional networks. Note that the idea of Colnet is close to ours, but our methods construct a novel framework combined with a keyword coverage voting mechanism and get better performance on real-world datasets.
Representation learning. Nowadays, the representation learning approaches can be divided into three categories: discrete methods [16,17], distributed methods [18,19], and deep learning methods [7,8,11,12,14]. The discrete representation methods use discrete vectors for representation, which cannot express the semantic information of words and will encounter the problem of sparse data and loss of information. The distributed representation methods model the relationship between the context and the target word by considering the contextual information. However, such methods are mainly based on statistical computing, and the feature representation effect depends on the corpus size. The representation methods based on deep learning use deep neural networks to extract features and represent them as embeddings for various downstream tasks. Based on Word2vec [20], we use CNNs to capture deeper semantic information of tables.
Collective approaches. The collective approaches accomplish the objective by combining multiple learning tasks. Current ensemble methods for table annotation tasks are mainly divided into joint inference methods [10,15,21,22] and iterative methods [7,8,11,12]. The joint inference method combines the prediction results of multiple learners to obtain the final goal. The iterative method updates the model parameters through multiple epochs using optimizers to obtain better scores on the evaluation dataset. Both methods achieve good results with metadata (such as column names and table names) but perform poorly on tabular data consisting only of cells. We combine the strengths of these two methods while using the CNN model to iteratively update the parameters to obtain better results. We also use the joint inference method to combine the CNN prediction results and the text classifier prediction results on the two datasets.

3. Problem Definition

In this section, we first define the table and text and then define the problem of column-type prediction.
Table definition. Given a table set T, table t T contains at least one unlabeled column K, composed of the attribute descriptions of various entities E = { e 1 , e 2 , } .
Table dataset details. The T2Dv2 [12] includes common table entries on the Internet, with 237 labeled primary key (PK) columns and 174 labeled nonprimary key (NPK) columns, where each label corresponds to a fine-grained DBpedia class. Limaye has various tables collected from Wikipedia. We use the version derived from the literature [23], which contains 84 PK columns with labels.
Text definition. Suppose a text set S is obtained from KBs, wherein each piece of text s S describes an entity e in the table t T , and its content may contain multiple entities e and classes c that contribute to the column-type prediction.
Column-type prediction. The tabular data prediction task includes the cell entity prediction, the column-type prediction, and the column pair relation prediction tasks. Following [12], we focus on the column-type prediction task, which aims to predict a possible class c C for an unlabeled column K in strict mode or a set C K = { c 1 , c 2 , } C of possible classes in tolerant mode.

4. Methodology

This section introduces the overall structure of CNN-Text, as shown in Figure 2. CNN-Text includes four essential parts: lookup, data augmentation, CNN training, and column-type prediction. The lookup module is designed to obtain tabular semantic information from the KB. Then, the data augmentation module enriches the dataset based on the abovementioned information for CNN training. Finally, we fuse the prediction of CNN and voting to obtain the final prediction results, where voting utilizes the explanatory text extracted from the KB. We elaborate on each part in detail in the following sections.

4.1. Lookup

Looking up the KBs for external tabular information is the crucial step of our CNN-Text framework. As seen from Figure 3, the structured data in the KBs includes classes and entities with many-to-many logic relationships. A class can contain multiple entities, while an entity can also belong to various classes. Thus, we can easily find the relationship between entities and entities, entities and classes, or classes and classes by looking up the KBs.
We propose expanding the training set based on the original dataset through a KB. Figure 4a shows an example of a table structure. The entities in the same column belong to a specific class shown in the table header, e.g., { e 1 , e 2 , e 3 } belongs to c 1 . Considering an entity may belong to multiple classes in a KB, we expand the training set in three steps. First, we extend classes by querying the KB based on the class name, finding similar classes for each class in the original table. As shown in Figure 4b, the classes { c 4 , c 5 , c 6 } , { c 7 , c 8 , c 9 } , { c 10 , c 11 , c 12 } represent the similar classes queried by class c 1 , c 2 , c 3 , respectively. The second step is to find other possible classes from the KB which contain entities in the table based on the entity names, e.g., the class c 13 is queried by the entity e 1 . Finally, we query the KB to get more entities corresponding to each known class, where the retrieved entities will be supplementally added to the training set of the corresponding class. For instance, { e 10 , , e 22 } are the retrieved entities queried by classes { c 4 , c 5 , , c 17 } from the KB.
When expanding the training set for different columns, there may be cases in which different columns have the same class, and we merge all of them to be the extra training set. After finishing the above operations for every class and entity in table t T , we get a larger dataset for the following data augmentation, training, and voting process.

4.2. Data Augmentation

To capture intrinsic relationships among entities, alleviate overfitting, and enrich the dataset, we propose generating three types of synthetic column samples. Before this, we divide entities into corresponding categories.
Entity categorization. After expanding the training set with more classes and entities during lookup, we propose a data augmentation approach to generate three types of entities for synthetic column generation, i.e., negative entity, special positive entity, and normal positive entity. Then we use them to generate synthetic columns for CNN training. Specifically, for a specific class c, if an entity e belongs to c and is contained in table t, then e is defined as a special positive entity of c. Similarly, we define the entity belonging to the class but derived from the KB instead of table t as the normal positive entity. Last but not least, suppose the entities e 1 and e 2 come from different classes c 1 and c 2 . We define e 1 as the negative entity of c 1 and e 2 as the negative entity of c 2 .
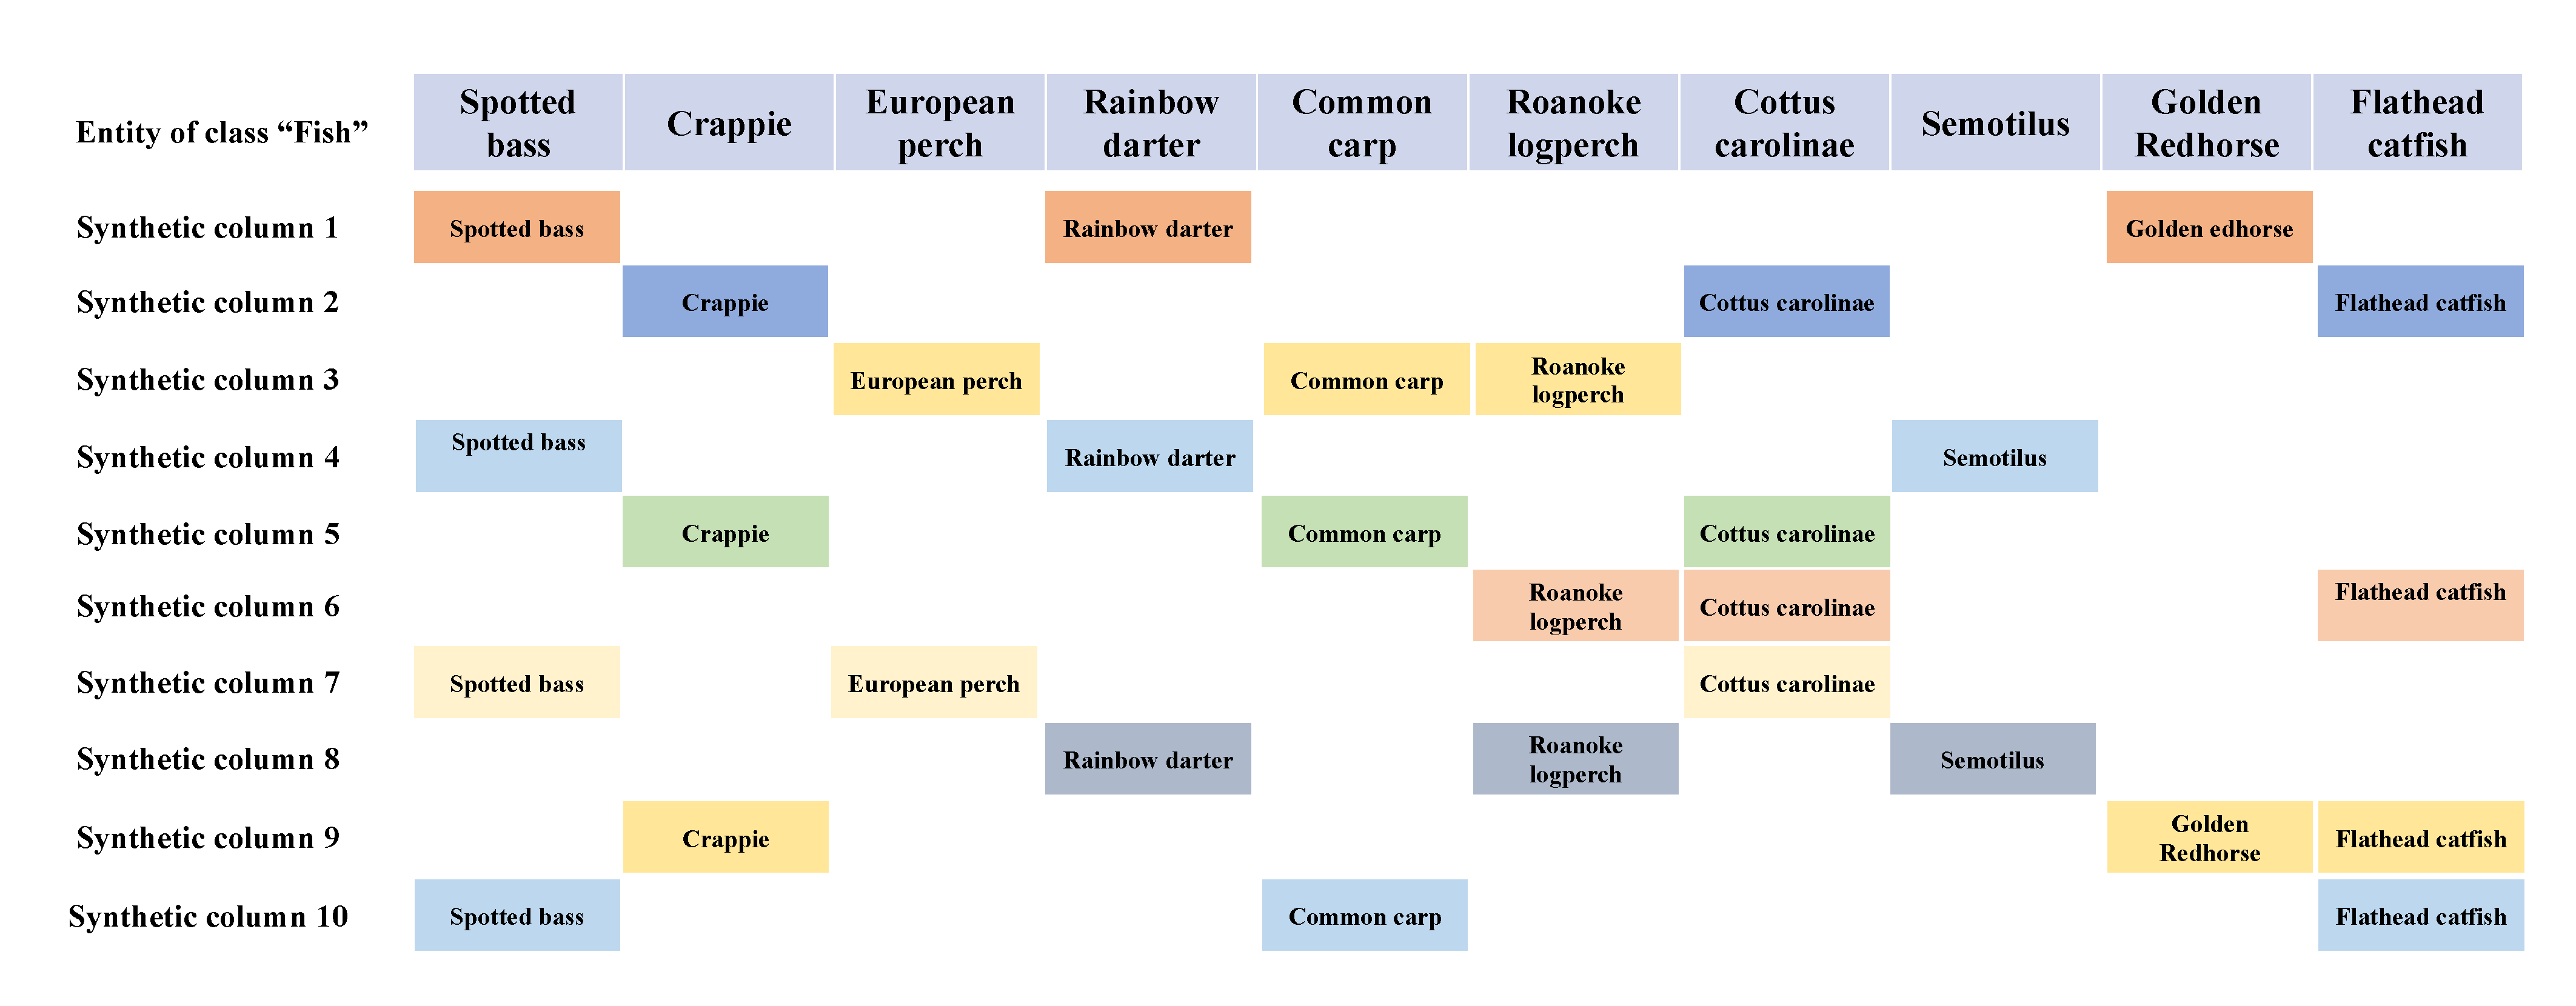
Synthetic column samples. Based on three types of entities, we augment synthetic column samples for training. Specifically, to generate a j-length special positive sample S P for class c, each special positive entity is combined with ( j 1 ) randomly selected special positive entities. Similarly, a j-length normal positive sample N P for class c includes j randomly selected normal positive entities. While for the generation of the negative sample N G for class c, the special/normal positive and negative entities are mixed, where the number of positive and negative entities must be greater than 1.
Example 2. 
As shown in Figure 5, we have a training set of class “Fish”: “Spotted bass”, “Crappie”, “European perch”, “Rainbow darter”, etc. Suppose j = 3 , we combine each entity with other two entities as one synthetic column, such as [“Spotted bass”, “Rainbow darter”, “Golden edhorse”], [“Crappie”, “Cottus carolinae”, “Flathead catfish”], etc.
Remark 1. 
The synonyms for the class name can augment the training set through the KB search. Thus, we also enrich the dataset by replacing some entities with their synonyms to improve CNN-Text’s robustness.

4.3. The CNN Training

This section describes the CNN model, where we elaborate on column embedding generation and CNN training.
Column embedding. We transform columns into vectors as CNN inputs for training. Specifically, for each column K, we split all the entities and integrate them into a word sequence w 1 , w 2 , , w n , where n is the length of each word sequence and w n refer to the n-th word in the word sequence. To simplify computation, we guarantee that all word sequences are of the same length n. If the word sequence length is greater than n, we discard redundant parts of word sequences. If the word sequence length is less than n, we use N a N to fill in the missing pieces of sequences of insufficient length.
Then, we convert column K into the embedding features x ( K ) R n × d via word vectorization and vector superposition, as follows:
x ( K ) = v ( w 1 ) v ( w 2 ) v ( w n ) ,
where v ( · ) represents the d-dimensional vector representation of w with a shape of 1 × d , and ⊗ represents a vector dimension superposition. v ( · ) can be obtained by Word2vec methods [20], where similar words get vectors with close distances. Therefore, we obtain the column embedding x ( K ) R n × d for column K, which will be transmitted to CNN as inputs.
Example 3. 
Consider there exists a column containing entities “Trivial. Pursuit”, “Shadowrun”, “Go (game)”, and “Bakugan Battle Brawlers”. To generate word embedding, we removed trivial symbols, converted all words to lowercase, and concatenated all words into a sequence: “trivial pursuit shadowrun go game bakugan battle”. If n is 5, the word sequence will be truncated to “trivial, pursuit, shadowrun, go, game” and then converted to column embedding according to Equation (1). Although if n is 10, the sequence will be supplemented to “trivial, pursuit, shadowrun, go, game, bakugan, battle, NaN, NaN, NaN”, and then converted to column embedding.
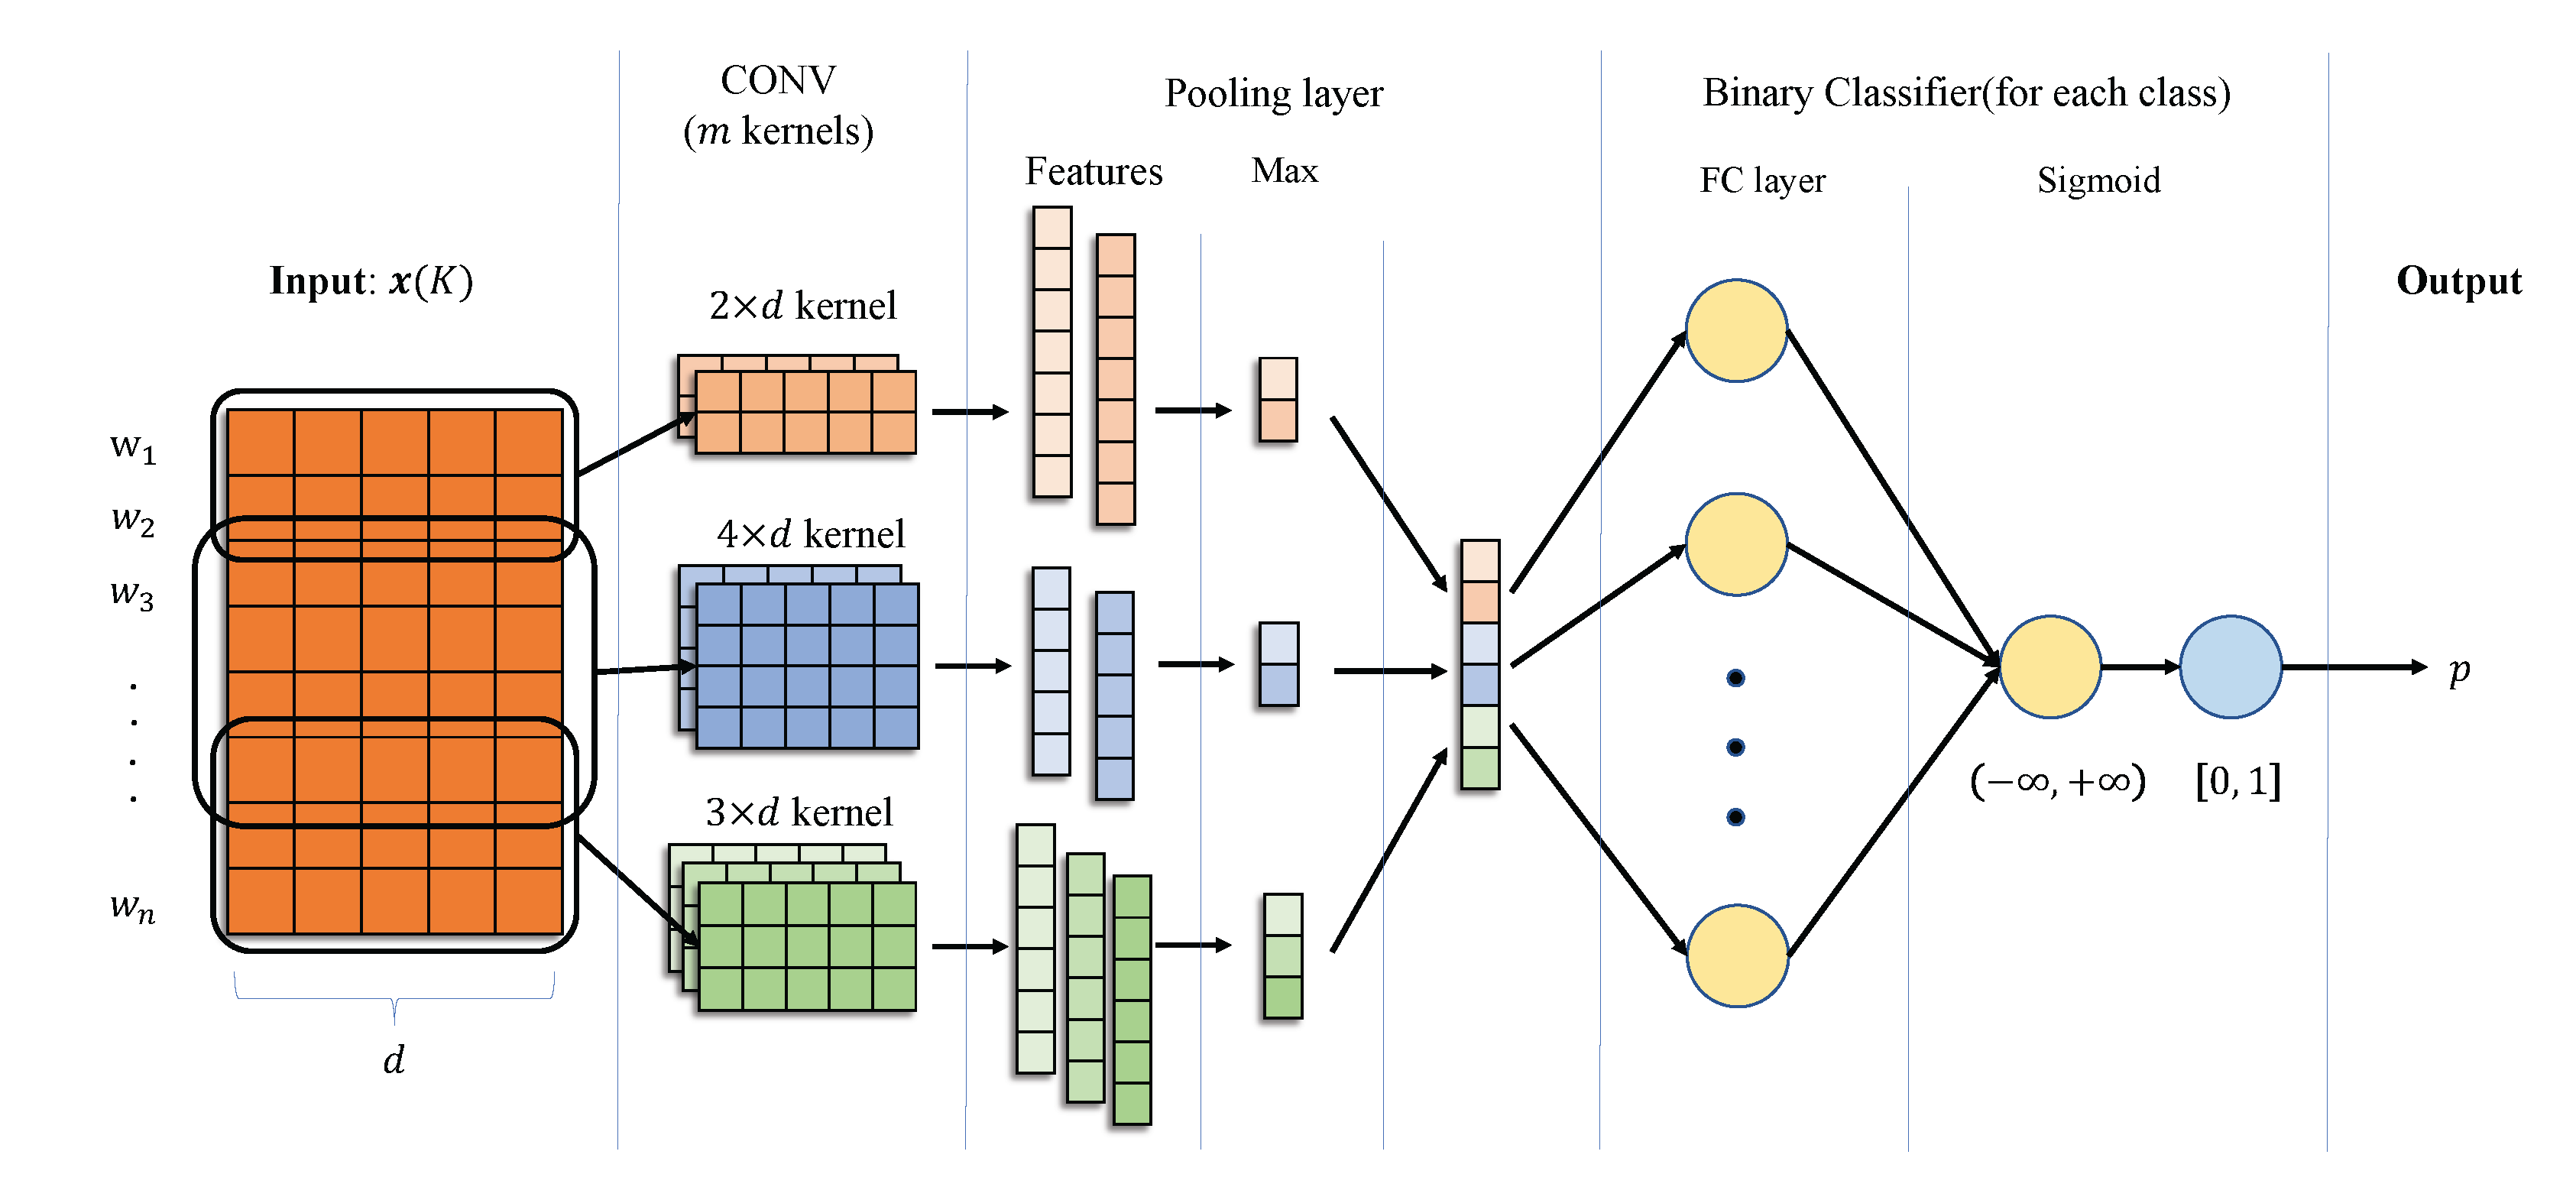
Convolution neural network. Considering that the CNNs are effective at exploring the regional syntax of words [12], we use the CNN model to extract the features of a synthetic column composed of multiple words. The architecture of the entire CNN model is shown in Figure 6, including a convolution layer, a pooling layer, a fully connected layer, and a sigmoid activation layer. The convolution base layer is responsible for extracting features, the pooling layer is used to reduce the dimension for alleviating huge parameters and preventing overfitting, the fully connected layer is used to change the feature dimension, and the sigmoid activation layer is to output the prediction result. Considering feature vectors belonging to different classes have various significant partial features to focus on, we train an individual binary classifier in the CNN model for each candidate class for much more proper attention over specific partial features. Thus, the output dimension after the fully connected layer is 1.
The CNN input is the embedding x ( K ) of a column K. We use a convolutional layer that includes m multiple filters to extract features, the kernel size of each filter w is l × d , and the height l has various choices (e.g., 2,3,4). We obtain the feature vector f via convolution layer,
f = h ( x ( K ) W + b ) ,
where W , b is the weight matrix and bias matrix, respectively. ⊗ denotes the convolution operation, and h ( · ) is an activation function. The feature vector f i output by the i-th filter has a size of d × ( n j + 1 ) ,
f i = h ( w x ( K ) i : i + j 1 + b i ) ,
where • represents the matrix dot product operation. We process these feature vectors by using a max pooling layer that stacks the maximum value of each feature vector together, and then we get a vector f with size m × 1 ,
f = [ m a x ( f 1 ) , m a x ( f 2 ) , , m a x ( f m ) ] .
Then we use a fully connected (FC) layer and sigmoid function to predict the label of a column for a specific candidate class from the learned distributed feature representation as follows,
p = s i g m o i d ( h ( W f + b ) ) ,
where W R m × 1 is the weight matrix, b R 1 × 1 is the bias matrix.
Finally, CNN-Text uses the cross-entropy loss function to calculate the loss based on the predicted label of each column and its true label and reversely updates the parameters after derivation. The computation formula is shown in Equation (6):
L o s s = i = 1 n p ( x i ) l o g ( q ( x i ) ) ,
where p, q, and n represent the predicted label, the true label, and the number of class types, respectively.

4.4. Column-Type Prediction

Introducing and utilizing additional information is very effective for annotating tabular data that often lack metadata. In addition to CNN prediction, CNN-Text designs a voting module to provide different prediction results based on KB’s textual information. Then, an ensemble approach is proposed to fuse the prediction results of the CNN model and voting.
Candidate Class. To find the possible classes a column belongs to, CNN-Text uses the lookup method in the KB. For entity e 1 , we get c 1 , c 2 that e 1 belongs to from the KB, and for e 2 , we get c 3 that e 2 belongs to. We defined the classes of each entity in a column as the candidate classes of the column. If a column K contains e 1 , e 2 , the candidate class for this column will be c 1 , c 2 , c 3 .
Text extraction. For an entity e, besides looking up its class c in the KBs, CNN-Text extracts its unstructured, explanatory description text s to obtain more attribute information. For example, for the entity “Arduino”, looking up the KB for its classes, we get the keywords “Device” and “Information Appliance”. While searching for its text description, we get an entire paragraph of sentences, as shown in Figure 7. Then, we adopt part-of-speech tagging tools [24,25,26] to extract keywords which may be the entities or classes, such as “open-source hardware”, “software company”, “digital devices”, “microcontrollers”, and “kits”. From the example, we can infer that an in-depth description of an entity can be obtained by extracting unstructured text from the KB. This description has a higher probability of including multiple possible classes to which it belongs.
Voting. With the extracted text, we vote on all candidate classes for a given column, and the voting result determines whether it belongs to the corresponding class. Specifically, we gather all defining words (e.g., entities and types related to the class) into a keyword vocabulary and calculate the keyword coverage in all extracted text corresponding to entities under that given column. The coverage is defined as v c , i.e., the probability of the column belonging to each candidate class c.
CNN Prediction. For a column, the trained CNN model predicts the probability { p c 1 , , p c n } for all candidate classes { c 1 , , c n } . As the time complexity of permuting and combining all entities as input is exponential, we adopt two methods to build multiple subcolumns: (1) the sliding window method to select a continuous part of entities or (2) random selection. The number of subcolumns for each column sample is defined as η , and we evaluate the model performance under different η in the experiments. The CNN model predicts the probability for each subcolumn, and finally, these results are averaged to get the CNN prediction result,
p c = 1 η i = 1 η p i c ,
where p i c represents the probability of the i-th subcolumn belonging to candidate class c.
Ensemble. Voting utilizes keyword features through the statistical method, and CNN captures the context information among the entities. To take advantage of both methods, we use an ensemble approach [12] to calculate the final probability s c of each candidate class c by fusing the CNN and voting results,
s c = v c , v c < φ 2 or v c φ 1 ; p c , otherwise ,
where φ 1 and φ 2 are hyperparameters ( 0 φ 2 φ 1 1 ). The formula illustrates that we accept the voting result when it is greater than or equal to φ 1 or less than φ 2 . Otherwise, we reject it and adopt the predicted result from CNN. Last but not least, we create a prediction threshold ϵ for judging whether the final result can provide sufficient evidence for column-type prediction; that is, we accept column K to be predicted as class c if s c ϵ .

5. Experiments

5.1. Experiment Setup

Datasets. We use two datasets to demonstrate CNN-Text’s performance. The statistics of datasets are summarized in Table 1, where # Cell(Avg.) represents the average number of cells in the table. Considering the few labeled samples in datasets, we adopt the synthetic columns generated by the data augmentation as the training data while keeping the original labeled part of the dataset as the test set for evaluation. The random subcolumn generation will construct η subcolumn training sample for each synthetic column sample. Specifically, we use η × 84 training samples and 84 validation (or testing) samples for Limaye, and we use η × 411 training samples and 411 validation (or testing) samples for T2Dv2.
Compared methods. To verify the effectiveness of CNN-Text, we compare our model with the SOTA methods ColNet and T2K Match. We summarize these methods below.
  • T2K Match [13] is an iterative matching method that combines schema matching and instance matching, the major process of which includes candidate selection, value-based matching, property-based matching, and iterative matching.
  • ColNet [12] is a framework that utilizes a KB, word representations, and machine learning to automatically train prediction models for annotating types of entity columns.
Implementation details. We implement the proposed CNN-Text method in Tensorflow and Word2Vec [20] Library. For Word2Vec, we use GoogleNews pretrained corpus [27], which contains 300-dimensional vectors for three million words and phrases. We use Spacy as the part-of-speech tagging tool. For external information, we use Wikipedia to extend the entity and the class in lookup process, and we use DBpedia to query unstructured text. All the experiments are performed on an R9-3900X server with 32G RAM and 1080Ti GPU. The training epoch is set to 50. The average training time per epoch for CNN module in CNN-Text ranges from 0.5556 s for Limaye to 8.5657 s for T2Dv2, and the training time of ColNet is similar. But for the prediction process, CNN-Text takes 19.98 s for T2Dv2 and 2.95 s for Limaye whereas ColNet takes 12.6 s for T2Dv2 and 2.34 s for Limaye. We adopt precision, recall, and F1-score metrics to compare our method’s performance with other baseline methods. To ensure the repeatability and validity of the model, all experiments were repeated five times, and the scores were averaged to obtain the final results. To verify the model’s performance on both single-label and multilabel classification, we use the “tolerant” mode and the “strict” mode for evaluation, which involve different truth datasets. Generally, we got only one or two truth values in strict mode, while tolerant typically has more (up to five) truth values for each label of column. Therefore, we compute metrics’ scores for strict mode based on a single-label classification problem, but scores for tolerant mode are based on a multilabel classification problem. The length of subcolumn for ColNet and CNN-Text is set to 2 and 4 (subsequent experiments will demonstrate). For CNN-Text, we manually optimize φ 1 and φ 2 to 0.5 and 0.08, respectively.

5.2. Experimental Results

Table 2 and Table 3 illustrate the performance of various methods on the Limaye dataset and T2Dv2 dataset respectively, where we only use the augmented data derived from the whole original dataset as the training set and use original labeled columns as the test set. Limaye does not have labeled NPK columns, so we can only accomplish the type prediction for PK columns. First, T2K Match only adopts the candidate matching method, which cannot fully utilize the semantic features buried in columns. Therefore, T2K Match achieves the worst results on all datasets and in all evaluation modes. On the Limaye dataset, CNN-Text outperforms other methods in both modes, which can contribute to the impact of combining the CNN prediction with the voting mechanism. CNN module focuses on capturing the critical entity information in the column, and its prediction results are more inclined to the types labeled in the original dataset. At the same time, the voting mechanism adopts a method similar to knowledge base matching, which can efficiently complete the prediction for those types from the knowledge base. Therefore, the combination of this method and CNN can make up for the defect that CNN cannot predict the type from the knowledge base well. In the strict mode, the recall of CNN-Text can be improved by nearly 6%, and the F1-score can be improved by 2.9% and the precision is generally improved. While in the tolerant mode, the F1-score of CNN-Text has a 4.7% improvement compared with ColNet, with significantly increased precision and naturally enhanced recall. On the T2Dv2 dataset, CNN-Text achieves comparable performance with Colnet, while both are still much higher than T2K Match. These results indicate that the extracted text of T2Dv2 is dirty to describe the corresponding entity, bringing about poor voting results.
Data augmentation validation. To show the effect of data augmentation, we added a comparative experiment on whether to use the data generated by data augmentation to train the model. For Limaye, the average number of original samples and augmented samples per class are 42 and 2492 respectively. For T2Dv2, the average number of original samples and augmented samples per class are 320 and 17,493 respectively. We divided the original dataset into 70% of the training set and 30% of the test set, and the data augmentation was only conducted on 70% of the training set. We train three variants of models: (A) using only 70% of the original dataset, (B) using only the augmented dataset from 70% of the training set, (C) using both 70% of the original dataset and the dataset generated by data augmentation. The results are shown in Table 4 and Table 5. We can find that variants (B) and (C) using the augmented dataset outperform variant (A), which only uses the original dataset in both restrict and tolerant mode, and the greatest improvement is achieved for the Limaye dataset in tolerant mode, close to 42%. Therefore, it demonstrates the effectiveness of data augmentation. Across all experiments, variant (B) performs best in most cases. It achieves the highest precision and F1-score in all tolerant modes and most strict modes. Variant (B) achieves better scores than variant (C), showing that only using the dataset generated by data augmentation as the training set can alleviate the overfitting problem of using a mixed dataset used by variant (C). Therefore, using the different dataset from data augmentation as the training set is worthwhile. It is also worth considering why the model performs differently on different datasets. The experiment results on the Limaye dataset have better results because the Limaye dataset has relatively straightforward and tidy data fields, and we can get better results when querying the KB and voting. But T2Dv2 contains many special or dirty characters, and the text extracted from KB contains less valuable keywords. These two problems make it difficult for CNN prediction and precise voting.
Ablation study. We conduct the ablation experiment to verify the effect of CNN-Text, which ensembles the voting and CNN modules. Table 6 shows the experiment results of CNN, Voting, and CNN-Text, from which we can see that CNN-Text utilizes the advantages of CNN and Voting, therefore achieving the best performance.
Effect of the number of subcolumns. We investigated the effect of subcolumn number η on the experimental results (precision, recall, F1-score). Figure 8 shows the results of ColNet and CNN-Text, which indicates that the performance of CNN-Text is better than ColNet under the same number of subcolumns. What is more, the scores of ColNet achieve the highest when η is set to 4, whereas CNN-Text performs best when it comes to 2. To maximize their performance, we set η of ColNet and CNN-Text to 2 and 4, respectively.
Case study. To prove the performance of CNN-Text, we select several examples from the Limaye dataset to analyze why text can improve the performance of CNN-Text. In the strict mode, there is only one truth value of the dataset, and there can only be one strict class “Book” in “file151614_2_cols_rows105.csv”. For Colnet, the highest predicted probability is “Work” (probability is 0.91), while the probability of the actual class “Book” is only 0.80, so Colnet will incorrectly predict the type as “Work”. While for CNN-Text, after introducing text features, the predicted probability of “Book” will increase from 0.80 to 1.00, which leads the detection model to output the correct classification result “Book”. The same goes for another file “file223755_0_cols1_rows27.csv”. Therefore, in the strict evaluation mode, the recall can be improved a lot, so as to the F1-score, and from the prediction probability of other classes, the text features we used do not affect the expression of the original model too much.
For Limaye, when evaluating CNN-Text, the prediction threshold ϵ is set to 0.5. As a result, in the two files in Table 7, although CNN-Text improves the prediction probability of the truth value under the strict mode, CNN-Text and ColNet can predict all the truth values, so the model prediction effect of the two models is similar under the tolerant mode. Similarly, to verify this phenomenon’s universality, we select other data for further analysis. In Table 8, we use bold text to indicate that the prediction value is accepted by exceeding the threshold ϵ of 0.5. Intuitively, CNN-Text and ColNet can classify almost all classes correctly under tolerant mode. But CNN-Text can identify the class “College” that ColNet cannot predict in “file101640_0_cols1_rows31.csv”, which also verifies that CNN-Text has a certain degree of improvement in tolerant mode.

6. Conclusions

We propose CNN-Text, a novel column-type prediction model based on CNN and voting. Compared with baseline methods, with little difference in time cost, however, CNN-Text can extract more meaningful textual information from the knowledge base as a piece of solid evidence for prediction, eliminating the prediction failure caused by insufficient information in the web table data. We evaluate CNN-Text on T2Dv2 and Limaye datasets in strict and tolerant modes. The evaluation results demonstrate that CNN-Text is well qualified for the column-type prediction task. Note that current dataset for column-type prediction is scarce, small and precious. We do not adopt the pretraining method as it will require a huge cost. In the future, we aim to find more valuable datasets to develop our model with the pretraining method.

Author Contributions

Conceptualization, C.Y.; data curation, H.Z. and S.J.; formal analysis, J.W.; funding acquisition, C.Y.; methodology, J.W.; project administration, C.Y.; resources, C.Y.; software, J.W., H.Z., and S.J.; supervision, C.Y.; validation, J.W., H.Z., and S.J.; writing—original draft, J.W.; writing—review & editing, C.Y. All authors have read and agreed to the published version of the manuscript.

Funding

This paper was partially supported by Natural Science Foundation of Zhejiang Province (No. LQ22F020032), National Natural Science Foundation of China (No. 62202132), and National Key Research and Development Program of China (No. 2022YFE0199300).

Data Availability Statement

Not applicable.

Conflicts of Interest

The authors declare no conflict of interest.

References

  1. Haneem, F.; Ali, R.; Kama, N.; Basri, S. Descriptive analysis and text analysis in systematic literature review: A review of master data management. In Proceedings of the 2017 International Conference on Research and Innovation in Information Systems (ICRIIS), Langkawi, Malaysia, 16–17 July 2017; pp. 1–6. [Google Scholar]
  2. White, R.W.; Dumais, S.T.; Teevan, J. Characterizing the influence of domain expertise on web search behavior. In Proceedings of the Second ACM International Conference on Web Search and Data Mining, Barcelona, Spain, 9–11 February 2009; pp. 132–141. [Google Scholar] [CrossRef]
  3. Fan, J.; Lu, M.; Ooi, B.C.; Tan, W.C.; Zhang, M. A hybrid machine-crowdsourcing system for matching web tables. In Proceedings of the 2014 IEEE 30th International Conference on Data Engineering, Chicago, IL, USA, 31 March–4 April 2014; pp. 976–987. [Google Scholar] [CrossRef] [Green Version]
  4. Tanon, T.P.; Weikum, G.; Suchanek, F.M. YAGO 4: A Reason-able Knowledge Base. In Proceedings of the ESWC, Crete, Greece, 31 May–4 June 2020; pp. 583–596. [Google Scholar] [CrossRef]
  5. Auer, S.; Bizer, C.; Kobilarov, G.; Lehmann, J.; Cyganiak, R.; Ives, Z. DBpedia: A Nucleus for a Web of Open Data. In Proceedings of the ISWC, Busan, Korea, 11–15 November 2007; pp. 722–735. [Google Scholar] [CrossRef] [Green Version]
  6. Bollacker, K.; Evans, C.; Paritosh, P.; Sturge, T.; Taylor, J. Freebase: A collaboratively created graph database for structuring human knowledge. In Proceedings of the 2008 ACM SIGMOD International Conference on Management of Data, Vancouver, BC, Canada, 10–12 June 2008; pp. 1247–1250. [Google Scholar] [CrossRef]
  7. Deng, X.; Sun, H.; Lees, A.; Wu, Y.; Yu, C. TURL: Table Understanding through Representation Learning. SIGMOD Rec. 2022, 51, 33–40. [Google Scholar] [CrossRef]
  8. Iida, H.; Thai, D.; Manjunatha, V.; Iyyer, M. TABBIE: Pretrained Representations of Tabular Data. In Proceedings of the 2021 Conference of the North American Chapter of the Association for Computational Linguistics: Human Language Technologies, Online, 6–11 June 2021; pp. 3446–3456. [Google Scholar] [CrossRef]
  9. Wang, D.; Shiralkar, P.; Lockard, C.; Huang, B.; Dong, X.L.; Jiang, M. TCN: Table Convolutional Network for Web Table Interpretation. In Proceedings of the Web Conference 2021, Virtual Event, Ljubljana, Slovenia, 19–23 April 2021; pp. 4020–4032. [Google Scholar] [CrossRef]
  10. Limaye, G.; Sarawagi, S.; Chakrabarti, S. Annotating and Searching Web Tables Using Entities, Types and Relationships. In Proceedings of the VLDB Endow, Singapore, 13–17 September 2010; Volume 3, pp. 1338–1347. [Google Scholar] [CrossRef] [Green Version]
  11. Suhara, Y.; Li, J.; Li, Y.; Zhang, D.; Demiralp, Ç.; Chen, C.; Tan, W.C. Annotating Columns with Pre-trained Language Models. In Proceedings of the 2022 International Conference on Management of Data, Charleston, SC, USA, 7–9 November 2022; pp. 1493–1503. [Google Scholar] [CrossRef]
  12. Chen, J.; Jiménez-Ruiz, E.; Horrocks, I.; Sutton, C. ColNet: Embedding the Semantics of Web Tables for Column Type Prediction. In Proceedings of the AAAI Conference on Artificial Intelligence, Honolulu, HI, USA, 27 January–1 February 2019; pp. 29–36. [Google Scholar] [CrossRef] [Green Version]
  13. Ritze, D.; Lehmberg, O.; Bizer, C. Matching HTML Tables to DBpedia. In Proceedings of the 5th International Conference on Web Intelligence, Mining and Semantics, Larnaca Cyprus, 13–15 July 2015; pp. 10:1–10:6. [Google Scholar] [CrossRef] [Green Version]
  14. Pramanick, A.; Bhattacharya, I. Joint Learning of Representations for Web-tables, Entities and Types using Graph Convolutional Network. In Proceedings of the 16th Conference of the European Chapter of the Association for Computational Linguistics: Main Volume, Online, 19–23 April 2021; pp. 1197–1206. [Google Scholar] [CrossRef]
  15. Takeoka, K.; Oyamada, M.; Nakadai, S.; Okadome, T. Meimei: An Efficient Probabilistic Approach for Semantically Annotating Tables. In Proceedings of the AAAI Conference on Artificial Intelligence, Honolulu, HI, USA, 27 January–1 February 2019; pp. 281–288. [Google Scholar] [CrossRef] [Green Version]
  16. Broder, A.Z.; Glassman, S.C.; Manasse, M.S.; Zweig, G. Syntactic Clustering of the Web. Comput. Netw. 1997, 29, 1157–1166. [Google Scholar] [CrossRef]
  17. Grauman, K.; Darrell, T. The Pyramid Match Kernel: Discriminative Classification with Sets of Image Features. In Proceedings of the Tenth IEEE International Conference on Computer Vision (ICCV’05), Beijing, China, 17–21 October 2005; pp. 1458–1465. [Google Scholar] [CrossRef] [Green Version]
  18. Blei, D.M.; Ng, A.Y.; Jordan, M.I. Latent Dirichlet Allocation. In Proceedings of the Advances in Neural Information Processing Systems 14, Vancouver, BC, Canada, 3–8 December 2001; pp. 601–608. [Google Scholar]
  19. Dumais, S.T.; Furnas, G.W.; Landauer, T.K.; Deerwester, S. Using latent semantic analysis to improve access to textual information. In Proceedings of the SIGCHI Conference on Human Factors in Computing Systems, Washington, DC, USA, 15–19 May 1988; pp. 281–285. [Google Scholar] [CrossRef]
  20. Adewumi, T.P.; Liwicki, F.; Liwicki, M. Word2Vec: Optimal hyperparameters and their impact on natural language processing downstream tasks. Open Comput. Sci. 2022, 12, 134–141. [Google Scholar] [CrossRef]
  21. Bhagavatula, C.S.; Noraset, T.; Downey, D. TabEL: Entity Linking in Web Tables. In Proceedings of the International Semantic Web Conference, Bethlehem, PA, USA, 11–15 October 2015; pp. 425–441. [Google Scholar] [CrossRef]
  22. Chu, X.; Morcos, J.; Ilyas, I.F.; Ouzzani, M.; Papotti, P.; Tang, N.; Ye, Y. KATARA: A Data Cleaning System Powered by Knowledge Bases and Crowdsourcing. In Proceedings of the 2015 ACM SIGMOD International Conference on Management of Data, Melbourne, VIC, Australia, 31 May–4 June 2015; pp. 1247–1261. [Google Scholar] [CrossRef]
  23. Efthymiou, V.; Hassanzadeh, O.; Rodriguez-Muro, M.; Christophides, V. Matching Web Tables with Knowledge Base Entities: From Entity Lookups to Entity Embeddings. In Proceedings of the International Semantic Web Conference, Vienna, Austria, 21–25 October 2017; pp. 260–277. [Google Scholar] [CrossRef]
  24. Chiche, A.; Yitagesu, B. Part of speech tagging: A systematic review of deep learning and machine learning approaches. J. Big Data 2022, 9, 10. [Google Scholar] [CrossRef]
  25. Samohi, A.; Mitelman, D.W.; Bar, K. Using Cross-Lingual Part of Speech Tagging for Partially Reconstructing the Classic Language Family Tree Model. In Proceedings of the 3rd Workshop on Computational Approaches to Historical Language Change, Dublin, Ireland, 26–27 May 2022; pp. 78–88. [Google Scholar] [CrossRef]
  26. Schmitt, X.; Kubler, S.; Robert, J.; Papadakis, M.; LeTraon, Y. A Replicable Comparison Study of NER Software: StanfordNLP, NLTK, OpenNLP, SpaCy, Gate. In Proceedings of the 2019 Sixth International Conference on Social Networks Analysis, Management and Security (SNAMS), Granada, Spain, 22–25 October 2019; pp. 338–343. [Google Scholar] [CrossRef]
  27. Mikolov, T.; Chen, K.; Corrado, G.; Dean, J. Efficient Estimation of Word Representations in Vector Space. arXiv 2013, arXiv:1301.3781. [Google Scholar]
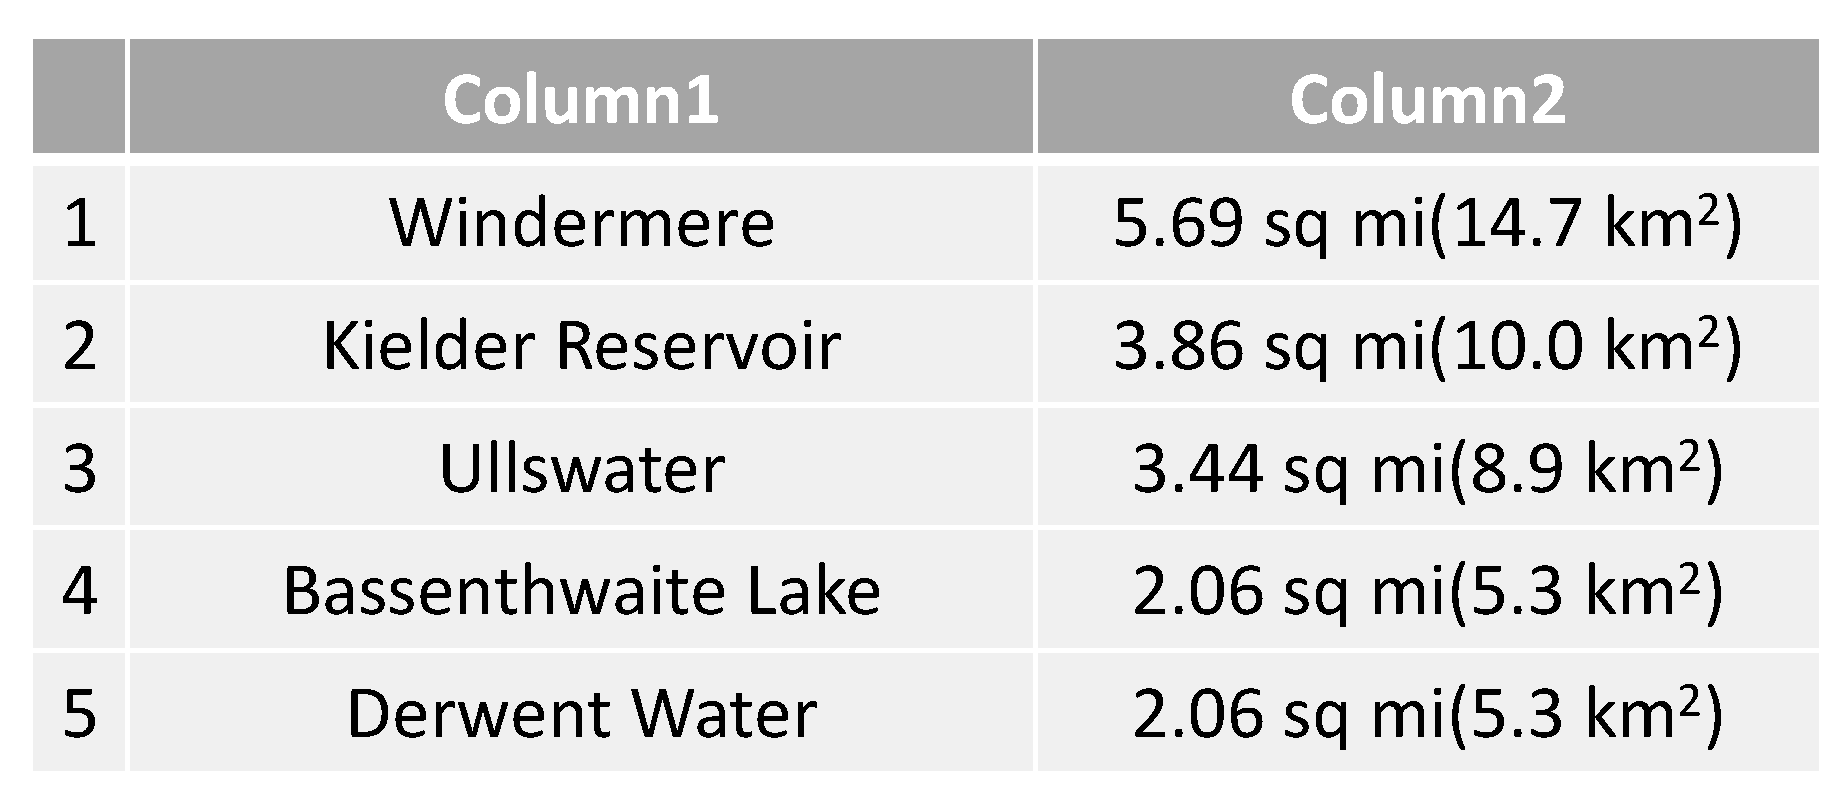
Figure 1. A web table example.
Mathematics 11 00560 g001
Figure 2. The architecture of CNN-Text.
Mathematics 11 00560 g002
Figure 3. The relationships between the classes and the entities in a KB.
Mathematics 11 00560 g003
Figure 4. (a) An example of table t. (b) Entity and class expansion for table t.
Mathematics 11 00560 g004
Figure 5. An illustration of synthetic columns.
Mathematics 11 00560 g005
Figure 6. The CNN architecture (for one specific candidate class prediciton).
Mathematics 11 00560 g006
Figure 7. Explanatory text for entities.
Mathematics 11 00560 g007
Figure 8. (a) The performance of ColNet in different η of sub-columns. (b) The performance of CNN-Text in different η of subcolumns.
Mathematics 11 00560 g008
Table 1. Dataset statistics.
Dataset# Column (Labeled)# Cell (Avg.)
T2Dv2411124
Limaye8423
Table 2. Performance comparison on T2Dv2.
Evaluation ModeMethodAll ColumnsPK Columns
PrecisionRecallF1PrecisionRecallF1
TolerantT2K Match0.6640.7730.7150.7380.8950.809
ColNet0.8860.8070.8470.9420.9060.924
CNN-Text0.8680.8290.8480.9230.9120.918
StrictT2K Match0.6240.7270.6710.7290.8840.799
ColNet0.7490.7570.7530.8530.8740.864
CNN-Text0.7430.7670.7540.8430.8830.863
Table 3. Performance comparison on Limaye.
Evaluation ModeMethodPK Columns
PrecisionRecallF1
TolerantT2K Match0.5600.4080.472
ColNet0.7960.7990.798
CNN-Text0.8110.7910.801
StrictT2K Match0.4530.3300.382
ColNet0.6030.6390.620
CNN-Text0.6070.6970.649
Table 4. Validation experiment results (precision, recall, F1-score) on T2Dv2.
Mode
Metric
Strict (All Columns)Tolerant (All Columns)Strict (PK Columns)Tolerant (PK Columns)
PrecisionRecallF1PrecisionRecallF1PrecisionRecallF1PrecisionRecallF1
(A)0.56790.03350.06320.46100.11300.18100.79310.05870.10941.00000.02700.0520
(B)0.50970.11420.18660.48510.24950.32950.79310.05870.10941.00000.02700.0520
(C)0.49520.11350.18460.49080.25160.33270.65550.19920.30561.00000.12300.2180
Table 5. Validation experiment results (precision, recall, F1-score) on Limaye.
Mode
Metric
StrictTolerant
PrecisionRecallF1PrecisionRecallF1
(A)0.14590.55330.23100.19800.80740.3180
(B)0.61860.49180.54790.70040.76640.7319
(C)0.56440.52050.54160.45610.78690.5774
Table 6. Ablation experiment results (precision, recall, and F1-score) on Limaye.
Evaluation ModeMethodPK Columns
PrecisionRecallF1
TolerantCNN0.7630.8200.791
Voting0.7320.6600.694
CNN-Text0.8110.7910.801
StrictCNN0.5760.6190.597
Voting0.5710.4470.501
CNN-Text0.6070.6970.649
Table 7. Partial example prediction probability table for Limaye in strict mode.
Filename(.csv)Truth ValuePredicte Result
TargetColNetCNN-Text
file151614_2_cols1_rows105BookPlace0.090.09
Architectural Structure0.090.09
Work0.910.91
Location0.100.10
Sport Facility0.080.08
Book0.81.00
Television Show0.310.31
Person0.160.16
Agent0.190.19
Film0.320.32
Organisation0.130.13
Written Work0.810.81
file223755_0_cols1_rows27FilmFile0.761.00
Musical Work0.280.28
Work0.990.99
Album0.180.18
Table 8. Partial example prediction probability table for Limaye in tolerant mode.
Filename(.csv)Truth ValuePredicte Result
TargetColNetCNN-Text
file101640_0_cols1_rows31University,
EducationalInstitution,
Agent,
Collage,
Organisation
Location0.150.15
College0.311.00
Agent0.920.92
Place0.140.14
Soccer Club0.030.03
City0.050.05
Populated Place0.030.03
Educational Institution0.950.95
Person0.050.05
Architectural Structure0.140.14
Building0.160.16
University0.941.00
Organisation0.920.92
file227142_1_cols1_rows7Work,
Software
Software0.970.97
Work0.960.96
Device0.410.41
Disclaimer/Publisher’s Note: The statements, opinions and data contained in all publications are solely those of the individual author(s) and contributor(s) and not of MDPI and/or the editor(s). MDPI and/or the editor(s) disclaim responsibility for any injury to people or property resulting from any ideas, methods, instructions or products referred to in the content.