Article

Single Earthquake Bond Pricing Framework with Double Trigger Parameters Based on Multi Regional Seismic Information

1
Doctoral Program of Mathematics, Faculty of Mathematics and Natural Science, Universitas Padjadjaran, Sumedang 45363, Indonesia
2
Department of Mathematics, Faculty of Mathematics and Natural Science, Universitas Padjadjaran, Sumedang 45363, Indonesia
3
Faculty of Science and Technology, Universiti Sains Islam Malaysia, Bandar Baru Nilai, Nilai 71800, Negeri Sembilan, Malaysia
*
Author to whom correspondence should be addressed.
Mathematics 2023, 11(3), 689; https://doi.org/10.3390/math11030689
Submission received: 16 December 2022 / Revised: 14 January 2023 / Accepted: 20 January 2023 / Published: 29 January 2023

Abstract

:
The investor interest in multi-regional earthquake bonds may drop because high-risk locations are less appealing to investors than low-risk ones. Furthermore, a single parameter (earthquake magnitude) cannot accurately express the severity due to an earthquake. Therefore, the aim of this research is to propose valuing a framework for single earthquake bonds (SEB) using a double parameter trigger type, namely magnitude and depth of earthquakes, based on zone division according to seismic information. The zone division stage is divided into two stages. The first stage is to divide the covered area based on regional administrative boundaries and clustering based on the earthquake disaster risk index (EDRI), and the second stage involves clustering based on magnitude and depth of earthquakes and distance between earthquake events using the K-Means and K-Medoids algorithms. The distribution of double parameter triggers is modeled using the Archimedean copula. The result obtained is that the price of SEB based on the clustering result of EDRI categories and K-Means is higher than the price obtained by clustering EDRI categories and K-Medoids with maturities of less than 5 years. The result of this research is expected to assist the Special Purpose Vehicle in determining the price of SEB.
MSC:
62P05; 62P12; 65C20; 91B70; 91G15; 91G30

1. Introduction

The use of catastrophe bonds for transferring risk to the capital market is increasing daily. Based on www.artemis.bm (accessed on 20 October 2022), the average number of catastrophe bonds issued from 1996 to October 2022 is 32. The number of Catastrophe Bonds issued annually from 1996 to October 2022 is presented in Figure 1.
Figure 1 shows that CAT bonds decreased significantly in 2008, by 54.84%. This value is the highest decrease in the period 1996 to October 2022. In 2021, the largest number of bonds issued compared to other years was 97. The increase in the number of bonds indicates that the risk transfer from insurance companies to the capital market is necessary to keep up with the increasing risk of losses due to natural disasters [1], especially earthquakes, which caused the highest economic losses and fatalities in the period 1989–2019 [2].
The CAT Bond is structured as a bond whose coupon payment and face amount depend on triggering events during the coverage period [3]. The investor will either lose all or a portion of the face amount and coupon if the triggering event takes place before maturity. Conversely, if no triggering event occurs, the face amount and coupon will be given to the investor. The determination of the price, the conducting of risk analyses, and the specifying of triggering events are the top three challenges in bond issuance [3,4,5]. The problems faced by bondholders are challenging, namely variations in the distribution of losses, which usually use the median loss and a high maximum loss. In actuality, losses are correlated with both financial risk (fluctuating interest rates) and the geographic characteristics of the covered area [1,3,5,6,7,8].
The model for determining the price of earthquake bonds based on the seismic conditions of an area has been carried out by previous researchers. Hoffer et al. [3] divide the resilience area into several zones according to the level of risk using peak ground acceleration (PGA). Next, determine the price of the earthquake bond with and without a coupon according to the zone obtained. Mistry et al. [5] proposed a price model for earthquake bonds based on the seismic conditions of an area (earthquake source models, earthquake recurrence relationships, and ground motion models). The results from earthquake sources are combined using tree logic with the same weight. They adopted a homogeneous Poisson process to describe the temporal occurrence of earthquakes within each source zone. Next, the calculation of the PGA from the earthquake source, which is used as the intensity of the earthquake parameter for predicting earthquake events as well as the calculation of losses based on the vulnerability model (fragility function and loss function). Goda et al. [9] created a tsunami bond trigger mechanism that uses an intensity index based on earthquake characteristics (i.e., magnitude and location) and tsunami height modeled using a regression equation. The results obtained show that the trigger mechanism can capture the uncertain conditions of the tsunami event.
Additionally, interest rates and coupons affect the price of earthquake bonds. For this reason, it is necessary to predict interest rates and coupons with a minimum amount of error. The prediction of interest rates and coupons in earthquake bond research using Vasicek [7] has the disadvantage that the prediction results can be negative [10,11]. The Cox–Ingersoll–Ross (CIR) [3,5,12,13,14,15,16] has the weakness of predicting interest rates or Coupons, which is unrealistic for pricing bonds due to the assumption of constant volatility, and cannot describe the jump due to monetary policy [17]; the autoregressive integrated moving average (ARIMA) [4,15] has the weakness that the prediction results can be negative.
Another factor that affects catastrophe bond prices is the trigger variable in the payout function. The type of trigger used can be a single trigger using the variable economic losses due to earthquakes [18,19,20,21,22,23], double triggers using the variable number of deaths and losses due to disaster [4,12,13], a single parametric trigger variable using an earthquake magnitude variable [7,14], a hybrid trigger using loss and earthquake magnitude [24], and a double variable trigger using the magnitude and depth of earthquakes [15]. In numerical simulations, it is necessary to select the data used. In addition, extreme events related to historical data can be observed using extreme value theory (EVT), in which methods used are the block maxima method (BMM) [7,14,15], and peaks over threshold [7,23,24].
Previous research gaps are discussed in this paragraph. The weakness of the model developed by Hofer et al. [3] is that earthquake bonds in high-risk zones are less attractive to investors than those in low-risk zones. For this reason, it is necessary to have a single bond price from several zones that has been decomposed based on the level of risk. Mistry et al. [5] produced a good overview of losses due to the earthquake catastrophe. However, when compared to the parametric type, a loss-based catastrophic bond with a loss trigger is vulnerable to a low level of transparency and a long loss calculation time [25]. As a result, the parametric trigger type can be used in modeling, despite the fact that it carries a basis risk that can be minimized by computing earthquake losses based on past data that corresponds to the threshold of magnitude and depth of earthquakes. The mechanism developed by Goda et al. [9] has well captured the uncertainties of the tsunami event. However, the parameters used do not consider the severity of the tsunami. The improved prediction of interest rates and coupons can be achieved using the fuzzy time series (FTS). This method was chosen because it is capable of overcoming negative prediction if the data are positive [26] and the requirement test does not fail [27]. A parametric single trigger using earthquake magnitude variables cannot describe losses due to earthquakes [28,29], therefore another variable is needed, namely earthquake depth [26,30], and A double parametric trigger using earthquake magnitude and earthquake depth has been used by Shao et al. [15], but they do not use a joint distribution clearly, hybrid triggers use variable losses, and earthquake strength is well developed by Wei et al. [24]. However, the trigger payout is contingent on one of the triggers exceeding the threshold exactly the first time it occurs. If the loss trigger occurs the first time it exceeds the threshold, it will take a long time for payment regulation. Another weakness of the method used in determining catastrophe bond prices is that the selection of historical data using BMM can eliminate extreme events in a period [13].
The framework of SEB consists of eight stages. The first stage is coverage area dividing, which is determined by seismic conditions. The stages carried out in the division of the coverage area consist of two stages. The first stage is to divide the coverage area according to the boundaries of the administrative area (province, district, or city) and cluster them using earthquake disaster risk index (EDRI) categories because it can represent the characteristics of natural disaster risk, namely hazards, vulnerability, and capacity [31,32]. The second stage is to determine the optimal cluster using the elbow method to avoid minimum local values in the calculation [33]; sub-regional clustering within each EDRI category clusters based on random variable average magnitude and depth of earthquakes, and average distance between earthquake events using the K-Means algorithm because it is efficient and simple [34]. However, the K-Means algorithm is not effectively used in global data clustering [35] with extreme values in the dataset [36]. The K-medoids algorithm is applied in the subregion in the EDRI categories cluster to reduce the sensitivity of the resulting partition.
The second stage of the earthquake bond valuing framework is to define the trigger mechanism for the face amount and coupon amount payoff functions. The third stage is to collect earthquake magnitude data from each grouped zone using the POT method, while the earthquake depth data adjusts the selected earthquake magnitude data. The fourth stage is modeling the distribution of earthquake magnitude data and earthquake depth. At this stage, there are two distribution models, namely GPD, which is used to calculate the expected coupon amount, and Archimedean copula (AC), which is used to calculate the expected face amount that will be obtained by investors.
The fifth stage is predicting the value of interest rates and coupon rates using the FTS. The sixth stage is to formulate the expected coupon amount and the expected interest rate model using the total probability concept and the Poisson process. The seventh stage is to formulate the expected face amount model using the total probability concept, and the final stage is to model the SEB price with coupons.
Based on the description above, there is no study discussed about a framework for valuing single earthquake bond prices based on multiregional seismic information that decomposes areas based on EDRI categories, earthquake parameters (magnitude and depth of earthquakes), and distance between events; parametric trigger types with parameters of magnitude and depth of earthquakes; and predicting interest and coupons using FTS.
The valuing framework for SEB is expected to assist the special purpose vehicle (SPV) in setting the price for these bonds. The proposed framework can be adopted for other catastrophe bonds (floods, droughts, tornadoes, and others). The numerical simulation provides a reference for the Indonesian government in issuing catastrophe bonds to seek new sources of funds for earthquake disaster management. On the investor side, it can be used as a material consideration for calculating coupon expectations and the face value obtained.
The structure of this paper is as follows: Section 2 contains a literature review related to the catastrophe bond pricing model that has been carried out by previous researchers. Section 3 contains a proposed valuing framework for SEB, including the methods and notations used in modeling. In addition, numerical simulations are used in Section 4 to show how the SEB pricing framework is applied. Section 5 contains a discussion regarding the pricing framework for earthquake catastrophe bonds based on numerical simulation results. Section 6 contains conclusions. Following that, we’ll add a Nomenclature to describe the symbols.

2. The Literature Review

Hurricane Andrew caused eleven insurance companies to go bankrupt due to a lack of reserves to meet claims. Under these conditions, a catastrophe bond was developed in the mid-1990s [37]. Improvements to the catastrophe bond pricing model are carried out continuously. The research related to the catastrophe bond pricing model will be explained in this section. Burnecki and Kukla [18] calculated the price of non-arbitrated bonds without and with coupons using a doubly stochastic Poisson compound and perform simulations using 10 years of disaster loss data sourced from the property claim service (PCS). Ma and Ma [19] introduced catastrophe bond pricing using stochastic interest rates and a compound nonhomogeneous Poisson process to model losses. They use loss data from 1985 to 2010 to simulate the developed model. Futher, Ma and Ma [20] calculated the price of non-arbitrage catastrophic bonds without coupons using the doubly stochastic Poisson point process to model the total losses due to disasters, extreme value theory (EVT) to model the losses due to catastrophes, and hull white to model stochastic interest rates.
Vakili et al. [38] developed a bond price model under conditions of uncertainty using a linear membership function, a lognormal distribution to model claims, and linear programming to obtain the optimal CAT bond price, which can facilitate the benefits of sponsors and investors. The simulation uses insurance data from Sweden for the period 1958–1969. Riza et al. [4] developed a multiperiod catastrophe bond pricing model using multiple triggers, a nonhomogeneous Poisson process to model losses and fatalities, and ARIMA to predict interest rates and coupons. The simulation data used is disaster loss data for the United States (US) for the period 2012–2021. Marvi and Linders [39] developed a catastrophe bond price model by decomposing disaster hazard risk, namely disaster intensity calculated based on flood depth. The simulation uses the Monte Carlo method by generating 1000 years of disaster loss data. The model developed is the price of a single earthquake disaster bond based on the results of regional decomposition based on the risk caused by a flood disaster. Chao [12] menggunakan CIR untuk memodelkan tingkat bunga dan kopula untuk memodelkan distribusi ketergantungan pada intensitas bencana dan kematian untuk menentukan harga obligasi bencana. The simulation data used are Chinese data on severity and mortality from 2000 to 2016.
Deng et al. [21] calculate the price of drought catastrophe bonds using the generalized extreme value (GEV) to model disaster losses and the Poisson process to calculate total losses, and the loss data used is disaster loss data in Vietnam, Zimbabwe, Bolivia, China, Thailand, India, Brazil, the Philippines, Italy, Mexico, Ethiopia, Spain, Russia, Mauritania, Peru, Canada, Namibia, Argentina, South Africa, the US, and Australia in the period 1968 to 2018. Chao and Zhou [13] calculated catastrophe bond prices using stochastic interest rates modeled using CIR, the POT method to obtain extreme data on losses and deaths, the Archimedean copula to model the dependent distribution of losses and deaths, and data on losses and deaths due to flooding since 1985 obtained from Darmouth College. Liu et al. [22] determined the price of catastrophe bonds using a credit risk model to model interest rates, and GEV modeled disaster losses, using data on disaster losses in the US in the period 1985–2011. Shao et al. [40] proposed a catastrophe bond pricing formulation based on stochastic interest rates modeled using CIR and total losses derived from the Poisson process and semi-Markov processes, using catastrophic loss data from 1985 to 2013. Zhao and Yu [41] use multiple regression analysis based on the cat bond spread and the reinsurance index to forecast the losses that catastrophic bond holders will incur. Hoffer et al. [42] developed disaster bond prices based on uncertainty parameters using a lognormal distribution to model losses and a Poisson process to model the daily intensity of disasters, using data on disaster losses in the US in the period 1990–1999.
Additionally, research focused on catastrophic bonds is by Zimbidis et al. [14], which models single and multi-period earthquake catastrophe bond prices in Greece. The methods used are the log-normal distribution to model interest rates; Cox–Ingersoll–Ross (CIR) to model coupons based on annual EURIBOR; generalized extreme value (GEV) to model the annual maximum magnitude of earthquakes based on historical seismic data in Greece; maximum likelihood estimation (MLE); and the FORTRAN MLEGEV subroutine to estimate the parameters of the GEV distribution. Tang and Yuan [7] developed a coupon pricing model for multi-period earthquake catastrophe bonds based on a pricing measure combined with a distorted probability function. The method used in developing the model is the Poisson process to determine the number of disaster events at time t; GEV and Generalized Pareto Distribution (GPD) are used to model the maximum annual loss caused by earthquakes; MLE and R functions to estimate parameters on GEV and GPD; Vasicek to model risk-free interest and coupons; and Wang’s transformation to model the pricing of premium catastrophe bonds. The trigger type used is “modeled loss,” which is modeled using a multiple Poisson process based on frequency and severity. However, the probability measure is distorted based on severity alone.
Shao et al. [15] developed a Cox & Pederson [43] catastrophe bond pricing model and linked it to single and multi-period earthquake disasters. The model used in the payment function is the piecewise linear function; the method used in modeling interest rates and inflation is the ARIMA; the CIR is used for modeling coupons; the BMM is used to determine the maximum annual earthquake magnitude; the GEV is used to model the magnitude distribution of annual earthquake magnitudes; and the Gamma distribution is used to model the depth of an earthquake. The type of trigger used is of the parametric type, namely the magnitude and depth of the earthquake, and the data use the earthquake event in California. Gunardi and Setiawan [16] developed single- and multi-period earthquake bond models for Indonesia. The model used in the payment function is a piecewise linear function. The methods used are CIR to model coupons, the BMM to determine the maximum annual earthquake magnitude, and GEV to model the magnitude distribution of annual earthquake magnitudes.
Hoffer et al. [3] proposed the design of earthquake catastrophe bonds based on the spatial distribution of the portfolio by considering the combined asset portfolio consisting of residences in Italy. He simplified the analysis by considering the PGA value for each particular municipality. Furthermore, economic loss was calculated based on a single replacement cost value for all assets. CIR was used to model interest rates and the Poisson process to model the distribution of losses. Mistry et al. [5] proposed the design of earthquake bonds based on the earthquake hazard model by considering the regional source model and the PGA. The modeling of statistical interest rates uses CIR, while modeling total losses due to earthquakes uses the compound Poisson process. Goda et al. [9] created a tsunami disaster bond trigger mechanism that uses an intensity index based on earthquake characteristics (i.e., magnitude and location) and tsunami height modeled using a regression equation. The results obtained show that the trigger mechanism can capture the uncertain conditions of a tsunami event.

3. Framework for Single Earthquake Bond Pricing

Single earthquake bond (SEB) pricing for multiple periods is intended to protect against loss exposure based on seismic conditions and the level of disaster risk. Magnitude and depth of earthquakes are chosen as trigger indicators for the face value payment function. The principle of face amount is paid at maturity T, coupon C t is paid annually at time t = 1 , 2 , , T , and the amount is according to the triggering event. The coupon rate is denoted by C t . For example, ( Ω , F , 𝕡 ) is defined as a probability space, where Ω is the sample space, F is the σ -algebra on the Ω subset, and 𝕡 is the probability measure [17]. The triggering event sample space is Ω = ( Ω 1 × Ω 2 ) . Therefore, the elements of the sample space for the full model are defined in Equation (1).
ω = ( ω 1 , ω 2 )   with   ω 1 Ω 1 , ω 2 Ω 2
ω 1 is the sample space of the earthquake depth and earthquake magnitude, ω 2 is the sample space of the coupon rate and interest rate. The probability in the sample space Ω is the product of structures. Therefore, the probability ω = ( ω 1 , ω 2 ) is defined in Equation (2) as follows:
𝕡 ( ω ) = 𝕡 1 ω 1 𝕡 2 ( ω 2 )
The assumptions in Equation (2) state the dependence between events that only depend on the financial risk variable and the disaster risk variable.

3.1. Division of Coverage Area Based on Regional Seismic Information

Assume the area of coverage W consists of a subregion (e.g., province, district/city) W i , i = 1 , 2 , , I where the W i will be clustering based on EDRI categories, earthquake magnitude, and the distance between earthquake occurence. The stages of clustering are as follows:
(1)
Clustering subregions that have the same EDRI categories (1 = low, 2 = medium, and 3 = high). The notation for clustering results is W E i , E = 1 , 2 , 3 , i = 1 , 2 , 3 I .
(2)
Clustering subregions for each member of the W E using the K-Means and K-Medoid algorithms. The random variables used in clustering are the average magnitude and depth of earthquakes, and the average distance between earthquake occurrences within each subregion on W E . The results of clustering are specific areas with assumptions: z = 1 Z z = , z = 1 Z z = W , P z > 0 , z = { W i E z | i = 1 , 2 , , I , E = 1 , 2 , 3 , z = 1 , 2 , , Z } .
The end result of dividing the coverage area is denoted by z , where z = 1 , 2 , Z , and they will be arranged from the zones from the lowest risk to the highest risk..The following will describe STDM distances, the Elbow method, the K-Means algorithm, and the K-Medoids algorithm.

3.1.1. The Distance between Earthquake Occurrences

The distance between earthquake occurrences is determined using the shortest distance principle, namely space, time, depth, and magnitude (STDM), which is denoted by ( η i j ) and is formulated in Equation (3) as follows:
η i j = c τ i j r i j k 1 ε i 10 b m i m 0 2 τ i j 0 τ i j < 0
The value of η i j will be small if the occurrence of the j-th earthquake is greater than the i-th earthquake, while it will be greater if the i-th and j-th earthquakes have a weak relationship.
The notation used in Equation (3): c is a constant; τ i j is the time difference between two earthquake events ( τ i j = t j t i ) ; r i j is the haversine distance between two earthquake events (full detail see [44]), b is Gutenberg Richer parameter (full detail see [45,46]), k is fractal ( k = 3 b c , c 1.5 [47], ε i and m i are the depth and magnitude of the i-th earthquake, while m 0 is the threshold value of the observed earthquake magnitude. By providing ( l o g 10 ) on both sides of Equation (3), the result is formulated in Equation (4).
l o g 10 η i j = b m i m 0 2 + l o g 10 c + l o g 10 τ i j + k l o g 10 r i j l o g 10 ε i
If it is assumed that the value of c is 1, then the rescale results of the time, distance, and depth components are denoted in Equation (5) as follows:
T i j = τ i j 10 b m i m 0 2 , R i j = r i j k 10 b m i m 0 2 , E i = ε i 10 b m i m 0 2
So that Equation (4) becomes Equation (6) as follows:
log 10 η i j = log 10 T i j + log 10 R i j log 10 E i τ i j 0 τ i j < 0
Equations (4)–(6) define the empirical relationship from the shortest distance η , to the joint distribution of T, R, and E [30].

3.1.2. Elbow Method

The validity of the number of clusters in this study uses the Elbow method. The calculation principle in this method is to use the square of the distance between the data in each cluster center to find an optimal number of clusters, and the performance indicator uses the Sum of Squared Error (SSE) [33]. The calculation of the optimal number of W E using RStudio, and the pseudo code of algorithm to count SSE are presented in Algorithm 1:
Algorithm 1. Pseudo code of SSE
  Input: data_seismic = datasets.load_data(), X = data_seismic
  Output:  S p , p  
(1)
S p = [   ]
(2)
for p = 1 , p in a range P  do
(3)
S ( p ) = p = 1 P d i s t x i j , v p 2 ;
(4)
Return S p , p ;
Where p is the number of clusters, v p is the cluster center on cluster p, p = 1 , 2 , , P , and SSE is denoted S p , d i s t x , v p 2 is the distance of x i j ( i = 1 , 2 , , I , j = 1 , 2 , , J ) to the center of cluster p   ( v p ) . The data set used in this study is the average earthquake magnitude, earthquake depth, and STDM distance in the z . The value of p can be determined by plotting the K-SSE curve and finding the points that make up the angle. An illustration is given in Figure 2.
Figure 2 shows that the optimal number of clusters is two. Since there are actually that many groups in the data, the first clusters are supposed to add a lot of information (explain a lot of variation), making them necessary. However, once the number of clusters exceeds the number of groups in the data, the added information will sharply reduce because it is just subdividing the actual groups. In the event that this occurs, the curve of variation vs. clusters will show an elbow shape: increasing quickly up to p (under-fitting region), and then increasing slowly after p (over-fitting region) [33].

3.1.3. K-Means Algorithm

Clustering is the process of classifying several datasets into clusters with similar characteristics [48]. One efficient and simple clustering technique is the K-Means algorithm [49], which searches for cluster centers iteratively based on the distance of each data point to the cluster center [50]. The calculations on the K-Means method in this study were conducted with the help of RStudio. The pseudo code in the K-means method is presented in Algorithm 2.
Algorithm 2. Pseudo code of K-Means Algorithm
   Input: data_seismic = datasets.load_data(), X = data_seismic, P * = optimal number of clusters
   Output: v p , x i j p  
(1)
Initialization center cluster  v p , p = P * ,
(2)
for p = P *  
   for i = 1 , i in a range ( 1,3 )  
     for j = 1 , j in a range ( 1 , 2 , , J )
        d i j = i = 1 3 x i j v p 2
(3)
for j = 1 , j in a range ( 1 , 2 , , J )  do
       x i j p = a r g m i n x i j d i j
(4)
for p = 1 , p in a range ( 1 , P )
   for i = 1 , i in a range ( 1,3 )  do
      v p = 1 n p j = 1 n p x i j p
(5)
Repeat step 2 to 4, until no more members from the cluster center move
The notation in Algorithm 2 is that the optimal number of clusters is denoted P * ; the number of random variables is denoted I ,   J is the number of data; the distance x i j to the center of cluster v p is denoted by d i j ; the data x i j that is a member of the p-cluster is denoted x i j p ; the p-cluster center for the i-variable is denoted v i p , and the number of x i j in the p-group is denoted n p .

3.1.4. K-Medoids Algorithm

The calculation process in the K-medoids algorithm is almost similar to K-Means. However using medoids as a center point [36]. The pseudo code of the K-Medoids algorithm is presented in Algorithm 3.
Algorithm 3. Pseudo code K-medoids algorithm
   Input: data_seismic = datasets.load_data(), X = data_seismic, P * = optimal number of clusters
   Output:  m p , x i j p
(1)
Initialization medoids  m p , p = P * ,
(2)
for p = P *  
   for i = 1 , i in a range ( 1,3 )  
     for j = 1 , j in a range ( 1 , 2 , , J )
        d i j = i = 1 3 x i j m p 2  
(3)
for j = 1 , j in a range ( 1 , 2 , , J )  do
       x i j p = a r g m i n x i j d i j  
(4)
for p = P
   for i = 1 , i in a range ( 1,3 )  
     for j = 1 , j in a range ( 1 , 2 , , J )
          c p = p = 1 P i = 1 3 j = 1 J x i j p m p 2
(5)
Repeat step 1 and 2 alternatively
(6)
Select the medoids with the lowest c p
Algorithm 3 uses the same notation as Algorithm 2 for i , j , P * , x i j , x i j p , and d i j ; the medoids of cluster p are the denoted m p , and the cost of cluster p is denoted c p .
In the hereafter, the division of coverage areas using the EDRI and K-Means algorithms is referred to as “cluster type I”, while the division of coverage areas using EDRI and K-Medoids is referred to as “cluster type II”.

3.2. The Earthquake Bond Trigger Mechanism

The payoff function of SEB face amount can be defined as the operator S ( F ) , which is defined in Equation (7).
S ( F V ) = F V M < 5   a n d   D > 0 f 1 F V M 5 , 6   a n d   D 300 f 2 F V f 3 F V f 4 F V f 5 F V f 6 F V f 7 F V f 8 F V f 9 F V 0 M 5 , 6   a n d   D [ 70 , 300 ) M 5 , 6   a n d   D ( 0 , 70 ) M 6 , 7   a n d   D 300 M 6 , 7   a n d   D [ 70 , 300 ) M 6 , 7   a n d   D ( 0 , 70 ) M 7 , 8   a n d   D 300 M 7 , 8   a n d   D [ 70 , 300 ) M 7 , 8   a n d   D ( 0 , 70 ) M 8   a n d   D > 0
The magnitude and depth of an earthquake event in the zone are denoted by M and D , respectively, and the face amount of SEB is denoted by F V . The proportion of F V denoted f i , i = 1 , 2 , 3 , , 9 in Equation (7) is defined in Equation (8).
f 9 < f 8 < f 7 < f 6 < f 5 < f 4 < f 3 < f 2 < f 1
where the magnitude of f i , i = 1 , 2 , 3 , 9 satisfies f i 1 . The description of Equation (7) is as follows:
(1)
The maturity time of the SEB is T.
(2)
M = max ( M z ) , z = 1 , 2 , , Z , where M represents the largest earthquake that has occurred within each zone at time t , while D is the earthquake depth, which corresponds to M.
(3)
If M < 5   a n d   D [ 0 , ) in [0, T], then the bondholders will receive all the face amount of SEB (FV) at maturity.
(4)
If M 5 , 6   a n d   D 300 , then the bondholder will receive f 1 F V at maturity.
(5)
If M 5 , 6   a n d   D [ 70 , 300 ) , then the bondholder will receive f 2 F V at maturity.
(6)
If M 5 , 6   a n d   D ( 0 , 70 ) , then the bondholder will receive f 3 F V at maturity.
(7)
If M 6 , 7   a n d   D 300 , then the bondholder will receive f 4 F V at maturity.
(8)
If M 6 , 7   a n d   D [ 70 , 300 ) , then the bondholder will receive f 5 F V at maturity.
(9)
If M 6 , 7   a n d   D ( 0 , 70 ) , then the bondholder will receive f 6 F V at maturity.
(10)
If M 7 , 8   a n d   D 300 , then the bondholder will receive f 7 F V at maturity.
(11)
If M 7 , 8   a n d   D [ 70 , 300 ) , then the bondholder will receive f 8 F V at maturity.
(12)
If M 7 , 8   a n d   D ( 0 , 70 ) , then the bondholder will receive f 9 F V at maturity.
(13)
If M 8   a n d   D > 0 , the bondholder loses all the face amount of the cat bond at maturity.
(14)
The value of F V is constant.
The determination of face amount payoff in Equation (7) is based on the Ritcher Scale of earthquakes, which is presented in Table 1, while depth is based on shallow earthquake categories (less than 70 km), medium earthquakes (70–300 km), and deep earthquakes (more than 300 km).
The payoff function of coupon amount is defined in Equation (9) as follows:
Y C , F V t = C t × F V M < m T q 0 M m T q
In Equation (9), the coupon amount is paid at time t , which is denoted Y C , F V t , which depends on the magnitude of the earthquake that occurs at time t ( t = 1 , 2 , , T ) . Where m has the same notation as the payoff function, “face amount”. C t is the coupon amount determined by the SPV at year t , and F V is the cash value. The threshold calculation uses the return level of earthquake events in the past 1000 years from the earthquake magnitude distribution of each zone. The m T q is the earthquake magnitude threshold, which is the maximum of m T q z at period T q ( m T q = m a x ( m T q z ) where m T q z is the maximum earthquake exceed in the observation at period T q in z .

3.3. Selection of Earthquake Magnitude and Earthquake Data

The “peaks over threshold” (POT) method is used to select an earthquake’s magnitude and depth. For example, { M 1 z , M 2 z , , M N z } are the set of independent and identically random variables representing the earthquake magnitude in zone z . All of the extreme earthquake magnitudes included in this investigation have a magnitude higher than the threshold. This method of selection is known as the POT method.
The selection of the earthquake data corresponds to the selected magnitude data. Suppose M 1 z * , M 2 z * , , M N z * are magnitude data that exceeds the threshold, then the depth of an earthquake is denoted D 1 z * , D 2 z * , , D N Z * . The pair of random variables (earthquake magnitude and earthquake magnitude) that are used as observations are denoted ( M z * , D z * ) , The cumulative distribution function of M n z , n = 1 , 2 , , N , z = 1 , 2 , , Z is denoted F ( M z * ) , and the dependences cumulative distribution function of ( M z * , D z * ) is denoted F ( M z * , D z * ) .

3.4. Earthquake Distribution Model for Magnitude and Depth

The distribution models that were used were GPD and Copula Archimedean (AC).

3.4.1. Generalized Pareto Distribution

The data obtained using the POT method can be approximated using the generalized Pareto distribution (GPD) [24,51]. The distribution of the cumulative function (CDF) is defined in Equation (10), as follows:
F M z * κ z , ξ z , σ z = 1 1 + κ z m z * ξ z σ z 1 κ κ 0 1 e m z * ξ z σ z κ = 0
where ξ z is the location parameter in zone z , σ z is the scale parameter in zone z , κ z is the shape parameter in zone z , for κ z > 0   ( m z * ξ z ) , κ z < 0 ( ξ z m z * < ξ z σ z κ z ) [52]. The parameter estimation of GPD distribution using EasyFit software. For special cases, κ z > 0 , ξ z = σ z κ z , α z = 1 κ z , the GPD is equivalent to the Pareto distribution (for the CDF, see [53]).
The return level m T q z is the maximum earthquake magnitude exceeded at t periods t in z , which is obtained from solving the following Equation (11) [54].
Pr ( M > m T q z ) = 1 T q z
The solution of Equation (1) for κ z 0 is defined in Equation (12).
m T q z = σ ^ z κ ^ z 1 T q z κ ^ z 1 + ξ ^ z , κ z 0

3.4.2. Copula

The joint distribution of M z * and D z * is modeled using the copula concept, and the cumulative marginal distribution is denoted by F M and F D . Based on Sklar’s theorem (1959) [55], the joint distribution of F ( M z * ) and F ( D z * ) is denoted in Equation (13) as follows:
F ( M z * , D z * ) = C ( M z * , D z * ) ( F ( M z * ) , F ( D z * ) )
where C ( M z * , D z * ) : 0 , 1 0 , 1 [ 0 , 1 ] and meet the following properties:
(1)
m z * , d z * 0 , 1 , C m z * , 0 = 0 , C m z * , 1 = m z * , C 0 , d z * = 0 dan C 1 , d z * = d z *
(2)
m 1 z * , m 2 z * , d 1 z * , d 2 z * [ 0 , 1 ] with m 1 z * m 2 z * and d 1 z * d 2 z * , C m 2 z * , d 2 z * C m 2 z * , d 1 z * C m 1 z * , d 2 z * + C m 1 z * , d 1 z * 0
In this study, the copula family used was the Archimedean copula, namely Clayton, Frank, and Gumbel. Each generator function of the copula class is presented in Table 2.
Where D 1 θ z is the Debye function [56,57], the parameter of AC is denoted θ z , kendal correlation is denoted τ z . The selection of the suitable copula class is based on the smallest AIC value [51], which is calculated using the following Equation (14):
A I C = 2 ln ( l ( θ z | ( m z * , d z * ) + 2
where l ( θ z | m z , d z , z = 1 , 2 , , Z is the likelihood function of a copula in zone z , and θ z is the AC parameter in zone z .

3.5. Predict Interest Rates and Coupon Rates

Predict the interest rate and coupon rate at t = 1 , 2 , , T using Singh’s fuzzy time series (FTSS). The steps in FTSS [58] are as follows:
(1)
Defines the universe set ( U ) based on the observed time series data intervals, with the rule U = [ B m i n B 1 , B m a x B 2 ] , B 1 and B 2 are two positive numbers.
(2)
Partition the universe set U into intervals u 1 , u 2 , , u m . Meanwhile, the number of intervals will be equal to the number of linguistic variables ( A 1 , A 2 , , A m ) .
(3)
Construct the fuzzy set A i associated with the intervals in Step 2 and apply the triangular membership function rules for each interval in each built fuzzy set.
(4)
Defuzzification of the observed data and form fuzzy logical relationships (FLR) using the rule: If A i is fuzzy production in year n and A j is fuzzy production in year n + 1 , then FLR is denoted as A i A j . At this stage, A i is called the current state, and A j is the next state.
(5)
Forecasting
The notation used in forecasting is as follows: [ A j * ] corresponds to the u j the interval for membership in the supremum of A j , L A j * is the lower limit of the u j ; U A j * is the upper limit of the u j ; l [ A j * ] is the length of the u j ; M A j * is the middle value of the u j the interval which has a supremum value in A j .
The notation for FLR A i A j , A i is the fuzzified interest rate or coupon rate in the n -th year, A j is the fuzzified interest or coupon rate in year n + 1, O i is the actual interest or coupon rate in year n, O i 1 is the actual interest or coupon rate in year n − 1, O i 2 is the actual interest or coupon rate in year n − 2, F j is the result of forecasting. Forecasting in this method uses 3 observational data in years n − 2, n − 1, n to implement FLR A i A j . The rules used in FTSS forecasting [59] are presented in Algorithm 4.
Algorithm 4. Rules of forecasting
f o r   k = 3   t o . K (End of time series data)
  Obtained FLR for year k to k + 1
   A i A j
  Compute
   B i = O i O i 1 O i 1 O i 2  
   X i = O i + B i 2  
   X X i = O i B i 2  
   Y i = O i + B i  
   Y Y i = O i B i  
   P i = O i + B i 4  
   P i i = O i B i 4  
   Q i = O i + 2 B i  
   Q i i = O i 2 B i  
   G i = O i + B 6  
   G G i = O i B i 6  
   H i = O i + 3 B i  
   H H i = O i 3 B i
Initialization R = 0 and S = 0
If X i L [ A j * ] and X i U [ A j * ]
   Then R = R + X i and S = S + 1
If X X i L [ A j * ] and X X i U [ A j * ]
   Then R = R + X X i and S = S + 1
If Y i L [ A j * ] and Y i U [ A j * ]
   Then R = R + Y i and S = S + 1
If Y Y i L [ A j * ] and Y Y i U [ A j * ]
   Then R = R + Y Y i and S = S + 1
If P i L [ A j * ] and P i U [ A j * ]
   Then R = R + P i and S = S + 1
If P i i L [ A j * ] and P i i U [ A j * ]
   Then R = R + P i i and S = S + 1
If Q i L [ A j * ] and Q i U [ A j * ]
   Then R = R + Q i and S = S + 1
If Q i i L [ A j * ] and Q i i U [ A j * ]
   Then R = R + Q i i and S = S + 1
If G i L [ A j * ] and G i U [ A j * ]
   Then R = R + G i and S = S + 1
If G i i L [ A j * ] and G i i U [ A j * ]
   Then R = R + G i i and S = S + 1
If H i L [ A j * ] and H i U [ A j * ]
   Then R = R + H i and S = S + 1
If H i i L [ A j * ] and H i i U [ A j * ]
   Then R = R + H i i and S = S + 1
F j = R + M A j * S + 1
next k
The calculation of interest rate predictions and coupon predictions using the RStudio application. The result prediction of interest rate value at time t is denoted r ^ t , and the result prediction of coupon rate at time t is denoted c ^ t .

3.6. Modeling the Calculation of the Expected Coupon Amount, the Expected Interest Rate Values, and the Expected Face Amount

In principle, the calculation of bond prices calculates the present value of the sum of the cash and coupon values. Due to the value of the cash and coupon values received by investors depends on the probability of a triggering event, the cash and coupon values are calculated based on the probability of a triggering event using the expectation concept.
Earthquakes that occur in each z are divided into two types, namely Type 1 ( m z m T q z ) and Type 2 ( m z < m T q z ). If G z is a random variable that represents the occurrence of an earthquake in zone z , and ( E i | G z ) is the earthquake type i event given the earthquake event occurs in z , then the total probability of E i (see Zangeneh and Little [60]) defined in Equation (15).
P E i = z z P G z P ( E i | G z )
The total probability that an earthquake of type i will occur is denoted P ( E i ) , the probability that an earthquake will occur in a zone z is denoted P ( G z ) , and the conditional probability of E i given G z denoted P ( E i | G z ) .
The assumed number of earthquakes that occur in W is the poisson process { N t , t 0 } , which has a rate λ > 0 . If the number of earthquakes occurs in any interval t with a process poisson with a rate λ t , then the probability of the number of earthquake occuring is ( s , s + t ) , as defined in Equation (16).
P N z t + s N z s = n = e λ z t λ z t n n ! , n = 0 , 1 ,
If N t = N 1 t + N 2 ( t ) , then both N 1 t   a n d   N 2 ( t ) are poisson processes with rates λ t P ( E 1 ) and λ t 1 P E 1 , respectively [61], where P E 2 = 1 P E 1 .
Assuming that an earthquake of type 1 occurs for the first time in w is denoted T 1 , an “earthquake evet” ( T 1 > t ) means that there was no earthquake type I at the time interval ( 0 , t ) . The probability calculation is formulated in Equation (17).
P T 1 > t = e λ t P E 1
Figure 3 shows scenarios for SEB coupon payments with the time maturity T .
Coupon C t . t = 1 , 2 , , T will be paid if the triggering event does not occur at the interval ( s , s + 1 ) . If earthquakes of type 1 occur exactly once each interval ( 0 , 1 ) and one occurs at each interval ( s , s + 1 ) , then the time distribution is defined as follow:
P T 1 > s N 1 t = 1 = P 0   e v e n t   i n   0 , s , 1   e v e n t   i n   s , s + 1 , 0   e v e n t   i n   s + 1 , t P ( N 1 t = 1 ) = P N 1 s = 1 P N 1 s + 1 N 1 s = 1 P ( N 1 t N 1 s + 1 = 0 ) P ( N 1 t = 1 ) = e λ s P E 1 λ e λ P E 1 | e λ t s + 1 P E 1 e λ t P E 1 λ t = e λ s λ e λ e λ t e λ s e λ e λ t λ t = 1 t
However, the earthquake of type 1 may occurs for the first time at 0 , 1 , 1 , 2 , 2 , 3 , ( T 1 , T ) , and bondholders will receive a coupon if the earthquake of type I does not occur at ( s , s + 1 ) . Assume SEB pays the coupon at intermediate ( 0 , T + 1 ) . So, the time distribution of coupon payments is defined in Equation (18).
P T 1 > s N 1 T + 1 = 1 = 1 T + 1
Based on Equations (17) and (18), the expectation of the coupon amount model is defined in Equation (19)
E Q C = t = 1 T 1 T + 1 A ( C t ) P ( T 1 > t )
where A C t = t = 1 T c ^ t . By adopting Equation (19), the expected interest rate calculation model is defined in Equation (20).
E Q R = t = 1 T 1 T + 1 A ( R t ) P ( T 1 > t )

3.7. Modeling the Calculation of the Expected Face Amount of SEB

Assuming Q i is an earthquake catastrophe type i in Equation (7) where i = 1 , 2 , , 11 , If G z is a random variable that represents the occurrence of an earthquake in zone z . the total probability of Q i is defined in Equation (21).
P Q i = z = 1 Z P G z P ( Q i | G z )
The total probability of an earthquake of type i occurring is denoted P ( Q i ) , the probability of an earthquake occurring in a zone z is denoted P ( G z ) , the conditional probability Q i given G z is denoted P ( Q i | G z ) , where P Q i G z = F ( M z * , D z * ) .
E Q 1 ( F V ) = i = 1 11 S F V i z = 1 Z P G z P ( Q i | G z )

3.8. Single Earthquake Bond Pricing Model

In this section, we construct a model for determining the price of SEB with double trigger parameters based on multi-regional seismic information (EDRI category, earthquake magnitude, earthquake depth, and difference between earthquake events). The following is the notation used in the model.
T : maturity tyme.
F V : face amount of SEB.
A ( R t ) : the accumulation of the possible interest rate at time t.
e p : the extra premium to bear the risk of earthquakes (positive value).
A ( C t ) : the accumulation of possible coupons amounts that the bondholders will obtain at time t . The value of the coupon rate at time t is predicted using the FTSS.
S ( F V ) : face amount of the SEB payoff function defined in Equation (7).
P S E B : SEB price.
E Q 1 ( F V ) : the expectation of the SEB face amount.
E Q C : the expectation of the SEB coupon amount.
E Q R : the expectation of interest rate value.
The model for determining the SEB price is presented in Equation (23):
P S E B = e E Q R + e p E Q 1 F V + E Q C
Based on Equation (19), (20), and (22), Equation (23) becomes Equation (24).
P S E B = e t = 1 T 1 T + 1 A ( R t ) P ( T 1 > t ) + e p i = 1 11 S F V i z = 1 Z P G z P ( Q i | G z ) + t = 1 T 1 T + 1 A ( C t ) P ( T 1 > t )

4. Simulation

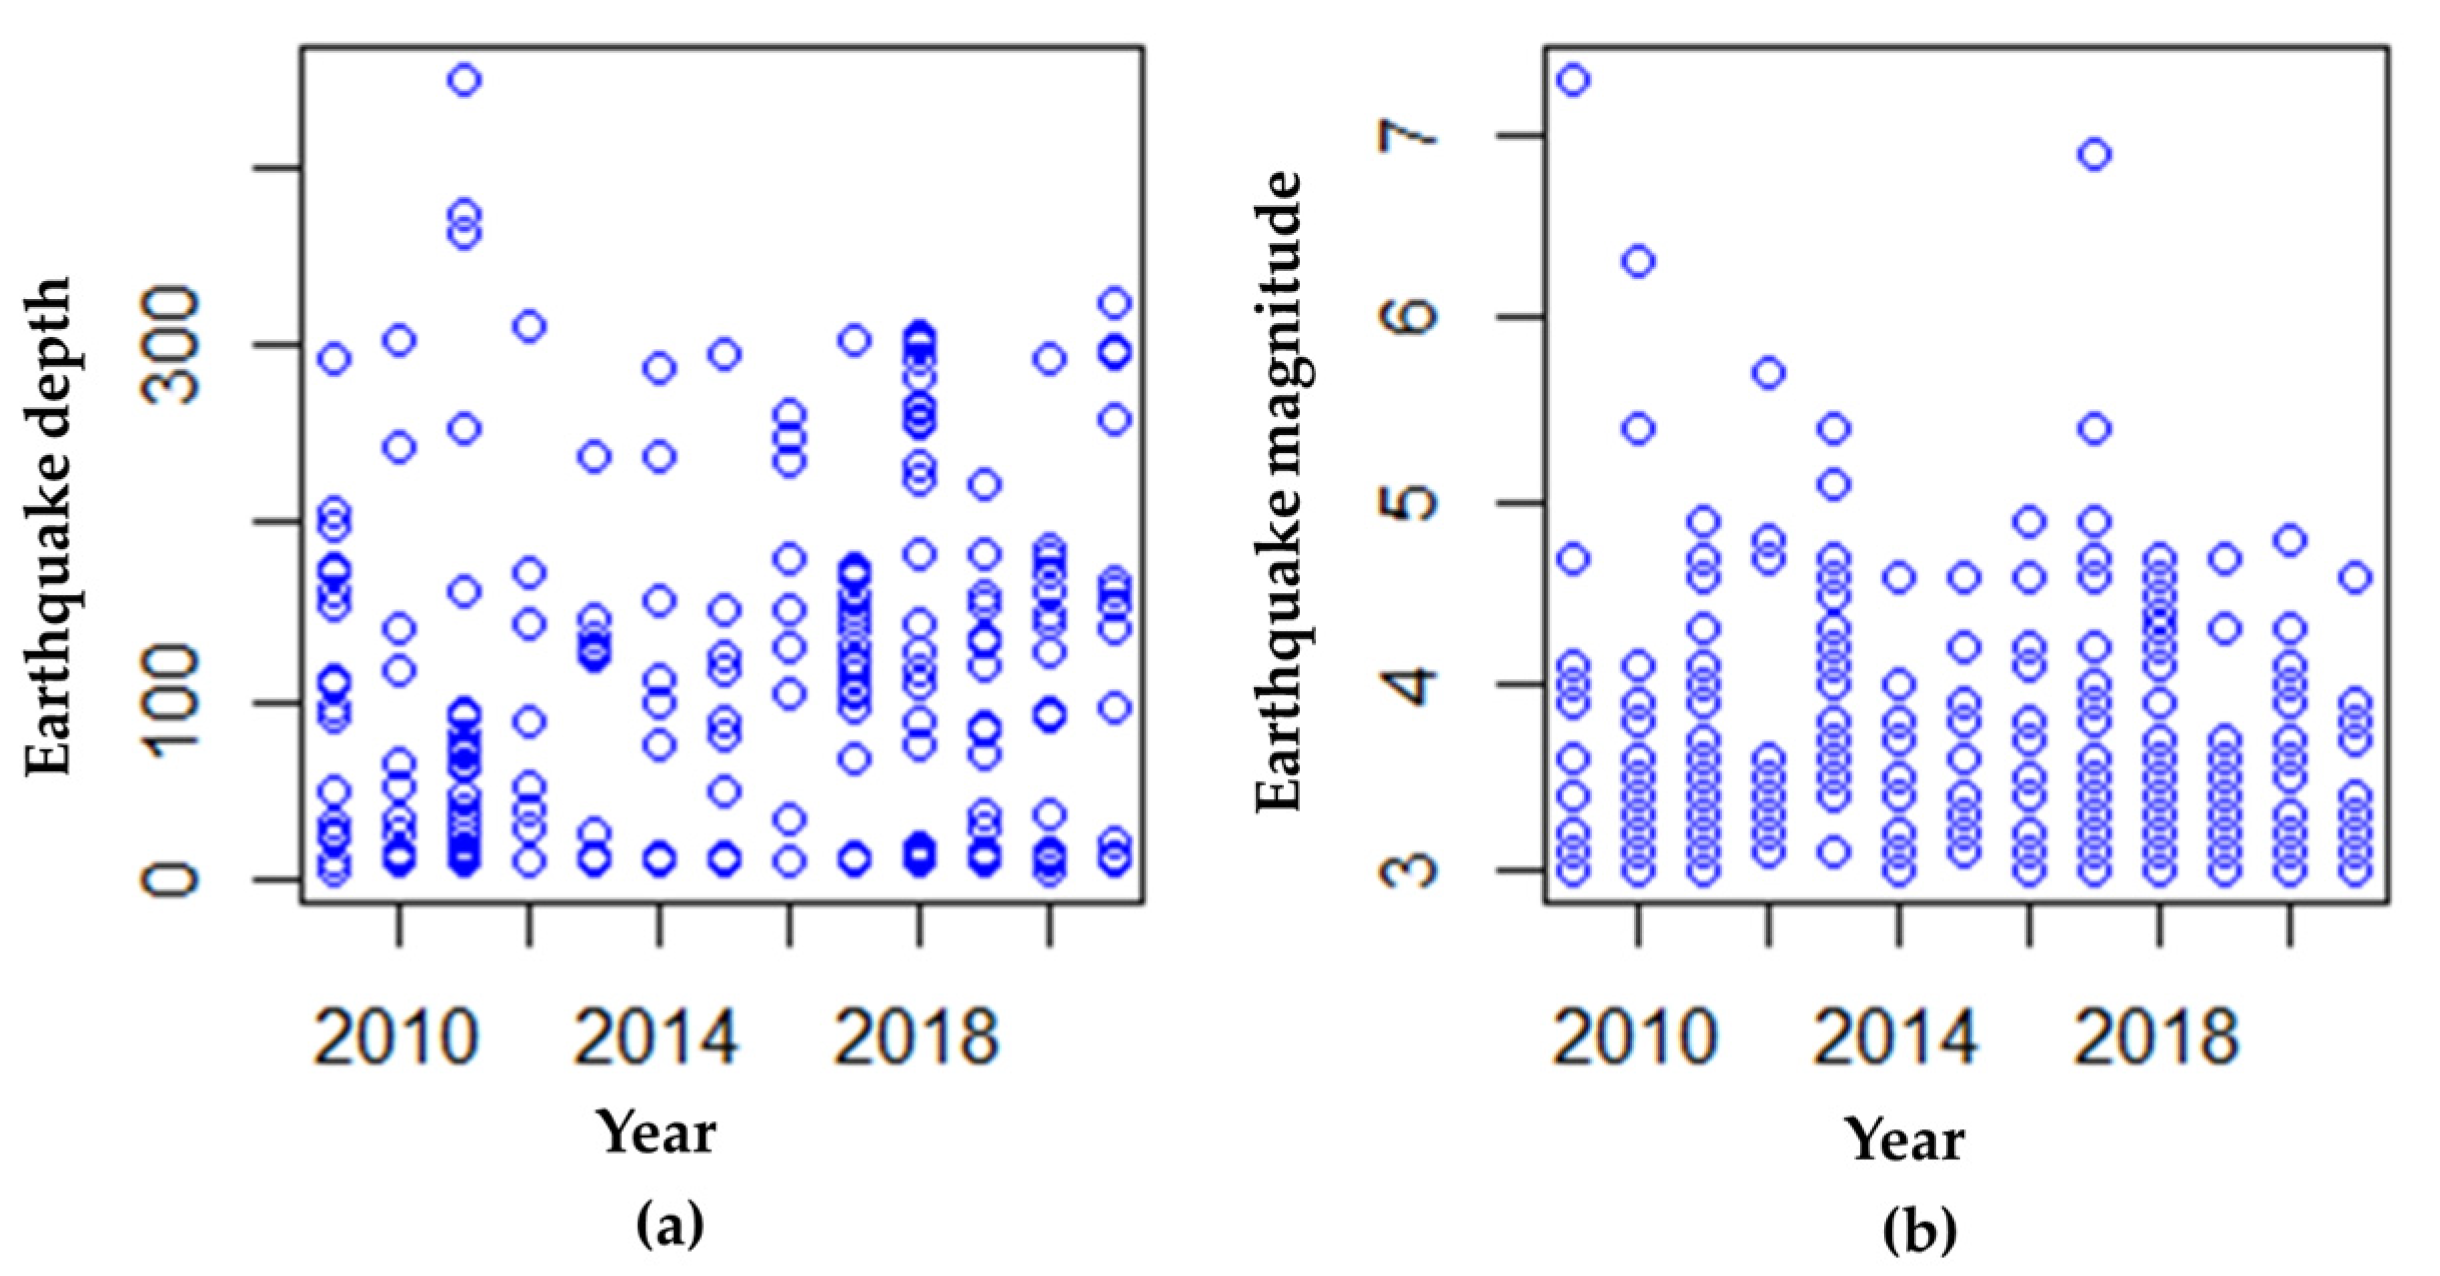
4.1. Data Description

The data used in the SEB pricing simulation are as follows:
(1)
Earthquake data for West Java Province, Indonesia, from 2009 to 2021 was obtained from the Meteorology, Climatology, and Geophysics Agency (BMKG).
(2)
EDRI data for the Province of West Java, Indonesia, from 2009 to 2021 was obtained from the National Disaster Management Agency (BNPB).
(3)
BI interest rate data from 2009 to 2021 was obtained from Bank Indonesia.
(4)
LIBOR interest rate data from 2009 to 2021 was obtained from http://www.fedprimerate.com (accessed on 10 October 2022).

4.2. Division Zones of West Java Province Based on Seismic Information

The West Java Province of Indonesia consists of 27 districts/cities. Based on the earthquake data published by the BMKG, there were 329 earthquake events with an earthquake magnitude of more than 3 on the Richter scale. The earthquake’s depth and magnitude data from 2009 to 2021 are presented in Figure 4.
Figure 4 shows that the depth of earthquakes above 3 SR that occurred in West Java Province were at intervals of 5 to 450 km, dominated by 196 shallow, 123 medium, and 11 deep incidents. The earthquake with the largest magnitude of 7.3 on the Richter scale occurred in Tasikmalaya on 9 February 2009.
The steps taken in seismic zone division based on the EDRI categories, the earthquake magnitude, the earthquake depth, and the distance between earthquake events in West Java Province are described in this section.

4.3. Clustering Based on EDRI Categories in West Java Province

The EDRI scores in West Java Province were categorized into three categories: low, medium, and high. Based on BNPB data, the EDRI score for districts and cities in West Java Province is in the interval of 3.87 to 21.6. The score of the EDRI for districts and cities in West Java Province is presented in Figure 5.
Figure 5 shows that Kota Banjar has the highest EDRI score, while Indramayu has the lowest. The high-category EDRI is in the interval [12.01, 21.6], and the moderate category is in [6.97, 11.06]. The covered area is classified into regions with high, medium, and low earthquake risk indexes based on the EDRI score, as shown in Table 3.
Table 3 shows that the number of districts or cities that have a low EDRI is one, the medium EDRI is eleven, and the high EDRI is fifteen. The visualization of clustering results is presented in Figure 6.
The EDRI score is calculated based on three variables: the hazard variable, which is calculated based on earthquake occurrences; the vulnerability variable, which is calculated using socio-cultural, economic, physical, and environmental parameters; and the capacity variable of an area, which is calculated based on regional resilience. Figure 6 shows that more than 50 percent of the area in West Java Province has a high EDRI, meaning that West Java Province has high seismic potential and high economic losses due to earthquakes. Further, Figure 6 shows that some regions with medium EDRI are also parts of regions with high EDRI, and vice versa. In addition, very few earthquakes are thought to originate in that region, according to observations made of the number of earthquakes in the region. However, calculating the distance between earthquake events becomes challenging as a result. Therefore, we grouped several areas into one, namely: Bogor Regency, Bogor City, and Depok, which will be further named Bogor; the city of Cirebon and Cirebon Regency became one area, which was here after being given the name Cirebon; Cimahi City, West Bandung Regency, and Bandung Regency, which were here after being given the name Bandung. The final subregion clustering based on EDRI is presented in Figure 7.

4.3.1. Calculation of Average Earthquake Magnitude, Earthquake Depth, and Earthquake Distance between Events

The data for calculating the STDM distance is earthquake magnitude data greater than 2.9 SR because an earthquake with a magnitude of 3 on the Richter scale is felt by humans (see Table 4). The STDM space has criteria for the distribution of earthquake magnitude that must fit an exponential distribution (for more information, see [45]). The results of the Kolmogorov-Smirnov test, b value, average earthquake depth, average earthquake magnitude, and average STDM distance are presented in Table 4.
Table 4 shows that the truncated exponential distribution at 2.9 SR fits the earthquake magnitude data in the subregion. This is shown by the fact that the KS test statistic (Dcount) has a value less than the critical value D α = 0.01 . The value of b′ is the parameter estimator value of the exponential distribution, which has a cumulative distribution function f M = 1 e b m 2.9 , and b is the parameter of the Gutenberg Ritcher model.
The highest b value is in the Ciamis subregion, while the lowest is in the Tasikmalaya subregion. The highest fractal value is in Ciamis, while the lowest is in Tasikmalaya. The largest average earthquake magnitude occurred in Tasikmalaya, and the lowest was in Ciamis. The deepest earthquake occurred in Indramayu, while the shallowest was in Purwakarta. The shortest STDM distance is in Tasikmalaya, while the longest is in Ciamis.

4.3.2. Clustering Type I

Clustering type I use the EDRI categories and K-Means algorithm for dividing area W . Based on the result of clustering using the EDRI categories, there is only one member of the low-EDRI category, namely Indramayu, so clustering is not carried out. As a result, we are clustering the members of medium EDRI with the members of high EDRI. However, prior to clustering with K-means, the first stage is determining the optimal number of clusters using the elbow method. The result is presented in Figure 8.
Figure 8a,b show the shape of the elbow when the number of clusters is set to two, with both medium- and high-EDRI groups. The results of clustering in the medium EDRI and the high EDRI are presented in Table 5.
Table 5 shows the members of cluster 1 in the medium EDRI are Sumedang, Kuningan, and Subang, while the members of cluster 2 in the medium EDRI are Majalengka, Ciamis, and Karawang. Additionally, the members of cluster 1 in the high EDRI are Tasikmalaya, Bandung, Purwakarta, Bogor, Cianjur, Garut, and Sukabumi, while the members of cluster 2 in the high EDRI are Bekasi and Cirebon. Based on clustering type I, we have 5 zones in which the members within each zone have similar seismic conditions, which are considered in the average magnitude and depth of earthquakes and the difference between earthquake events. Five zones will be ordered based on risk due to an earthquake catastrophe, and the result is represented in Table 6.
Table 6 shows the areas with the lowest to the highest loss impacts. The result of zone divisions of West Java Province is presented in Figure 9.
Figure 9 shows that zone 5 is an area that has the highest loss potential compared to others due to the presence of the Lembang and Cimandiri faults. In addition, there are also active mountains, namely Papandaian Mountain, Guntur Mountain, and Galunggung Mountain in Garut, and the Salak and Gede Mountains at Bogor.

4.3.3. Clustering Type II

The clustering of type II uses the EDRI category and the K-Medoids algorithm for dividing area W. The K-medoids algorithm can reduce the sensitivity of the grouping results due to the presence of data outliers, which are checked using a boxplot. The first stage for making a boxplot is to scale the data for the earthquake magnitude, the earthquake depth, and the distance between earthquake events, and we used the Rstudio application to make Figure 10.
The boxplot in Figure 10a shows that the medium EDRI category cluster has no outliers, whereas the high-cluster EDRI has two. However, before we can use K-medoids to cluster members of the medium and high EDRI categories, we must first determine the optimal number of each EDRI category using the elbow method, as shown in Figure 11.
Figure 11a,b show the shape of the elbow when the number of clusters is set two in medium EDRI, and set three in high EDRI. The results of clustering type II are presented in Table 7.
Table 7 shows the members of clusters 1 and 2 in the medium EDRI, the same as Table 6. Additionally, the members of cluster 1 in the high EDRI are Tasikmalaya, Bogor, and Cianjur. The members of cluster 2 in the high EDRI category are Bekasi and Cirebon, while the members of cluster 3 in the high EDRI category are Bandung, Purwakarta, Garut, and Sukabumi. Based on clustering type II, we have 6 zones; these zones will be ordered based on the risk of an earthquake catastrophe, and the result is represented in Table 8.
The order of the zones in Table 8 shows the areas that have the lowest to highest loss impact and the maximum historical earthquake magnitude within each zone. The results of the zone division are presented in Figure 12.
Figure 12 shows Subregions that are in the same group are given the same color. Besides that, zone 5 in cluster type I is divided into two zones, zones 5 and 6 in cluster type II, and the other zone is the same as a result of cluster type I.

4.4. Simulation of Face Amount Payoff Function and Coupon Payoff Function

The value of f i in Equation (7) is f 1 = 0.9 ,   f 2 = 0.8 ,   f 3 = 0.7 ,   f 4 = 0.6 ,   f 5 = 0.5 ,   f 6 = 0.4 ,   f 7 = 0.3 ,   f 8 = 0.2 ,   f 9 = 0.1 , respectively, with FV being IDR 1,000,000, so Equation (7) becomes Equation (25).
S ( F V ) = 1,000,000 M < 5   a n d   D > 0 900,000 M 5 , 6   a n d   D 300 800,000 M 5 , 6   a n d   D [ 70 , 300 ) 700,000 M 5 , 6   a n d   D ( 0 , 70 ) 600,000 M 6 , 7   a n d   D 300 500,000 M 6 , 7   a n d   D [ 70 , 300 ) 400,000 M 6 , 7   a n d   D ( 0 , 70 ) 300,000 M 7 , 8   a n d   D 300 200,000 M 7 , 8   a n d   D [ 70 , 300 ) 100,000 M 7 , 8   a n d   D ( 0 , 70 ) 0 M 8   a n d   D > 0
The coupon payoff function is given in Equation (26).
Y C , F V t = I D R . 1,000,000 C t M < m T q 0 M m T q

4.5. Selection of Magnitude and Depth Earthquakes Simulation

The selection of earthquake magnitude data using the POT method. The data used has been visualized in Figure 4.

4.6. Magnitude and Depth of Earthquakes Distribution Model Simulation

In this section, we simulated the distribution of the magnitude and depth of earthquakes.

4.6.1. Earthquake Magnitude Distribution Simulation

The initial stage is to estimate the parameters and the KS test before modeling the distribution of earthquake magnitude using the GPD. The results of the parameter estimate and KS test and the cdf of GPD for cluster I are shown in Table 9 and Table 10; and KS test and the CDF of GPD for cluster II shown in Table 11 and Table 12.
Table 9 shows the earthquake magnitude data distribution in cluster type I matching the GPD distribution. This is shown by calculating the statistical value in each subregion, which is less than the critical value.
Table 11 shows that the earthquake magnitude data distribution within each zone of cluster type II matches the GPD. This is shown by calculating the statistical value in each zone, which is less than the critical value. The GPD distribution function for each zone is presented in Table 12.
The earthquake magnitude return levels at return periods of 10 years, 20 years, 50 years, 100 years, 200 years, 500 years, and 1000 years in cluster type I and cluster type II are presented in Table 13 and Table 14.
Table 14 shows that the earthquake magnitude return level increases over time. The return level at the return period of 10 to 1000 years within each zone is [4.63, 5.11], [4.67, 5.36], [4.39, 5.59], [4.58, 5.66], and [4.39, 7.66], respectively, as presented in Figure 13.
Figure 13 depicts the increase in the earthquake magnitude return level within each zone of cluster type I over time. Over a 10-year return period, zones 3 and 5 had the lowest return levels, while zone 2 had the highest return levels. Zone 1 had the lowest return levels over the 1000-year period, while zone 5 had the highest return levels.
Table 14 shows that the earthquake magnitude return level in cluster type II increases over time. The earthquake return levels in the period from 10 to 1000 periods in each zone is [4.63, 5.11], [4.67, 5.36], [4.39, 5.59], [4.58, 5.66], and [4.18, 5.6], [4.81, 10.74] respectively, as presented in Figure 14.
Figure 14 shows that the earthquake magnitude return level in each return period for all zones in cluster type II is increasing. In the 10th year, the return level in zones 5 and 3 is at its lowest point, while the highest is in zone 1. The longer the period, the higher the earthquake magnitude return level. In 1000 years, the return level in zone 5 has the highest magnitude, while the lowest is in zone 1. 5.11 SR, 5.36 SR, 5.59 SR, 5.66 SR, 5.60 SR, and 7.66 SR are the magnitude return levels that indicate that the average magnitude was exceeded in the last 1000 years in each zone with a confidence level of 99.9%. The results obtained are used to determine the coupon payment function for each subregion presented in Equation (26).

4.6.2. Simulation the Archimedean Copula Distribution Function for Earthquake Magnitude and Earthquake Depth

We modeled the distribution of the dependencies of the magnitude and depth of the earthquakes using the Archimedean copula, because it can describe the asymmetrical correlation between variables and tail features well [24]. The Archimedean copula used has been described in Table 2, and selecting a suitable theoretical distribution uses the AIC criteria. The data processing in this section is performed using the RStudio application. The results of the estimation of parameter values and the KS test and the joint PDF for clustering types I are presented in Table 15 and Table 16.
The selection of the suitable Archimedean copula family in describing magnitude and depth of earthquakes for the member of clustering type I based on the smallest AIC value. Table 15 shows the smallest AIC values in cluster type I. The zones 1, 2, and 4 are the Clayton distribution, zone 3 is the Gumbel distribution, and zone 5 is the Frank distribution.
The plot of the copula density function for depth and magnitude of earthquakes in Table 16 is presented in Figure 15.
Figure 15a–e show the plot of the joint density function of the depth and magnitude of earthquakes for zone 1, zone 2, zone 3, zone 4, and zone 5 in cluster type I. In Figure 15a,b,d has a lower tail, Figure 15c has an upper tail, and Figure 15e has a symmetric tail. The results of the estimation of parameter values and the KS test and the joint PDF for clustering types II are presented in Table 17 and Table 18.
The selection of the suitable Archimedean copula family for describing depth and magnitude of earthquakes for cluster type II based on the smallest AIC value. Table 17 shows the smallest AIC values in zones 1, 2, 4, and 6 of the Clayton distribution, zone 3 OF the Gumbel distribution, and subregion 5 of Frank.
The plot of the joint density function of the depth and magnitude of the earthquakes in Cluster Type II is presented in Figure 16.
Figure 16a–f show the plot of the joint density function of the depth and magnitude of earthquakes for zones 1, 2, 3, 4, 5, and 6 in cluster type II. Figure 16a,b,d,f have a lower tail; Figure 16c has an upper tail; and Figure 15e has a symmetrical tail.

4.7. Interest Rates and Coupons Prediction

Predict interest rates and coupon rates using the FTS Singh method with the help of the Rstudio application.

4.7.1. Interest Rate Predictions

The data used in predicting interest rates is Bank Indonesia (BI) interest rate data from 2009 to 2021. The steps in calculating interest rate predictions are as follows:
Step 1. Defines the universal set t of interest rates U = [ 3 , 9 ]
Step 2. Partitioning the set U into 9 interval intervals (linguistic values)
u 1 = 3 , 3.66667 , u 2 = 3.66667 , 4.33333 , u 3 = 4.33333 , 5 , u 4 = 5 , 5.66667 , u 5 = 5.66667 , 6.33333 , u 6 = 6.33333 , 7 , u 7 = 7 , 7.66667 , u 8 = 7.66667 , 8.33333 , u 9 = [ 8.33333 , 9 ]
Step 3. Defining the nine fuzzy sets A 1 , A 2 , , A 9 as linguistic variables in the universal set U defined in Table 19.
The membership function of the interest rate linguistic variable is defined in Equation (27).
A 1 = 1 u 1 + 0.5 u 2 + 0 u 3 + 0 u 4 + 0 u 5 + 0 u 6 + 0 u 7 + 0 u 8 + 0 u 9 A 2 = 0.5 u 1 + 1 u 2 + 0.5 u 3 + 0 u 4 + 0 u 5 + 0 u 6 + 0 u 7 + 0 u 8 + 0 u 9 A 3 = 0 u 1 + 0.5 u 2 + 1 u 3 + 0.5 u 4 + 0 u 5 + 0 u 6 + 0 u 7 + 0 u 8 + 0 u 9 A 4 = 0 u 1 + 0 u 2 + 0.5 u 3 + 1 u 4 + 0.5 u 5 + 0 u 6 + 0 u 7 + 0 u 8 + 0 u 9 A 5 = 0 u 1 + 0 u 2 + 0 u 3 + 0.5 u 4 + 1 u 5 + 0.5 u 6 + 0 u 7 + 0 u 8 + 0 u 9 A 6 = 0 u 1 + 0 u 2 + 0 u 3 + 0 u 4 + 0.5 u 5 + 1 u 6 + 0.5 u 7 + 0 u 8 + 0 u 9 A 7 = 0 u 1 + 0 u 2 + 0 u 3 + 0 u 4 + 0 u 5 + 0.5 u 6 + 1 u 7 + 0.5 u 8 + 0 u 9 A 8 = 0 u 1 + 0 u 2 + 0 u 3 + 0 u 4 + 0 u 5 + 0 u 6 + 0.5 u 7 + 1 u 8 + 0.5 u 9 A 9 = 0 u 1 + 0 u 2 + 0 u 3 + 0 u 4 + 0 u 5 + 0 u 6 + 0 u 7 + 0.5 u 8 + 1 u 9
Step 4. Defuzzify the interest rate, build the FLR, and then define the fuzzy relation group (FRG) denoted in Equation (28).
A 1 A 1 ; A 2 A 1 , A 2 , A 3 ; A 3 A 2 , A 3 , A 4 ; A 4 A 3 , A 4 , A 5 ; A 5 A 4 , A 5 , A 6 ; A 6 A 4 , A 5 , A 6 , A 7 ; A 7 A 6 , A 7 , A 8 ; A 8 A 7 , A 8 ; A 9 A 8
Step 5. Make forecasts using the rules presented in Algorithm 4. Forecasting results are presented in Figure 17.
Figure 17 shows that the actual and predicted interest rate curves are very similar. For example, with a means squared error (MSE) value of 1.4%, this shows that the forecasting results using FTS Singh are very good. The predicted interest rate results are presented in Table 20.
Table 20 shows the prediction of the interest rate decreasing annually.

4.7.2. The Coupon Rate Prediction

The data used in the coupon rate prediction is LIBOR interest rate data from 2009 to 2021. The steps in calculating the coupon rate prediction are as follows:
Step 1. Defines the universal set of interest rates U = [ 0 , 4 ]
Step 2. Partitioning the set U into 9 intervals (linguistic values)
u 1 = 0 , 0.4444 , u 2 = 0.4444 , 0.8889 , u 3 = 0.8889 , 1.3333 , u 4 = 1.3333 , 1.7778 , u 5 = 1.7778 , 2.2222 , u 6 = 2.2222 , 2.6667 , u 7 = 2.6667 , 3.1111 , u 8 = 3.1111 , 3.5556 , u 9 = [ 3.5556 , 4 ]
Step 3. Define nine fuzzy sets A 1 , A 2 , , A 9 as a linguistic variable in the universe set U which is defined in Table 21 as follows:
The membership function of the coupon rate linguistic variable is defined in Equation (29).
A 1 = 1 u 1 + 0.5 u 2 + 0 u 3 + 0 u 4 + 0 u 5 + 0 u 6 + 0 u 7 + 0 u 8 + 0 u 9 A 2 = 0.5 u 1 + 1 u 2 + 0.5 u 3 + 0 u 4 + 0 u 5 + 0 u 6 + 0 u 7 + 0 u 8 + 0 u 9 A 3 = 0 u 1 + 0.5 u 2 + 1 u 3 + 0.5 u 4 + 0 u 5 + 0 u 6 + 0 u 7 + 0 u 8 + 0 u 9 A 4 = 0 u 1 + 0 u 2 + 0.5 u 3 + 1 u 4 + 0.5 u 5 + 0 u 6 + 0 u 7 + 0 u 8 + 0 u 9 A 5 = 0 u 1 + 0 u 2 + 0 u 3 + 0.5 u 4 + 1 u 5 + 0.5 u 6 + 0 u 7 + 0 u 8 + 0 u 9 A 6 = 0 u 1 + 0 u 2 + 0 u 3 + 0 u 4 + 0.5 u 5 + 1 u 6 + 0.5 u 7 + 0 u 8 + 0 u 9 A 7 = 0 u 1 + 0 u 2 + 0 u 3 + 0 u 4 + 0 u 5 + 0.5 u 6 + 1 u 7 + 0.5 u 8 + 0 u 9 A 8 = 0 u 1 + 0 u 2 + 0 u 3 + 0 u 4 + 0 u 5 + 0 u 6 + 0.5 u 7 + 1 u 8 + 0.5 u 9 A 9 = 0 u 1 + 0 u 2 + 0 u 3 + 0 u 4 + 0 u 5 + 0 u 6 + 0 u 7 + 0.5 u 8 + 1 u 9
Step 4. Defuzzify the coupon rate, build the FLR, and then define the FRG, as presented in Equation (30).
A 1 A 1 , A 2 ; A 2 A 1 , A 2 , A 3 ; A 3 A 2 , A 3 , A 4 , A 5 ; A 4 A 3 , A 4 , A 5 ; A 5 A 4 , A 5 , A 6 ; A 6 A 5 , A 6 , A 7 ; A 7 A 6 , A 7 , A 8 ; A 8 A 7 , A 9 N A
Step 5. Perform forecasting using the rules that have been presented in Algorithm 4. A visualization of the results of forecasting interest rates using FTS Singh is presented in Figure 18.
The forecasting results in Figure 18 show that the curve of the forecasting coupon rate is similar to the actual curve, with a MSE of 0.4%. This shows that the forecasting results using FTS Singh are very good. The amount of the predicted coupon rate will be used in determining the price of the earthquake disaster bond for a single period. The prediction results after 5 years are presented in Table 22.
Table 22 shows the prediction of the coupon rate increasing annually.

4.8. Simulation of the Expected Coupon Amount, Interest Rates, and Face Amount of SEB Price

In this section, a simulation of the expected coupon amount, interest rate, and face amount of SEB in cluster types I and II is presented.

4.8.1. Simulation of the Expected Coupon Amount and Interest Rate

The model used in calculating the expected coupon amount to be received by bondholders at maturity T uses Equation (19). The calculation of the probability of type I and type II earthquakes uses a threshold value ( m T q z ) according to the earthquake return level over a period of 1000 years. The calculation results for each type of clustering are presented in Table 23 and Table 24.
Table 23 shows that the highest probability of an earthquake of type 1 is in zone 4, while the lowest is in zones 3 and 5.
Table 24 shows that the probability of an earthquake of type 1 in zone 3, zone 4, zone 5, and zone 6 is 0.001, while in zone 1 and zone 2 it is 0.0013 and 0.0011, respectively. The total probability of an earthquake of type 1 in clustering type I is 0.001025, while the probability of an earthquake of type 1 in clustering type II is 0.0010014. The results of calculating P ( T 1 > t ) for each clustering type are shown in Table 25.
The results of calculating the expected coupon amount and the expected interest rate for maturity times T = 1 , 2 , 3 , 4 , 5 are presented in Table 26 and Table 27.
The expected coupon amount based on seismic information cluster type II is greater than the expected coupon amount for cluster type I, as shown in Table 26.
As shown in Table 27, the expectation of the interest rate based on seismic information cluster type II is greater than the expectation of the interest rate for cluster type I.

4.8.2. Simulation of the Calculation of Face Amount

The calculated result of probability type- i , where i = 1 , 2 , , 11 and expectation face amount of SEB for the member of cluster type I and cluster type II presented in Table 28 and Table 29.
Table 28 and Table 29 show, the face amount expectation of cluster type I is greater than the face amount expectation for cluster type II.

4.9. Simulating SEB Price Based on Seismic Information in Cluster Types I and II

Based on the results obtained in the previous section, SEB prices at maturity T = 1, 2, 3, 4, and 5 for cluster types I and II are presented in Table 30.
Table 30 calculates the SEB price using Equation (24) with a 0.05 extra premium and the threshold set at the 1000-year period of earthquake return level. The face amount payoff function refers to Equation (25), while the coupon payment function for clustering type I is presented in Equation (31) and for clustering type II is presented in Equation (32).
Y I C , F V t = I D R . 1,000,000 C t M < 7.66 0 M 7.66
Y 2 C , F V t = I D R . 1,000,000 C t M < 10.74 0 M 10.74
The threshold values in Equations (31) and (32) are obtained based on the maximum return level values for a period of 1000 years.

5. Discussion

West Java is one of the provinces in Indonesia that is prone to earthquakes because it is located on an active plate boundary between the oblique subduction of the Australian plate under Sumatra and the orthogonal subduction along Java [62], therefore causing several active faults, namely the Cimandiri, Lembang, and Baribis faults, and several active volcanoes, namely Mount Salak and Mount Pangrango in Bogor, Mount Guntur and Mount Papandayan in Garut, Mount Galunggung in Tasikmalaya, and Mount Ciremai in Kuningan [63]. Based on historical earthquake data from 2009 to 2021, West Java Province experienced an earthquake with a magnitude of 7.3 in 2009, which caused economic losses of IDR 6.9 trillion [64], while the contingency fund budget in the state revenue and expenditure budget provided was IDR 3 trillion [65]. This means that the capacity of the 2009 state budget can only cover half of the losses from the Tasikmalaya disaster. For this reason, it is necessary to find a new source of funds through the issuance of earthquake bonds to overcome the budget deficit caused by the earthquake. The most important aspect of issuing earthquake bonds is determining the price. In this study, the pricing framework for SEB has been described in detail. The results obtained at each stage of the earthquake insurance pricing framework will be described as follows.

5.1. Analysis of b Values in the Gutenberg-Richter Equation, Fractals, and Distances between Earthquake Events in West Java Province

The b value in the Gutenberg-Ritcher equation describes the seismic level of the physical state of the observation area [66]. Based on Table 8, the b value for each district and city in West Java Province is in the range [ 0.33 , 1.206 ] . Usually the value of b is 1 [67], but this problem is not clear, and variations in the value of b are still being discussed by experts [68,69]. There are many factors that cause the deviation of the b value from the normal value of 1, namely areas on a small scale over several to tens of kilometers; the accuracy of the b value is also affected by the low number of events [66]; spatial and temporal variations cause the b value to be very large [70]; an increase in material heterogeneity or crack density results in a high b value [67]; an increase in the applied shear stress [71]; or an increase in the effective stress decreases the b value [72].
The highest b value occurred in Ciamis at 1.206; this indicates material heterogeneity and high stress can be withstood [73]. The lowest b value occurs in Tasikmalaya at 0.33, reflecting high stiffness so that the area can accumulate higher stresses and release them suddenly. In addition, a low b value reflects that an earthquake of large magnitude has occurred in this area [73]. The results of these calculations are in accordance with historical earthquake data in Tasikmalaya, which indicates that in 2009 there was an earthquake with a magnitude of 7.3 on the Richter scale.
The fractal dimension is a direct indicator of material heterogeneity and strength that can be used for seismic hazard estimation [74]. The fractal dimension ranges from 0 to 2, where 0 implies that the epicenters are clustered into one point, while a value of 2 implies that the epicenters are distributed homogeneously [75]. There is 1 area that has fractals above 2, namely Ciamis; this is due to the high b value due to spatial and temporal variations [70].
The earthquake phenomenon can be explained by power laws related to STDM space and fractals [73]. This can be described by the STDM distance; however, the calculation uses the magnitude, depth, fractal, and b-value. The STDM distance will be small if the occurrence of the i + 1 -th earthquake is greater than the i -th earthquake, while it will be greater if the i -th and ( i + 1 )-th earthquakes have a weak relationship. The average STDM distance in West Java province is 11.14. An example is that in 2009, Tasikmalaya was rocked by a 7.3 SR earthquake at a depth of 30 km, and eight years later, another earthquake occurred in Tasikmalaya with a magnitude of 6.9 SR at a depth of 108 km.
Based on the seismic characteristics of each district and city in West Java Province, it is hoped that the Indonesian government will be able to immediately seek new sources of funds through earthquake bonds due to the possibility that the potential for earthquakes will increase in the coming year. This is considered more profitable than issuing bonds after an earthquake catastrophe occurs because it can burden the state budget in the following year. However, the issuance of catastrophe bonds can provide benefits derived from investing the funds collected from the investor. The framework for the SEB pricing model can be used as a reference by the Indonesian government in determining the SEB price for issuing earthquake catastrophe bonds.

5.2. Single Earthquake Bond Price Analysis Based on on Seismic Information in Cluster Types I and II

The simulation of SEB prices for types I and II uses a threshold value obtained from the value of the return level over a period of 1000 years. The simulation results are presented in Figure 19.
Figure 19 shows that the SEB price based on seismic information in Cluster II is lower than Type I for maturities of 1 to 4 years. However, at maturity (5 years), it is higher than type I. If SPV wants to issue bonds at a lower price at a maturity of 1 to 4 years, then choosing cluster type II is recommended. However, if the SPV wants a maturity of 5 years, it is recommended to use the type I clustering calculation.
The SEB price and maturity time are inversely related. Further, long-term maturity results in a lower SEB price. The results of this analysis are in line with studies [76].

5.3. Analysis of SEB Prices Based on the Earthquake Return Period

The single earthquake bond (SEB) price simulation is based on the return period with maturity time T = 1 , 2 , 3 , 4 , 5 in the cluster type II. The simulation results are presented in Figure 20.
Figure 20 shows tthat the relationship between the return period of the earthquake and the SEB price is unidirectional. The longer the earthquake return period, the higher the SEB price.

5.4. Analysis of the Relationship between Interest Rates and SEB Prices

The analysis of interest rates on SEB prices employs Monte Carlo simulation, which generates 1000 random interest rates. Based on seismic information for Cluster Type II, the result of the SEB price is presented in Figure 21.
Figure 21 shows that interest rates and SEB prices are inversely related. The higher the interest rate, the lower the SEB price. The results of this analysis are in line with studies [1,12,77].

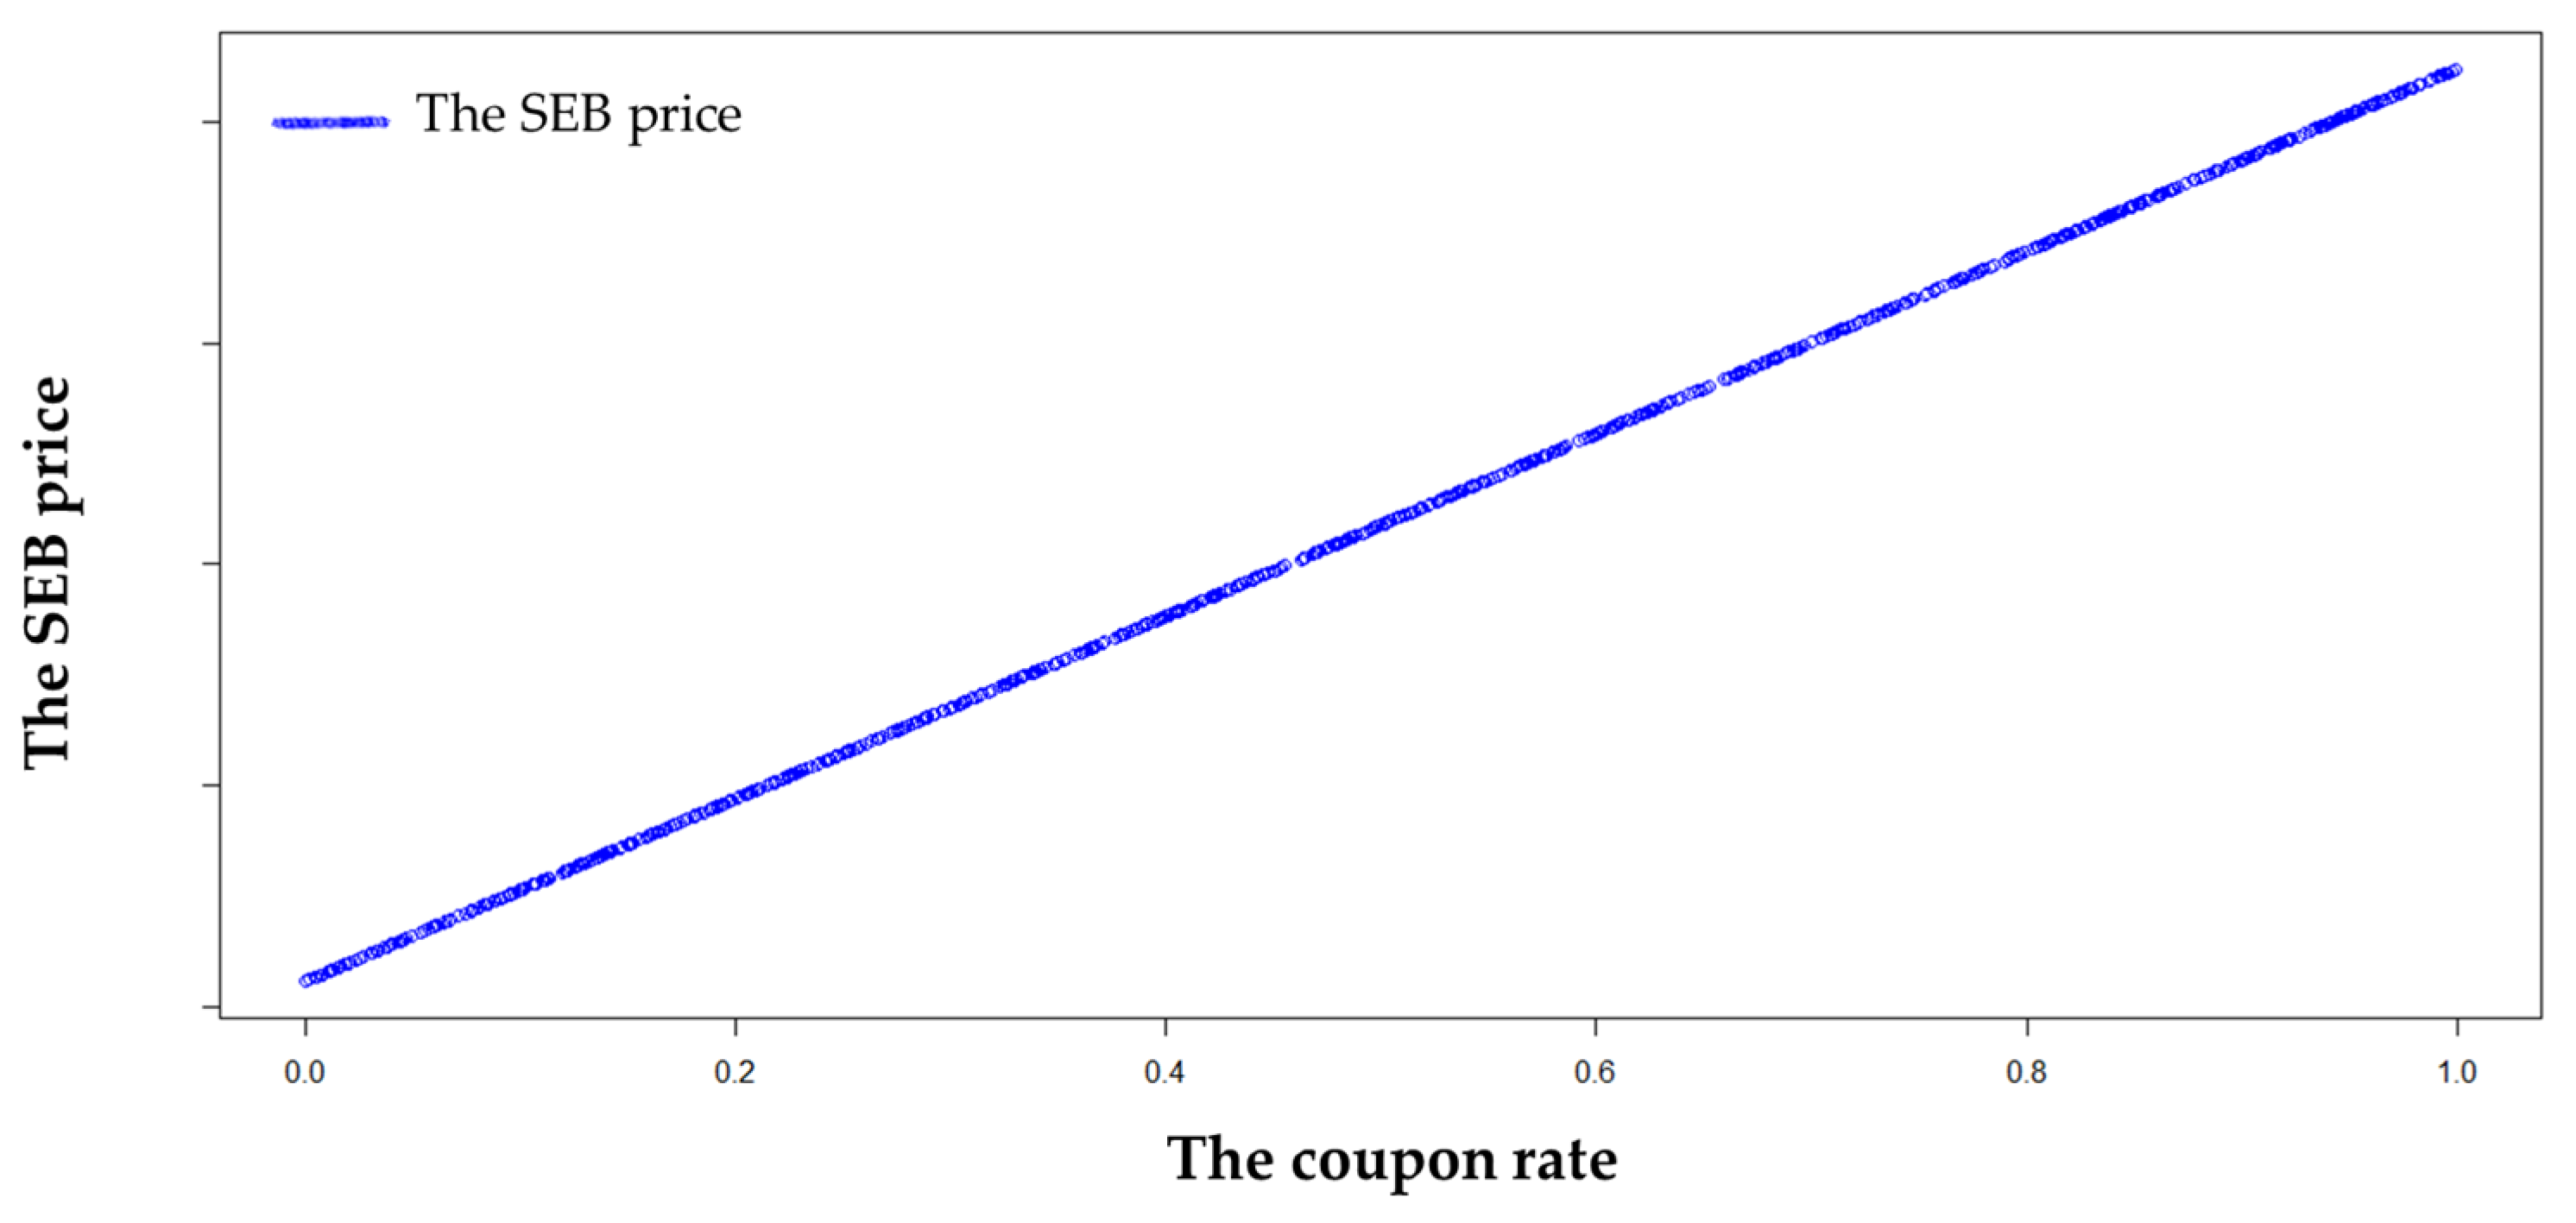
5.5. Analysis of the Relationship between Coupon Rates and SEB Prices

The coupon rate analysis of SEB prices uses Monte Carlo simulation by generating random coupon rate numbers 1000 times. Based on seismic information for Cluster Type II, the result of the SEB price is presented in Figure 22.
Figure 22 shows that the relationship between coupon rates and bond prices is unidirectional. A higher coupon rate results in an increase in the price of earthquake bonds. The results of the analysis of the interest rate relationship The results of this analysis are in line with studies [1,12,77].

6. Conclusions

The framework for the SEB pricing model based on multiregional seismic information is proposed to improve the weaknesses of multiregional earthquake bonds. In addition, it also uses a double parameter trigger type, namely the earthquake magnitude and the earthquake depth, in the face amount payoff function. This is considered more transparent than the indemnity trigger type, modeled loss trigger, and industrial loss trigger; however, it can also describe the severity of the earthquake. The improved prediction of interest rates and coupons using the FTSS helps avoid negative prediction results, and the calculation of the present value of interest rates better describes the seismic conditions of the insured area by calculating expected interest rates using the Poisson process concept and the total probability of a type I earthquake occurrence.
The SEB’s pricing model framework consists of eight stages. The first stage is to divide the coverage area into several zones based on the earthquake disaster risk index (EDRI). Furthermore, the subregions in the EDRI category will be grouped using the K-Means algorithm and the K-Medoids algorithm. The second stage is defining the trigger mechanism, and the third stage is selecting earthquake magnitude data using the POT method. The fourth stage involves modeling the distribution of earthquake magnitude using GPD and the AC distribution of earthquake magnitude and earthquake depth. The fifth stage is predicting interest rates and coupons using the FTSS. The sixth stage is to formulate a model for calculating expected coupon amounts and interest rates using the Poisson process and the total probability of Type 1 earthquake events. The seventh step is to formulate a model for calculating the expected face amount of SEB using the expectation concept of the total probability of earthquake type 1 events. The eighth stage is modeling SEB prices.
The simulation of the coverage area for SEB was carried out in West Java Province because it is prone to earthquakes. More than half of the provinces in Indonesia have a high EDRI. Additionally, based on the b-value of the historical earthquake magnitude data, the highest b-value occurred in Ciamis which indicates material heterogeneity and high stress can be withstood. The lowest b value occurs in Tasikmalaya, reflecting high stiffness so that the area can accumulate higher stresses and release them suddenly or reflecting that an earthquake of large magnitude has occurred in this area. The b value around 0.5 occurred in Kuningan, Subang, Karawang, Bekasi, and Cianjur. Statistically speaking, a region with a b-value of 0.5 has a higher percentage of large earthquakes than a region with a b-value of 1.0. Based on the b -value, we can conclude that many areas in west Java province are vulnerable to large earthquakes.
It is hoped that the Indonesian government will be able to immediately seek new sources of funding through earthquake bonds due to the possibility that the potential for earthquakes will increase in the upcoming year based on the seismic characteristics of each district and city in West Java Province. Consequently, it could put a strain on the state budget next year. The issued earthquake bonds are thought to be more profitable than issuing bonds in the wake of an earthquake calamity. However, the sale of catastrophe bonds may offer advantages resulting from the investor’s investment. As a result, the Indonesian government can utilize the SEB pricing framework as a guide when setting the SEB price for issuing earthquake bonds.
Additionally, the result obtained based on simulation is that the price of SEB based on the clustering result of type I is higher than the price of SEB based on the clustering result of type II at maturities of 1 to 4 years. However, if the maturity is 5 years, the price of SEB based on the clustering result of type I is lower than the price of SEB based on the clustering result of type II. This can be used as a consideration for the SPV in determining the price of SEB based on maturity. If the SPV wants a lower offering price at maturity of 1 to 4 years, then cluster type II is chosen. The SPV can choose cluster type I if it wants to offer bonds with a maturity of 5 years. The advantages of SEB Price using clustering type II are more attractive to investors because they produce higher coupons.
The analysis of the SEB price shows a unidirectional relationship between the earthquake’s return period and the SEB price, meaning that the longer the return period is, the more expensive SEB will be. The relationship between interest rates and SEB prices is inverse, meaning that the higher the interest rate, the lower the SEB price. In contrast, the relationship between coupon rates and bond prices is unidirectional, meaning that a higher coupon rate causes a rise in the SEB price.
The proposed model framework can be used for other catastrophe bonds (floods, droughts, etc.). Several model extensions are possible, including regional decomposition that accounts for PGA, fuzzy logic that can be used to model the expected face amount, a coupon amount, and interest rate, and coupon predictions that account for other economic variables such as inflation.
The SEB valuing framework developed in this study is expected to be able to assist the super-purpose vehicle (SPV) in determining the price of earthquake bonds. Furthermore, the government of Indonesia can find new sources of funding for earthquake disaster management. This study can be a reference for other researchers developing earthquake disaster bond pricing models.

Author Contributions

Conceptualization, W.A. and S.S.; methodology, W.A.; software, W.A.; validation, S.S. and S.; formal analysis, W.A.; investigation, S.S.; data curation, S.S.; writing— original draft preparation, W.A.; writing—review and editing, N.A.H.; visualization, N.A.H.; supervision, S.S.; project administration, S.; funding acquisition, S.S. All authors have read and agreed to the published version of the manuscript.

Funding

This study was funded by RISETDIKTI via Universitas Padjadjaran with contract number 2064/UN6.3.1/PT.00/2022.

Institutional Review Board Statement

Not applicable.

Informed Consent Statement

Not applicable.

Data Availability Statement

The data are contained within the article.

Acknowledgments

The authors thank RISETDIKTI 2021 via Universitas Padjadjaran through the Doctoral Dissertation Research Grant.

Conflicts of Interest

The authors declare no conflict of interest.

Nomenclature

W the area of coverage.
I the number of subregions in W.
Z The number of zones.
E the category of EDRI.
W i the i -th subregion in W .
W E the cluster result of EDRI categories.
W E i the subregion i in W E
W E i z the subregion i in zone z .
i the earthquake event at time i .
j the earthquake event at time ( i + 1 ) .
τ i j the time difference between two earthquake events ( τ i j = t j t i ) .
r i j the haversine distance between two earthquake events.
b Gutenberg Richer parameter.
k fractal.
ε i the earthquake depth of the i -th earthquake event.
m i the earthquake magnitude of the i -th earthquake event.
m 0 the minimum threshold value of the observed earthquake magnitude.
η i j the STDM distance.
T i j the outcome of rescaling τ i j
R i j the outcome of rescaling r i j .
E i the outcome of rescaling ε i .
P the number of clusters.
I the number of the variable random.
J the number of the data.
P * the optimal number of cluster
x i j the data of observation for the i -th data and j -th variable.
v p the center of cluster p .
d i s t x i j , v p 2 the square of the distance of x i j to v p .
d i j the distance of x i j to v p
S ( p ) the sum of square of cluster p
x i j p the data of observation, which member
n p the number of cluster p
m p the medoids of of cluster p
c p cost of cluster p
F V the face amount of SEB.
T the maturity time.
i the i -th face amount payoff function.
f i the proportion of i -th face amount.
S ( F V ) the payoff function of face amount.
r ^ t the value prediction of interest rate at time t .
c ^ t the value prediction of coupon rate at time t .
e p the extra premium to bear risk of earthquake.
M the largest earthquake that has occurred in each zone at the interval ( t , t + 1 ) .
D the earthquake depth in m .
t the year before maturity.
Y C , F V t the coupon payoff function at time t.
C t the coupon amount at time t .
T q z the return period in zone z
m T q z the earthquake magnitude return level at period T q in zone z .
m T q the maximum magnitude earthquake return level for m T q z in coverage area W .
N the number of the earthquake occurrence.
Z the number of zones.
{ M 1 z , M 2 z , , M N z } the set of independent and identically random variables representing the earthquake’s magnitude in zone z .
{ M 1 z * , M 2 z * , , M N z * } the set of earthquake magnitude, with a POT as an outcome.
{ D 1 z , D 2 z , , D N z } the set of earthquake depth, which is correspond to M i z .
{ D 1 z * , D 2 z * , , D N z * } the set of earthquake depth, which is correspond to M i z * .
F ( M z * ) the cumulative distribution function of earthquake magnitude in the z -th zone, with a POT as an outcome.
F ( M z * , D z * ) the dependences cumulative distribution function of earthquake magnitude and earthquake depth, with a POT as an outcome.
ξ z the GPD location parameter in zone z .
σ z the GPD scale parameter in zone z .
κ z the GPD shape parameter in zone z .
F ( M z * | κ z , ξ z , σ z ) the cumulative distribution function of GPD.
m z * the value of earthquake magnitude variable in zone z ,
ξ ^ z the estimation of location parameter in zone z .
σ ^ z the estimation of scale parameter in zone z .
κ ^ z the estimation of shape parameter in zone z .
C ( M z * , D z * ) ( F ( M z * ) , F ( D z * ) ) the copula function of earthquake magnitude variable and earthquake depth variable.
F ( M z * ) the cumulative distribution function of M z *
F ( D z * ) the cumulative distribution function of D z *
θ z the parameter of AC distribution in zone z .
τ z the Kendall’s tau correlation.
D 1 ( θ z ) the Debye functions.
l ( θ z | ( m z , d z ) ) the likelihood function of a copula in zone z .
E i the earthquake event type i where i = 1 , 2 .
G z the random variable that represent the occurrence an earthquake in zone z .
P ( G z ) the probability of earthquake occurs in zone z .
P ( E i | G z ) the probability of earthquake of type i occurs where the earthquake event occurs in the z.
N z ( t ) the number of earthquake event occurs in zone z at ( 0 , t ) .
λ the rate of earthquake event in the W .
λ t the rate of earthquake event in the W at time t .
n the number of earthquakes event
N 1 ( t ) the number of earthquake event type 1 at interval year ( 0 , t ) .
N 2 ( t ) the number of earthquake event type 2 at interval year ( 0 , t ) .
P ( E i ) the total probability of earthquake type i occurs.
T 1 the first time of earthquake type 1 occurs.
P ( T 1 > t ) the probability of first-time earthquake type 1 occurs.
E Q ( C t ) the expectation of coupon amount.
A ( C t ) the accumulation of coupon amount at time t .
E Q ( R t ) the expectation of interest rate at time t .
A ( R t ) the accumulation amount at time t .
Q i E Q 1 ( F V ) E Q 1 ( F V ) the earthquake type i , where i = 1 , 2 , , 11 .
P ( Q i ) the total probability type i .
P ( Q i | G z ) the probability earthquake type i occurs where known the earthquake occurs in z .
E Q 1 ( F V ) the expectation of face amount.
P S E B the single earthquake bond price.
U the universe discourses.
B m i n the minimum value of actual data.
B m a x the aximum value of actual data.
{ u 1 , u 2 , , u m } the set of intervals.
( A 1 , A 2 , , A m ) the set of linguistic variables.
A i the fuzzy production in year n .
A j the fuzzy production in year n + 1 .
[ A j * ] the supremum of A j .
L A j * the lower limit of u j .
U [ A j * ] the upper limit of u j .
l [ A j * ] the length of the u j .
M [ A j * ] the middle value of the u j .
F j the result of forecasting.

References

  1. Burnecki, K.; Giuricich, M.N.; Palmowski, Z. Valuation of Contingent Convertible Catastrophe Bonds—The Case for Equity Conversion. Insur. Math. Econ. 2019, 88, 238–254. [Google Scholar] [CrossRef]
  2. UNDRR. Global Natural Disaster Assessment Report 2019. 2020. Available online: https://www.preventionweb.net/files/73363_2019globalnaturaldisasterassessment.pdf (accessed on 4 May 2022).
  3. Hofer, L.; Zanini, M.A.; Gardoni, P. Risk-Based Catastrophe Bond Design for a Spatially Distributed Portfolio. Struct. Saf. 2019, 83, 101908. [Google Scholar] [CrossRef]
  4. Sukono; Juahir, H.; Ibrahim, R.A.; Saputra, M.P.A.; Hidayat, Y.; Prihanto, I.G. Application of Compound Poisson Process in Pricing Catastrophe Bonds: A Systematic Literature Review. Mathematics 2022, 10, 2668. [Google Scholar] [CrossRef]
  5. Mistry, H.K.; Lombardi, D. Pricing Risk-Based Catastrophe Bonds for Earthquakes at an Urban Scale. Sci. Rep. 2022, 12, 9729. [Google Scholar] [CrossRef]
  6. Franco, G. Minimization of Trigger Error in Cat-In-a-Box Parametric Earthquake Catastrophe Bonds with an Application to Costa Rica. Earthq. Spectra 2010, 26, 983–998. [Google Scholar] [CrossRef]
  7. Tang, Q.; Yuan, Z. Cat Bond Pricing under a Product Probability Measure with Pot Risk Characterization. ASTIN Bull. 2019, 49, 457–490. [Google Scholar] [CrossRef] [Green Version]
  8. Grossi, P.; Kunreuther, H. Catastrophe Modeling: A New Approach to Managing Risk; Springer Science + Business Media, Inc.: Boston, MA, USA, 2005. [Google Scholar]
  9. Goda, K.; Franco, G.; Song, J.; Radu, A. Parametric Catastrophe Bonds for Tsunamis: Cat-in-a-Box Trigger and Intensity-Based Index Trigger Methods. Earthq. Spectra 2019, 55, 113–136. [Google Scholar] [CrossRef]
  10. Mamon, R. Three Ways to Solve for Bond Prices in the Vasicek Model. J. Appl. Math. Decis. Sci. 2004, 8, 131526. [Google Scholar] [CrossRef]
  11. Samimia, O.; Mehrdoust, F. Vasicek Interest Rate Model under Lévy Process and Pricing Bond Option. Commun. Stat. Simul. Comput. 2022, in press. [Google Scholar] [CrossRef]
  12. Chao, W. Valuing Multirisk Catastrophe Reinsurance Based on the Cox-Ingersoll-Ross (CIR) Model. Discret. Dyn. Nat. Soc. 2021, 2021, 4472–4484. [Google Scholar] [CrossRef]
  13. Chao, W.; Zou, H. Multiple-Event Catastrophe Bond Pricing Based on CIR-Copula-POT Model. Discret. Dyn. Nat. Soc. 2018, 2018, 5068480. [Google Scholar] [CrossRef]
  14. Zimbidis, A.A.; Frangos, N.E.; Pantelous, A.A. Modeling Earthquake Risk via Extreme Value Theory and Pricing the Respective Catastrophe Bonds. ASTIN Bull. 2007, 37, 163–183. [Google Scholar] [CrossRef] [Green Version]
  15. Shao, J.; Pantelous, A.; Papaioannou, A.D. Catastrophe Risk Bonds with Applications to Earthquakes. Eur. Actuar. J. 2015, 1, 113–138. [Google Scholar] [CrossRef]
  16. Gunardi; Setiawan, E.P. Valuation of Indonesian Catastrophic Earthquake Bonds with Generalized Extreme Value (GEV) Distribution and Cox-Ingersoll-Ross (CIR) Interest Rate Model. AIP Conf. Proc. 2015, 1692, 020024. [Google Scholar] [CrossRef]
  17. Orlando, G.; Mininni, R.M.; Bufalo, M. Interest rates calibration with a CIR model. J. Risk Financ. 2019, 20, 370–387. [Google Scholar] [CrossRef]
  18. Burnecki, K.; Kukla, G. Pricing of Zero-Coupon and Coupon Cat Bonds. Appl. Math. 2003, 30, 315–324. [Google Scholar] [CrossRef]
  19. Ma, Z.G.; Ma, C.Q. Pricing Catastrophe Risk Bonds: A Mixed Approximation Method. Insur. Math. Econ. 2013, 52, 243–254. [Google Scholar] [CrossRef]
  20. Ma, Z.; Ma, C.; Xiao, S. Pricing Zero-Coupon Catastrophe Bonds using EVT with Doubly Stochastic Poisson Arrivals. Discret. Dyn. Nat. Soc. 2017, 2017, 3279647. [Google Scholar] [CrossRef] [Green Version]
  21. Deng, G.; Liu, S.; Li, L.; Deng, C.; Yu, W. Research on the Pricing of Global Drought Catastrophe Bonds. Math. Probl. Eng. 2020, 2020, 3898191. [Google Scholar] [CrossRef]
  22. Liu, J.; Xiao, J.; Yan, L.; Wen, F. Valuing Catastrophe Bonds Involving Credit Risks. Math. Probl. Eng. 2014, 2014, 563086. [Google Scholar] [CrossRef] [Green Version]
  23. Härdle, W.K.; Cabrera, B.L. Calibrating CAT bonds for Mexican earthquakes. J. Risk Insur. 2010, 77, 625–650. [Google Scholar] [CrossRef] [Green Version]
  24. Wei, L.; Liu, L.; Hou, J. Pricing hybrid-triggered catastrophe bonds based on copula-EVT model. Quant. Financ. Econ. 2022, 6, 223–243. [Google Scholar] [CrossRef]
  25. Braun, A.; Kousky, C. Catastrophe Bond; Wharton Risk Centre Primer; Wharton University of Pennsylvania, Risk Management and Decision Processes Center: Philadelphia, PA, USA, 2021; pp. 1–10. [Google Scholar]
  26. Anggraeni, W.; Supian, S.; Sukono; Halim, N.B.A. Earthquake Catastrophe Bond Pricing Using Extreme Value Theory: A Mini-Review Approach. Mathematics 2022, 10, 4196. [Google Scholar] [CrossRef]
  27. Selim, K.S.; Elanany, G.A. A new method for short multivariate fuzzy time series based on genetic algorithm and fuzzy clustering. Adv. Fuzzy Syst. 2013, 2013, 494239. [Google Scholar] [CrossRef] [Green Version]
  28. Ansari, E.M.; Caldera, H.J.; Heshami, S.; Moshahedi, N.; Wirasinghe, S.C. The Severity of Earthquake Events—Statistical Analysis and Classification. Int. J. Urban Sci. 2017, 20, 4–24. [Google Scholar] [CrossRef]
  29. Asef, M.R. Modelling the Elements of Country Vulnerability to Earthquake Disasters. Disasters 2008, 32, 480–498. [Google Scholar] [CrossRef] [PubMed]
  30. Ansari, K.; Bae, T.S. Clustering Analysis of Seismicity in The Space–Time–Depth–Magnitude Domain Preceding the 2016 Kumamoto Earthquake, Southwestern Japan. Int. J. Earth Sci. 2021, 110, 253–261. [Google Scholar] [CrossRef]
  31. Murnane, R.J.; Daniell, J.E.; Schafer, A.M.; Ward, P.J.; Winsemius, H.C.; Simpson, A.; Tijssen, A.; Toro, J. Future Scenarios for Earthquake and Flood Risk in Eastern Europe and Central Asia. Earth’s Future 2017, 5, 693–714. [Google Scholar] [CrossRef]
  32. Murnane, R.; Simpson, A.; Jongman, B. Understanding Risk: What Makes a Risk Assessment Successful. Int. J. Disaster Resil. Built Environ. 2016, 7, 186–200. [Google Scholar] [CrossRef]
  33. Yuan, C.; Yang, H. Research on K-Value Selection Method of K-Means Clustering Algorithm. J. Multidiscip. Sci. J. 2019, 2, 226–235. [Google Scholar] [CrossRef] [Green Version]
  34. Bai, L.; Cheng, X.; Liang, J.; Shen, H.; Guo, Y. Fast density clustering strategies based on the k-means algorithm. Pattern Recognit. 2017, 71, 375–386. [Google Scholar] [CrossRef]
  35. Arora, P.; Deepali; Varshney, S. Analysis of K-Means and K-Medoids Algorithm for Big Data. Phys. Procedia 2015, 78, 507–512. [Google Scholar] [CrossRef] [Green Version]
  36. Vercelliss, C. Business Intelligence: Data Mining and Optimization for Decision Making; John Wiley & Sons: Milan, Italy, 2009. [Google Scholar] [CrossRef]
  37. Cummins, J.D. CAT bonds and other risk-linked securities: State of the Market and Recent Developments. Risk Manag. Insur. Rev. 2008, 11, 23–47. [Google Scholar] [CrossRef]
  38. Vakili, W.; Ghaffari-Hadigheh, A. CAT Bond Pricing in Uncertain Environment. Iran. J. Manag. Stud. 2022, 15, 347–364. [Google Scholar] [CrossRef]
  39. Marvi, M.T.; Linders, D. Decomposition of Natural Catastrophe Risks: Insurability using Parametric CAT Bonds. Risks 2021, 9, 215. [Google Scholar] [CrossRef]
  40. Shao, J.; Papaioannou, A.D.; Pantelous, A.A. Pricing and Simulating Catastrophe Risk Bonds in a Markov-Dependent Environment. Appl. Math. Comput. 2017, 309, 68–84. [Google Scholar] [CrossRef] [Green Version]
  41. Zhao, Y.; Yu, M.T. Predicting catastrophe risk: Evidence from Catastrophe Bond Markets. J. Bank. Financ. 2020, 121, 105982. [Google Scholar] [CrossRef]
  42. Hofer, L.; Gardoni, P.; Zanini, M.A. Risk-Based CAT Bond Pricing Considering Parameter Uncertainties. Sustain. Resil. Infrastruct. 2021, 6, 315–329. [Google Scholar] [CrossRef]
  43. Cox, S.H.; Pedersen, H.W. Catastrophe Risk Bonds. N. Am. Actuar. J. 2000, 4, 56–82. [Google Scholar] [CrossRef]
  44. Patil, V.; Atrey, P.K. GeoSecure-R: Secure Computation of Geographical Distance using Region-anonymized GPS Data. In Proceedings of the 2020 IEEE Sixth International Conference on Multimedia Big Data (BigMM), New Delhi, India, 24–26 September 2020; pp. 28–36. [Google Scholar] [CrossRef]
  45. Aki, K. Maximum Likelihood Estimate of b in the formula Log N=a-bM and its Confidence Limits. Bull. Earthq. Res. Inst. 1965, 43, 237–239. [Google Scholar]
  46. Utsu, T. A Statistical Significance Test of The Difference in b-Value between Two Earthquake Groups. J. Phys. Earth. 1966, 14, 37–40. [Google Scholar] [CrossRef]
  47. Aki, K. A Probabilistic Synthesis of Precursory Phenomena. Maurice Ewing Ser. 1981, 4, 566–574. [Google Scholar]
  48. Bataineh, K.M.; Naji, M.; Saqer, M. A Comparison Study between Various Fuzzy Clustering Algorithms. Jordan J. Mech. Ind. Eng. 2011, 5, 335–343. [Google Scholar]
  49. Syakur, M.A.; Khotimah, B.K.; Rochman, E.M.S.; Satoto, B.D. Integration K-Means Clustering Method and Elbow Method for Identification of the Best Customer Profile Cluster. IOP Conf. Ser. Mater. Sci. Eng. 2018, 336, 012017. [Google Scholar] [CrossRef] [Green Version]
  50. Weatherill, G.; Burton, P.W. Delineation of Shallow Seismic Source Zones Using K-means Cluster Analysis, with application to the Aegean region. Geophys. J. Int. 2009, 176, 565–588. [Google Scholar] [CrossRef] [Green Version]
  51. Echaust, K.; Just, M. Value at Risk Estimation Using The Garch-evt Approach with Optimal Tail Selection. Mathematics 2020, 8, 114. [Google Scholar] [CrossRef] [Green Version]
  52. Bermudez, D.Z.P.; Kotz, S. PARAMETER Estimation of the Generalized Pareto Distribution—Part I. J. Stat. Plan. Inference 2010, 140, 1353–1373. [Google Scholar] [CrossRef]
  53. Chen, W.; Yang, R.; Yao, D.; Long, C. Pareto Parameters Estimation Using Moving Extremes Ranked Set Sampling. Stat. Pap. 2019, 62, 1195–1211. [Google Scholar] [CrossRef]
  54. Martins, A.L.A.; Liska, G.R.; Beijo, L.A.; de Menezes, F.S.; Cirillo, M.A. Generalized Pareto Distribution Applied to the Analysis of Maximum Rainfall Events in Uruguaiana, RS, Brazil. SN Appl. Sci. 2020, 2, 1479. [Google Scholar] [CrossRef]
  55. Ghosh, I.; Watts, D.; Chakraborty, S. Modeling Bivariate Dependency in Insurance Data via Copula: A Brief Study. J. Risk Financ. Manag. 2022, 15, 329. [Google Scholar] [CrossRef]
  56. Zhang, S.; Wang, P.; Wang, D.; Zhang, Y.; Ji, R.; Cai, F. Identification and Risk Characteristics of Agricultural Drought Disaster Events Based on the Copula Function in Northeast China. Atmosphere 2022, 13, 1234. [Google Scholar] [CrossRef]
  57. Dogan, M.; Karakas, A.M. Archimedean Copula Parameter Estimation with Kendall Distribution Function. J. Inst. Sci. Technol. 2017, 7, 187–198. [Google Scholar] [CrossRef]
  58. Shing, S.R. A simple method of forecasting based on fuzzy time series. Appl. Math. Comput. 2007, 186, 330–339. [Google Scholar] [CrossRef]
  59. Singh, S.R. A computational method of forecasting based on fuzzy time series. Math. Comput. Simul. 2008, 79, 539–554. [Google Scholar] [CrossRef]
  60. Zangeneh, S.Z.; Little, R.J.A. Bayesian inference for the finite population total from a heteroscedastic probability proportional to size sample. J. Surv. Stat. Methodol. 2015, 3, 162–192. [Google Scholar] [CrossRef]
  61. Ross, S.M. Introduction to Probability Models, 10th ed.; Elsevier: Berkeley, CA, USA, 2010. [Google Scholar] [CrossRef]
  62. DeMets, C.; Gordon, R.G.; Argus, D.F. Geologically current plate motions. Geophys. J. Int. 2010, 81, 1–80. [Google Scholar] [CrossRef] [Green Version]
  63. Supendi, P.; Nugraha, A.D.; Puspito, N.T.; Widiyantoro, S.; Daryono, D. Identification of active faults in West Java, Indonesia, based on earthquake hypocenter determination, relocation, and focal mechanism analysis. Geosci. Lett. 2018, 5, 31. [Google Scholar] [CrossRef]
  64. Asuransi Maypark, P.T. The West Sumatra and the West Java Earthquake of 30 September 2009 and 2 September 2009 Board of Advisors Board of Editors. Waspada 2010, 13. Available online: https://www.maipark.com/assets/uploads/bulletin_waspada/13-maipark-waspada-feb-10-english.pdf (accessed on 1 November 2022).
  65. Republik Indonesia. Nota Keuangan dan Anggaran Pendapatan Belanja Negara Tahun Anggaran 2010. 2010. Available online: https://anggaran.kemenkeu.go.id/assets/FTPPortal/Peraturan/NK%20UU%20APBN%20Lapsem/NK%20APBN%202010.pdf (accessed on 1 November 2022).
  66. Mellado, J.L.A.; Esteban, A.M.; Álvarez, F.M. Mapping of Seismic Parameters of the IBERIAN Peninsula by Means of a Geographic Information System. Cent. Eur. J. Oper. Res. 2018, 26, 739–758. [Google Scholar] [CrossRef]
  67. Mogi, K. Magnitude-Frequency Relation for Elastic Shocks Accompanying Fractures of Various Materials and Some Related Problems in Earthquakes (2nd Paper). Bull. Earthq. Res. Inst. 1962, 40, 831–853. [Google Scholar]
  68. Kamer, Y.; Hiemer, S. Data-Driven Spatial b Value Estimation with Applications to California seismicity: To b or not to b. J. Geophys. Solid Earth 2015, 120, 2191–5214. [Google Scholar] [CrossRef]
  69. Singh, C.; Singh, S. Imaging b-Value Variation Beneath the Pamir-Hindu Kush region. Bull. Seismol. Soc. Am. 2015, 105, 808–815. [Google Scholar] [CrossRef]
  70. Chan, C.H.; Wu, Y.M.; Tseng, T.L.; Lin, T.L.; Chen, C.C. Spatial and Temporal Evolution of b-Values before Large Earthquakes in Taiwan. Tectonophysics 2012, 532–535, 215–222. [Google Scholar] [CrossRef] [Green Version]
  71. Scholz, C.H. The frequency-magnitude relation of microfracturing in rock and its relation to earthquakes. Bull. Seismol. Soc. Am. 1968, 58, 399–415. [Google Scholar] [CrossRef]
  72. Wyss, M. Towards a Physical Understanding of the Earthquake Frequency Distribution. Geophys. J. R. Astron. Soc. 1973, 31, 341–359. [Google Scholar] [CrossRef] [Green Version]
  73. Srivastava, K.; Rani, S.; Srinagesh, D. A review of b-Value Imaging and Fractal Dimension Studies in the Andaman Sumatra subduction. Nat. Hazards 2015, 77, S97–S107. [Google Scholar] [CrossRef]
  74. Ozer, N.; Ceylan, S. Fractal Properties and Simulation of Micro-Seismicity for Seismic Hazard Analysis: A Comparison of North Anatolian and San Andreas Fault Zones. Res. Geophys. 2012, 2, e1. [Google Scholar] [CrossRef] [Green Version]
  75. Tosi, P. Seismogenic Structure Behaviour Revealed by Spatial Clustering of Seismicity in the Umbria-Marche Region (Central Italy). Ann. Geophys. 2021, 41, 215–224. [Google Scholar] [CrossRef]
  76. Ibrahim, R.A.; Sukono; Napitupulu, H. Multiple-Trigger Catastrophe Bond Pricing Model and Its Simulation Using Numerical Methods. Mathematics 2022, 10, 1363. [Google Scholar] [CrossRef]
  77. Sukono; Ibrahim, R.A.; Saputra, M.P.A.; Hidayat, Y.; Juahir, H.; Prihanto, I.G.; Halim, N.B.A. Modeling Multiple-Event Catastrophe Bond Prices Involving the Trigger Event Correlation, Interest, and Inflation Rates. Mathematics 2022, 10, 4685. [Google Scholar] [CrossRef]
Figure 1. Number of CAT BONDs issued annually from 1996 to October 2022, source: www.artemis.bm (accessed on 20 October 2022), data processed using Rstudio.
Mathematics 11 00689 g001
Figure 2. Selection of the optimal number of clusters using the elbow method.
Mathematics 11 00689 g002
Figure 3. The diagram of coupon cash flow until time maturity T .
Mathematics 11 00689 g003
Figure 4. (a) earthquake depth (b) earthquake magnitude in West Java Province from 2009 to 2021, the depth and magnitude of earthquakes are shown on blue circles each year.
Mathematics 11 00689 g004
Figure 5. West Java Province EDRI Score (Source: BNPB).
Mathematics 11 00689 g005
Figure 6. The clustering results using EDRI categories.
Mathematics 11 00689 g006
Figure 7. The final clustering using EDRI categories.
Mathematics 11 00689 g007
Figure 8. (a) The optimal number of clusters for the medium EDRI category (The blue arrow indicates the optimal number of clusters); (b) The optimal number of clusters for high EDRI in cluster type I (The red arrow indicates the optimal number of cluster).
Mathematics 11 00689 g008
Figure 9. The final results of zone division use clustering type I.
Mathematics 11 00689 g009
Figure 10. (a) Boxplot for the medium EDRI (b) Boxplot for the high EDRI.
Mathematics 11 00689 g010
Figure 11. (a) The optimal number for the medium EDRI (the blue arrow indicates the optimal numbers of clusters) (b) The optimal number for the high EDRI (the red arrow indicates the optimal numbers of clusters).
Mathematics 11 00689 g011
Figure 12. The results of dividing the zones of West Java Province use clustering of type II.
Mathematics 11 00689 g012
Figure 13. The earthquake magnitude return level in Cluster Type I.
Mathematics 11 00689 g013
Figure 14. The earthquake magnitude return level in Cluster Type II.
Mathematics 11 00689 g014
Figure 15. The plot of joint density function cluster type I.
Mathematics 11 00689 g015
Figure 16. Plot of joint density function in Cluster Type II.
Mathematics 11 00689 g016
Figure 17. Actual vs. forecasting of the interest rate using FTSS.
Mathematics 11 00689 g017
Figure 18. Actual vs. forecasting of the coupon rate using FTSS.
Mathematics 11 00689 g018
Figure 19. SEB Price based on seismic information in cluster types I and II with e = 0.05 ,   P V = I D R   1,000,000 ,   T = 1 , 2 , 3 , 4 , 5 .
Mathematics 11 00689 g019
Figure 20. SEB price based on return level in cluster type II with e = 0.05 ,   P V = I D R   1,000,000 ,   T = 1 , 2 , 3 , 4 , 5 ,   R e t u r n P e r i o d = 10 , 20 , 50 , 100 , 200 , 500 , 10,000 .
Mathematics 11 00689 g020
Figure 21. SEB price based on seismic information in Cluster Type II with F V = I D R   1,000,000 ,   T = 3 ,   A ( C t ) = I D R   9167 .
Mathematics 11 00689 g021
Figure 22. The SEB price based on seismic information in Cluster Type II with F V = I D R   1,000,000 ,   T = 3 ,   A ( R t ) = 0.048 .
Mathematics 11 00689 g022
Table 1. Ritcher scale of earthquake magnitude.
Magnitude Level (SR)CategoryEffect
1.0–2.9MicroGenerally not felt by people, though recorded on local instrument
3.0–3.9MinorFelt by many people; no damage
4.0–4.9LightFelt by all; minor breakage of objects
5.0–5.9ModerateSome damage to weak structures
6.0–6.9StrongModerate damage in populated areas
7.0–7.9MajorSerious damage over large areas; loss of life
> 8 greatSevere destruction and loss of life over large areas
Source: https://www.britannica.com/science/Richter-scale, accesed on 1 November 2022.
Table 2. Archimedean Copula class.
Copula Class Generator   γ ( t z ) C ( m z * , d z * ) τ z Description
Clayton 1 θ z ( t z θ z 1 ) m z * θ z + d z * θ z 1 1 θ z θ z θ z   +   2 θ z 0
Frank ln e θ z 1 e θ z t z 1 1 θ z ln 1 + e θ z m z * 1 e θ z d z * 1 e θ z 1 1 4 θ z 1 D 1 ( θ z ) θ z 0
Gumbel ( ln ( t z ) ) θ z e ln m z * θ z + ( ln d z * ) θ z 1 θ z θ z 1 θ z θ z 1
Table 3. The results of clustering subregions based on EDRI.
EDRI CategoryMember of Cluster
HighBanjar City, Tasikmalaya City, Sukabumi Regency, Bekasi City, Bandung Regency, Purwakarta Regency, Tasikmalaya Regency, Sukabumi City, Cirebon City, Bogor Regency, Depok City, West Bandung Regency, Cianjur Regency, Garut Regency, and Bandung City
MediumSumedang Regency, Kuningan Regency, Cimahi City, Majalengka Regency, Ciamis Regency, Subang Regency, Pangandaran Regency, Karawang Regency, Bogor City, Bekasi Regency, and Cirebon Regency
LowIndramayu Regency
Table 4. The result of KS test, and the value of b , b , k , M ¯ , D ¯ ,   η ¯ .
Subregion D C o u n t D ( α = 0.01 ) b b k M ¯ D ¯ η ¯
Indramayu0.1230.4491.1650.5061.0123.7620513.55
Sumedang0.1620.5131.8750.8141.6283.4397.4412.36
Kuningan0.1300.5131.2000.5211.0423.7363.3310.35
Majalengka0.2140.5130.8570.3720.7444.07135.228.60
Ciamis0.1290.6172.7781.2062.4123.26185.4015.46
Subang0.1680.4861.3700.5951.1903.63109.4010.39
Karawang0.3250.4681.2640.5491.0983.69155.819.85
Tasikmalaya0.2070.3440.7610.3300.6614.2188.487.85
Bekasi0.1430.5421.1430.4960.9933.78196.259.41
Bandung0.0940.2542.0300.8811.7633.3954.6312.43
Purwakarta0.2820.6171.8180.7891.5793.4543.3312.71
Cirebon0.1160.7341.5380.6681.3363.55156.7513.28
Bogor0.070.2881.6750.7271.4553.5087.3411.13
Cianjur0.1000.2881.2650.5491.0983.6992.979.62
Garut0.0890.1841.4690.6381.2763.5848.0710.1
Sukabumi0.0760.2521.6940.7351.4713.4930.9711.15
Table 5. The results of clustering type I.
EDRI CategoryClusterCentre PointMember of Cluster
M ¯ D ¯ η ¯
Medium13.59790.05711.033Sumedang, Kuningan, Subang
23.673158.81011.303Majalengka, Ciamis, Karawang
High13.61663.68410.713Tasikmalaya, Bandung, Purwakarta, Bogor, Cianjur, Garut, Sukabumi
23.665176.50011.345Bekasi and Cirebon
Table 6. The results of zone division in West Java Province use clustering of type I.
ZoneMember of Cluster
1Indramayu
2Majalengka, Ciamis, Karawang
3Sumedang, Kuningan, Subang
4Bekasi dan Cirebon
5Tasikmalaya, Bandung, Purwakarta, Bogor, Cianjur, Garut, Sukabumi
Table 7. The results of clustering type II in the medium and high EDRI.
EDRI CategoryClusterCentre Member of Cluster
M ¯ D ¯ η ¯
Medium13.4397.4412.36Sumedang, Kuningan, Subang
23.69155.819.85Majalengka, Ciamis, Karawang
High14.2188.487.85Tasikmalaya, Bogor, Cianjur
23.55156.7513.28Bekasi, Cirebon
33.4543.3312.71Bandung, Purwakarta, Garut, Sukabumi
Table 8. The results of dividing the zones of West Java Province using clustering of type II.
ZoneMember of Cluster
1Indramayu
2Majalengka, Ciamis, Karawang
3Sumedang, Kuningan, Subang
4Bekasi, Cirebon,
5Bandung, Purwakarta, Garut, Sukabumi
6Tasikmalaya, Bogor, Cianjur
Table 9. The result of the parameter estimation and the KS test based on Cluster Type I.
ZoneParameter ValueDomainStatistical Value Critical   Value   ( α = 0.01 )
κ ^ z σ ^ z μ ^ z
1−0.657751.50532.8503 2.8503 M 1 * 5.138 0.1060.449
2−0.542251.40892.8265 2.8265 M 2 * 5.424 0.1300.316
3−0.273050.855872.9277 2.9277 M 3 * 6.062 0.0910.299
4−0.348621.0512.9207 2.9207 M 4 * 5.935 0.1530.449
50.039960.59012.9734 M 5 * 2.9734 0.0750.103
Table 10. The CDF of GPD in Cluster Type II.
Zone F M z * κ ^ z , ξ ^ z , σ ^ z
1 1 1 0.65775 m 1 * 2.8503 1.53053 1.520334
2 1 1 0.54225 m 2 * 2.8265 1.4089 1.844168
3 1 1 0.27305 m 3 * 2.9277 0.85587 3.662333
4 1 1 0.34862 m 4 * 2.9207 1.051 2.868453
5 1 1 0.5901 m 5 * 2.9734 0.5901 25.025
Table 11. The result of the parameter estimation and the KS test in Cluster Type II.
ZoneParameter ValueDomainStatistical Value Critical   Value   ( α = 0.01 )
κ ^ z σ ^ z μ ^ z
1−0.657751.50532.8503 2.8503 M 1 * 5.138 0.1060.449
2−0.542251.40892.8265 2.8265 M 2 * 5.424 0.1300.316
3−0.273050.855872.9277 2.9277 M 3 * 6.062 0.0910.299
4−0.348621.0512.9207 2.9207 M 4 * 5.935 0.419180.44905
5−0.158520.627272.9657 2.9657 M 5 * 6.922 0.08190.12606
60.131070.692892.9496 M 6 * 2.9496 0.071450.17421
Table 12. The CDF of GPD in Cluster Type II.
Zone F M z * κ ^ z , ξ ^ z , σ ^ z
1 1 1 0.65775 m 1 * 2.8503 1.53053 1.520334
2 1 1 0.54225 m 2 * 2.8265 1.4089 1.844168
3 1 1 0.27305 m 3 * 2.9277 0.85587 3.662333
4 1 1 0.34862 m 4 * 2.9207 1.051 2.868453
5 1 1 15852 m 5 * 2.9657 0.62727 0.630835
6 1 1 + 0.13107 m 6 * 2.9496 0.69289 25.0253
Table 13. Earthquake magnitude return level in Cluster Type I.
Zone1020501002005001000
14.634.824.965.035.065.15.11
24.674.925.115.215.285.345.36
34.394.684.985.175.325.485.59
44.584.875.165.335.465.595.66
54.394.855.475.956.457.137.66
Table 14. The earthquake magnitude return level in Cluster Type II.
Zone1020501002005001000
14.634.824.965.035.065.15.11
24.674.925.115.215.285.345.36
34.394.684.985.175.325.485.59
44.584.875.165.335.465.595.66
54.184.464.795.025.215.455.60
64.815.496.497.338.259.6010.74
Table 15. Parameter estimation results and AIC values in Cluster Type I.
ZoneDistribution θ ^ z τ z LoglikeAIC Value
1Clayton1.040.341.53−1.05
Gumbel1.430.30.770.47
Frank3.230.331.28−0.55
2Clayton1.360.414.49−6.98
Gumbel1.590.373−4.01
Frank3.910.383.71−5.42
3Clayton0.520.210.550889
Gumbel1.230.190.730.53
Frank1.450.160.580.85
4Clayton0.360.150.171.67
Gumbel1.030.030.001.99
Frank0.550.060.041.93
5Clayton0.320.143.05−4.11
Gumbel1.10.092.36−2.71
Frank1.120.124.05−6.11
Table 16. The joint CDF of magnitude and depth of earthquakes in Cluster Type I.
ZoneCumulative Distribution Function
1 m 1 * 1.04 + d 1 * 1.04 1 0.96
2 m 2 * 1.36 + d 2 * 1.36 1 0.73
3 e ln m 3 * 1.23 + ln d 3 * 1.23 0.81
4 m 4 * 0.36 + d 4 * 0.36 1 2.78
5 1 0.89 ln 1 + e 1.12 m 6 * 1 e 1.12 d 6 * 1 e 1.12 1
Table 17. Parameter estimation results and AIC values in Cluster Type II.
ZoneDistribusi θ ^ z τ z LoglikeNilai AIC
1Clayton1.040.341.53−1.05
Gumbel1.430.30.770.47
Frank3.230.331.28−0.55
2Clayton1.360.414.49−6.98
Gumbel1.590.373−4.01
Frank3.910.383.71−5.42
3Clayton0.520.210.550.889
Gumbel1.230.190.730.53
Frank1.450.160.580.85
4Clayton0.360.150.171.67
Gumbel1.030.030.001.99
Frank0.550.060.041.93
5Clayton0.01002.00
Gumbel1002.00
Frank0.120.0101.94
6Clayton0.840.37.75−13.50
Gumbel1.230.192.59−3.18
Frank2.430.255.96−9.93
Table 18. The joint cumulative distribution function of magnitude and depth of earthquakes in Cluster Type II.
Zona F ( M z * , D z * )
1 m 1 * 1.04 + d z * 1.04 1 0.96
2 m 2 * 1.36 + d 2 * 1.36 1 0.73
3 e ln m 3 * 1.23 + ln d 3 * 1.23 0.81
4 m 4 * 0.36 + d 4 * 0.36 1 2.78
5 8.33 ln 1 + e 0.12 m 5 * 1 e 0.12 d 5 * 1 e 0.12 1
6 m 6 * 0.84 + d 6 * 0.84 1 1.19
Table 19. Interest rate linguistic variable.
A 1 The lowest interest rate
A 2 lower interest rate
A 3 Low interest rate
A 4 Below-average interest rate
A 5 Average interest rate
A 6 Upper-interest rate
A 7 High-interest rate
A 8 Higher interest rate
A 9 The highest coupon rate
Table 20. Forecasting the interest rate at T = 1 , 2 , 3 , 4 , 5 .
r ^ 1 r ^ 2 r ^ 3 r ^ 4 r ^ 5
Prediction3.4293.3923.3703.3563.347
Table 21. The coupon rate linguistic variable.
A 1 The lowest coupon rate
A 2 Lower coupon rate
A 3 low coupon rate
A 4 Below average coupon rate
A 5 Average coupon rate
A 6 Upper coupon rate
A 7 High coupon rate
A 8 Higher coupon rate
A 9 The highest coupon rate
Table 22. Forecasting the coupon rate for T = 1 , 2 , 3 , 4 , 5 .
Year c ^ 1 c ^ 2 c ^ 3 c ^ 4 c ^ 5
Prediction0.6450.6530.6580.6620.663
Table 23. The calculated probability of type I and type II earthquakes in cluster type I.
ProbabilityZone
Z 1 Z 2 Z 3 Z 4 Z 5
P ( E 1 | G z ) 0.00130.00110.00100.00250.0010
P ( E 2 | G z ) 0.99870.99890.99900.99750.9990
Table 24. The Calculated Probability of Type I and Type II Earthquakes in Cluster Type II.
ProbabilityZone
Z 1 Z 2 Z 3 Z 4 Z 5 Z 6
P ( E 1 | G z ) 0.00130.00110.00100.00100.00100.0010
P ( E 2 | G z ) 0.99870.99890.99900.99900.99900.9990
Table 25. The calculated P ( T 1 > t ) in cluster type I and II.
Cluster Type P ( T 1 > 1 ) P ( T 1 > 2 ) P ( T 1 > 3 ) P ( T 1 > 4 ) P ( T 1 > 5 )
I0.973710.948100.923170.898900.87527
II0.973980.9486360.9239520.8999110.876495
Table 26. The calculated result of expectation coupon amount with time maturities 1, 2, 3, 4, and 5 years (IDR).
Cluster Type T = 1 T = 2 T = 3 T = 4 T = 5
I31406196916112,03514,816
II31416198916712,04614,831
Table 27. The calculated result of the expected interest rate with time maturities 1, 2, 3, 4, and 5 years (in %).
Cluster Type T = 1 T = 2 T = 3 T = 4 T = 5
I1.6693.2694.8036.2787.6961
II1.6703.2704.8076.2847.704
Table 28. The calculated result of probability type- i and expectation of face amount for clustering type I.
Earthquake TypeZone 1Zone 2Zone 3Zone 4Zone 5 P ( Q i ) f i f i × P ( Q i )
10.50000.50000.50000.50000.50000.51,000,000500,000
20.02760.02630.03520.0309850.0342020.033900,00029,700
30.03920.04180.03590.0346690.0340690.035800,00028,000
40.03320.03190.02880.0343470.0317280.032700,00022,400
50.03480.03530.03780.0679750.0367650.038600,00022,800
60.03800.04020.03560.0341180.0338810.035500,00017,500
70.02720.02460.02660.0320250.0293540.029400,00011,600
80.04510.04840.04050.0377930.0394040.04300,00012,000
90.03450.03490.03500.0331260.0335090.034200,0006800
100.02050.01680.02450.0290810.0270870.026100,0002600
110.20000.20000.20000.20000.20000.200
The face amount expectation653,400
Table 29. The calculated result of probability type- i and expectation of face amount for clustering type II.
Earthquake TypeZone 1Zone 2Zone 3Zone 4Zone 5Zone 6 P ( Q i ) f i f i × P ( Q i )
10.50000.50000.50000.50000.50000.50000.51,000,000500,000
20.02760.02630.03520.03100.03350.02850.031900,00027,900
30.03920.04180.03590.03470.03330.03770.036800,00028,800
40.03320.03190.02880.03430.03320.03380.033700,00023,100
50.03480.03530.03780.03390.03370.03450.034600,00020,400
60.03800.04020.03560.03410.03330.03670.035500,00017,500
70.02720.02460.02660.03200.03290.02880.031400,00012,400
80.04510.04840.04050.03780.03400.04300.038300,00011,400
90.03450.03490.03500.03310.03330.03410.034200,0006800
100.02050.01680.02450.02910.03270.02290.028100,0002800
110.20000.20000.20000.20000.20000.20000.200
The expectation face amount651,100
Table 30. SEB price at T = 1, 2, 3, 4, 5 years in the clustering type I and II (IDR).
Clustering TypeSEB Price
T = 1 T = 2 T = 3 T = 4 T = 5
I614,181607,250600,689594,463584,326
II612,027605,126598,591592,387586,483
Disclaimer/Publisher’s Note: The statements, opinions and data contained in all publications are solely those of the individual author(s) and contributor(s) and not of MDPI and/or the editor(s). MDPI and/or the editor(s) disclaim responsibility for any injury to people or property resulting from any ideas, methods, instructions or products referred to in the content.

