Article

Authentication of Counterfeit Hundred Ringgit Malaysian Banknotes Using Fuzzy Graph Method

1
Mathematical Sciences Studies, College of Computing, Informatics, and Media, Universiti Teknologi MARA Cawangan Johor, Kampus Segamat, Segamat 85000, Malaysia
2
Department of Mathematical Sciences, Faculty of Science, Universiti Teknologi Malaysia, Skudai 81310, Malaysia
3
Department of Chemistry, Faculty of Science, Universiti Teknologi Malaysia, Skudai 81310, Malaysia
4
Centre for Sustainable Nanomaterials, Ibnu Sina Institute for Scientific and Industrial Research, Universiti Teknologi Malaysia, Skudai 81310, Malaysia
5
Department of Mathematics, Faculty of Natural and Applied Sciences, Sule Lamido University, 048 SLU Kafin Hausa, Kano 700271, Nigeria
6
Department of Finance, Faculty of Business and Management, Universiti Teknologi MARA Cawangan Johor, Kampus Segamat, Segamat 85000, Malaysia
7
Crime Investigation Department, Sentul District Police Headquarters, Royal Malaysia Police, Kuala Lumpur 51200, Malaysia
*
Authors to whom correspondence should be addressed.
Mathematics 2023, 11(4), 1002; https://doi.org/10.3390/math11041002
Submission received: 22 December 2022 / Revised: 2 February 2023 / Accepted: 13 February 2023 / Published: 16 February 2023
(This article belongs to the Special Issue Graph Theory and Applications)

Abstract

:
A banknote is a currency issued by a country, and it was first introduced in the 16th century. The counterfeiting of banknotes by cunning criminals became a great challenge with the current advanced technology. Forensic scientists are using chemical methods, such as Fourier transform infrared (FTIR) spectroscopy for differentiating genuine and counterfeit banknotes. However, the FTIR spectra of banknotes may require further pattern recognition analysis due to their high similarities. In this paper, a fuzzy graph-based algorithm for authentication of the FTIR spectrum, namely chemometrics fuzzy autocatalytic set (c-FACS), is used to discriminate between genuine and counterfeit hundred Ringgit Malaysian (RM100) banknotes. The results show that the genuine and counterfeit RM100 banknotes have slightly distinct patterns when analyzed using c-FACS. In addition, the results are compared with RM50 banknotes, and the results reveal that the nodes or dominant axis varies between the two banknotes. To verify the reliability of the results, the results obtained via c-FACS are compared with principal component analysis (PCA). The c-FACS showed better performances as compared to PCA in terms of time consumption and observation. Thus, the c-FACS has the ability to assist forensic investigations involving banknote counterfeiting crimes.
MSC:
05C90; 05C85

1. Introduction

Financial crime involving money counterfeiting became a major concern in today’s economies [1,2]. The term counterfeit means the act of illegally duplicating products or items [1]. Money is a medium of exchange that allows people to make transactions and payments, and it evolved into different types of forms. Early units of exchange include shells, bones, stones, and metals [1]. Around the 7th century, China moved from coins to paper money. Later in the 16th century, banks eventually started using paper banknotes, and Sweden was the first country in Europe to issue them in 1661 [1]. In Malaysia, the authority to issue currency is the Bank Negara Malaysia (BNM). The first series of banknotes issued by BNM was in 1967, and later on, the second and third series were introduced in 1982 and 1996, respectively. According to Finlay and Francis [3], counterfeit money always existed alongside physical money. Furthermore, with the advancement of technology, counterfeiters improved their techniques and used sophisticated tools to manufacture counterfeit banknotes [4]. Thus, it is a tremendous challenge for experts and investigators to detect counterfeit banknotes and identify the manufacturers that are responsible for the crime.
Forensic researchers and experts use chemical techniques and algorithms to detect counterfeit banknotes. Bruna et al. [5] utilized infrared-based counterfeit detection to detect counterfeit Euro banknotes. Sonnex et al. [6] used infrared (IR) spectroscopy to discriminate between forged and genuine GBP 20 banknotes. Uddin et al. [7] and Baek et al. [8] used an image-based approach in combination with algorithms using neural network and support vector machine (SVM), respectively, to detect counterfeit banknotes. Itrić and Vukoje [9] applied Fourier transform infrared (FTIR) spectroscopy to authenticate Euro banknotes. Ajid et al. [10] and Hassan et al. [11] both utilized FTIR in combination with statistical and fuzzy graph chemometrics methods, respectively, to discriminate Malaysian Ringgit (RM) banknotes. Hassan et al. [11] introduced a chemometrics fuzzy graph approach for the analysis of RM50 banknotes in their research, and the method showed promising results in discriminating between genuine and counterfeit RM50 banknotes. In this paper, the genuine and counterfeit banknote of the largest denomination of Malaysian Ringgit (RM) RM100, is analyzed using the chemometrics fuzzy graph method, to further investigate and verify the chemical signatures for forensic intelligence.

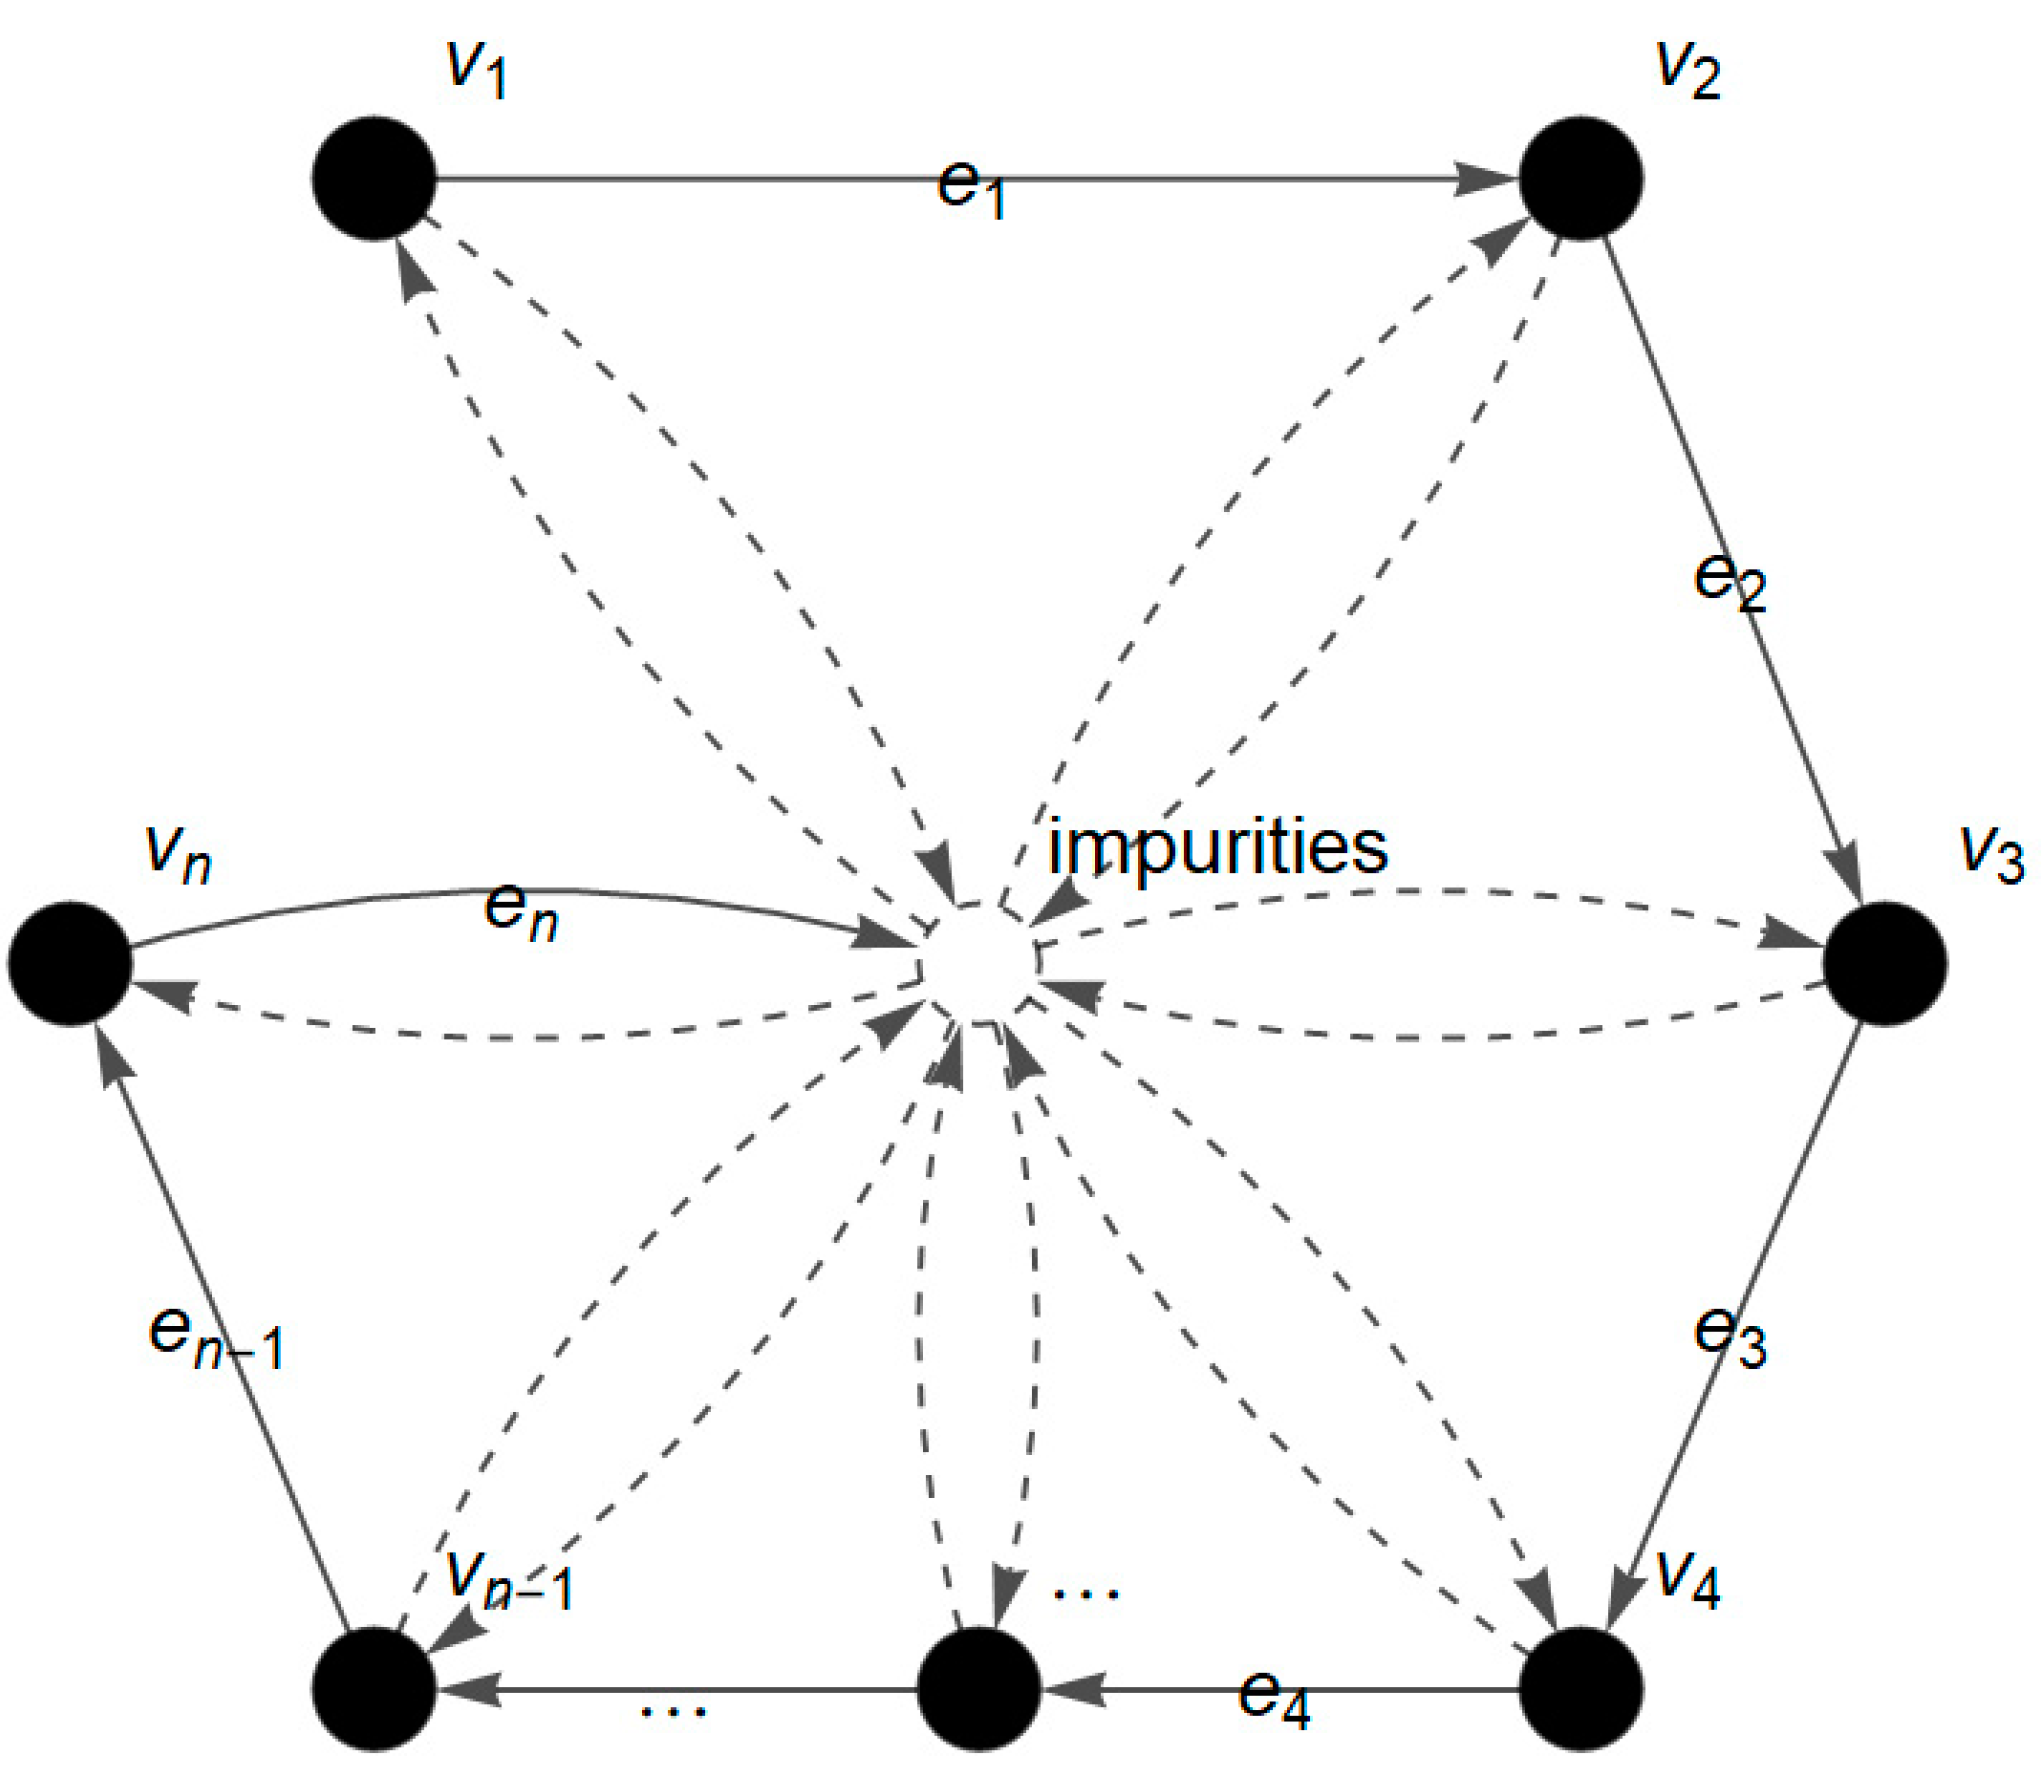
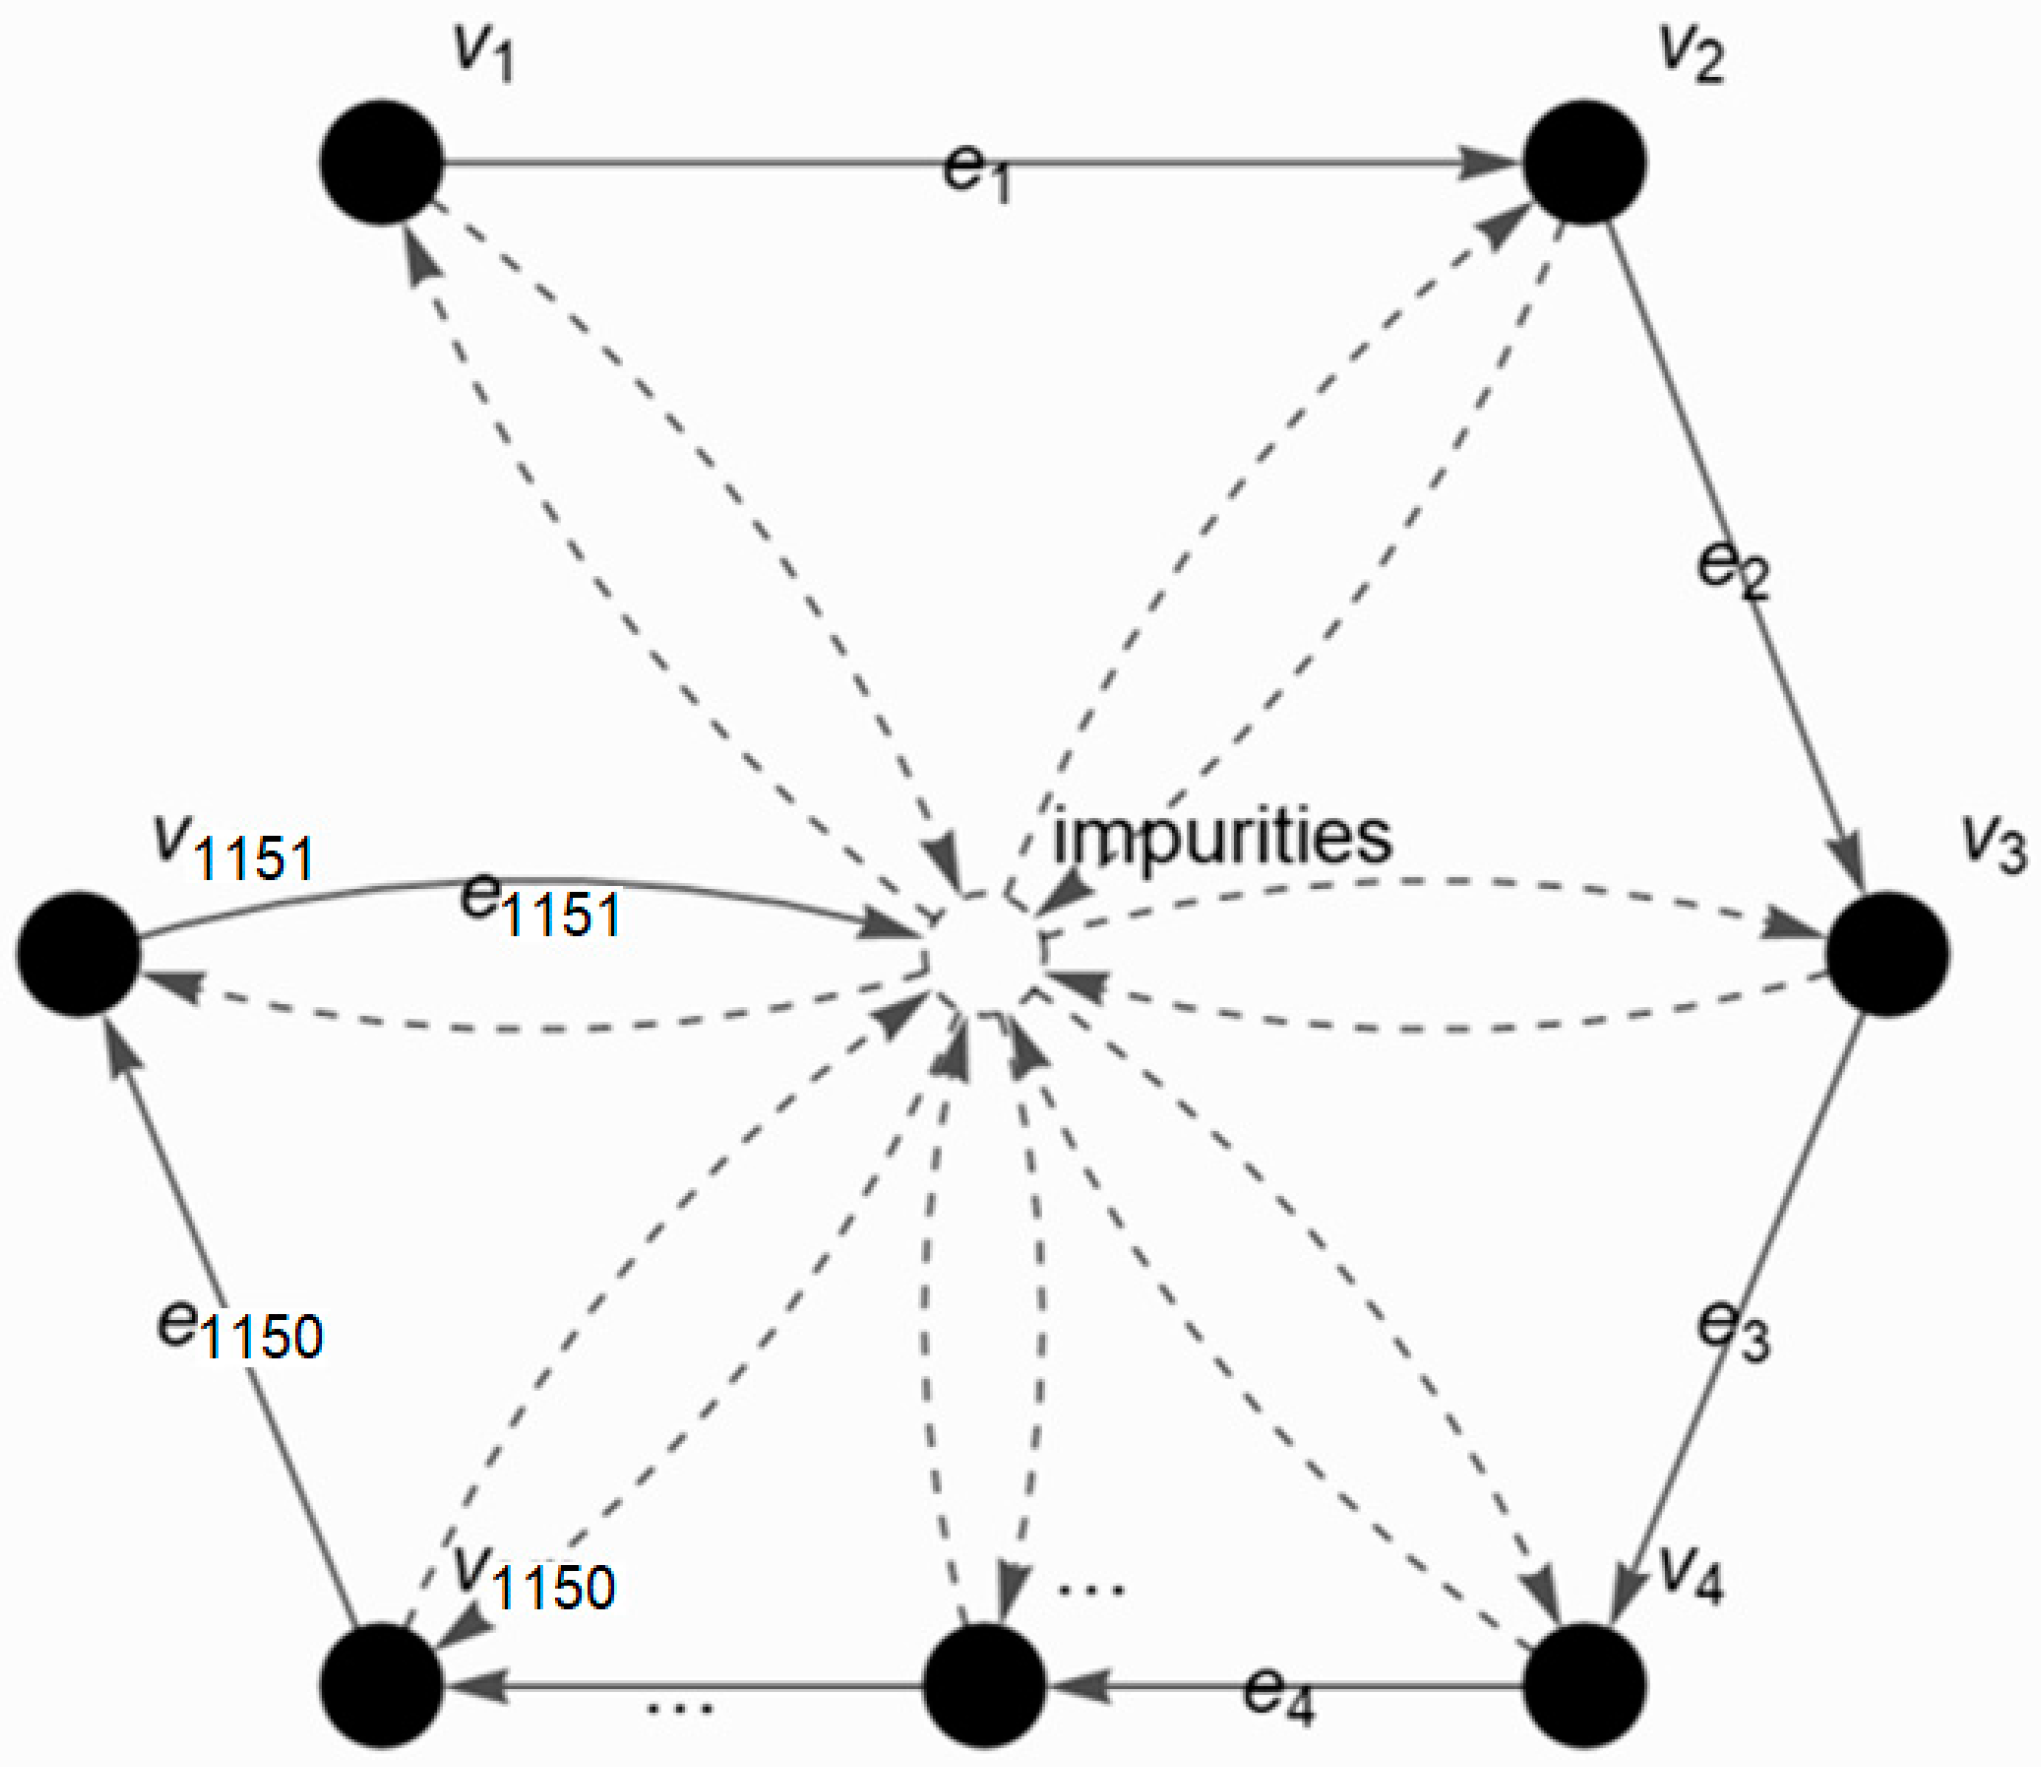
2. Definitions, Methods, and Algorithm

The fuzzy theory was introduced by Zadeh [12], to solve the issue of uncertainty in real-world problems. According to Zadeh [12], elements in a complex system can be characterized by the grade of membership, called membership value. The membership value must be in the closed interval  0 ,   1 . These values describe the strength or weight of the elements in a class or system [12].
Graph theory is a study of points and lines, whereby the lines represent the connection between the points [13]. The formal definition of a graph is given as follows:
Definition 1.
A directed graph  G = ( V , E )  is defined by a set of vertices, V, and a set of edges, E, where each edge represents the ordered pair of vertices.
A graph is a diagram of vertices and edges, whereby the set of vertices and edges can be written as  V = { v 1 , v 2 , v 3 , , v n }  and  E = { e 1 , e 2 , e 3 , , e m } , respectively. The vertices and edges are also known as nodes and links, respectively. The graph can be described in a form of a matrix. The formal definition of the adjacency matrix of a graph by Harary [13] is given as follows:
Definition 2.
The adjacency matrix of a graph, with n vertices, is a   n × n matrix, denoted by,  C = ( c i j ) where:
c i j =   1   if   ( i , j ) E 0   if   ( i , j ) E .
Subsequently, Jain and Krishna [14] defined a different version of the adjacency matrix, whereby  c i j = 1  if and only if there is an incoming link from node j to node i. This version of the adjacency matrix is introduced to represent the matrix of the autocatalytic set (ACS) graph. An ACS graph is a graph in which there exists a directed edge from node j to node i or in other words, node j catalyzes node i. The formal definition of ACS by Jain and Krishna [14] is given as follows:
Definition 3.
An autocatalytic set is a subgraph, each of whose nodes has at least one incoming link from a node belonging to the same subgraph.
A fuzzy graph is a concept that implements the theory of fuzziness on a graph. In 2010, Ahmad et al. [15] implemented the concept of fuzziness into ACS and introduced a fuzzy autocatalytic set (FACS), whereby the links or edges have membership values ranging from 0 to 1. The formal definition of FACS by Ahmad et al. [15] is given as follows:
Definition 4.
A fuzzy autocatalytic set (FACS) is a subgraph each of whose nodes has at least one incoming link with membership value  μ e i 0 , 1 ,     e i E .
The FACS was used to model and solve an incineration process [15] and pressurized water reactor [16] systems. Surely the dynamic and significant components of the systems were identified by the respective researchers.
In 2020, Hassan et al. [17] introduced an advanced form of FACS, namely chemometrics fuzzy autocatalytic set (c-FACS). Chemometrics is a concept that utilized mathematical techniques to analyze a large and complex chemical dataset. Hassan et al. [17] constructed an algorithm that consisted of procedures to convert a large dataset into a FACS graph and its matrix. The algorithm is constructed specifically to assist the analysis of chemical datasets obtained from Fourier transform infrared (FTIR) spectroscopy. The dataset obtained from the FTIR instrument is in the form of a spectrum. The absorbance values at wavenumbers of infrared light from 4000 cm−1–450 cm−1 are recorded and plotted as the spectrum.
The process of absorbance at each wavenumber is modeled in a form of a FACS graph, whereby the set of vertices,  V = { v 1 , v 2 , v 3 , , v n }  represents the wavenumbers (cm−1), while the set of edges,  E = { e 1 , e 2 , e 3 , , e m }  represents the flow sequence of the infrared absorption at the next wavenumbers (see Figure 1). In short, the FACS graph describes the absorption of energy by the molecule at each wavenumber of infrared light from 4000 cm−1 to 450 cm−1, during the FTIR analysis. In addition, the elements of impurities are also included in the FACS graph.
The FACS graph model of FTIR consists of fuzzy vertices and crisp edges. The fuzzy membership function is used to fuzzify the vertices. The readings at each of the wavenumbers or vertices are recorded and converted to fuzzy values from 0 to 1 (see Equation (2)). The fuzzy values of the vertices  μ v i  are computed from the wavenumber values  ( Q i ) , where:
μ v i = 0   if   Q i < 0 1   if   max ( Q i ) for   i = 1 , 2 , 3 , , n Q i / max ( Q i ) others .
The mathematical procedure to convert large and complex data obtained from a chemical instrument to a graph model and fuzzy value was introduced in Figure 1 and Equation (2). This significant contribution could assist in numerous modeling and analysis of complex data, particularly in forensic science for the authentication of samples.
The fuzzy values of the vertices  μ v i  can be described in a form of a matrix for further computation and analyses. In this paper, the matrix is further analyzed to identify the coordinated patterns of the systems. The procedures of the coordinated c-FACS algorithm are given as follows (Algorithm 1):
Algorithm 1 The coordinated c-FACS algorithm
  • Select and import preferred variables as inputs;
  • Build   a   FACS   graph   by   representing   the   variables   as   vertices ,   V = { v 1 , v 2 , v 3 , , v n }   and   their   links   as   edges ,   E = { e 1 , e 2 , e 3 , , e m } ;
  • Describe the fuzzy value for the vertices and edges;
  • Build an n × n adjacency matrix of the graph, with the membership values as the entries;
  • Compute for transition and Laplacian, L matrices;
  • Determine the y-coordinates of FACS by solving Ly = b using the conjugate gradient method;
  • Determine the x-coordinates using the Fiedler vector of Laplacian;
  • Plot the obtained coordinates in Euclidean space;
  • Repeat steps 1 to 8 to analyze another sample or system.
The algorithm is then coded and performed using MATLAB software. Steps 2–3 and 6–8 have the complexity of O (n), while Steps 4–5 have the complexity of O (n2). The complexity of the whole procedure is O (n2). The c-FACS algorithm was applied in the pattern identification analysis of COVID-19 cases in Malaysia [18]. Recently, the c-FACS is progressing towards applications on counterfeiting and forgery problems. Hassan et al. [11] showed that the c-FACS was able to differentiate between genuine and counterfeit fifty-ringgit Malaysian (RM50) banknotes. In this present research, the c-FACS algorithm is implemented to discriminate between genuine and counterfeit RM100 banknotes, particularly to identify their coordinated patterns. The results are compared with the previous analysis on RM50 banknotes by Hassan et al. [11] to strengthen the conclusion on banknotes authentication and to identify the chemical signatures for differentiating the different denominations of Malaysian banknotes.

3. Samples, Instrument, and Acquisition

In this present study, a comparison between the genuine RM100 banknotes  number   of   samples ,   n = 5  obtained from a commercial bank with those of the confiscated counterfeit RM100 banknotes  number   of   samples ,   n = 25  during 2016–2018 by the Commercial Crime Investigation Department (CCID) of the Royal Malaysia Police (RMP) was made without randomization. Hand gloves were used while handling the banknotes to minimize contamination. During each analysis by ATR-FTIR, the metal stage was cleaned using methanol (95% purity). Using a video spectral comparator (VSC40HD) (Foster and Freeman, UK), the physical and optical analyses were made. By adjusting its magnification power ranging from 2.05× to 16×, a comparison of the characteristics of the micro letterings (obverse and reverse sides) of the banknotes with those provided by the BNM was attempted. The status of counterfeit banknotes was established whenever the security features were absent under the UV light. The counterfeit RM100 banknotes were returned to the CCID upon completion of this study.
For acquiring the IR spectra, an ATR-FTIR spectrometer (Perkin-Elmer, Waltham, MA, USA) that was fitted with a zinc selenide crystal accessory and a deuterated triglycine sulphate detector was used. Spectrum 10 software was used to interface the instrument to a desktop computer. Each sample was then scanned (4000 cm−1 to 650 cm−1, resolution: 4 cm−1 with 16 accumulations per sample) using the same 15 selected areas (obverse and reverse sides), as reported in [10]. To guide the analyst, a series of holes (6 mm) that corresponded to the locations on the 15 selected areas were made on a thin plastic template affixed to each sample during the acquisition of the IR spectrum. The IR spectra obtained were then computed in the c-FACS and principal component analysis (PCA).

4. Results and Discussion

4.1. FTIR Analysis

Before carrying out the c-FACS and PCA, comparisons between the IR spectra obtained for the genuine RM100 banknotes are compared with that of counterfeit ones. The extensive results and discussion on the obtained IR spectra are reported in our previous article [10] published earlier. In this paper, the dataset of spectra obtained from the reported article in [10] is modeled and analyzed using the c-FACS method. Furthermore, the results are compared to PCA.

4.2. c-FACS Analysis

The genuine and counterfeit RM100 banknotes spectra obtained from the FTIR analysis are further analyzed using the c-FACS algorithm. The first two steps of the algorithm involve the selection of variables and the modeling of the data in a form of a graph. The general FACS graph model of an FTIR spectrum is shown in Figure 1 earlier. However, due to the large number of wavenumbers in the spectrum, it is suitable to choose only a significant region of wavenumbers to be modeled. The spectrum data of the banknotes at 1800–650 cm−1 wavenumbers region are selected as input and they are represented in a form of a graph (see Figure 2). The set of vertices,  V = { v 1 , v 2 , v 3 , v 4 , , v 1150 , v 1151 }  and the set of edges,  E = { e 1 , e 2 , e 3 , e 4 , , e 1150 , e 1151 }  of the graph, represent the wavenumber’s location and their relations to the subsequent wavenumbers, respectively.
Then, in Steps 3 and 4 of the algorithm, the fuzzy values of the vertices,  μ v i  are computed from the wavenumber values and are arranged in a matrix form. Next, Steps 5 to 8 involve the transformation of the graph model (Figure 3) to a coordinated graph model (Figure 4), in which the exact positions and xy-coordinates of each node are determined through the computation of transition and Laplacian matrices. One graph model represents one sample of banknotes. The steps in the algorithm are repeated and executed until all samples are analyzed. As a result, the coordinated patterns of the spectra of the overall 30 samples of genuine and counterfeit RM100 banknotes are obtained (see Figure 4). The nodes are designated by different colors such that the genuine RM100 banknotes are illustrated in yellowish circles. On the other hand, the counterfeit RM100 banknotes are in bluish squares. Each different color and shape indicates a different graph model of a sample. The whole procedure of the c-FACS algorithm is executed using MATLAB R2017b software.
The coordinated FACS result in Figure 4 shows overlapped patterns of the genuine and counterfeit RM100 banknotes samples. Nevertheless, the clusters and nodes pattern for counterfeit samples are observed mainly on the x-axis from 0.2 to 0.3 and 0.9 to 1.0. Thus, the c-FACS can identify a significant feature for counterfeit samples of RM100 banknotes. However, the significant features of genuine samples are unclear due to the lower number of their samples as compared to the counterfeit ones.
The identified feature of the counterfeit banknotes can be used in identifying counterfeiting banknotes. Furthermore, there are possibilities that counterfeit banknotes may come from different sources. Therefore, further c-FACS analysis on the counterfeit RM100 banknotes samples is performed to identify their differences. For the particular analysis, the algorithm is executed on counterfeit banknotes only. The results of the coordinated patterns of the samples are shown in Figure 5.
The coordinated FACS in Figure 5 shows that the nodes of the counterfeit RM100 samples are mostly overlapped with each other and difficult to be differentiated. Hence, the individual pattern of each counterfeit sample is extracted and plotted separately to observe its pattern and the nodes’ positions. The signature characteristics of each pattern are identified and compared. The coordinated FACS patterns of counterfeit sample 1 (CS1) are shown in Figure 6. Patterns for other remaining counterfeit samples are depicted in Supplementary Materials.
Figure 6 shows that the nodes of coordinated FACS of counterfeit sample 1 (CS1) are scattered mainly at four areas of the x-axis. The four areas are at −1 to −0.8, −0.5 to 0, 0 to 0.5, and 0.8 to 1. All individual patterns of 25 counterfeit samples (CS) of RM100 banknotes are obtained and compared to each other. The CS1, CS2, CS8, CS13, CS21, CS23, and CS25 are mostly clustered at the x-axis from 0 to −0.5 and 0.8 to 1. The nodes of CS4, CS9, CS15, CS16, CS19, and CS20 are mainly clustered at the  x -axis from 0 to 0.5 and −0.8 to −1. The coordinated nodes for other remaining samples, CS3, CS5, CS6, CS7, CS10, CS11, CS12, CS14, CS17, CS18, CS22, and CS24 are evenly clustered at four domains of the x-axis from −0.8 to −1, 0 to −0.5, 0 to 0.5 and 0.8 to 1.
The patterns and nodes for each counterfeit sample showed dominant clusters in certain areas. The clusters in particular areas could indicate distinct characteristics of the samples. The samples with similar areas of clusters may have similar features and may be produced by similar manufacturers. The c-FACS analysis results show that there are three possible manufacturers involved in the production of the RM100 counterfeit banknotes analyzed, due to three distinct features or areas of clusters. The CS1, CS2, CS8, CS13, CS21, CS23, and CS25 have similar cluster areas, thus they may have similar features and could be produced by a similar manufacturer. The CS4, CS9, CS15, CS16, CS19, and CS20 may also be produced by another manufacturer, and the remaining CS3, CS5, CS6, CS7, CS10, CS11, CS12, CS14, CS17, CS18, CS22, and CS24 could be manufactured by the other party. Thus, the c-FACS was found able to categorize the counterfeit RM100 banknotes with respect to the cluster area. These results are consistently similar to the results on the authentication of RM50 banknotes reported by Hassan et al. [11]. Thus, the c-FACS was proven, once again, as consistent and reliable for banknotes authentication and identifying the chemical signatures of different denominations of Malaysian banknotes.

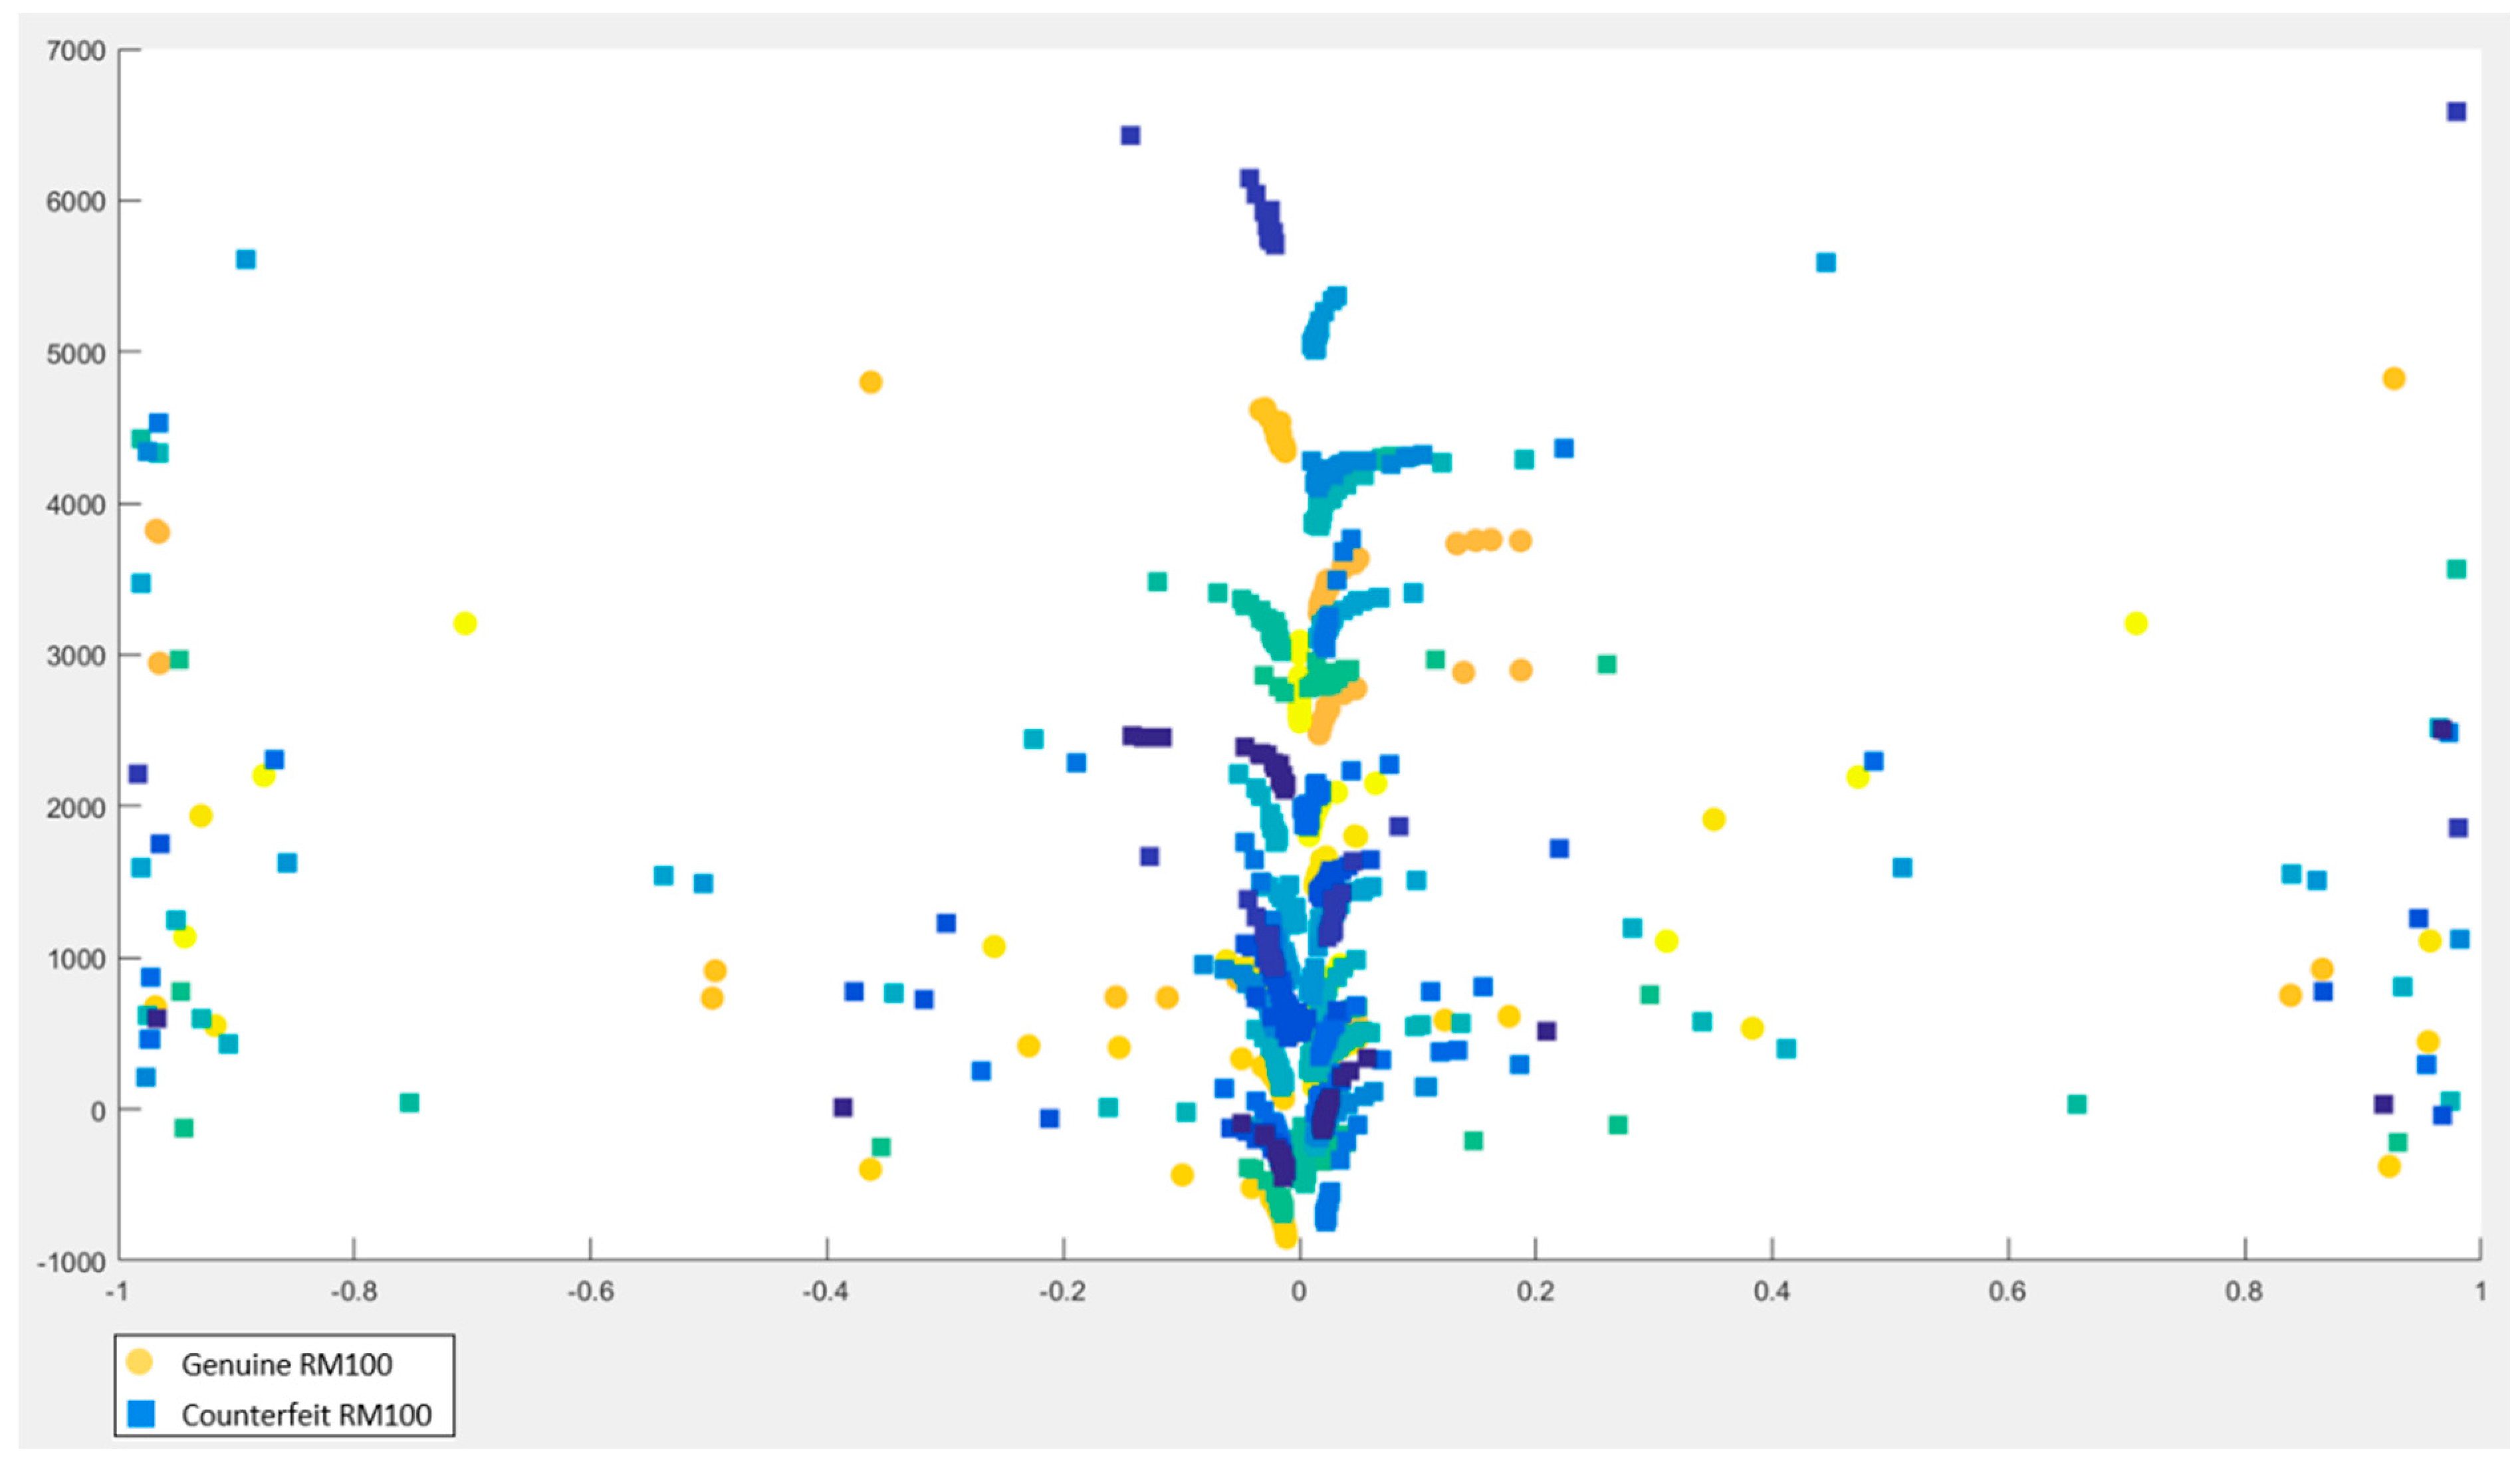
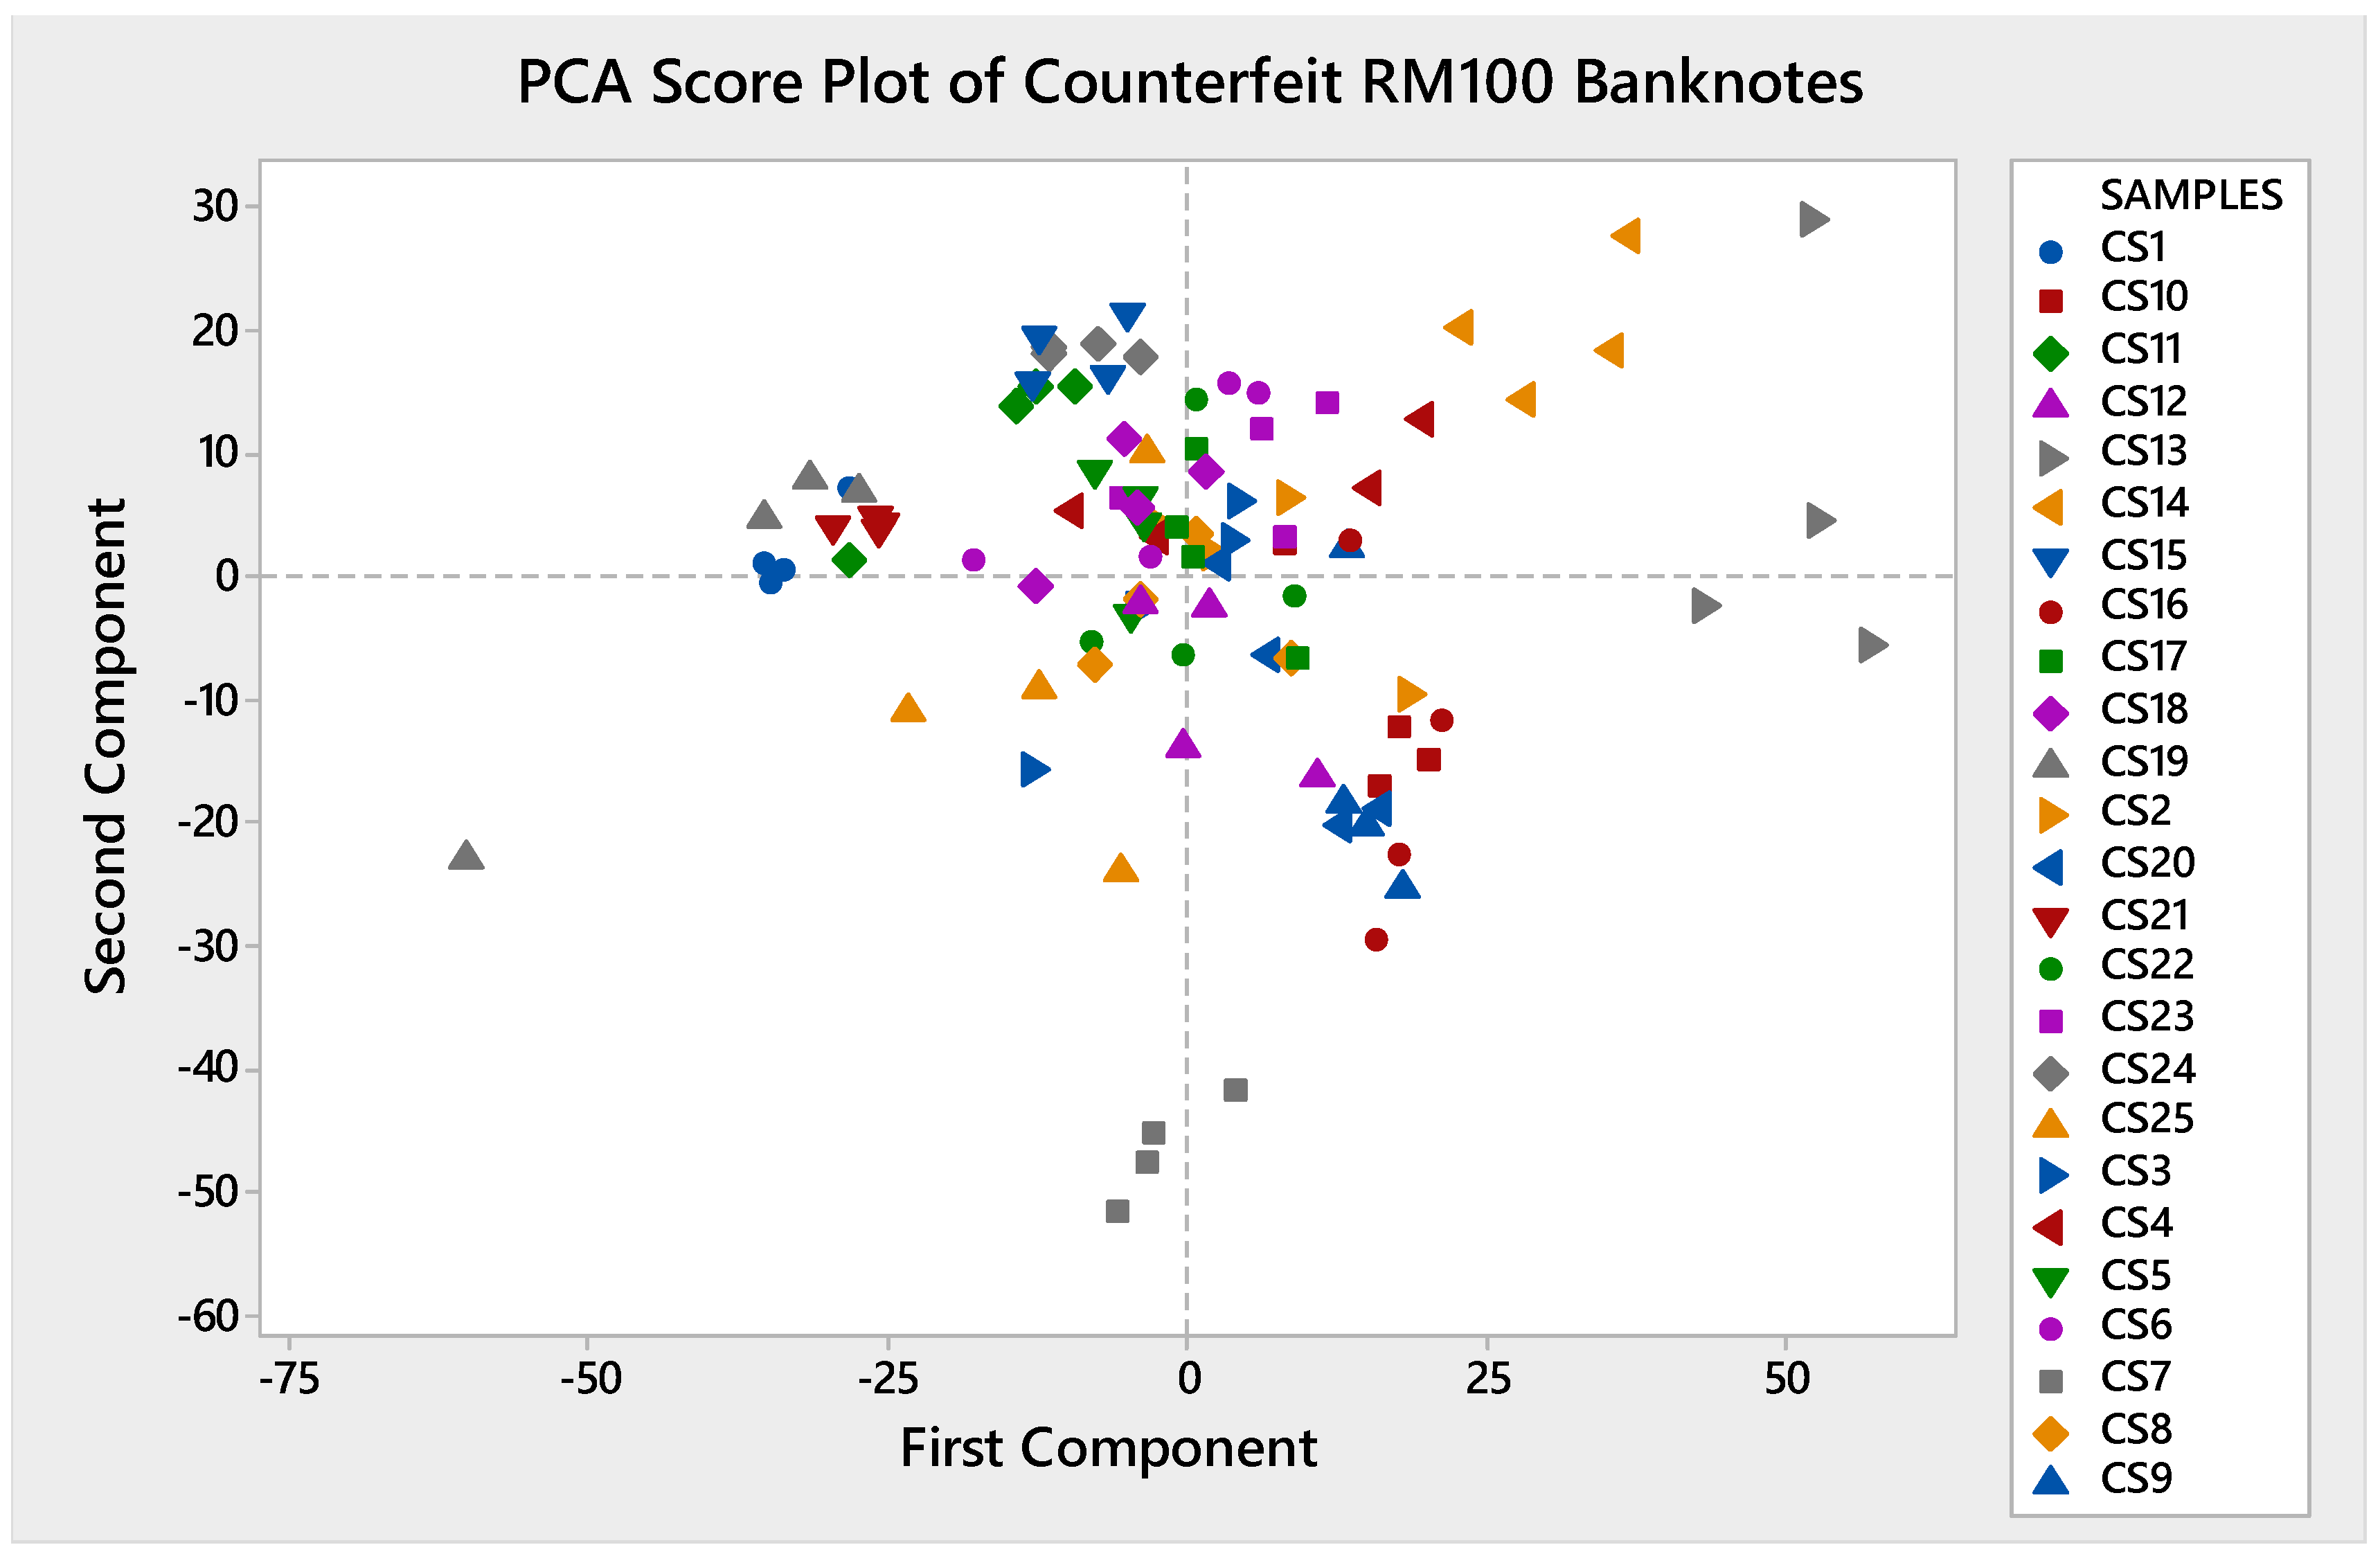
4.3. Principal Component Analysis (PCA)

Principal component analysis (PCA) is a statistical method that is widely used in data analysis. The PCA is a method that reduces the dimensionality of a large dataset by transforming them into several principal components. The principal components (PCs) are the linear combination of the original variables. The PCs are plotted as axes to display their score results; namely, the PCA score plot. According to Livingstone [19], the principal component 1 (PC1) and principal component 2 (PC2) are usually plotted as the axes in the score plot since the two PCs are sufficient in describing the dataset.
In this paper, PCA is used to analyze and differentiate between genuine and counterfeit RM100 banknotes. The PCA is performed using Minitab software and the results are compared with the c-FACS. The results for the genuine and counterfeit RM100 banknotes analysis are plotted in the form of a PCA score plot (see Figure 7).
The PCA result in Figure 7 shows that the nodes for the genuine and counterfeit RM100 banknotes samples are clustered close to each other and overlap. In particular, the nodes for genuine RM100 banknotes are observed to be scattered in one area, while the nodes for counterfeit are dispersed in a wider area. Additionally, since the characteristics of counterfeit samples are unclear, their patterns are analyzed separately using PCA and the results are shown in Figure 8.
The PCA score plot in Figure 8 showed that the nodes of the RM100 samples are mainly clustered at the center of the graph, while a few others are scattered in separate areas. The categories of the samples are determined with respect to the axis of the first component (PC1). The samples that clustered at positive (right) and negative (left) ranges of PC1 are observed and categorized accordingly. The CS2, CS8, CS9, CS13, CS10, CS12, CS14, CS17, CS16, CS20, and CS23 samples are observed mainly on the right side, while the samples that are mainly clustered on the left side are CS1, CS5, CS7, CS11, CS15, CS18, CS19, CS21, CS24, and CS25. The remaining samples of CS3, CS4, CS6, and CS22 are scattered at the center area. These classifications may indicate that the counterfeit samples could be categorized into three different groups. The obtained results are also slightly similar to c-FACS earlier. The c-FACS results obtain present better resolution in terms of the nodes’ patterns and clearer identification of dominant axis areas. In addition, c-FACS also performed better (53.04 s) compared to PCA (72.15 s) for the analysis of genuine and counterfeit RM100 banknotes.

5. Conclusions

In this paper, the dataset of counterfeit and genuine RM100 banknotes obtained from FTIR analysis was analyzed using the fuzzy graph technique. The technique, namely, chemometrics fuzzy autocatalytic set (c-FACS) transforms large and complex datasets into coordinated patterns via a coded algorithm. The datasets of RM100 were analyzed using the c-FACS, and their results were compared with principal component analysis (PCA). As a result, the c-FACS was able to determine signature patterns of counterfeit samples of RM100 and distinguish three possible manufacturers responsible for the counterfeiting activity. Meanwhile, the PCA was unable to determine the signature pattern of counterfeit samples and their clustering for counterfeit samples was unclear. In addition, the c-FACS performed better than PCA with respect to computing time. The c-FACS can rapidly analyze a large dataset, and it has the capability of determining signature patterns of samples. Hence, the method is useful in assisting the forensic analysis involving money fraud, particularly in classifying and identifying the possible sources of counterfeit money.

Supplementary Materials

The following supporting information can be downloaded at: https://www.mdpi.com/article/10.3390/math11041002/s1, Figure S1: Coordinated FACS of Individual Counterfeit RM100 (a) Sample 2 (CS2); (b) Sample 3 (CS3); (c) Sample 4 (CS4); (d) Sample 5 (CS5); (e) Sample 6 (CS6) and (f) Sample 7 (CS7). Figure S2: Coordinated FACS of Individual Counterfeit RM100 (a) Sample 8 (CS8); (b) Sample 9 (CS9); (c) Sample 10 (CS10); (d) Sample 11 (CS11); (e) Sample 12 (CS12) and (f) Sample 13 (CS13). Figure S3: Coordinated FACS of Individual Counterfeit RM100 (a) Sample 14 (CS14); (b) Sample 15 (CS15); (c) Sample 16 (CS16); (d) Sample 17 (CS17); (e) Sample 18 (CS18) and (f) Sample 19 (CS19). Figure S4: Coordinated FACS of Individual Counterfeit RM100 (a) Sample 20 (CS20); (b) Sample 21 (CS21); (c) Sample 22 (CS22); (d) Sample 23 (CS23); (e) Sample 24 (CS24) and (f) Sample 25 (CS25).

Author Contributions

Methodology, N.H., T.A. and N.A.M.; validation, N.H., T.A. and N.A.M.; formal analysis, N.H.; writing—original draft preparation, N.H.; writing—review and editing, T.A., N.A.M., M.A. and Z.S.J.; resources, H.M., N.F.D.A. and F.K.H.; funding acquisition, N.H., T.A. and N.A.M. All authors have read and agreed to the published version of the manuscript.

Funding

This research was funded by Geran Penyelidikan MyRA (GPM) Lepasan Ph.D, grant number 600-RMC/GPM LPHD 5/3 (008/2023) from Universiti Teknologi MARA; Fundamental Research Grant Scheme (FRGS), grant number FRGS/1/2020/STG06/UTM/01/1 awarded by the Ministry of Education, Malaysia and UTM Encouragement Research Grant, grant number Q.J130000.3854.19J51.

Data Availability Statement

Data sharing is not applicable.

Acknowledgments

This work has been supported by Geran Penyelidikan MyRA (GPM) Lepasan Ph.D. (600-RMC/GPM LPHD 5/3 (008/2023)) awarded by Universiti Teknologi MARA and Fundamental Research Grant Scheme (FRGS) FRGS/1/2020/STG06/UTM/01/1 awarded by the Ministry of Education, Malaysia. We would also like to acknowledge UTM Encouragement Research Grant (Q.J130000.3854.19J51) for the funding in supporting this research.

Conflicts of Interest

The authors declare no conflict of interest.

References

  1. Spearlea, P.S.M. Economic and financial crime: Challenges for sustainable development. Soc. Econ. Debates 2021, 10, 56–63. [Google Scholar]
  2. Brici, I. New tendency of economic and financial crime in the context of digital age: Literature Review. DIEM Dubrov. Int. Econ. Meet. 2022, 7, 130–141. [Google Scholar] [CrossRef]
  3. Finlay, R.; Francis, A. A Brief History of Currency Counterfeiting; Reserve Bank of Australia Bulletin; Reserve Bank of Australia: Sydney, Australia, 2019; pp. 10–19. [Google Scholar]
  4. Williams, M.M.; Anderson, R.G. Currency Design in the United States and Abroad: Counterfeit Deterrence and Visual Accessibility. Rev.-Fed. Reserve Bank St. Louis 2007, 89, 371. [Google Scholar]
  5. Bruna, A.; Farinella, G.M.; Guarnera, G.C.; Battiato, S. Forgery detection and value identification of Euro banknotes. Sensors 2013, 13, 2515–2529. [Google Scholar] [CrossRef] [PubMed] [Green Version]
  6. Sonnex, E.; Almond, M.J.; Baum, J.V.; Bond, J.W. Identification of forged Bank of England £20 banknotes using IR spectroscopy. Spectrochim. Acta Part A Mol. Biomol. Spectrosc. 2014, 118, 1158–1163. [Google Scholar] [CrossRef] [PubMed]
  7. Uddin, M.S.; Das, P.P.; Roney, M.S.A. Image-Based Approach for the Detection of Counterfeit Banknotes of Bangladesh. In Proceedings of the 2016 5th International Conference on Informatics, Electronics, and Vision (ICIEV), Dhaka, Bangladesh, 3–14 May 2016. [Google Scholar]
  8. Baek, S.; Choi, E.; Baek, Y.; Lee, C. Detection of counterfeit banknotes using multispectral images. Digit. Signal Process. 2018, 78, 294–304. [Google Scholar] [CrossRef]
  9. Itrić, K.; Vukoje, M.; Banić, D. FT-IR Spectroscopy as a discrimination Method for establishing Authenticity of Euro Banknotes. Acta Graph. J. Print. Sci. Graph. Commun. 2018, 29, 27–30. [Google Scholar] [CrossRef] [Green Version]
  10. Ajid, N.F.D.; How, F.K.; Mahat, N.A.; Desa, W.N.S.M.; Kamaluddin, M.R.; Huri, M.A.M.; Maarof, H.; Ismail, D. Counterfeit one hundred Malaysian ringgit banknotes discrimination using chemical imaging inspection and pattern recognition. Aust. J. Forensic Sci. 2021, 54, 695–709. [Google Scholar] [CrossRef]
  11. Hassan, N.; Ahmad, T.; Mahat, N.A.; Maarof, H.; How, F.K. Counterfeit fifty Ringgit Malaysian banknotes authentication using novel graph-based chemometrics method. Sci. Rep. 2022, 12, 4826. [Google Scholar] [CrossRef] [PubMed]
  12. Zadeh, L.A.; Klir, G.J.; Yuan, B. Fuzzy Sets, Fuzzy Logic, and Fuzzy Systems: Selected Papers; World Scientific: Singapore, 1996; Volume 6. [Google Scholar]
  13. Harary, F. Graph Theory; Addison Wesley Publishing Company: Berkeley, CA, USA, 1969. [Google Scholar]
  14. Jain, S.; Krishna, S. Autocatalytic Sets and the growth of complexity in an evolutionary model. Phys. Rev. Lett. 1998, 81, 5684–5687. [Google Scholar] [CrossRef] [Green Version]
  15. Ahmad, T.; Baharun, S.; Arshad, K.A. Modeling a clinical incineration process using Fuzzy Autocatalytic Set. J. Math. Chem. 2010, 47, 1263–1273. [Google Scholar] [CrossRef]
  16. Ashaari, A.; Ahmad, T.; Mohamad, W.M.W. Transformation of Pressurized Water Reactor (AP1000) to Fuzzy Graph. MATEMATIKA 2018, 34, 235–244. [Google Scholar] [CrossRef] [Green Version]
  17. Hassan, N.; Ahmad, T.; Zain, N.M.; Awang, S.R. A Fuzzy Graph Based Chemometrics Method for Gelatin Authentication. Mathematics 2020, 8, 1969. [Google Scholar] [CrossRef]
  18. Hassan, N.; Ahmad, T.; Ashaari, A.; Awang, S.R.; Mamat, S.S.; Mohamad, W.M.W.; Fuad, A.A.A. A fuzzy graph approach analysis for COVID-19 outbreak. Results Phys. 2021, 25, 104267. [Google Scholar] [CrossRef] [PubMed]
  19. Livingstone, D.J. A Practical Guide to Scientific Data Analysis; John Wiley & Sons: West Sussex, UK, 2009. [Google Scholar]
Figure 1. The FACS graph model of FTIR.
Mathematics 11 01002 g001
Figure 2. The flow chart of the c-FACS algorithm.
Mathematics 11 01002 g002
Figure 3. The FACS graph of RM100 banknote spectrum at 1800–650 cm−1 wavenumbers region.
Mathematics 11 01002 g003
Figure 4. Coordinated FACS of genuine and counterfeit RM100.
Mathematics 11 01002 g004
Figure 5. Coordinated FACS of counterfeit RM100.
Mathematics 11 01002 g005
Figure 6. Coordinated FACS of RM100 banknotes of counterfeit sample 1 (CS1).
Mathematics 11 01002 g006
Figure 7. The PCA score plot of genuine (GE) and counterfeit (CS) RM100 banknotes samples.
Mathematics 11 01002 g007
Figure 8. The PCA score plot of counterfeit (CS) RM100 banknotes samples.
Mathematics 11 01002 g008
Disclaimer/Publisher’s Note: The statements, opinions and data contained in all publications are solely those of the individual author(s) and contributor(s) and not of MDPI and/or the editor(s). MDPI and/or the editor(s) disclaim responsibility for any injury to people or property resulting from any ideas, methods, instructions or products referred to in the content.

