1. Introduction
Mazucheli et al. [
1] proposed the unit-Gompertz (UG) model. The PDF of this model can be unimodal, rising, reversed J-shaped, and negatively skewed, while its hazard rate function can be upside-down bathtub, increasing, constant, or bathtub-shaped. One of the benefits of the UG model over the Gompertz model is that it cannot model phenomena such as the failure rate of an upside-down bathtub shape. Recently, in [
2], the authors considered the problem of estimating multicomponent stress–strength reliability based on the UG model. Kumar et al. [
3] studied the UG distribution based on inter-record times and record values. Using the UG distributions with a common scale parameter, Jha et al. [
4] assessed the stress–strength reliability of multicomponent models under progressive type-II censoring. Anis and De [
5] studied some more properties of the UG model. The CDF of the UG model is
where
, and
are shape and scale parameters, respectively. Mazucheli et al. [
1] showed that UG provides better fits than the beta and Kumaraswamy distributions. It can also be used as an effective model for fitting skewed data.
Of late, we have found a keen interest in deriving novel generators or generalized classes of univariate continuous models in order to enhance flexibility for studying the tail behavior of a distribution. The generated models can be constructed by combining a baseline model with one or more additional parameters. These generated models are quite significant in analyzing data in applied sciences, such as finance, medicine, engineering, biomedical sciences, economics, public health, etc. Different methods for generating new models based on baseline continuous distribution G(z) were suggested in recent years (for
). The common generators are beta-G [
6], gamma-G [
7], Kumaraswamy-G [
8], Weibull
X [
9], odd-generalized exponential-G [
10], Poisson odd-generalized exponential-G [
11], among others. Cordeiro et al. [
12] introduced the type-I half-logistic (TIHL-G) family, a novel G class of continuous models with an additional parameter
. The TIHL-G family’s CDF is described as
where
is a CDF of baseline continuous model based on the parametric vector
. With CDF (2), we can make the type-I half-logistic-G (TIHL-G) model for every baseline
G.
The estimation of parameter(s) is an important aspect of studying any probability distribution. Although it does not always produce the best estimators, the maximum likelihood (ML) technique is typically a very well-liked estimate technique. Better estimators can be obtained using other techniques, including those we are considering. In the current study, besides MLE, we use five different techniques to estimate the parameters of the HLUG-TI model: Cramér–von Mises estimation (CVME), least square estimation (LSE), Anderson–Darling estimation (ADE), weighted least square estimation (WLSE), and right-tail Anderson–Darling estimation (RTADE). Many authors have emphasized the use of classical estimation methods in varied contexts to estimate the parameters of several well-known models including distributions with unit interval support (Dey et al. [
13,
14]). Despite the fact that many of these estimation methods exceed MLE estimates, they may not have strong theoretical foundations.
In this study, our aim is to develop a novel model, named the “Half-Logistic Unit Gompertz Type I” (HLUG-TI) model, where observations lie on a unit interval (0, 1), and obtain some of its basic features. The suggested model can be considered an alternative to unit-Gompertz, Kumaraswamy, unit-Weibull, and Kumaraswamy beta models. We are captivated to introduce the HLUG-TI model because of the following reasons: (i) It has been observed that survival time of units/systems are usually greater than zero. However, the value of the components life cannot be taken as infinite. As there may be several points lying within (0, ∞) where several units may be dropped or replaced in many applications, (ii) it is efficient for modeling bathtub, increasing, unimodal and then bathtub hazard rates; (iii) it can be used in variety of problems, such as public health, environment, etc.; and (iv) two real data applications show that it performs well compared to other competing lifetime models. Next, we evaluate and investigate the behavior of six various classical estimators for the unknown parameters of the suggested HLUG-TI model, namely, LSE, WLSE, MLE, ADE, CVME, and RTADE. The use of these procedures can lead to the selection of a better estimation procedure that practitioners may find useful. Despite the fact that an estimator’s utility and usefulness may differ depending on the subject matter, users look for a particular estimator under different parameters and sample sizes. Due to the difficulty of theoretically comparing these estimators, detailed simulations are conducted to assess their performance in terms of bias and average mean squared error (MSE). The uniqueness of this work is that none of these estimating approaches have previously been used in a study of the HLUG-TI distribution.
The following is the outline of the paper.
Section 2 shows the HLUG-TI model specifications.
Section 3 includes several mixtures of representations of the main functions. In
Section 4, we endeavor to derive the HLUG-TI model’s key mathematical and statistical characteristics. Analytical expressions of different techniques of estimation are provided in
Section 5. In
Section 6, a simulation study is given.
Section 7 provides a list of practical applications.
Section 8 contains closing remarks.
3. Mixture Representations
In this section, we will describe the mixture representations of CDF and PDF of the HLUG-TI model.
Proposition 1. The mixed representation of CDF is as follows:where .
Proof. Since
using the power series expansion provides
As
this proceeds from the binomial formula, we have
By incorporating together the above equalities, we attain
The confirmation of Proposition 1 is now complete. □
Remark 1. Using the differentiation of , we obtain the following mixture representation for where In Remark 1, we note that the sum of r begins with 1 because This appears to be promising information for future advanced distributional expansion. The given outcome defines a mixture expression for the exponentiated .
Proposition 2. Assume that a is a positive integer. The mixture description is as follows:where Proof. As a result of the binomial theorem, we have
As
the power series
twice and exponential series
in a row, provides,
By combining the aforementioned equality conditions, we achieve the desired outcome, and conclude the findings of Proposition 2. □
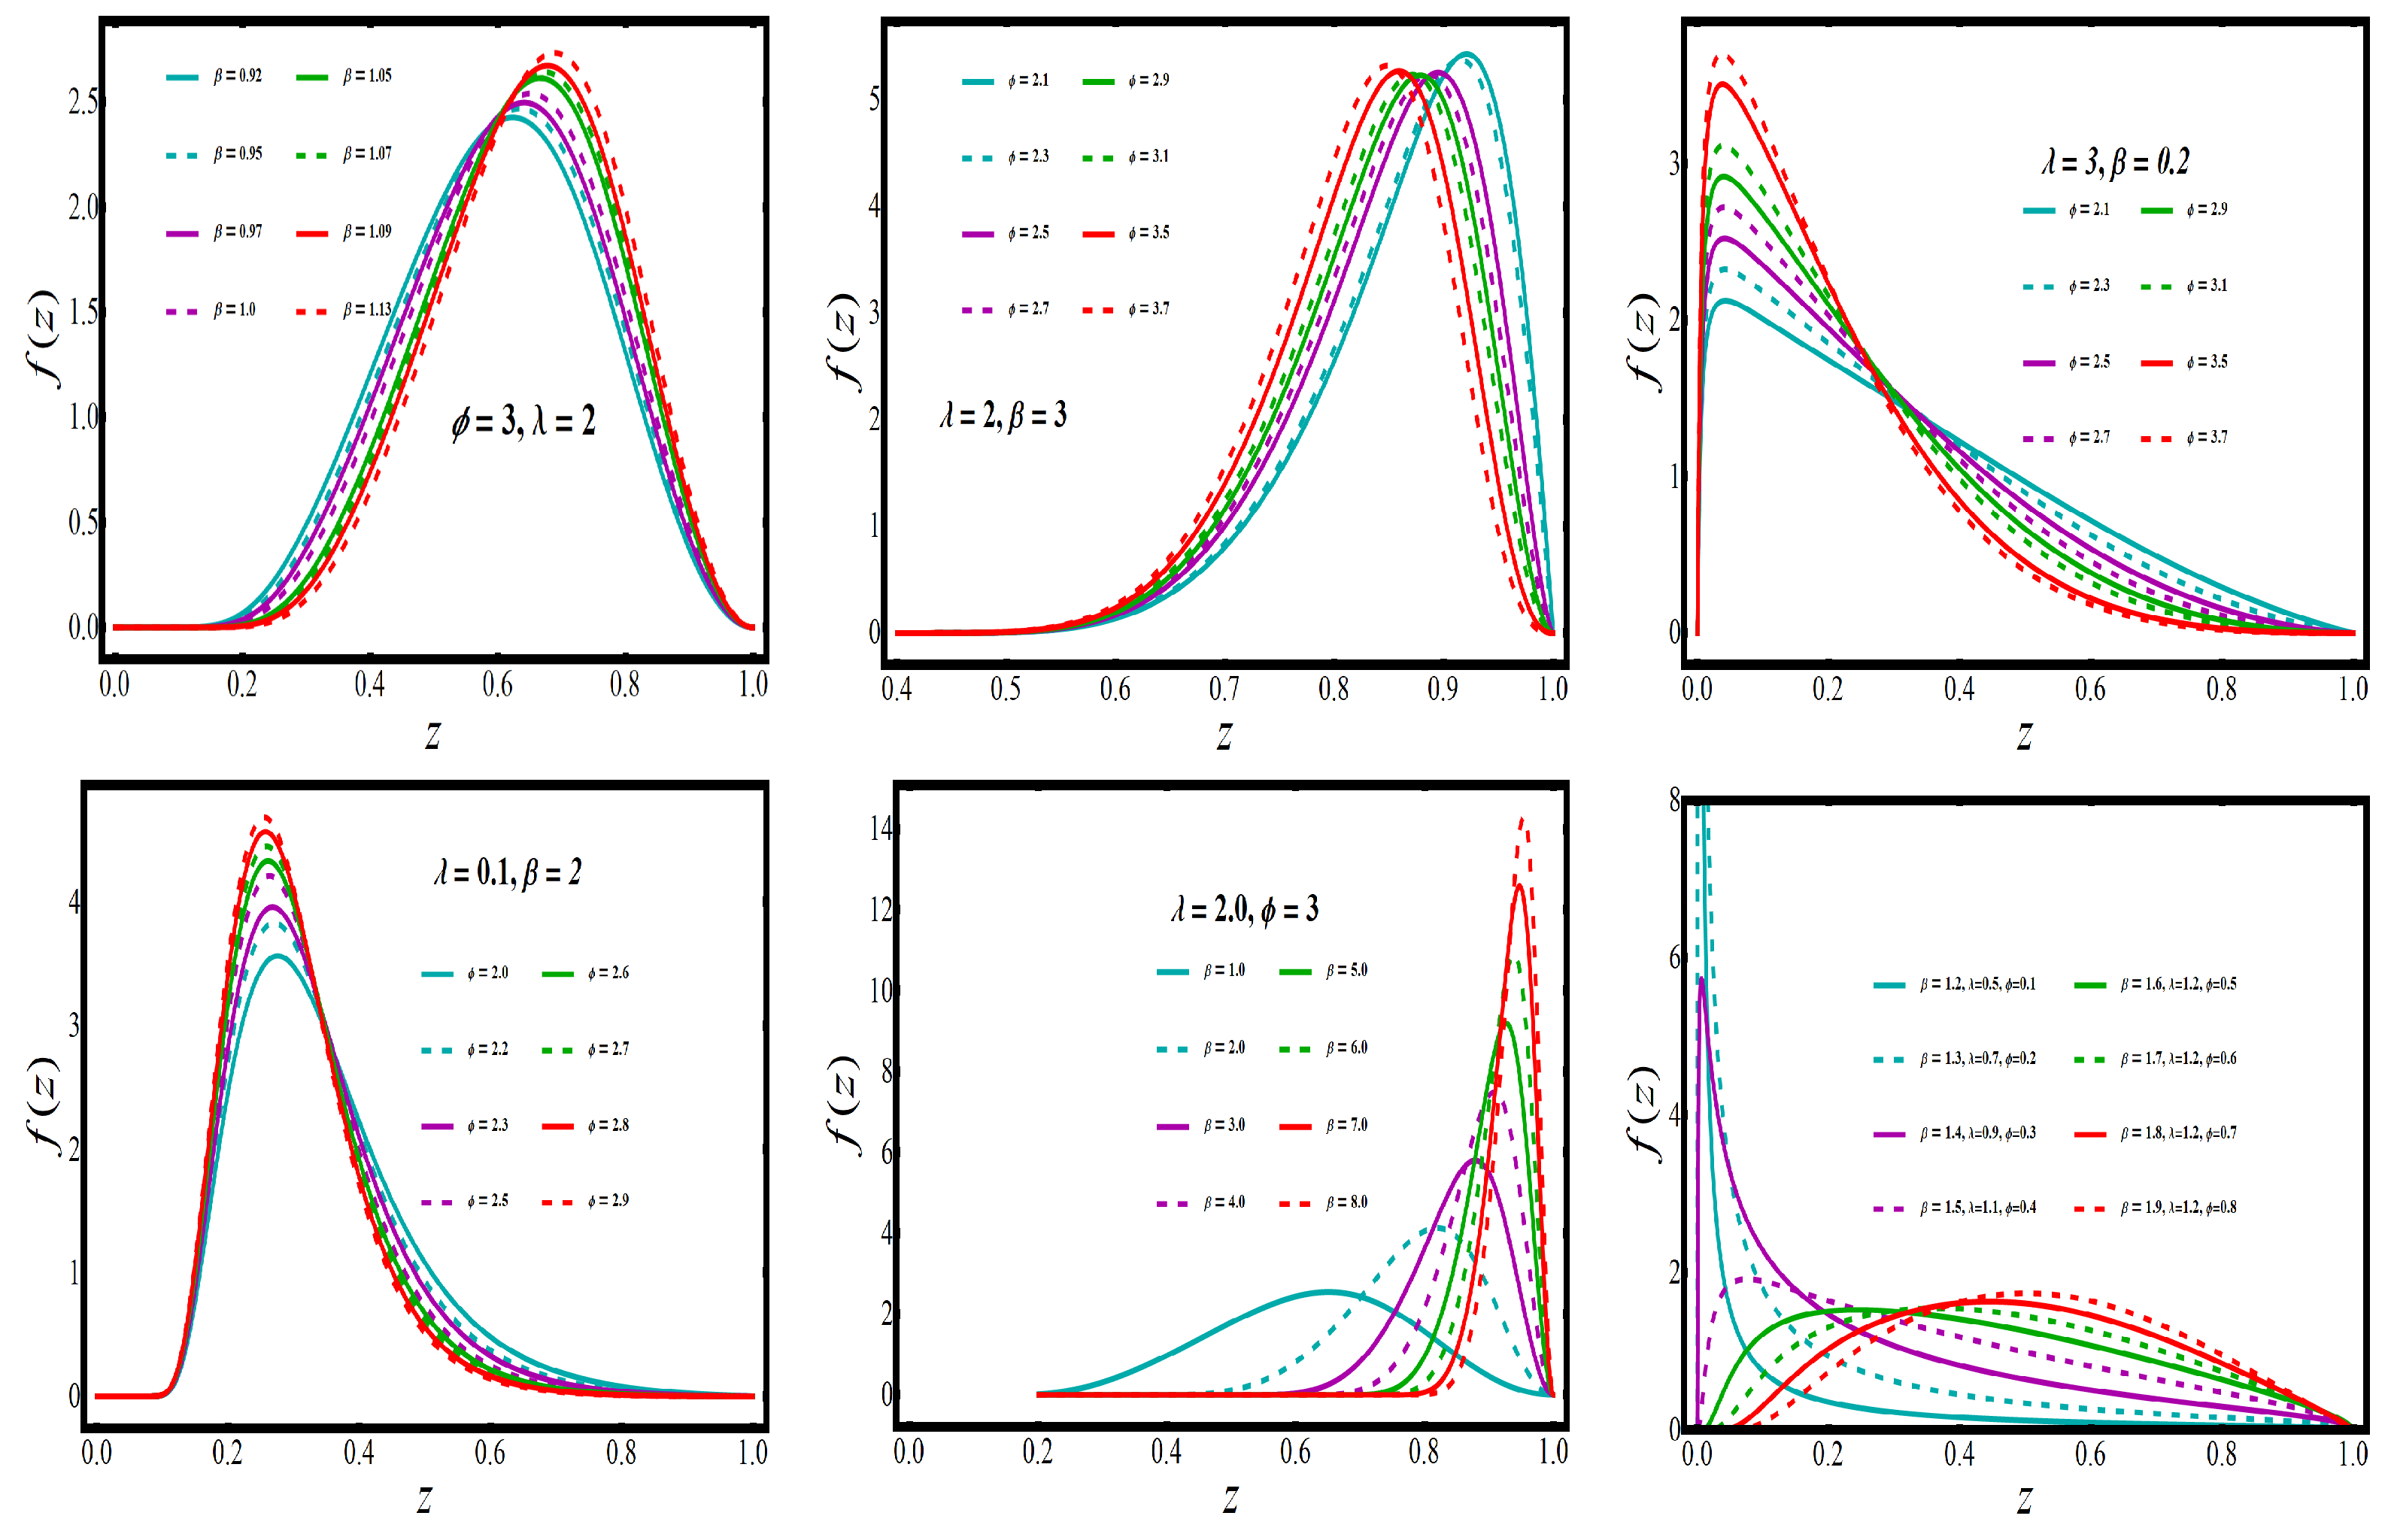
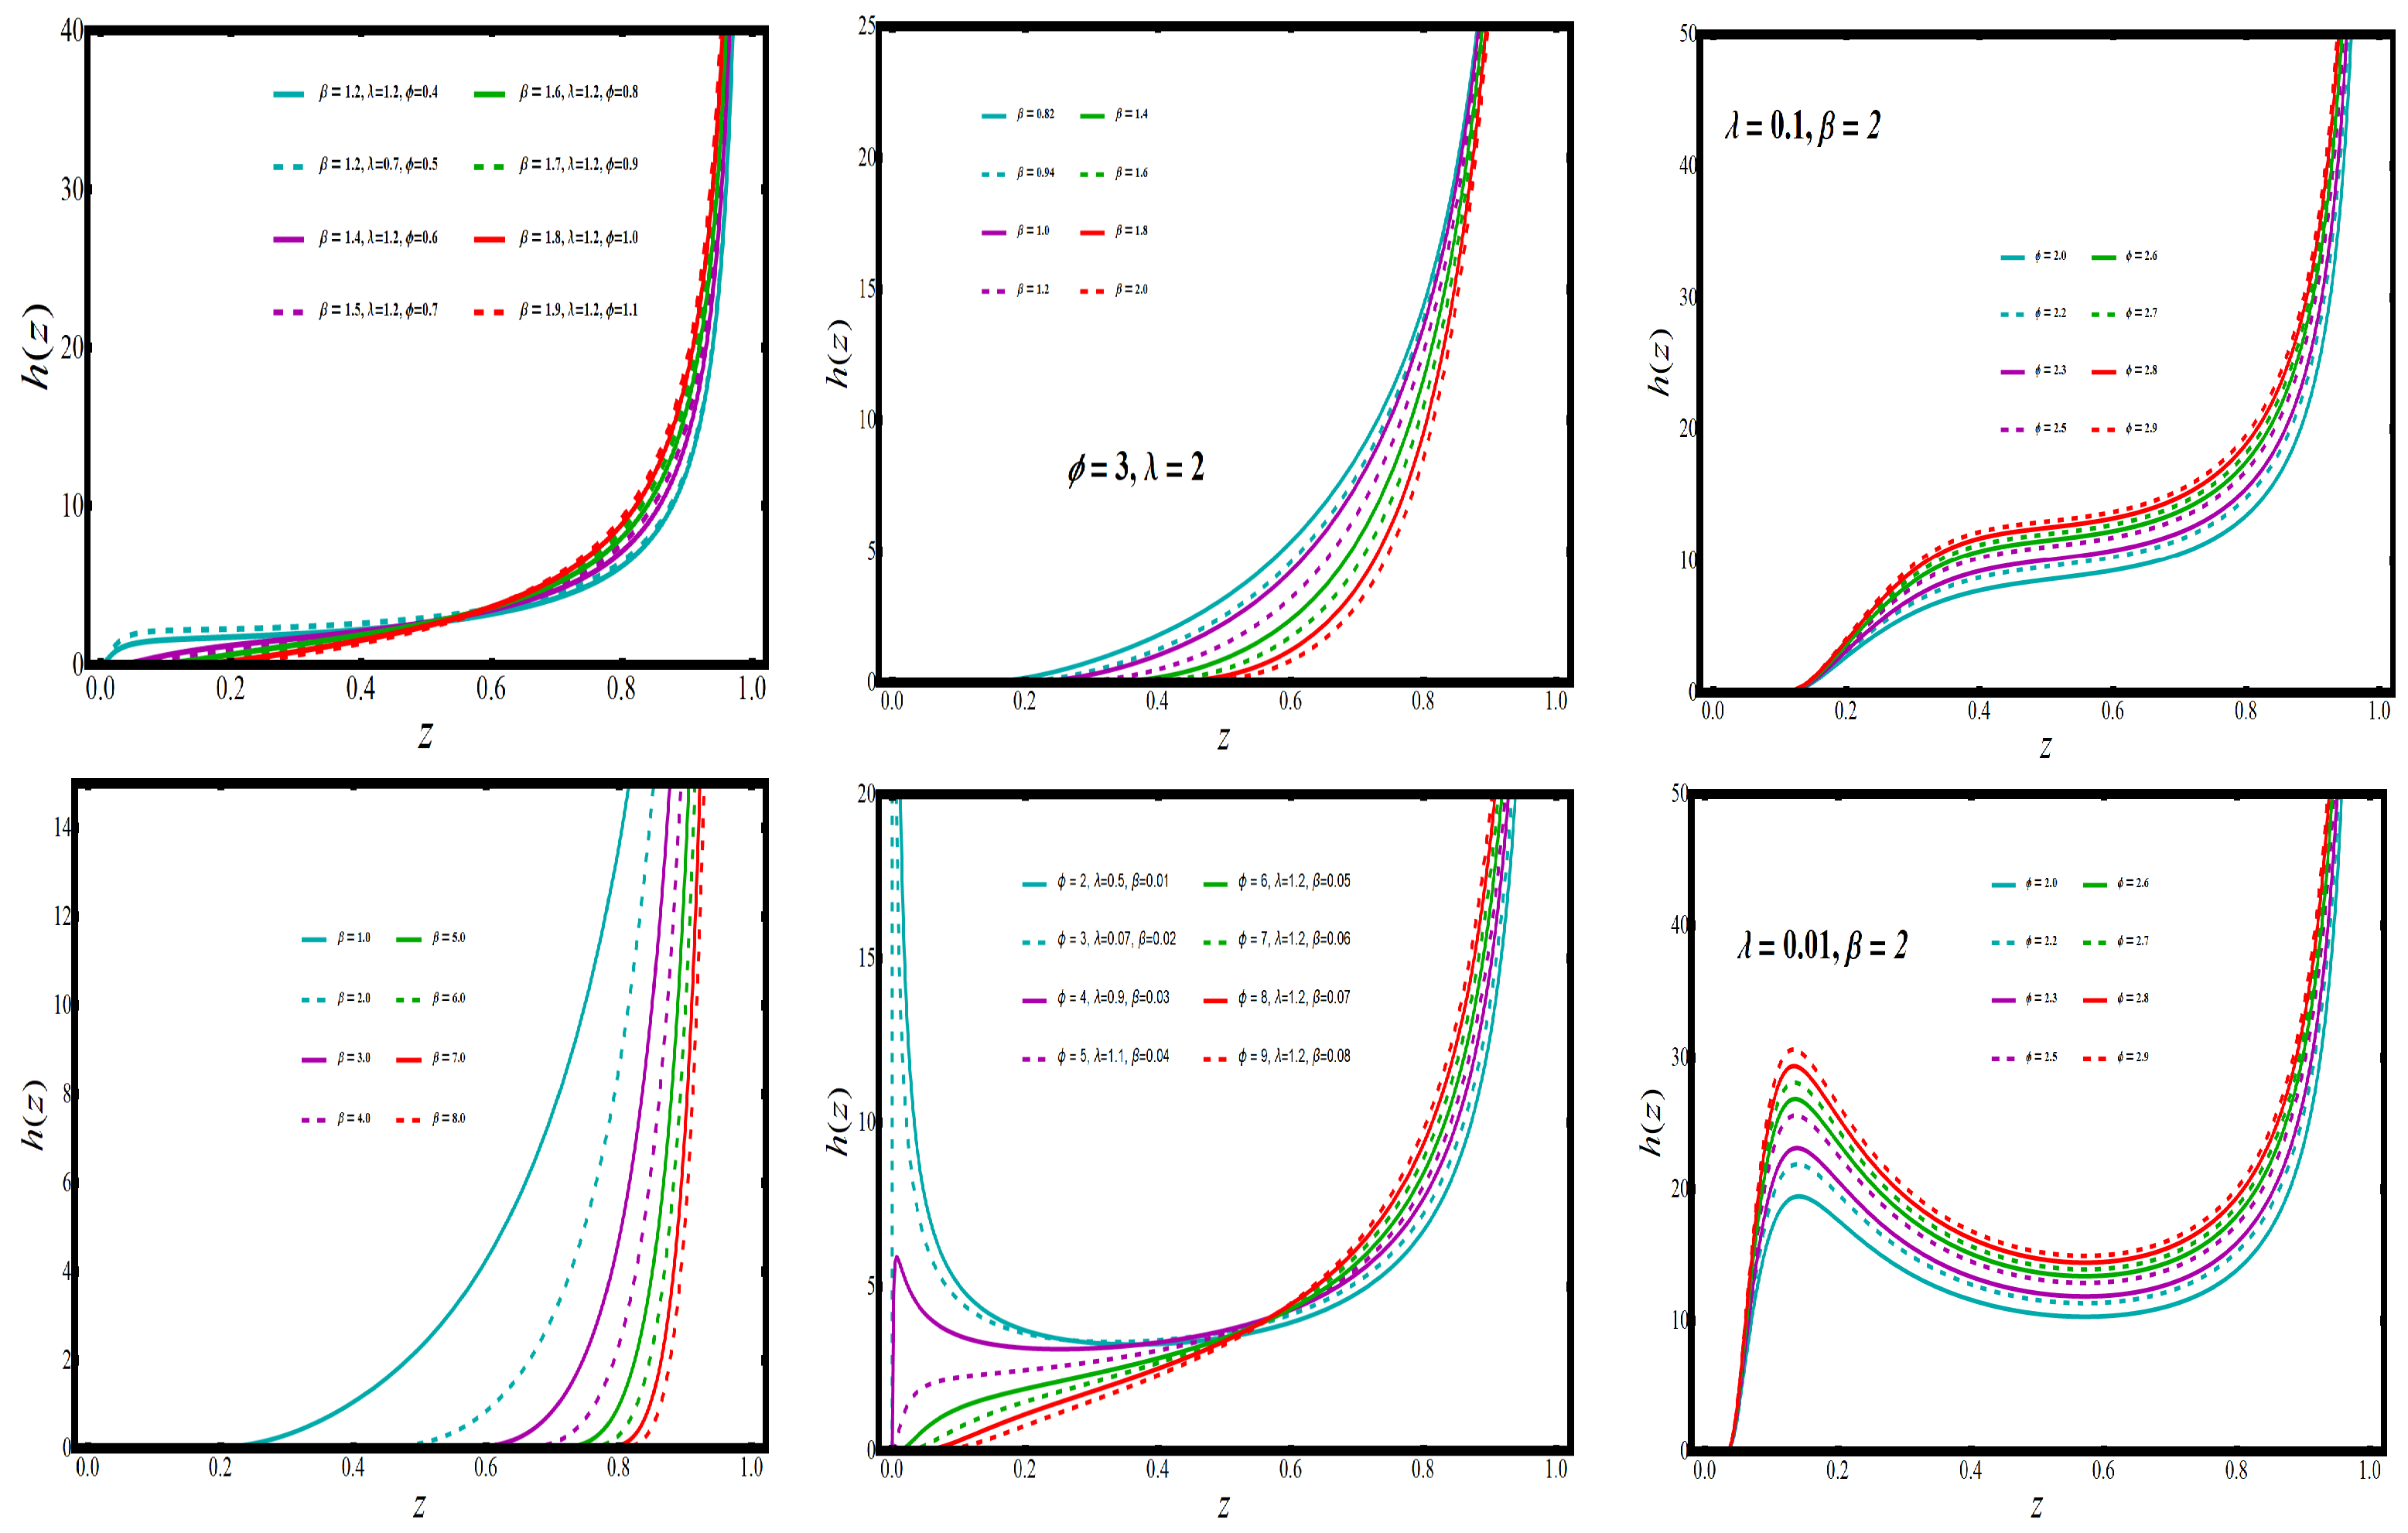
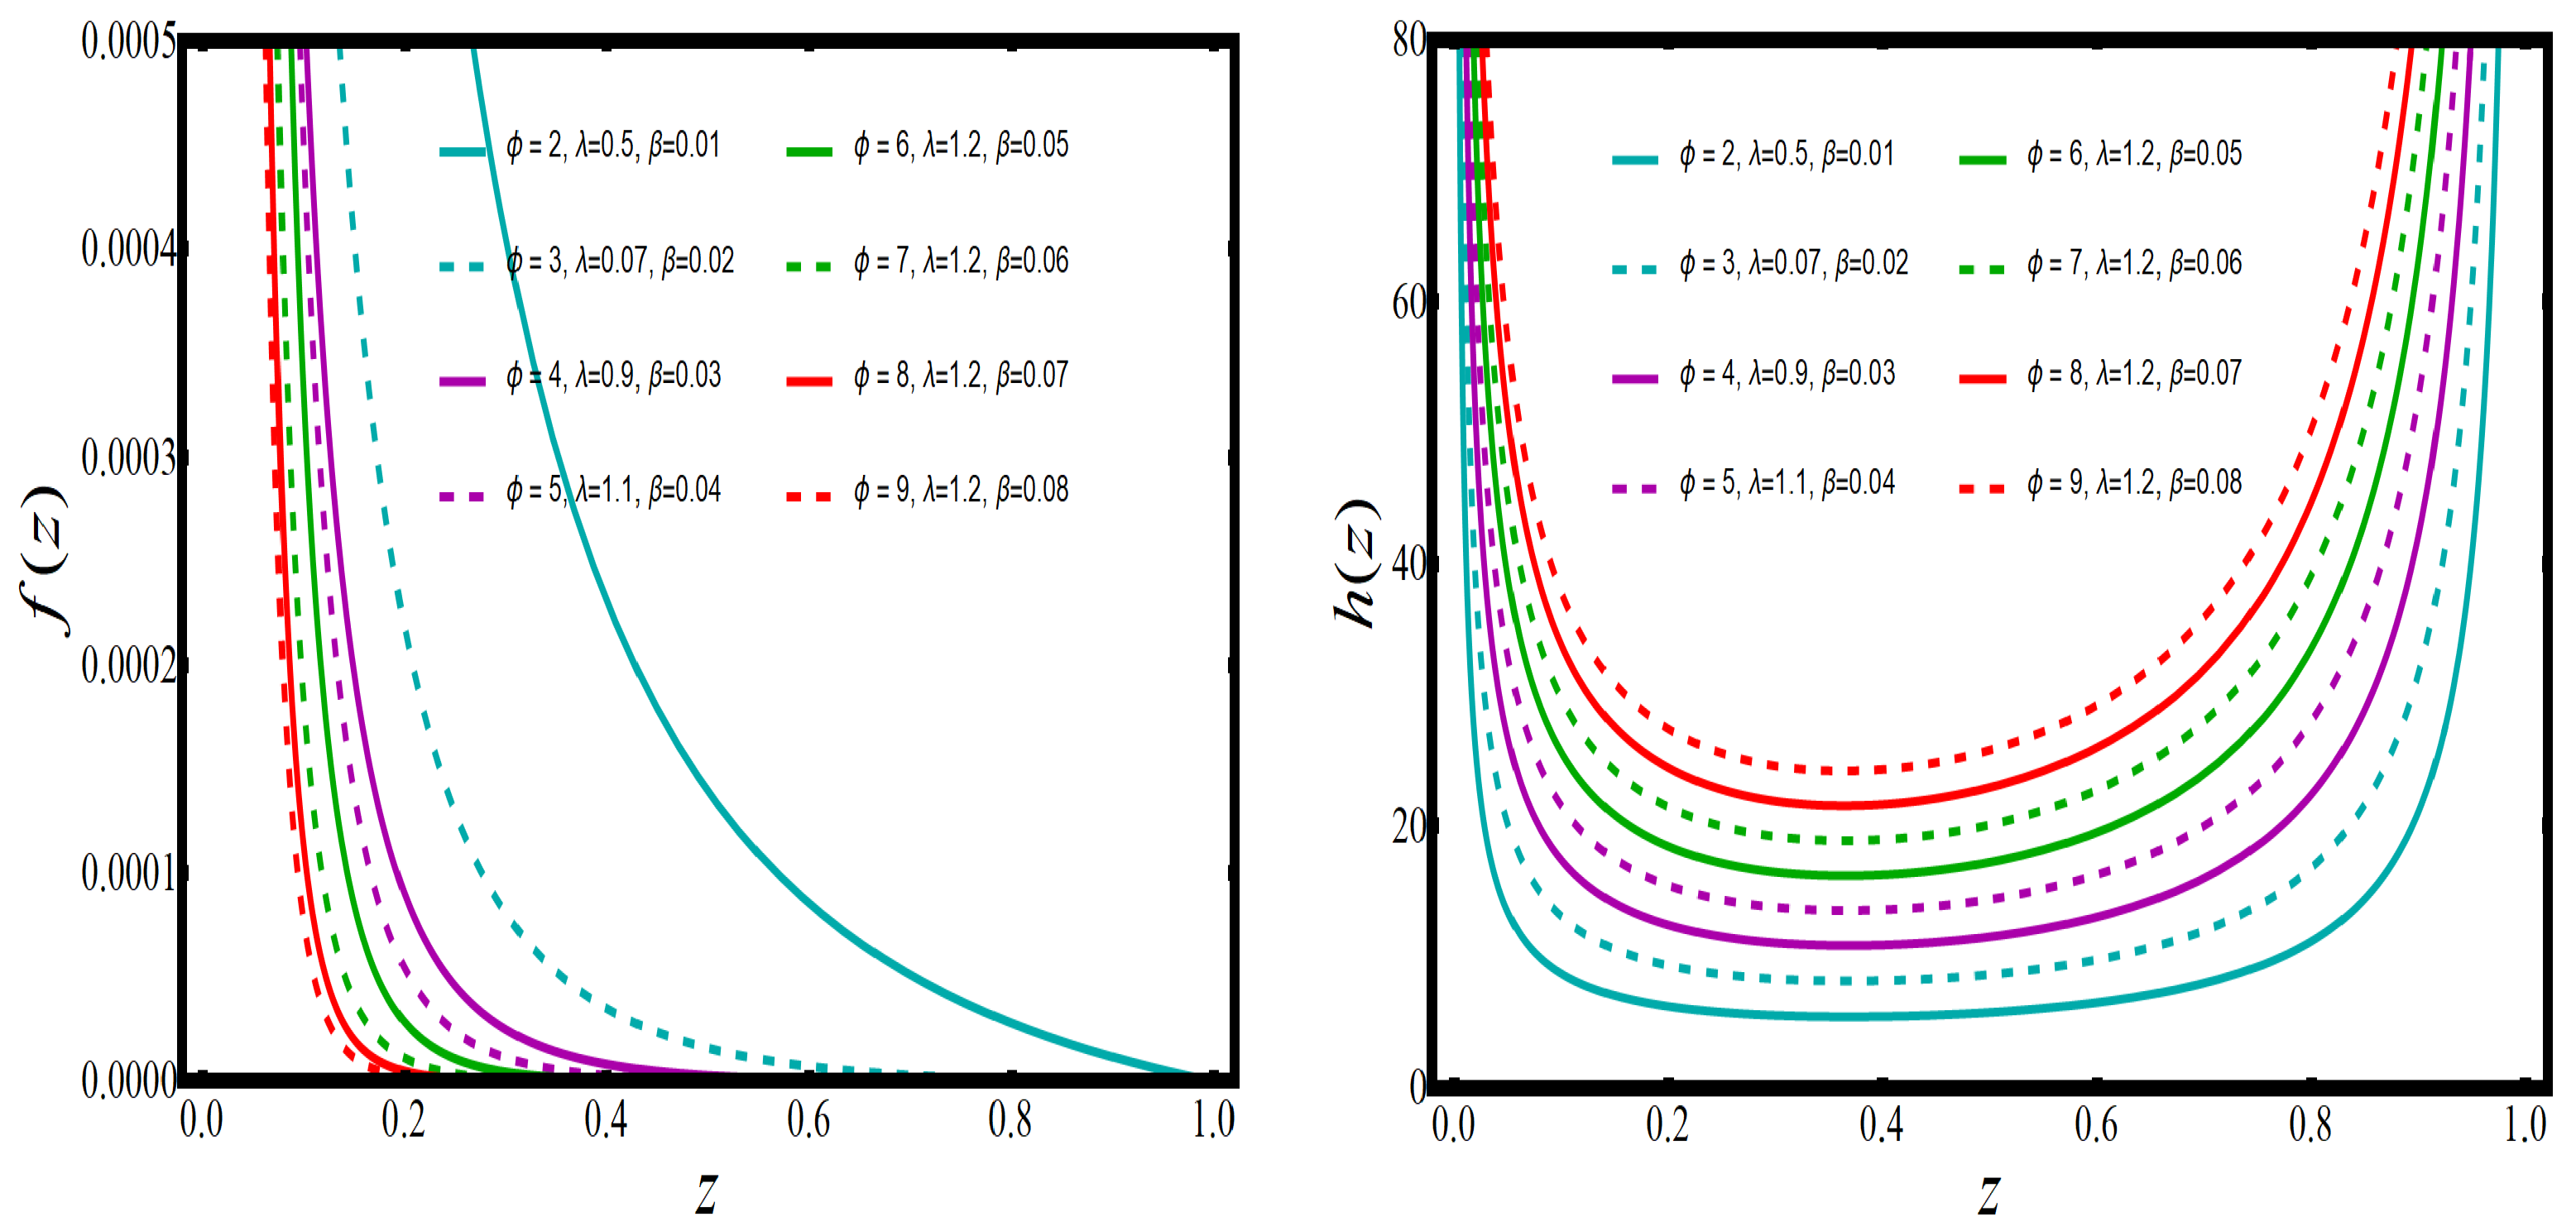
The increasing, bathtub, and upside-down forms of the HRF are shown in
Figure 2. When the PDF has a monotonic decreasing trend, the HRF has a bathtub trend, which can be observed in
Figure 3. Real-time applications frequently require both monotonic and non-monotonic hazard rate trends, so these versatile HRF forms are ideal. In any lifetime model, inverted bathtub curves and increasing and decreasing HRF are attractive characteristics that can be incorporated into the model.
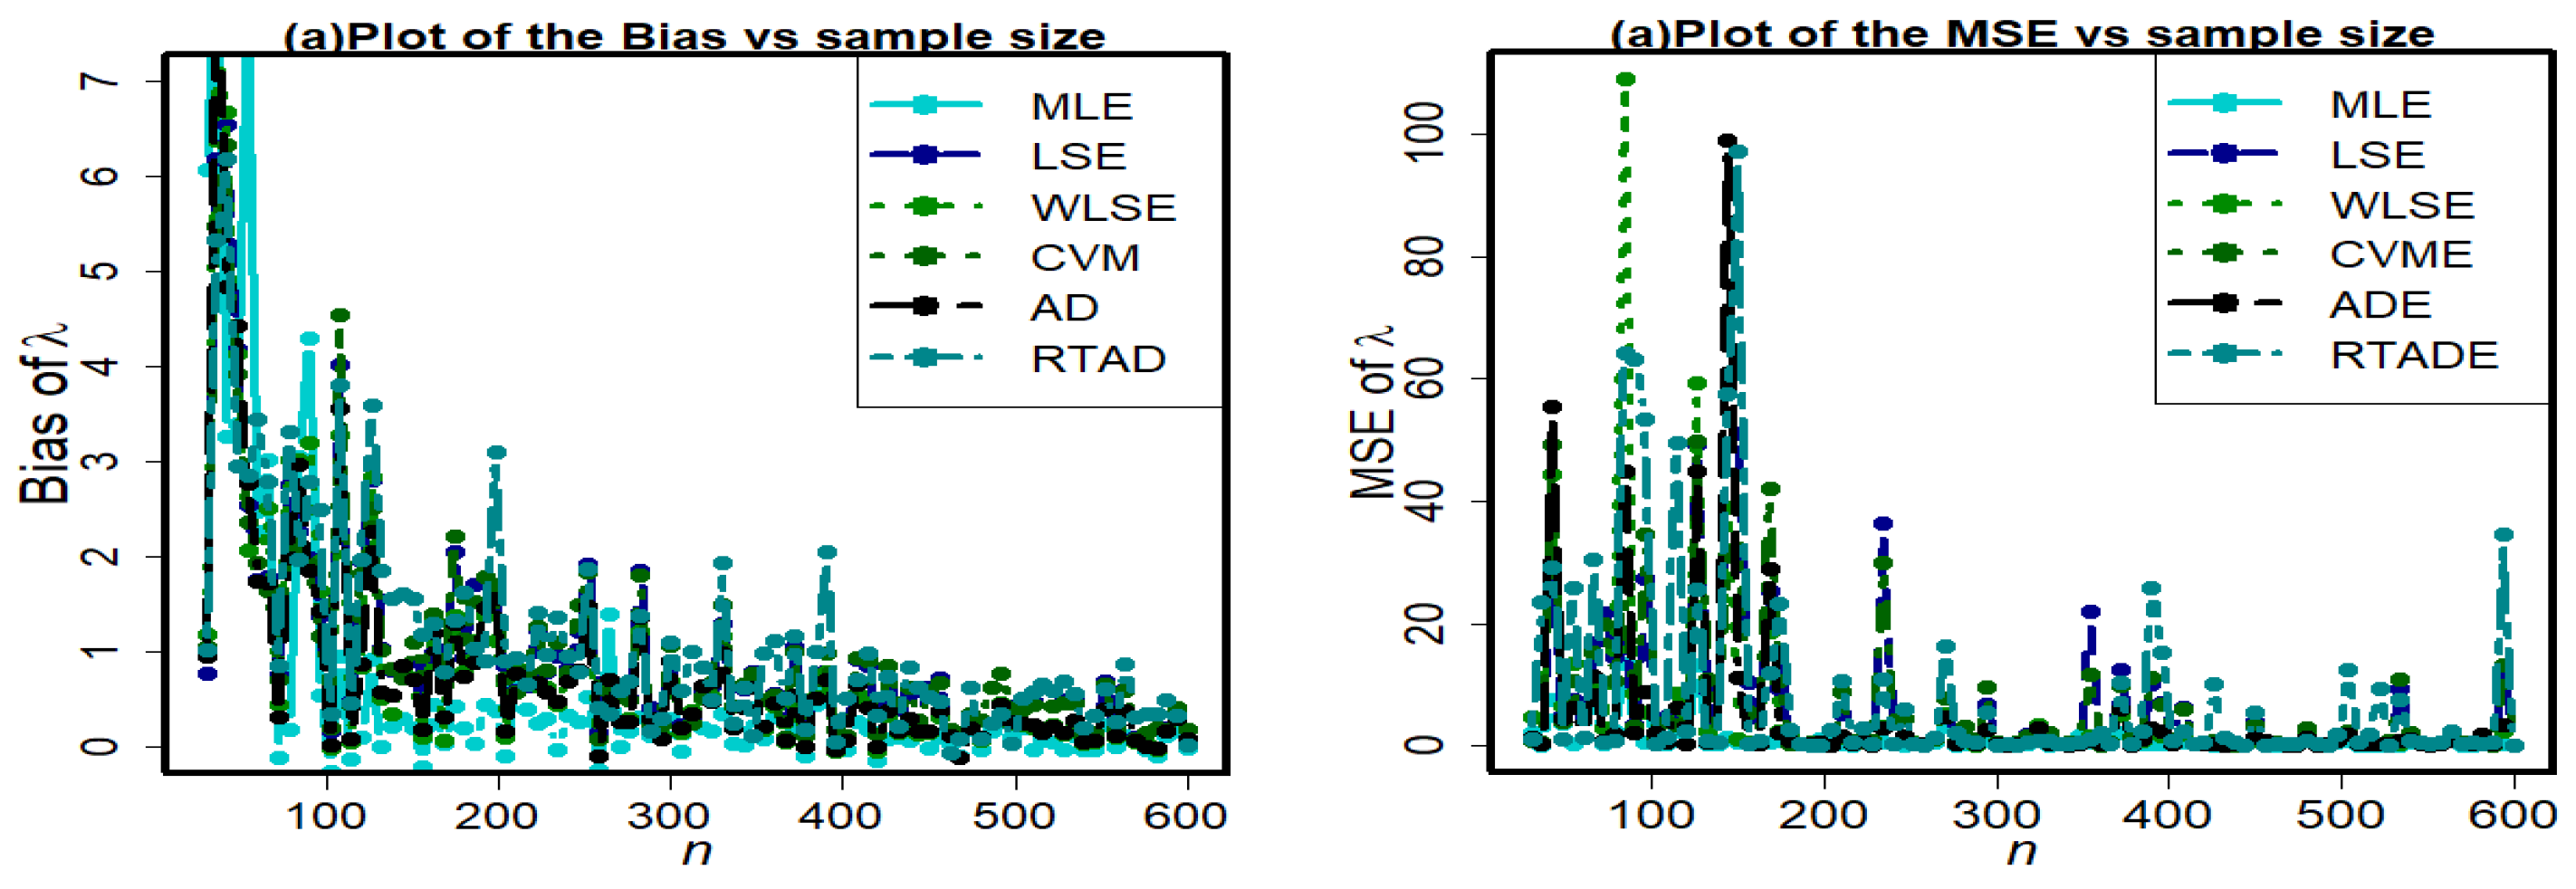
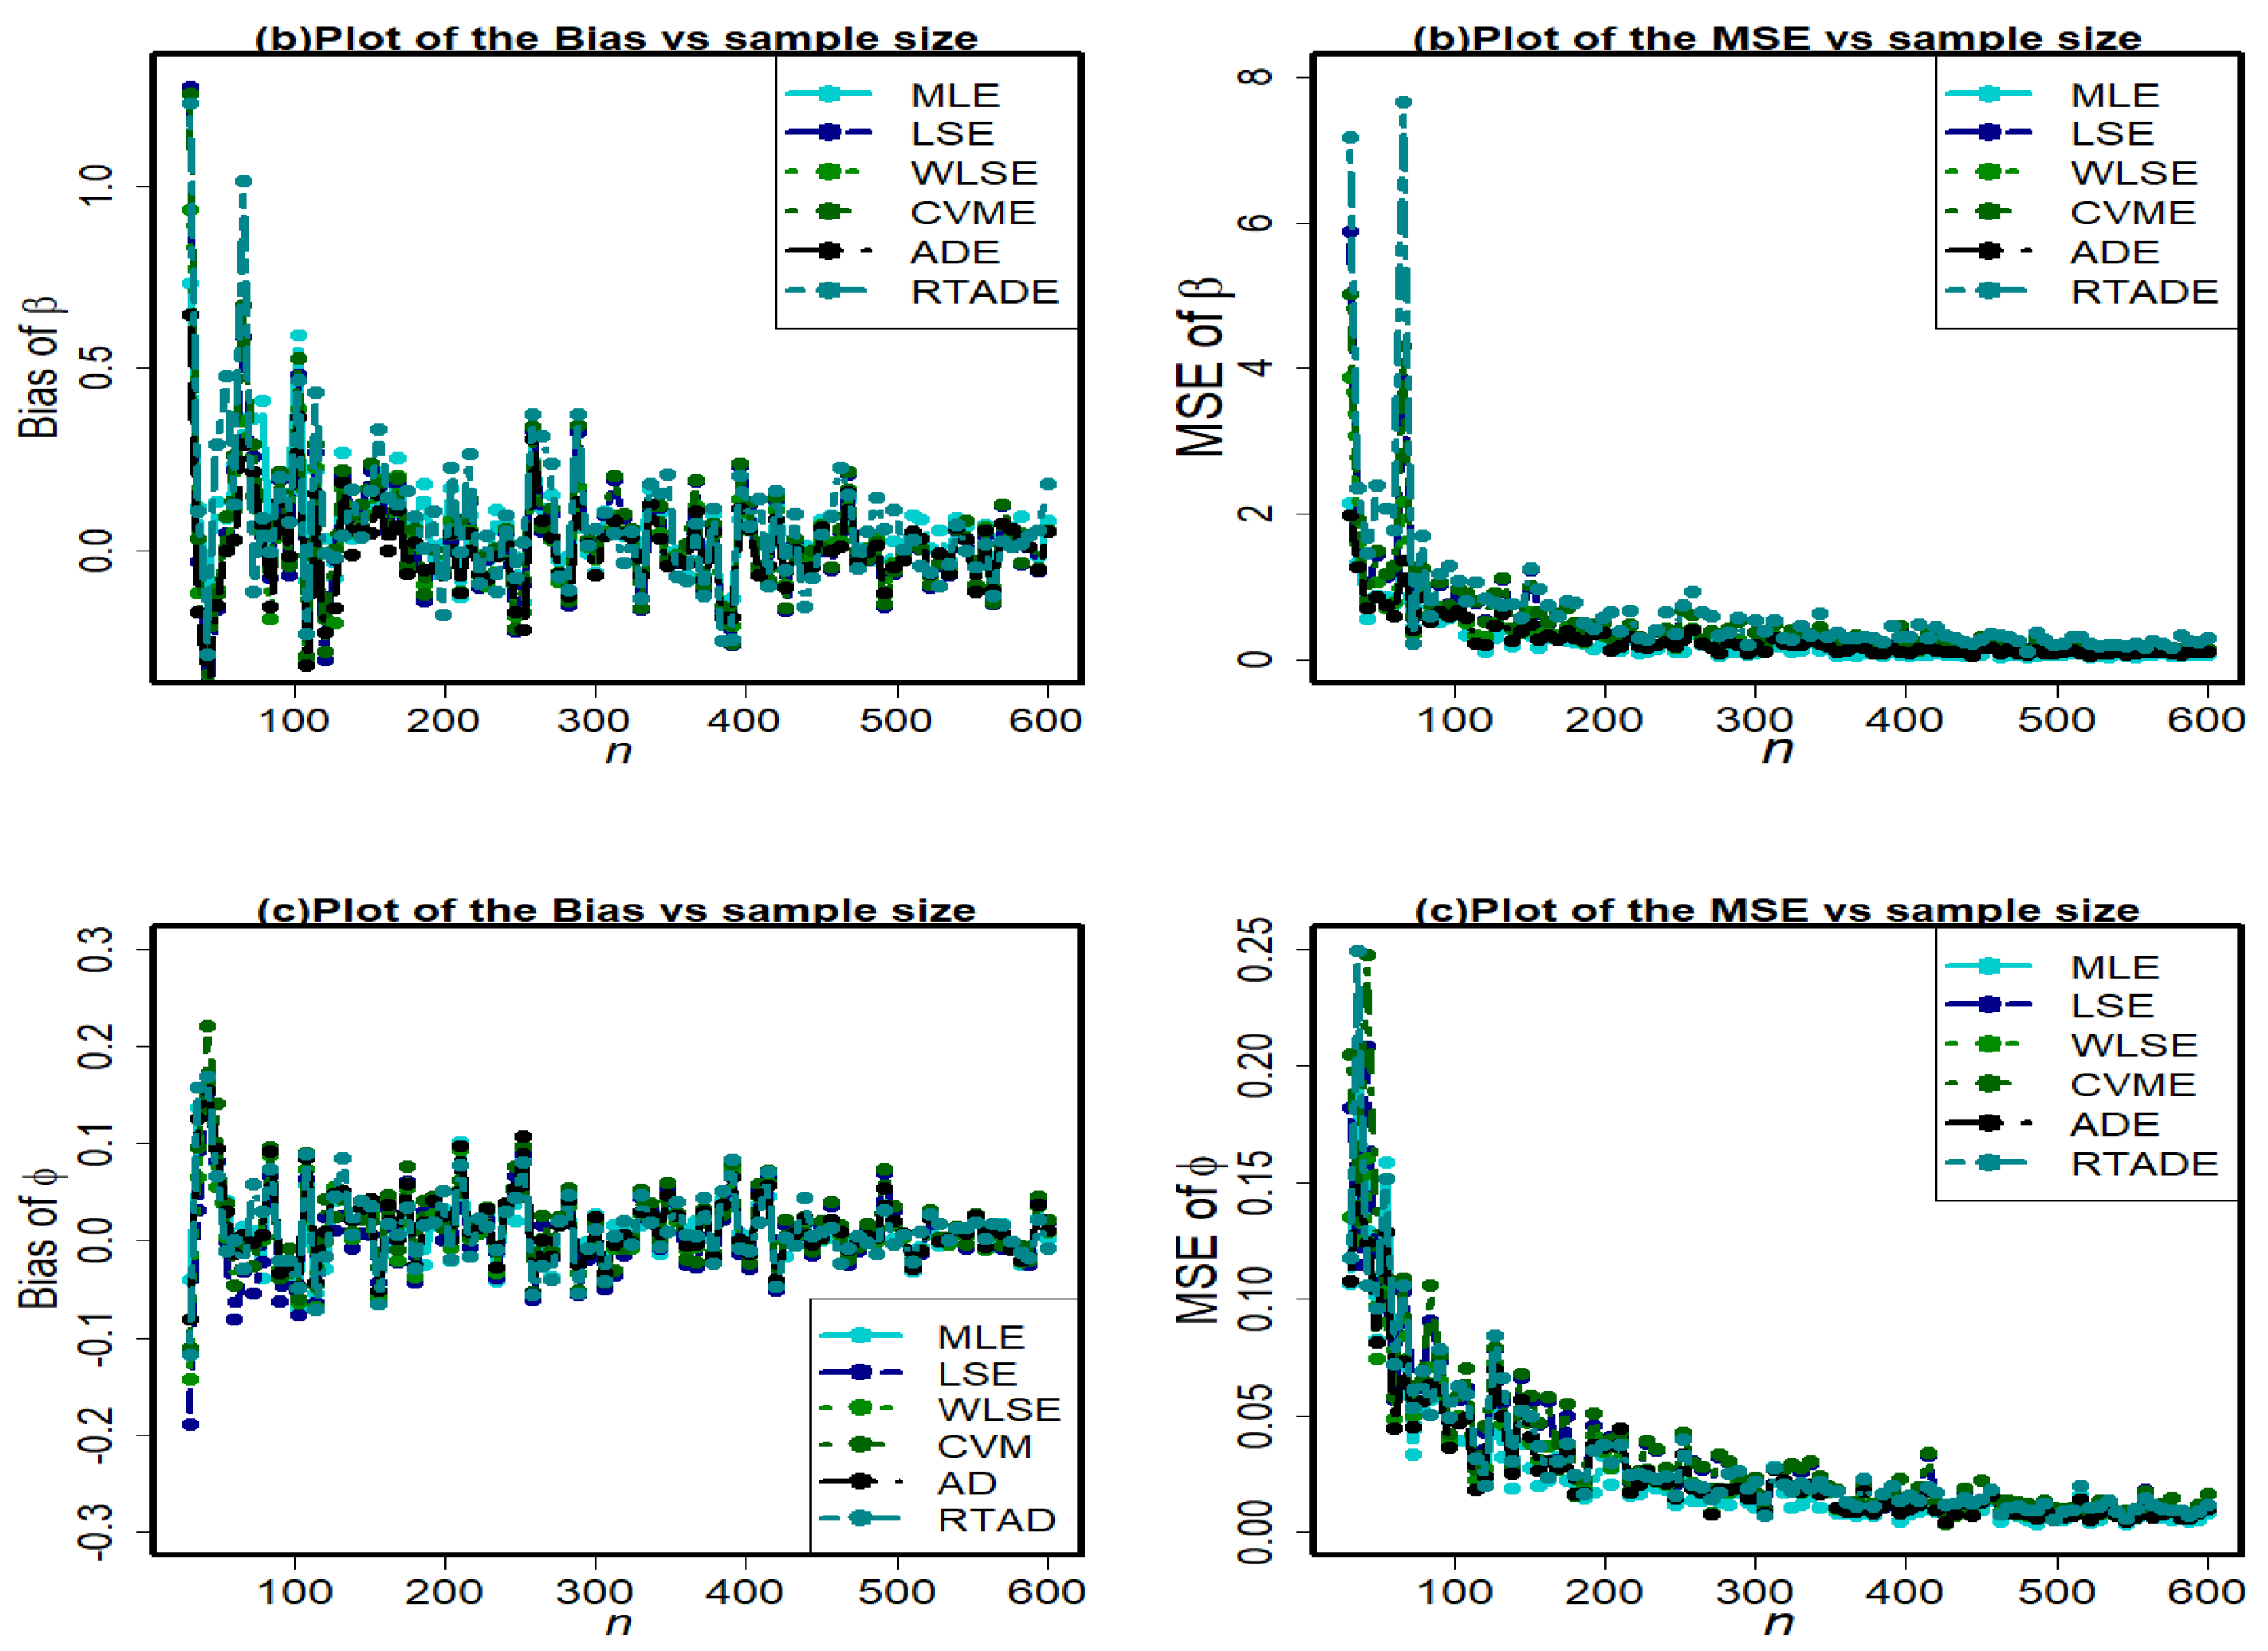
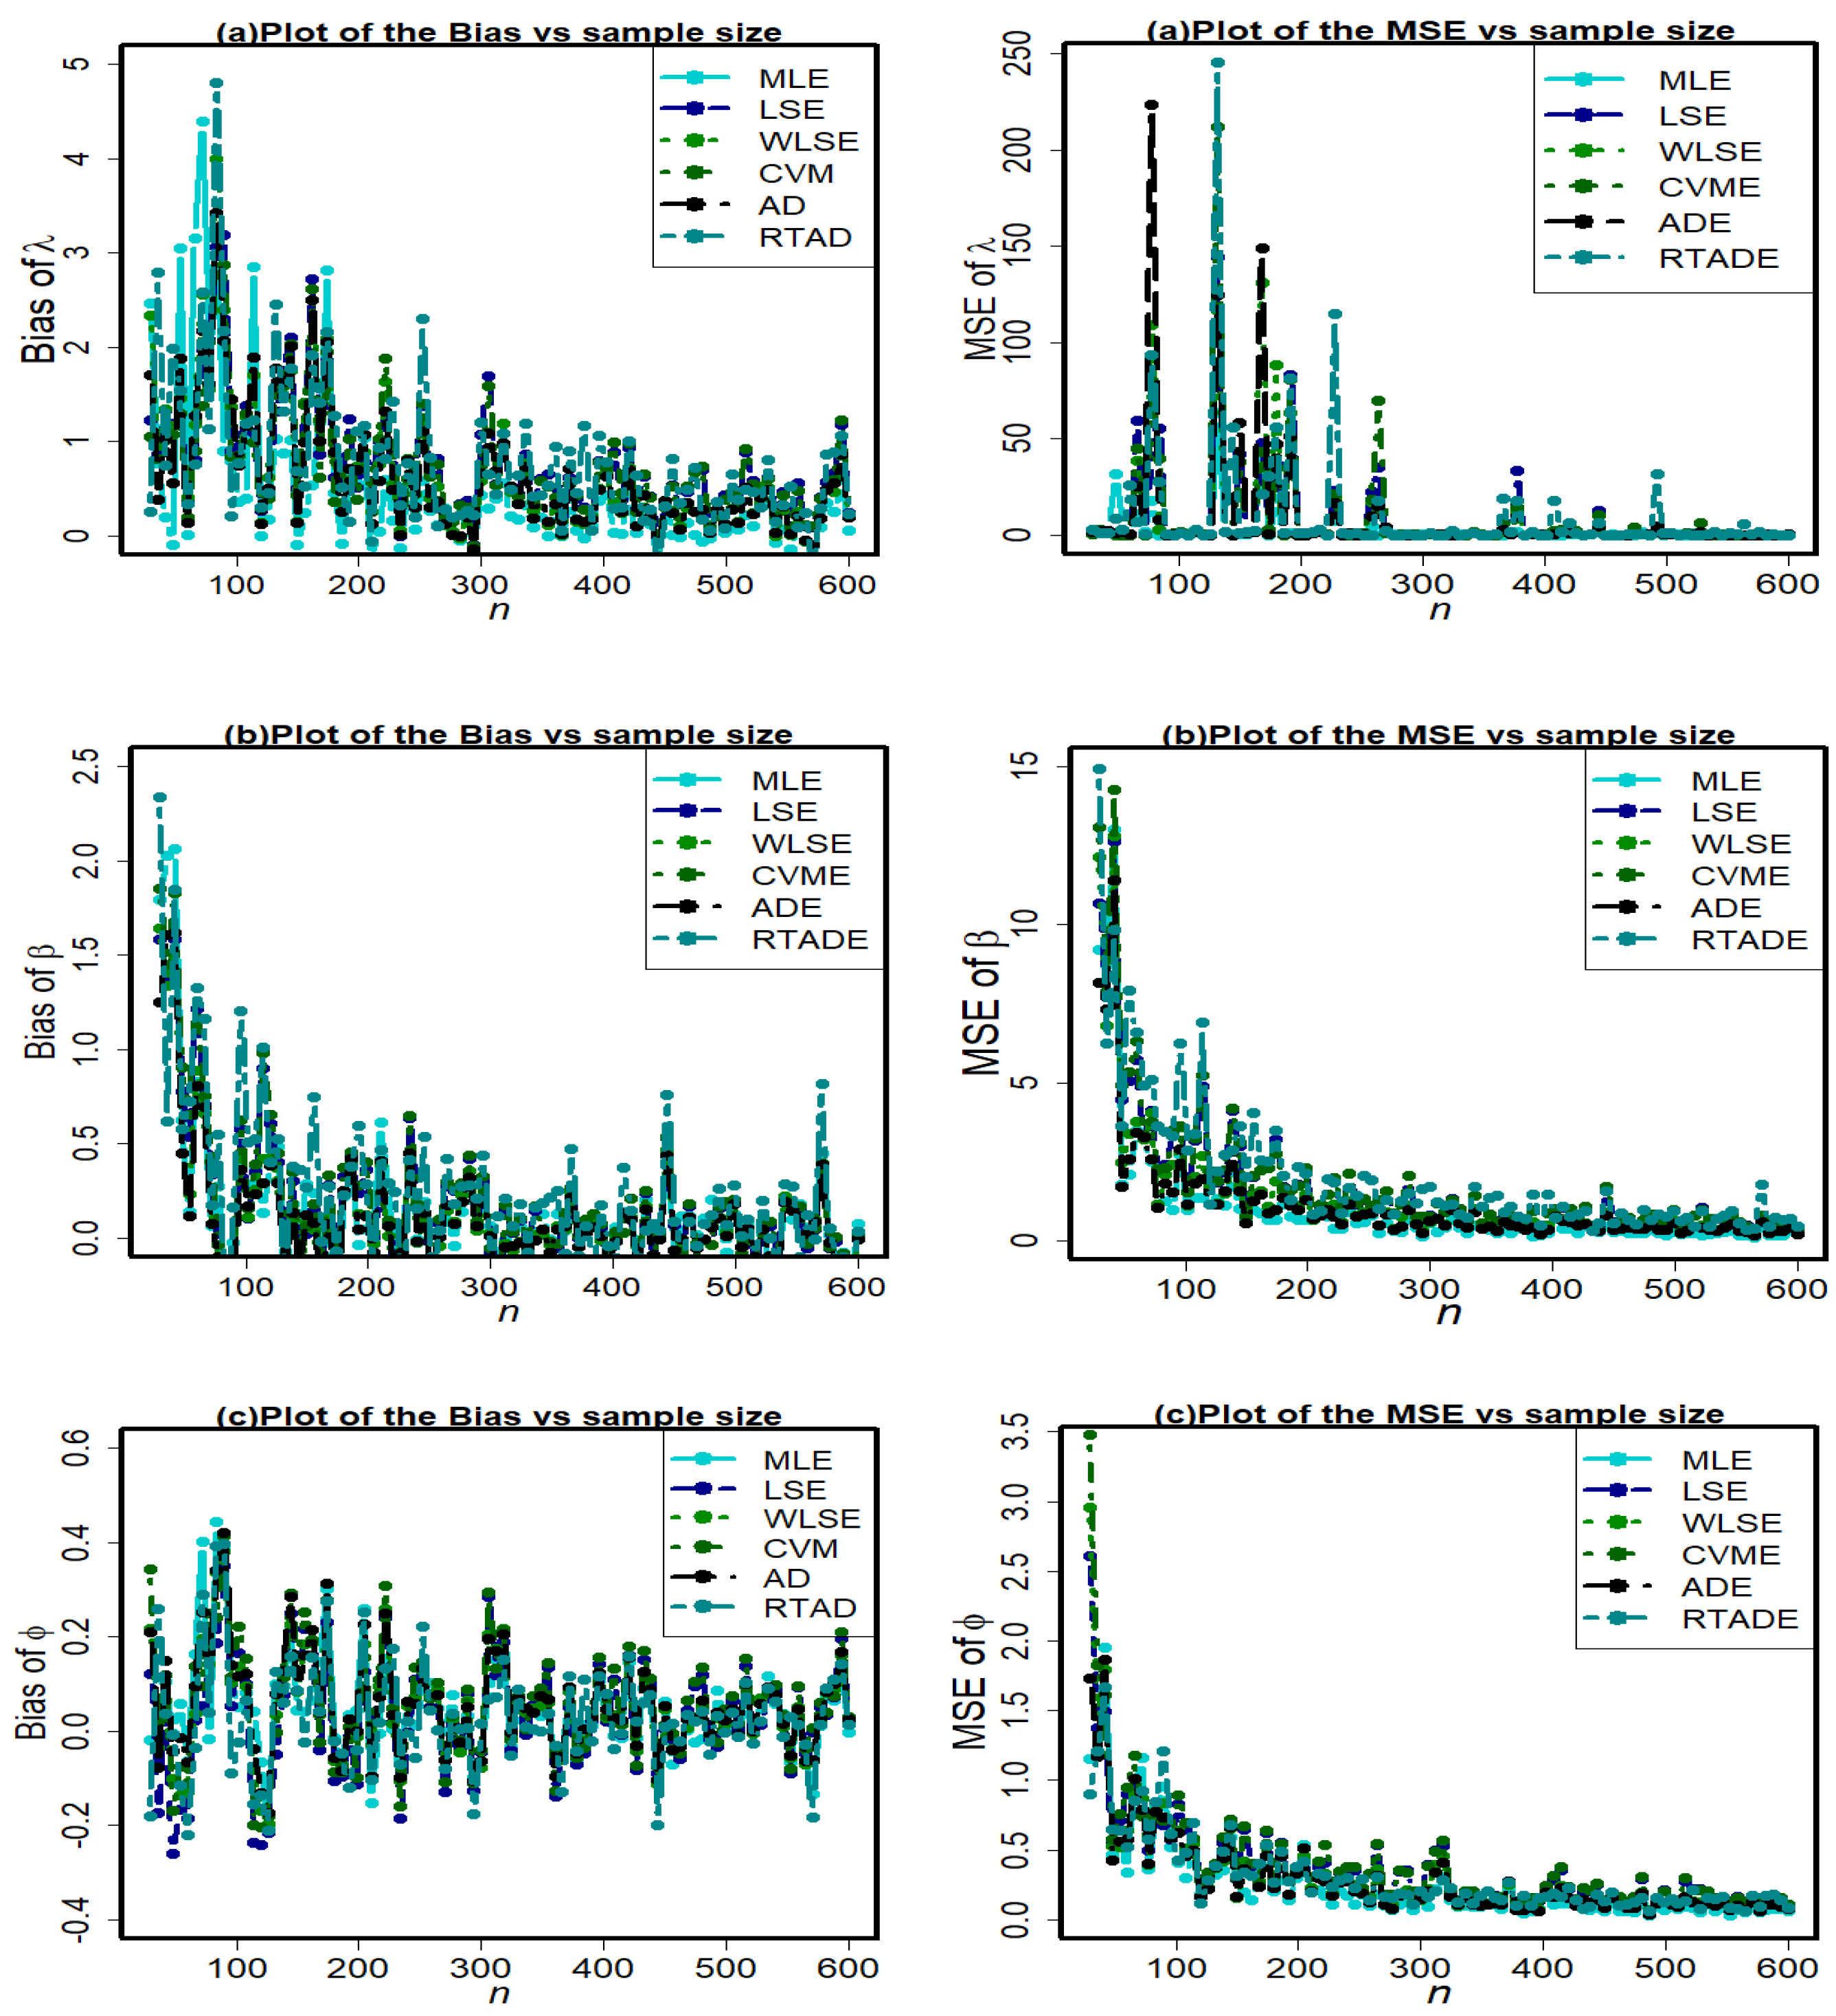
6. Simulation Study
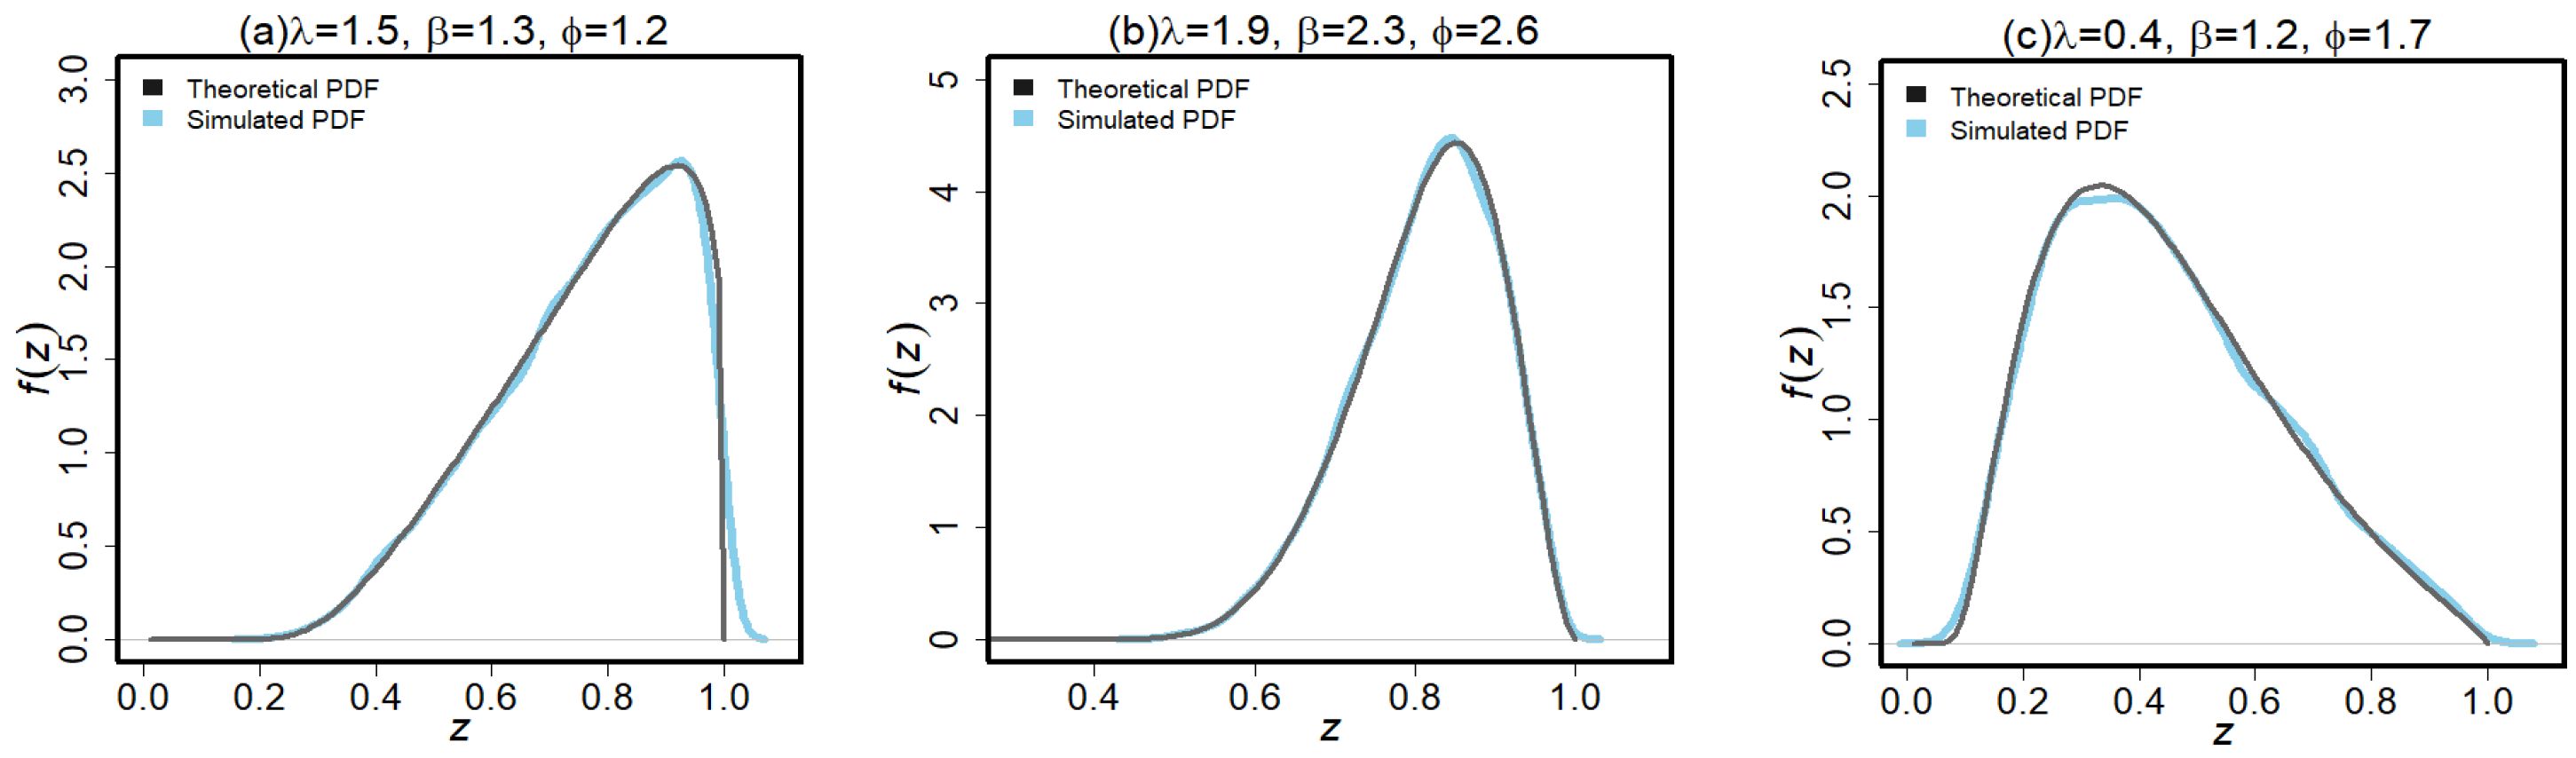
Since it is not theoretically possible to compare the effectiveness of different estimators derived in the aforementioned sections, we use a Monte Carlo simulation analysis to determine which of the six traditional estimation procedures is the most effective. We generated samples of different sizes
from the HLUG-TI distribution for the real value of parameters
. The theoretical and simulated density functions of the HLUG-TI
model for given parameters choices are given in
Figure 8. To obtain the bias average and MSE for each case, we execute the algorithm 10,000 times. The validity of the estimators is assessed using these biases and the MSE. The best estimator techniques are those that reduce MSE and estimator bias. The following stages are used to implement a simulation study for this purpose:
1. Generate ten thousand samples of size n from (4) for the HLUG-TI model. This work is done simply by the quantile function and generated data from the uniform distribution.
2. Evaluate the estimates for 10,000 samples, say for 10,000.
3. Perform the biases and MSE calculations. The following formulas are used to accomplish these goals:
where
4. For all estimation approaches, these procedures were repeated for
with the aforementioned parameters. To determine the value of estimators, we used R’s optim function. In
Figure 9,
Figure 10 and
Figure 11, the simulation outcomes are shown graphically. As seen in
Figure 9,
Figure 10 and
Figure 11, these biases and MSEs change with regard to
n (left and right panels).
The pattern in the MSEs indicates consistency because the MSEs converge to zero when the value of
n increases, but we can conclude that the estimators have the property of asymptotic unbiasedness because as
n increases, the bias goes to zero. From
Figure 9,
Figure 10 and
Figure 11, the following observations can be extracted:
For all estimation techniques, the bias of and reduces as n increases.
For all methods, the biases of are generally positive.
For all methods, the negative biases of and are also observed.
The bias of parameter is larger than parameter and .
Under all of the methods, the MSEs of seem larger.
Based on
Figure 9,
Figure 10 and
Figure 11, the MLE method has the minimal amount of MSE; however, for a large sample size, all methods have almost the same behavior and converge to zero as expected.
Using the entries of the graphical study for different parametric combinations, we can conclude that the MLE method outperforms all other estimation methods with an overall minimum amount of bias and MSE. Therefore, depending on the simulation study, the MLE method performs best for HLUG-TI distribution.
A general conclusion from the figures is that, for all approaches, bias and MSE for three parameters converge to zero as sample sizes increase. This demonstrates the reliability of these estimating strategies for the HLUG-TI model’s parameters.
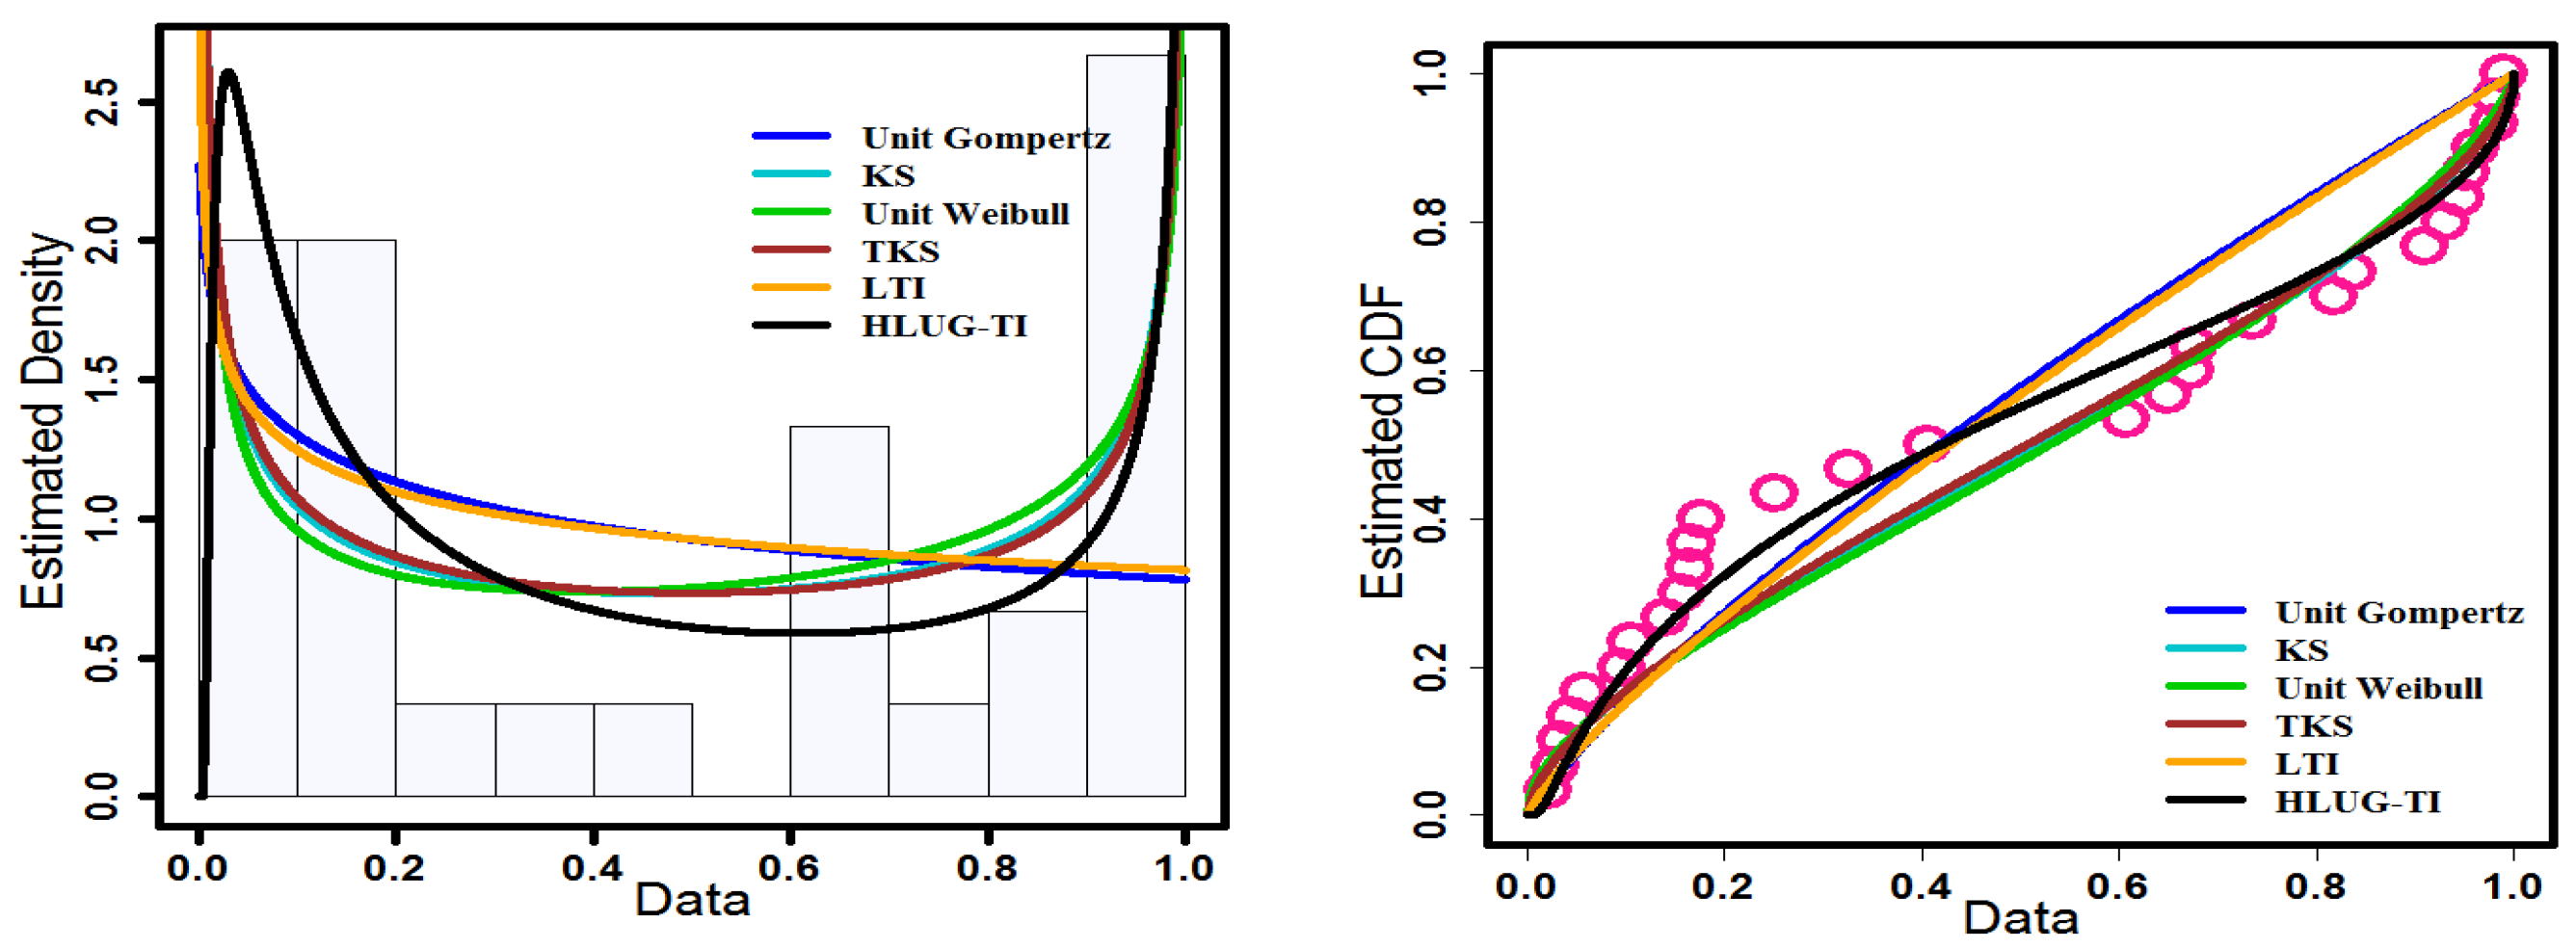
7. Real Data Applications
In this section, we implement the HLUG-TI
model on practical datasets to demonstrate its versatility in comparison to a set of competing models. The objective of the HLUG-TI
model is to provide an alternate distribution to fit the unit interval data in comparison to other distributions found in the literature. The first dataset from the reliability engineering field consists of 20 observations of the failure times of mechanical components [
24]. The second dataset relates to the total milk yield in the first birth of 107 cows at the Carnauba farm in Brazil. These data are available in these studies [
25,
26]. To conclude, for the two datasets, the HLUG-TI model shows to be the most suitable model, demonstrating its applicability in a realistic environment. The parameters of the models were estimated by the MLE method [
27,
28].
Now, we compare the HLUG-TI model to a set of competing models, which are as follows: unit-Gompertz [
1], Kumaraswamy [
29], unit-Weibull [
30], transmuted Kumaraswamy (TKSW, [
31]) and Lehmann Type-I (LTI, [
32]) distributions. To determine the rationality of utilizing the HLUG-TI distribution to fit these datasets, the goodness-of-fit measures the following: Akaike information criterion (AIC), Bayesian information criterion (BIC), Cramer–von Mises (CVM) and Anderson–Darling (AD). Consequently, the Kolmogorov–Smirnov (K-S) test is considered, and the
P-value (PV) of K-S test was specified to compare models. The K-S statistic of the distance between the fitted and empirical distribution functions is one of the most widely used goodness-of-fit test statistics for determining how well a random sample’s distribution agrees with a theoretical distribution. The best model has high PV and low AIC, BIC, CVM, and AD values [
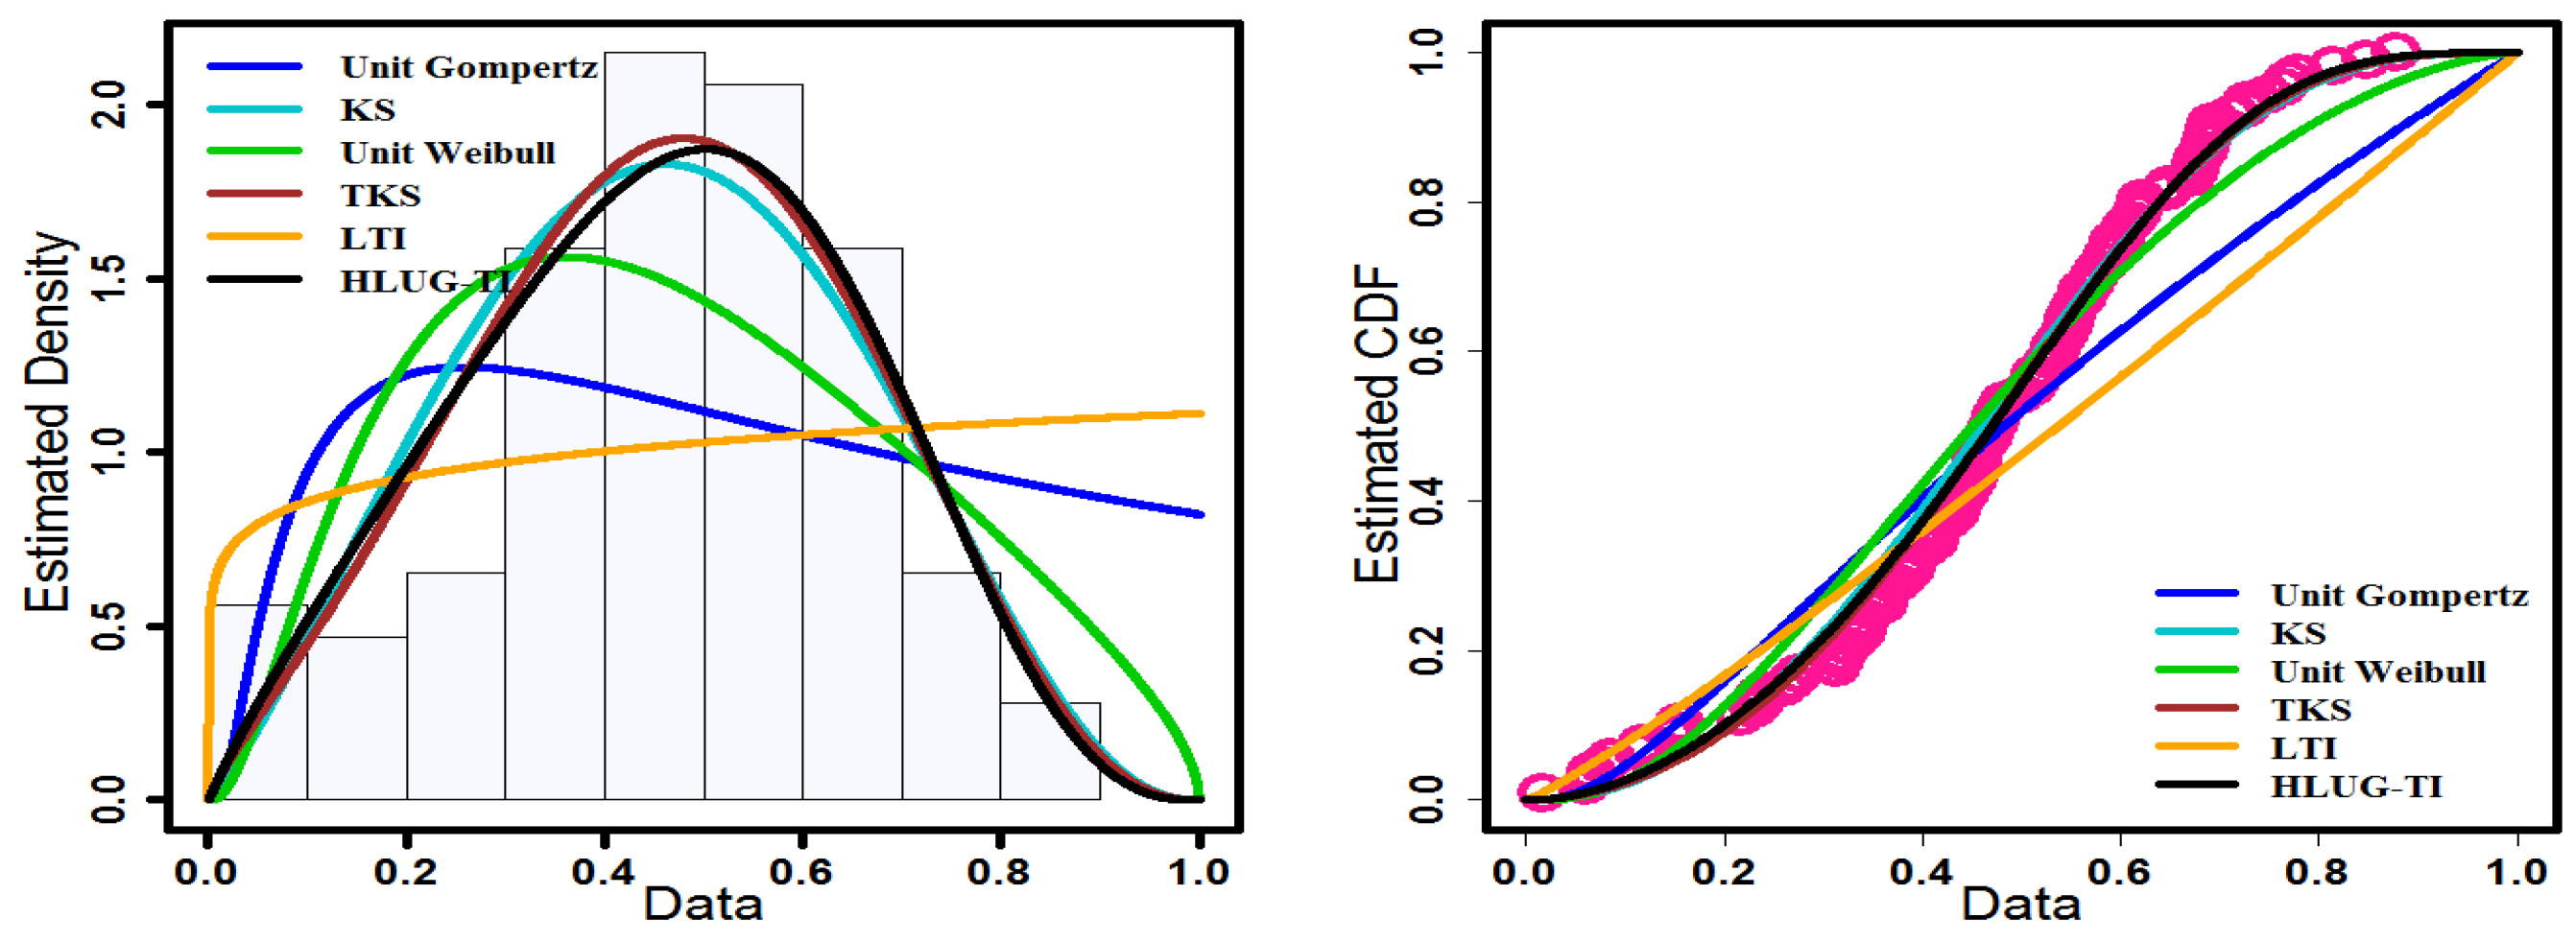
33]. An overview of the estimated MLEs and fitted information criteria for both data sets using various models can be seen in
Table 2,
Table 3,
Table 4 and
Table 5. The values of the above measures suggest that the HLUG-TI model is a suitable competitor to other competitive distributions, and it also has the best fit among them. The histograms of the data sets and the fitted density function, as well as the plot of the empirical and estimated CDF of these fitted distributions, are shown in
Figure 12 and
Figure 13 to help determine if the HLUG-TI model is suitable.
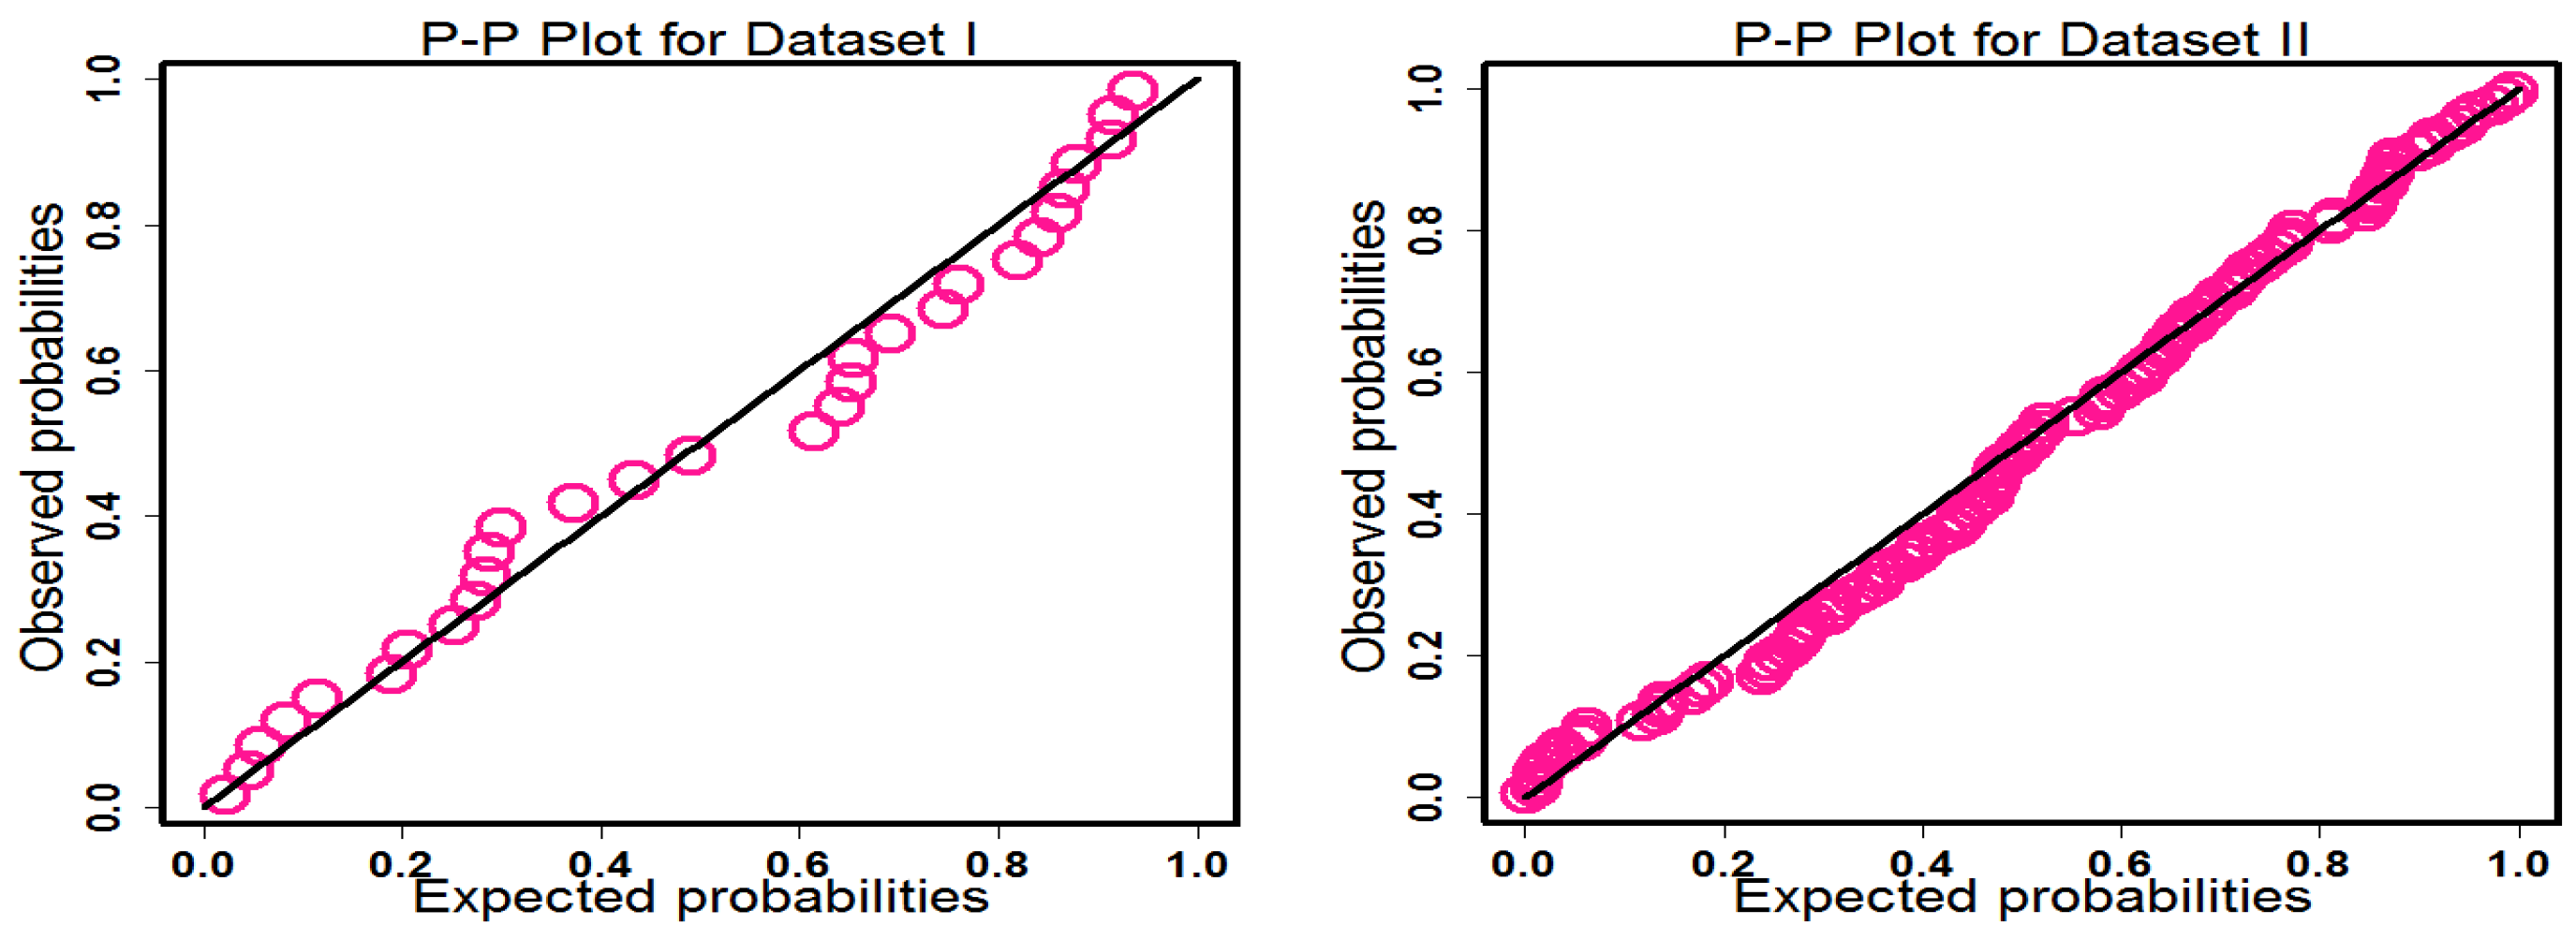
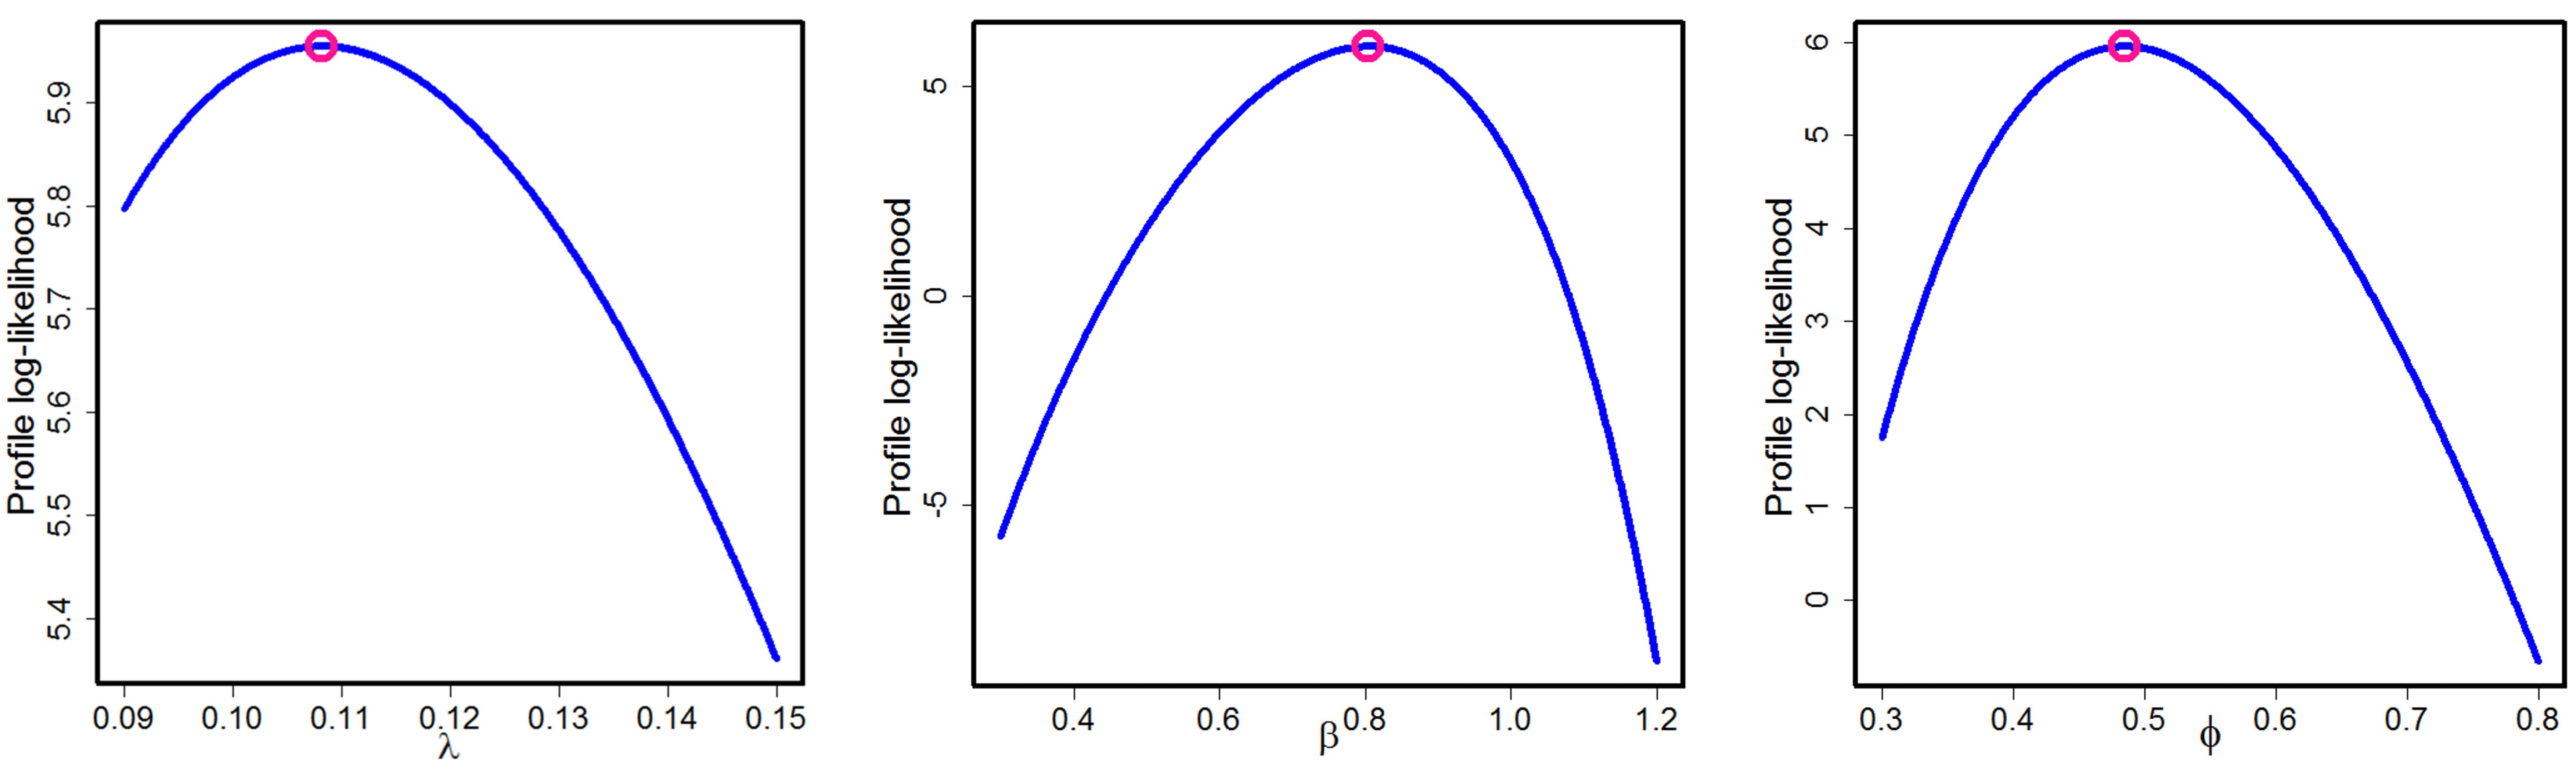
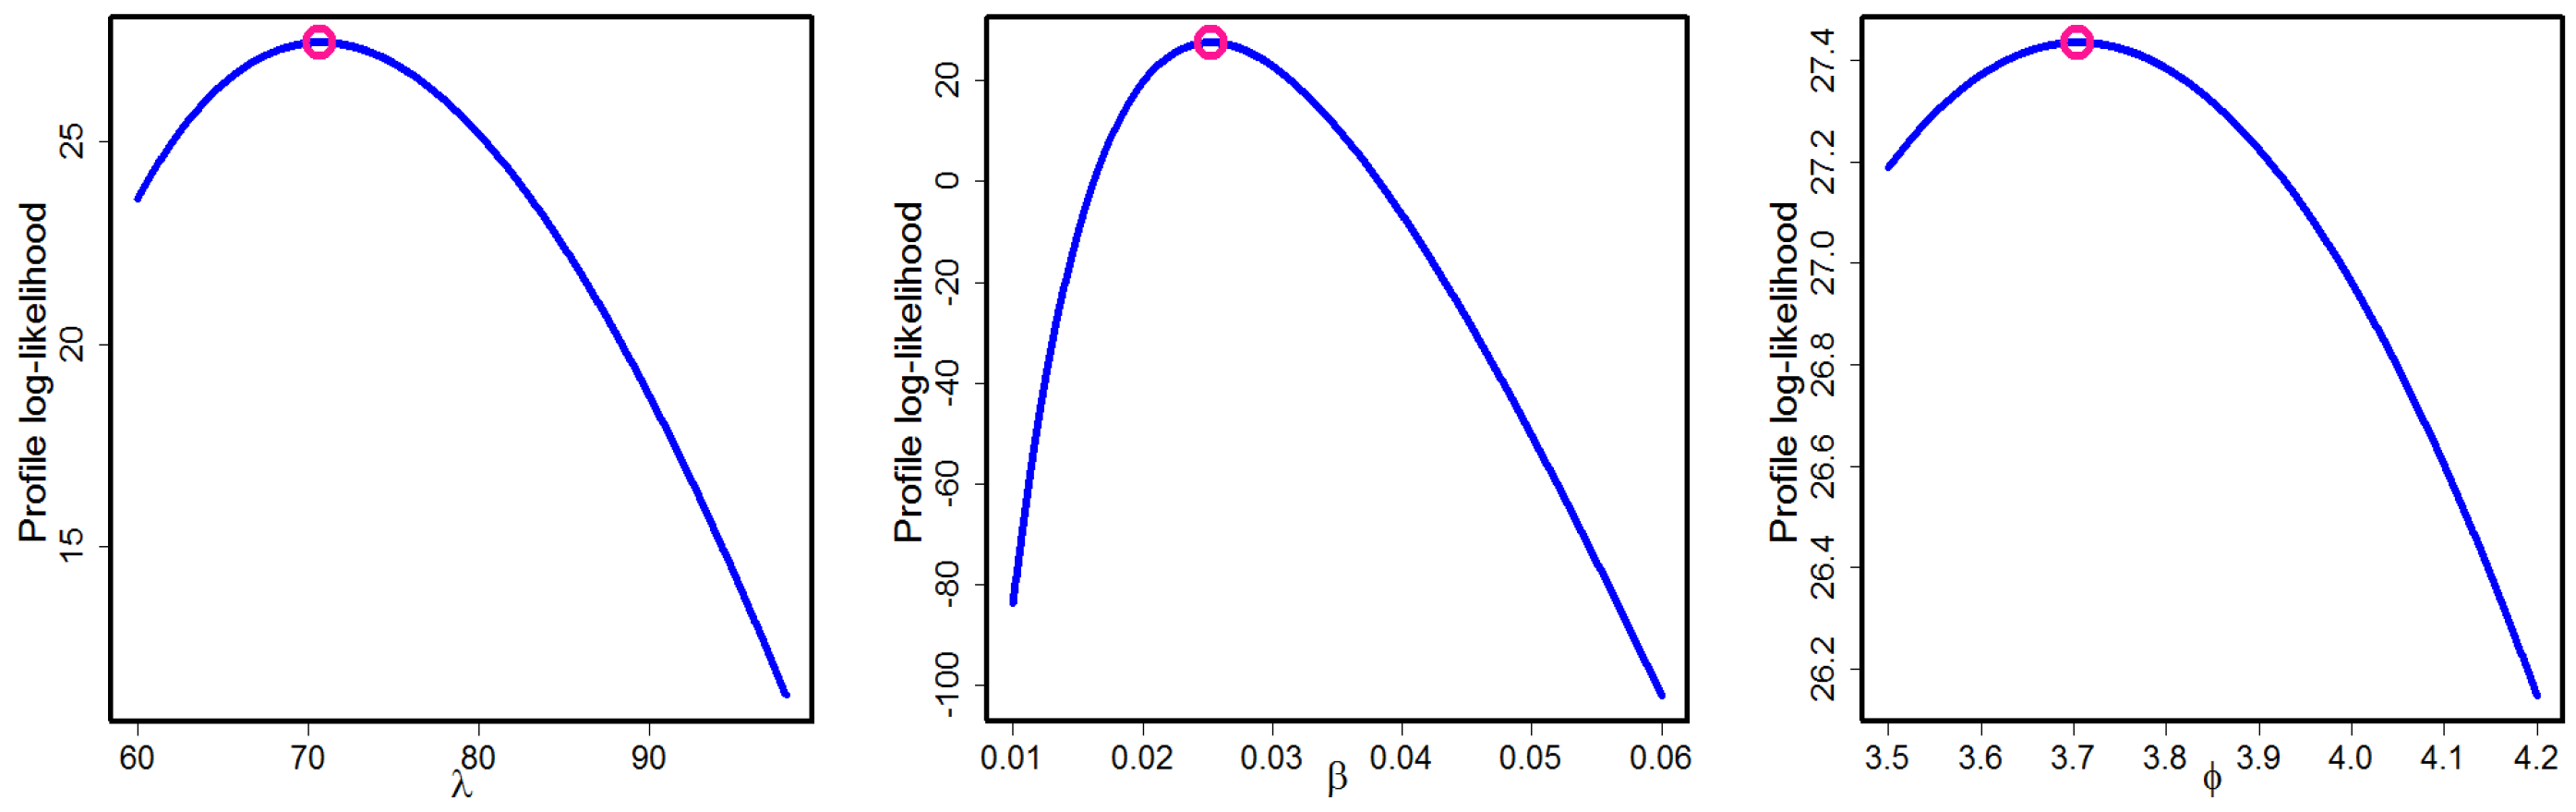
Figure 14 also shows the P-P plots for the HLUG-TI model. Based on such graphical methods, we can suggest that the HLUG-TI model is a better model for the data sets under consideration. The profile likelihood functions of parameters of HLUG-TI for both data sets are presented in
Figure 15 and
Figure 16.
8. Conclusions
In this study, we present a novel three-parameter model called the half-logistic unit-Gompertz type-I (HLUG-TI) distribution, which generalizes the unit-Gompertz distribution. It is competent at modeling data with increasing, bathtub, unimodal, and then bathtub hazard rate functions. Some mathematical properties of the introduced model are derived. The HLUG-TI parameters are estimated using six estimation methods, namely the maximum likelihood, least squares, weighted least-squares, Cramér–von Mises, Anderson–Darling, and right-tail Anderson–Darling estimators. The simulation study is conducted to explore the efficiency of these estimators and to provide a guideline for applied statisticians and engineers in choosing the best estimation method. Further, the importance of the HLUG-TI model is utilized by two real data applications. The goodness-of-fit for the two data sets show that the introduced model outperforms the four competitors, all of which are based on the bounded interval.


 ,
, 


