Article

Reliability Prediction of Tunnel Roof with a Nonlinear Failure Criterion

1
Bangor College, Central South University of Forestry and Technology, Changsha 410004, China
2
School of Civil Engineering, Central South University of Forestry and Technology, Changsha 410004, China
*
Author to whom correspondence should be addressed.
Mathematics 2023, 11(4), 937; https://doi.org/10.3390/math11040937
Submission received: 3 January 2023 / Revised: 3 February 2023 / Accepted: 7 February 2023 / Published: 12 February 2023

Abstract

:
Based on the kinematics-based upper bound theorem and reliability theory, the stability of deep tunnel roofs in nonlinear Hoek-Brown media is investigated. The performance functions of rectangular and circular tunnels are proposed according to the roof collapse mode, respectively, with support pressure and pore water pressure being considered. With the proposed performance function of the rectangular tunnels, the first-order reliability method is utilized to perform reliability analysis. The rock strength parameters are regarded as random variables following the normal or lognormal distribution. To assess the validity of the obtained results, reliability indexes for different support pressure values are calculated and compared with solutions using the response surface method and Monte-Carlo simulation. The agreement shows that the first-order reliability method effectively evaluates the reliability index with the proposed performance function. Sensitivity analysis is performed to throw light on the significance of different random variables, and the impact of the variation coefficient on reliability indexes is discussed. For circular tunnels, MCS is utilized to evaluate the roof stability with the proposed performance function. The influences of the support pressure on the reliability index and the corresponding design points are investigated. The parametric study shows that the normal distribution of random variables has more influence on the failure probability than that of the lognormal distribution. However, the difference between the two distributions is small. σ t is the major factor that influences the reliability index compared to the B and r u . The supporting pressure for circular tunnels is smaller than that of rectangular tunnels when a target reliability index of 2.5 (failure probability equals 0.62%) is given.

1. Introduction

In traditional stability analyses of deep tunnels, the average values of parameters are often utilized to characterize the material properties. Hou et al. [1] assessed the three-dimensional (3D) stability of a non-circular tunnel. A reinforcement effect of bolts on the tunnel face is considered. Then, Zhong et al. [2] extended the 3D face stability problem to the rock tunnel and proposed a new multi-cone mechanism to portray the failure of tunnel faces. Chen et al. [3] constructed a series of 3D heterogeneous failure models with different joint dip angles to analyze the fracture characteristic of zonal disintegration and figure out the failure mechanism of circle tunnels constructed in heavily jointed rock. The result gives us a significant understanding of the zonal disintegration in deep rock engineering. To modify the isotropic stress field assumption of the classic convergence–confinement method in tunnel engineering, Lee et al. [4] studied the effect of the overburden depth and stress anisotropy on tunnel safety.
Adopting the numerical simulation method (PFC2D), Qiu and Feng [5] investigated the influence of different tunnel distributions on the dynamic response characteristics of a remote tunnel. The dynamic stress and strain evolution, and damage feature of the tunnel were studied in detail.
However, the uncertainty of soil parameters is a common existence in practical engineering, the traditional deterministic analysis for accessing the stability of geotechnical engineering gradually cannot meet the requirements of the design. This uncertainty usually poses great challenges in the design and construction of geotechnical engineering. Unlike traditional deterministic algorithms mentioned above, reliability analysis is widely regarded as a rational approach since it can provide explicit consideration of engineering uncertainties.
Plenty of contributions concerning the probabilistic analysis of tunnel engineering have been made by several scholars. Berisavljević et al. [6] proposed a method to determine overbreaks in rock tunnel construction using the drill-and-blast technique. Considering the stochastic and statistical nature of the problem, a probabilistic analysis was used to determine the failure probability of an unsupported part.
Su et al. adopted the first-order reliability method (FORM) to assess the stability of a working highway tunnel [7]. The limit state function formulated for the primary support is implicit, and the probabilistic analysis is relatively easy. Lü and Low [8] conducted a probabilistic analysis of rock cavities by the response surface method (RSM) and second-order reliability method (SORM). The response surface is built by an iterative algorithm and the probability of failure is evaluated using the FORM and SORM. The correlated non-normal variables are chosen as basic random variables. This method is applied to a circular tunnel with analytical solutions considering Mohr–Coulomb and Hoek–Brown yield criteria, respectively.
Recently, with the development of artificial intelligence and big data, machine learning has a wide application in geotechnical engineering. Hussaine and Mu [9] used an automated machine learning technology to predict surface subsidence during the advancement of a shield-driven tunnel. Goh and Zhang [10] utilized the artificial neural network approach (ANN) to determine the limit state surface following which a simplified reliability method was developed to access the probability of failure. This procedure evaluates the probability of instability induced by stress for deep-buried rock tunnels. The factor of safety of the tunnel was derived by using a finite difference program. Subsequently, Zhang and Goh [11] studied the ultimate and serviceability limit states with the aid of FLAC3D. The First-Order Reliability Method (FORM) was utilized to calculate the failure probability at the limit state. According to the different target performance levels, the required critical FOS is captured.
Mollon et al. [12] also used the FORM and response surface method (RSM) to analyze the reliability of tunnel faces. Then, Mollon et al. [13] used the collection-based random RSM to analyze the probability of tunnel face stability. More input parameters were taken as random variables, including material shear strength, weight, overburden, and supporting pressure, the efficiency has been further improved. Zeng et al. [14] applied the reliability analysis to the rock tunnel excavation face by FORM, RSM, and the importance sampling method. The aforementioned works mainly focused on the stability of tunnel faces and were merely involved in the tunnel roof. During the underground excavation in rock masses, the variability of rock parameters due to different complicated geological environments is very significant. The values of geotechnical parameters vary with position and cannot be represented by the simple value measured by engineers. The variability of the parameters is of necessity to be considered. Therefore, this work extends the reliability analysis to the tunnel roof stability.
With the improvements in probabilistic methods [15], reliability analysis has been extensively applied to analyze tunnel stability. In this research, an efficient algorithm for FORM is utilized to compute the reliability index and the design point, based on the linear failure criterion. However, its accuracy may be impaired when it is used in complex engineering problems with nonlinear materials. To tackle the problem, the failure probability is obtained with the help of RSM and Monte Carlo simulation.
Considering the Hoek–Brown criterion and variational method, Fraldi and Guarracino [16,17] presented an exact solution to describe the failure shape of deep tunnel roofs. Yang and Huang [18] incorporated the effect of pore water pressure into the tunnel roof problem where the kinematics-based limit analysis theorem was applied [19]. However, the influences of support pressure and uncertainties of the rock strength parameters are not involved in those published works.
In this paper, the deterministic models of roof collapse are obtained based on the kinematic analysis theorem and associated flow rule. The performance functions are established for rectangular and circular tunnels, respectively. The effect of underground water on the support pressure is considered. For the reliability analysis of the tunnel roof stability, rock strength parameters and pore water pressure coefficient are regarded as random variables. The other parameters such as the geometry of the tunnel due to its low variability are taken as constant. Two common distribution forms of the random variables, normal and lognormal distributions, are discussed in the reliability analysis. Taking support pressure and pore water pressure into account, the collapse mechanism of the tunnel roof is first considered, as it underlies the performance function of subsequent reliability analysis. For rectangular tunnels, the performance function is proposed. FORM analysis is carried out to evaluate the stability of excavated tunnel and to analyze the sensitivity of related parameters. RSM and MCS are applied to verify the effectiveness of these results. For circular tunnels, the performance function cannot be expressed in explicit form, and the MCS is utilized to calculate the failure probability. The sensitivity analysis of random variables is performed. The influence of the coefficient of variation (COV) on the reliability index is discussed. On top of that, the influences of the support pressure on the reliability indexes for rectangular and circular tunnels are discussed.

2. Methodology

2.1. Reliability Analysis Methods

2.1.1. FORM

The reliability index is used to evaluate the safety of engineering structure that takes into account the inherent uncertainties of the input variables. Hasofer and Lind [20] proposed the reliability index β for the correlated normal random variables as
β = min x F ( x μ ) T C 1 ( x μ )
where x denotes the random variable vector, μ denotes the mean value vector, C is the covariance matrix. In reliability analysis, the performance function g ( x ) is also called the limit state function. The limit state surface is defined as g ( x ) = 0 , which separates the n-dimensional domain of random variables into two regions: a failure region F represented by g ( x ) 0 and a safe region is given by g ( x ) > 0 .
According to the FORM, the probability of failure P f can be calculated by
P f 1 Φ ( β )
where Φ ( ) represents the cumulative distribution function (CDF) of the standard normal distribution.
In practice, the lognormal distribution is normally suggested in reliability analysis for random variables to avoid negative values when the coefficient of variation (COV) is no less than 0.25 [21]. For non-normal random variables, Rackwitz and Flessler [22] utilized a method to calculate the equivalent normal mean value μ X i and equivalent normal standard deviation σ X i . The equivalent normalized parameters are written as
μ X i = x i * Φ 1 [ F X i ( x i * ) ] σ X i
σ X i = ϕ [ Φ 1 [ F X i ( x i * ) ] ] f X i ( x i * )
where x i is the coordinate of the design point, f X i ( x i * ) is the initial probability density function ordinate at x i * , F X i ( x i * ) is the original non-normal CDF evaluated at x i * .

2.1.2. RSM

In general, explicit performance functions should be obtained to carry out reliability analysis. However, the performance function may be unlikely to be determined in complex engineering problems. RSM was proposed to approximate the real limit state function at the vicinity of the design point. According to the algorithm of RSM proposed by Tandjiria et al. [23], the reliability index and relevant design point are calculated by using a quadratic polynomial function. In his research, a second-order polynomial with squared terms is used. The formula can be expressed as
g ( x ) g ˜ ( x ) = a 0 + i = 1 n a i x i + i = 1 n b i x i 2
where x i are the basic random variables, n is the total number of random variables, and a 0 , a i and b i are coefficients to be determined. The procedure of this algorithm is as follows:
(a)
Sampling points are chosen around the mean value μ i . Usually, mean value points u with u i = μ i ± f σ X i are selected to evaluate the performance function g ( x ) , in which f is the sampling range factor.
(b)
Altogether 2 n + 1 coefficients of Equation (5) can be obtained by solving the set of linear equations. Thus, a tentative response surface g ˜ i ( x ) is generated.
(c)
Calculating the reliability index β and corresponding design points x i by FORM and Equation (1). In this computation, β is subject to the constraint that g ˜ i ( x ) = 0 .
(d)
Repeating steps (a)–(c) until β or x i converges. Besides the first trial, new sampling points may be selected around the tentative design points concerning the interpolation method.

2.1.3. MCS

MCS is regarded as a robust method where samples can be generated concerning the specific probability density of random variables [24]. According to the law of large numbers, the accuracy of MCS depends on the large number of samples and trials. The failure probability can be captured by
P f = 1 N i = 1 n I ( x i )
where N is the number of samples, and I ( x ) = 1 if x 0 and 0 elsewhere. The convergence of the failure probability is represented by its variation coefficient, namely
C O V = 1 P f P f N

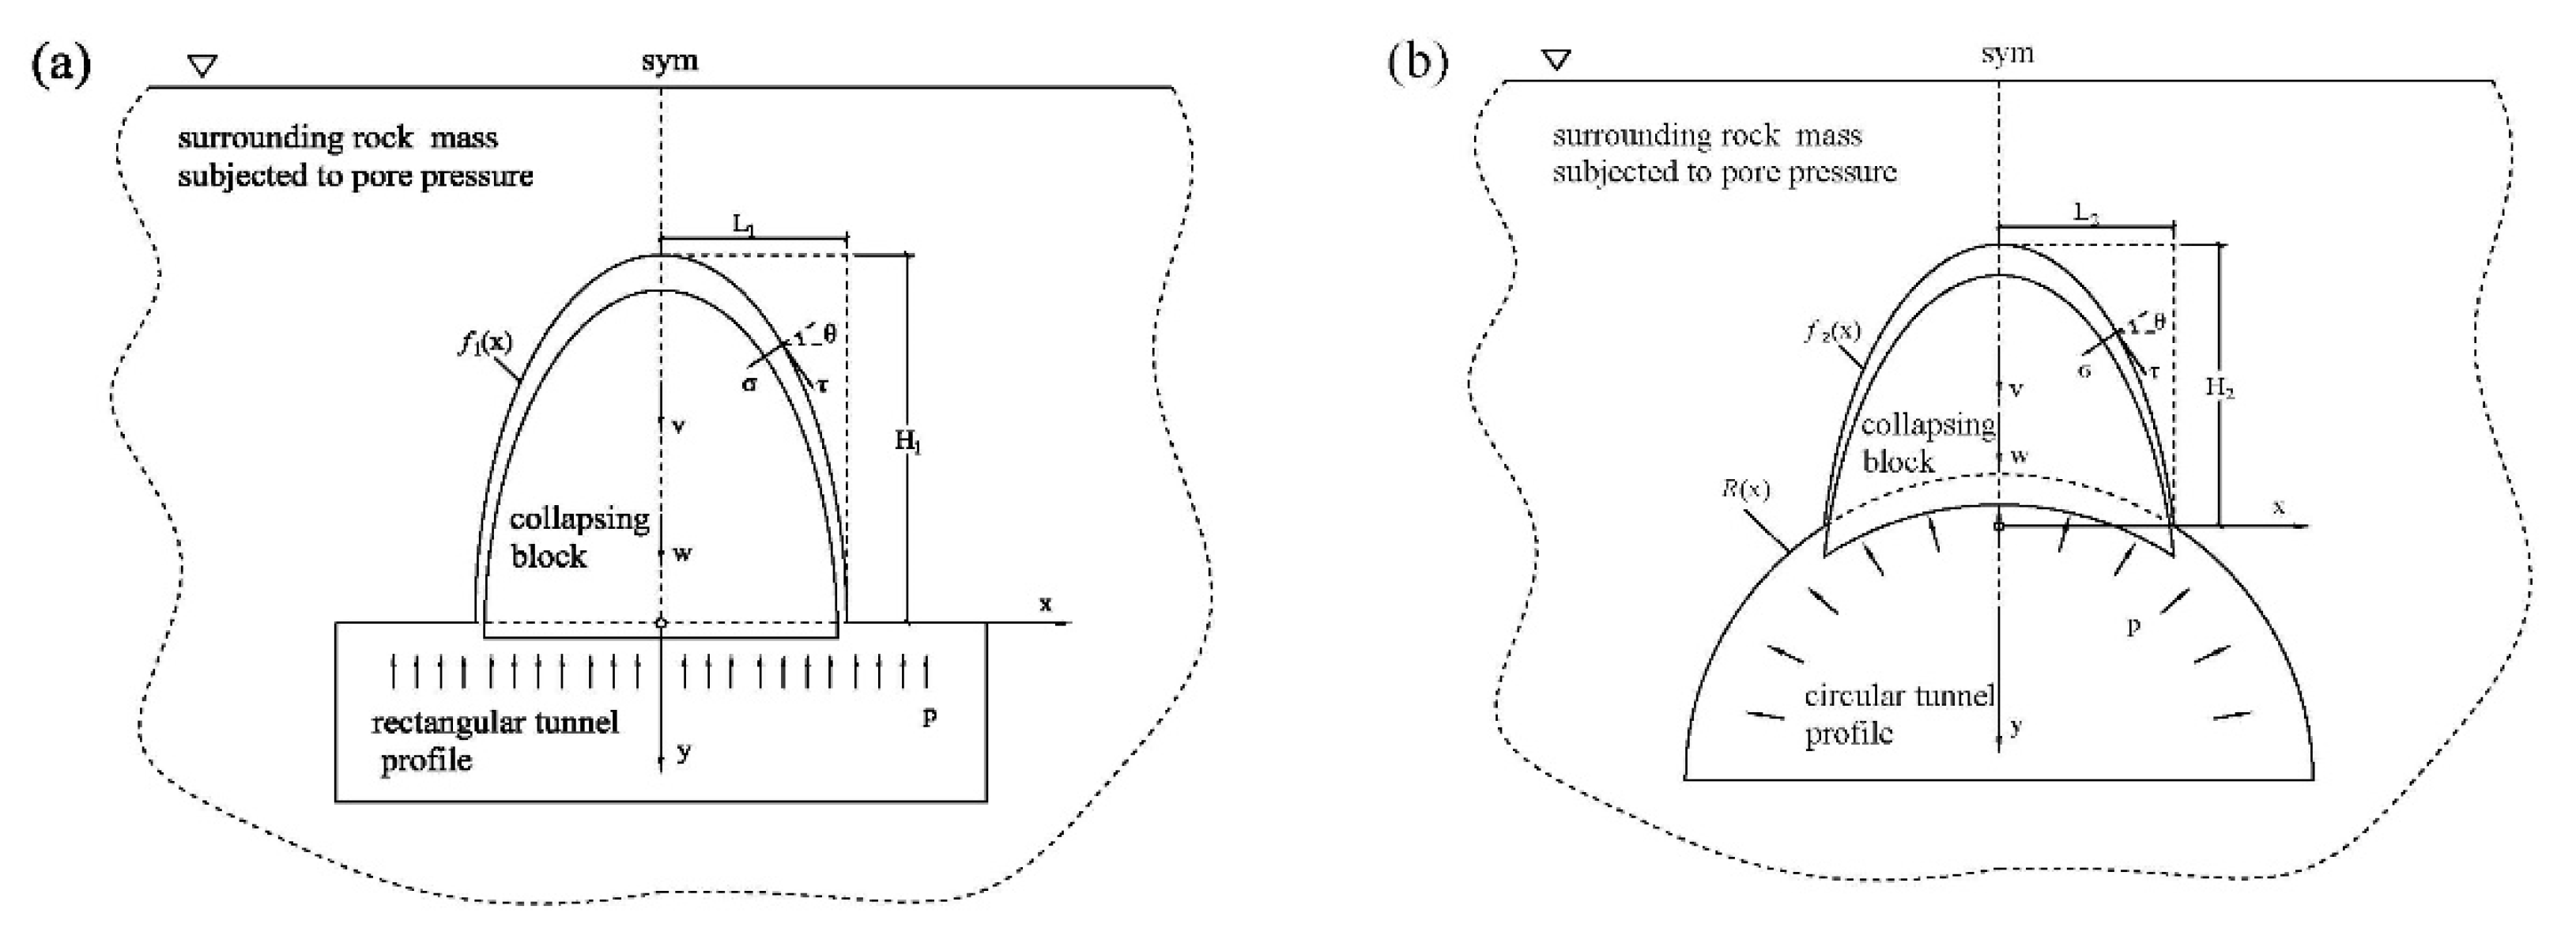
2.2. Kinematic Analysis of Tunnels Roofs with Hoek-Brown Criterion

The upper-bound limit analysis, as an efficient and rational theoretical method, has been utilized to address several kinds of geotechnical engineering problems, such as stability assessment of tunnel faces [25,26], roof collapse [27,28], earth pressure on retaining structures [29,30], and slope stability problems [31,32]. Based upon the upper-bound limit analysis method, the generalized Hoek–Brown failure criterion has been widely used to estimate the nonlinear characteristics of the rock mass. Since the potential failure of a deep tunnel is a complex nonlinear process, the Hoek-Brown failure criterion is employed to investigate the upper-bound solution of potential collapse. Aiming to compute the energy dissipation on the velocity discontinuity surface, the Hoek-Brown criterion is expressed as
τ = A σ c [ ( σ n σ t ) / σ c ] B
in which A and B represent material constants, σ n and τ represent the normal and shear stress, respectively; σ c is the uniaxial compressive strength, and σ t is the tensile strength.
As stated by Chen [33], the actual failure load is no more than the limit load obtained from the energy-work equilibrium equation for a randomly given kinematically admissible velocity field, when the deformation boundary condition is satisfied. Since the pore water pressure is incorporated, it takes the form by
V σ i j ε ˙ i j d v S T i v i d s + V X i v i d v V u ε ˙ i j d V S n i v i u d s
where σ i j and ε ˙ i j are stress and strain rate, respectively, T i and X i are the surface load and body load, respectively, V is the volume of the collapsing block, S is the length of velocity discontinuity, v i stands for the velocity along the detaching surface, n i is the unit vector, and u is the pore water pressure.
Based on Equation (9), one can establish an energy equilibrium equation, then, the velocity discontinuity curve, f ( x ) which describes the geometry of the failure block, as illustrated in Figure 1, is derived. The detailed derivation process concerning the velocity discontinuity curve can be found in Appendix A.

2.3. Performance Functions of Roof Collapse

According to the aforementioned failure mechanism, the geometry of the failure block for tunnels is derived for a given supporting pressure and material parameters. Different shapes of failure blocks might lead to different support pressure. The collapsing block over the deep tunnel roof forms a ‘collapsing arch’ which bears the whole gravity of the overlying rock mass. In order to ensure the roof stability of deep tunnels, the supporting pressure should be greater than the self-weight of the failure block. Therefore, the performance function of tunnel roof stability is derived.
For rectangular tunnels, the weight of the collapse block is
G 1 = γ 0 L 1 f 1 ( x ) d x
The supporting pressure in the area of collapse block is
Q 1 = σ p L 1
By comparing the total support pressure and the weight of the collapse block, the performance function of tunnel roof stability can be derived.
g 1 ( x ) = [ σ p σ t σ p ( 1 + r u ) B ] L 1
By simplification, the performance function of the rectangular tunnel is proposed by
g 1 ( x ) = σ p σ t ( 1 + r u ) B + 1
For circular tunnel, the weight of collapse block is expressed as
G 2 = [ γ 0 L 1 f 2 ( x ) R ( x ) d x ]
The supporting pressure in the area of the collapse block is
Q 2 = σ p L 2
The performance function of the circular tunnel is given by
g 2 ( x ) = σ p L 2 [ γ 0 L 2 f 2 ( x ) R ( x ) d x ] = σ p L 2 + γ 1 B A 1 B B B + 1 [ ( 1 + r u ) / σ c ] 1 B B L 2 1 + B B γ h 2 L 2 γ b 2 2 [ arcsin L 2 b L 2 b 1 ( L 2 b ) 2 ] = σ p L 2 γ 1 B A 1 B 1 B + 1 [ ( 1 + r u ) / σ c ] 1 B B L 2 1 + B B γ b 2 2 [ arcsin L 2 b L 2 b 1 ( L 2 b ) 2 ]
Because the analytical solution of L 2 is not found, the performance function of the circular tunnel is unable to be derived explicitly. Now that the performance function of the deep tunnel against roof collapse is obtained, a reliability analysis of roof stability is presented below.

3. Results and Discussion

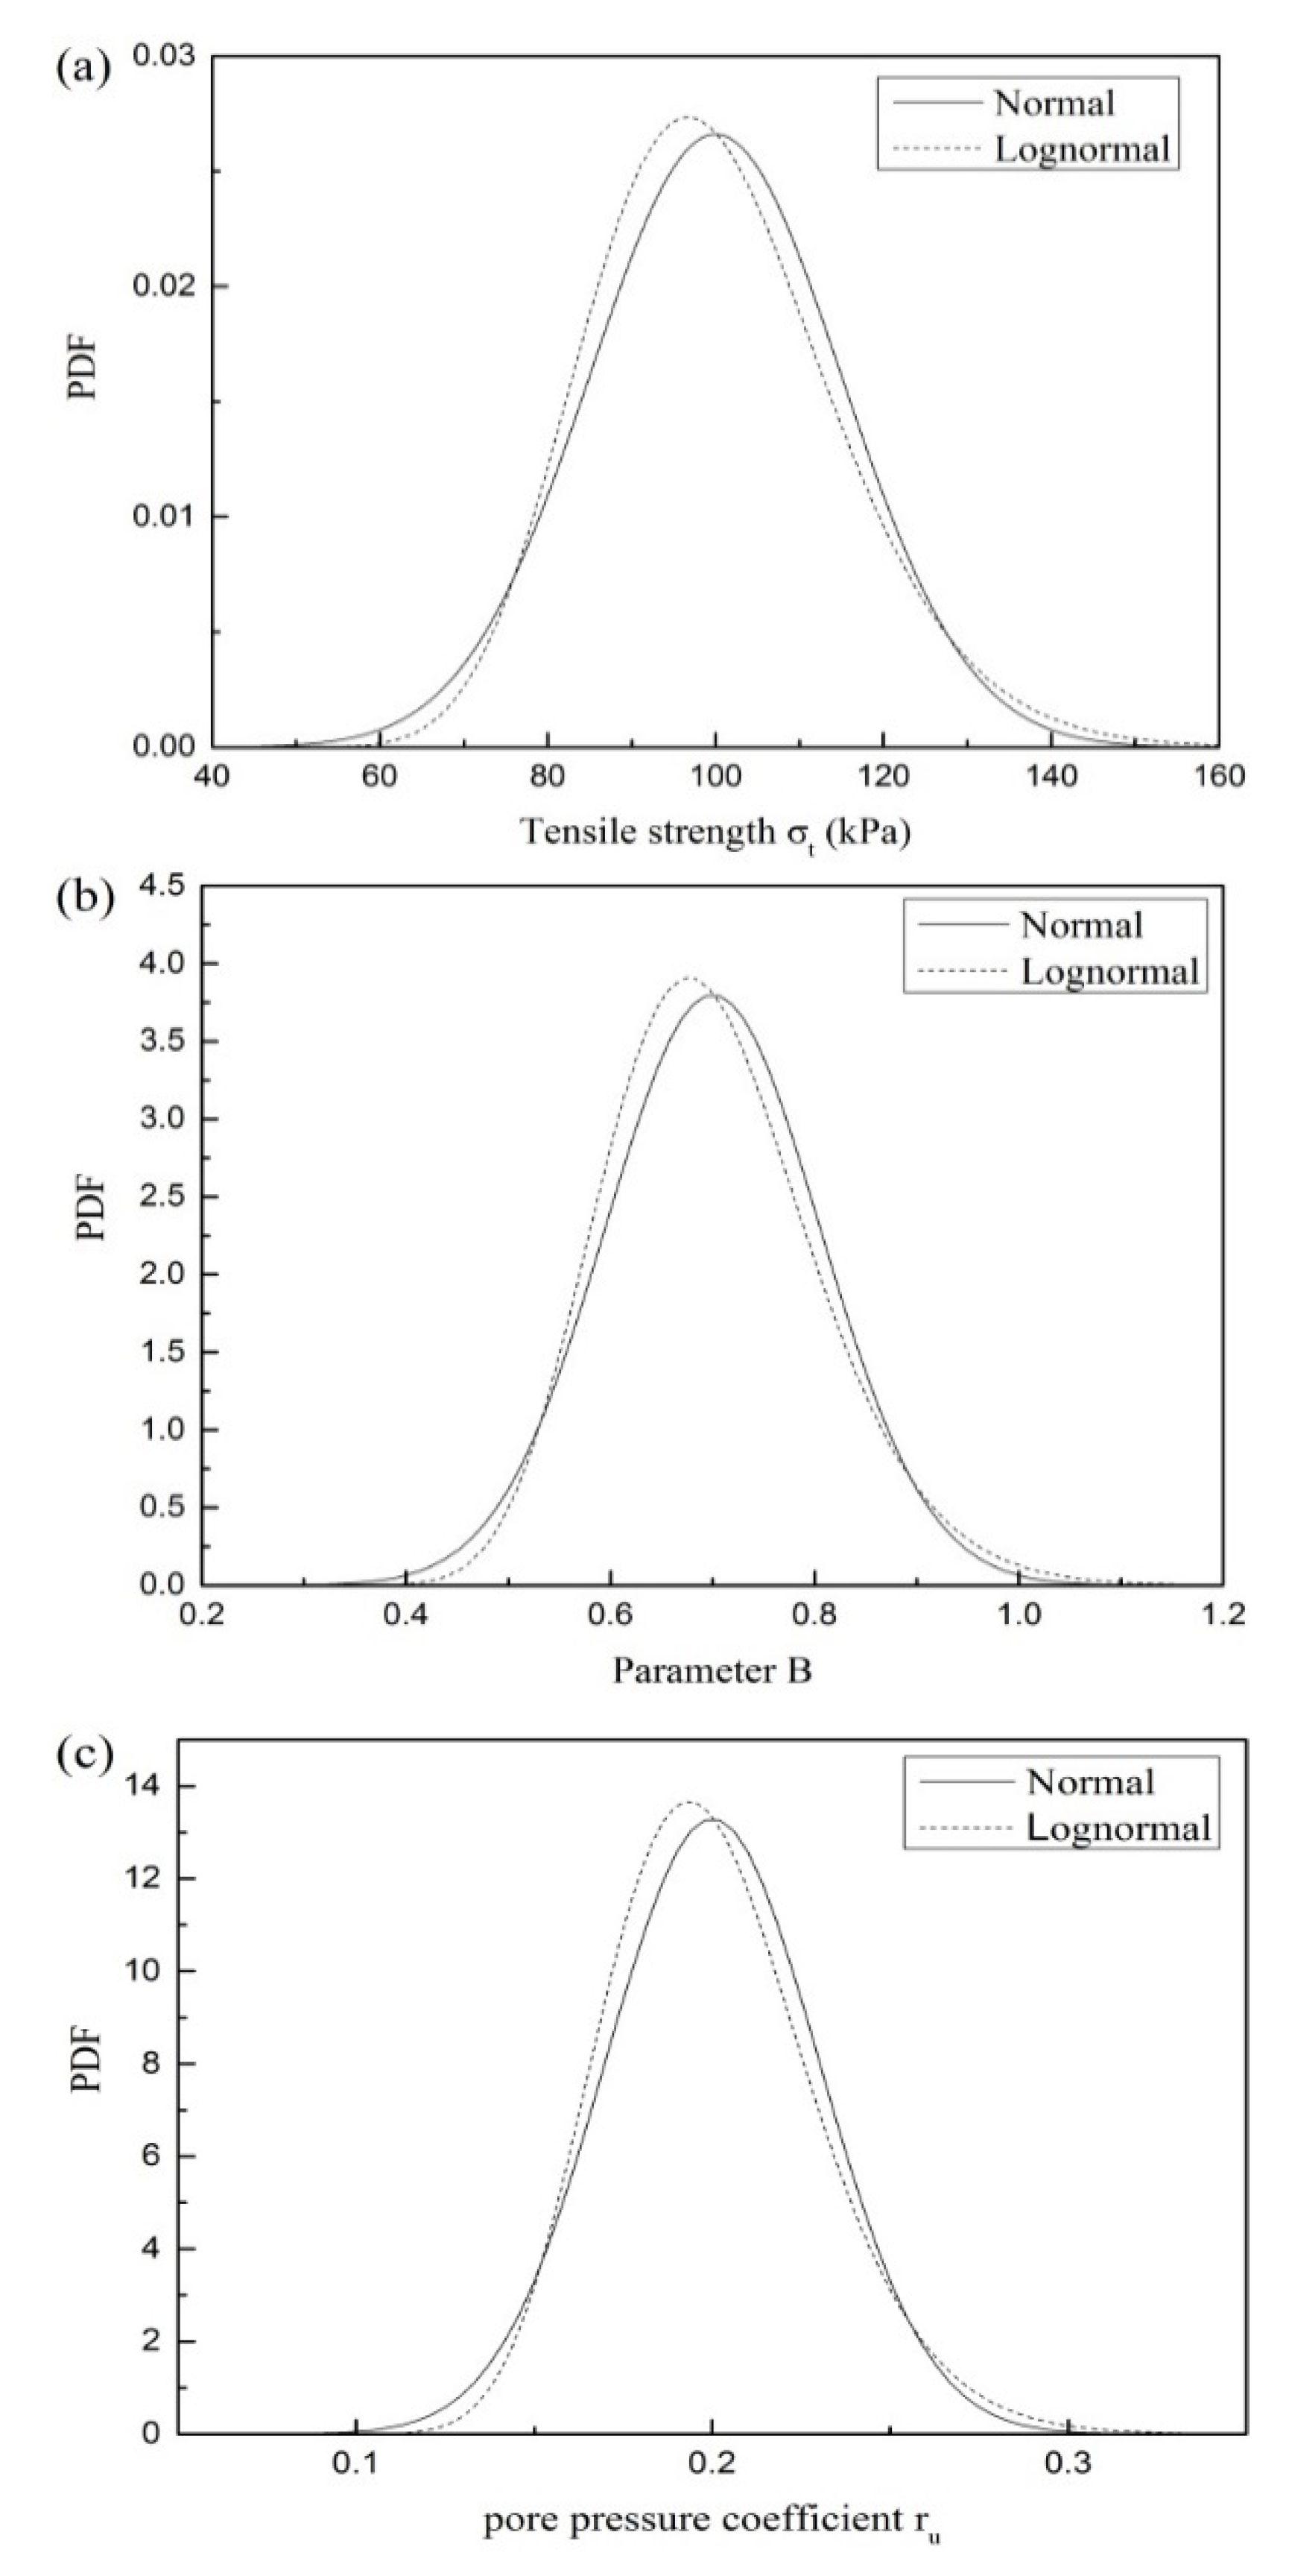
3.1. Reliability Analysis of Rectangular Tunnels

To perform reliability analysis, parameters involved in the performance function Equation (24) are defined as random variables. In this subsection, σ t , r u , B and σ p are regarded as random variables. Both normal and lognormal distribution of random variables is considered. Table 1 lists the mean values and the standard deviations of random variables. Figure 2 illustrates the probability distribution function curves of normal and lognormal distribution for different variables. It is observed from Figure 2 that the average value of PDF of the lognormal distribution is always smaller than those of the normal distribution in different parameters, and the peak value of the PDF of the lognormal distribution is always higher than those of normal distribution, which means that the assumption of normal distribution of random variables is conservative around the average value compared with the lognormal distribution.
Based on the performance function in Equation (24), FORM is employed to calculate the reliability index and the corresponding failure probability of rectangular tunnels. For examination, the results obtained by FORM are compared with the results calculated by RSM and MCS. The reliability indexes computed by FORM, RSM, and MCS are listed in Table 2. It is found that there is little difference among reliability indexes obtained by FORM, RSM, and MCS, and the size relationship between different methods is not fixed and shows a certain randomness. Therefore, the results obtained by these methods are reliable.

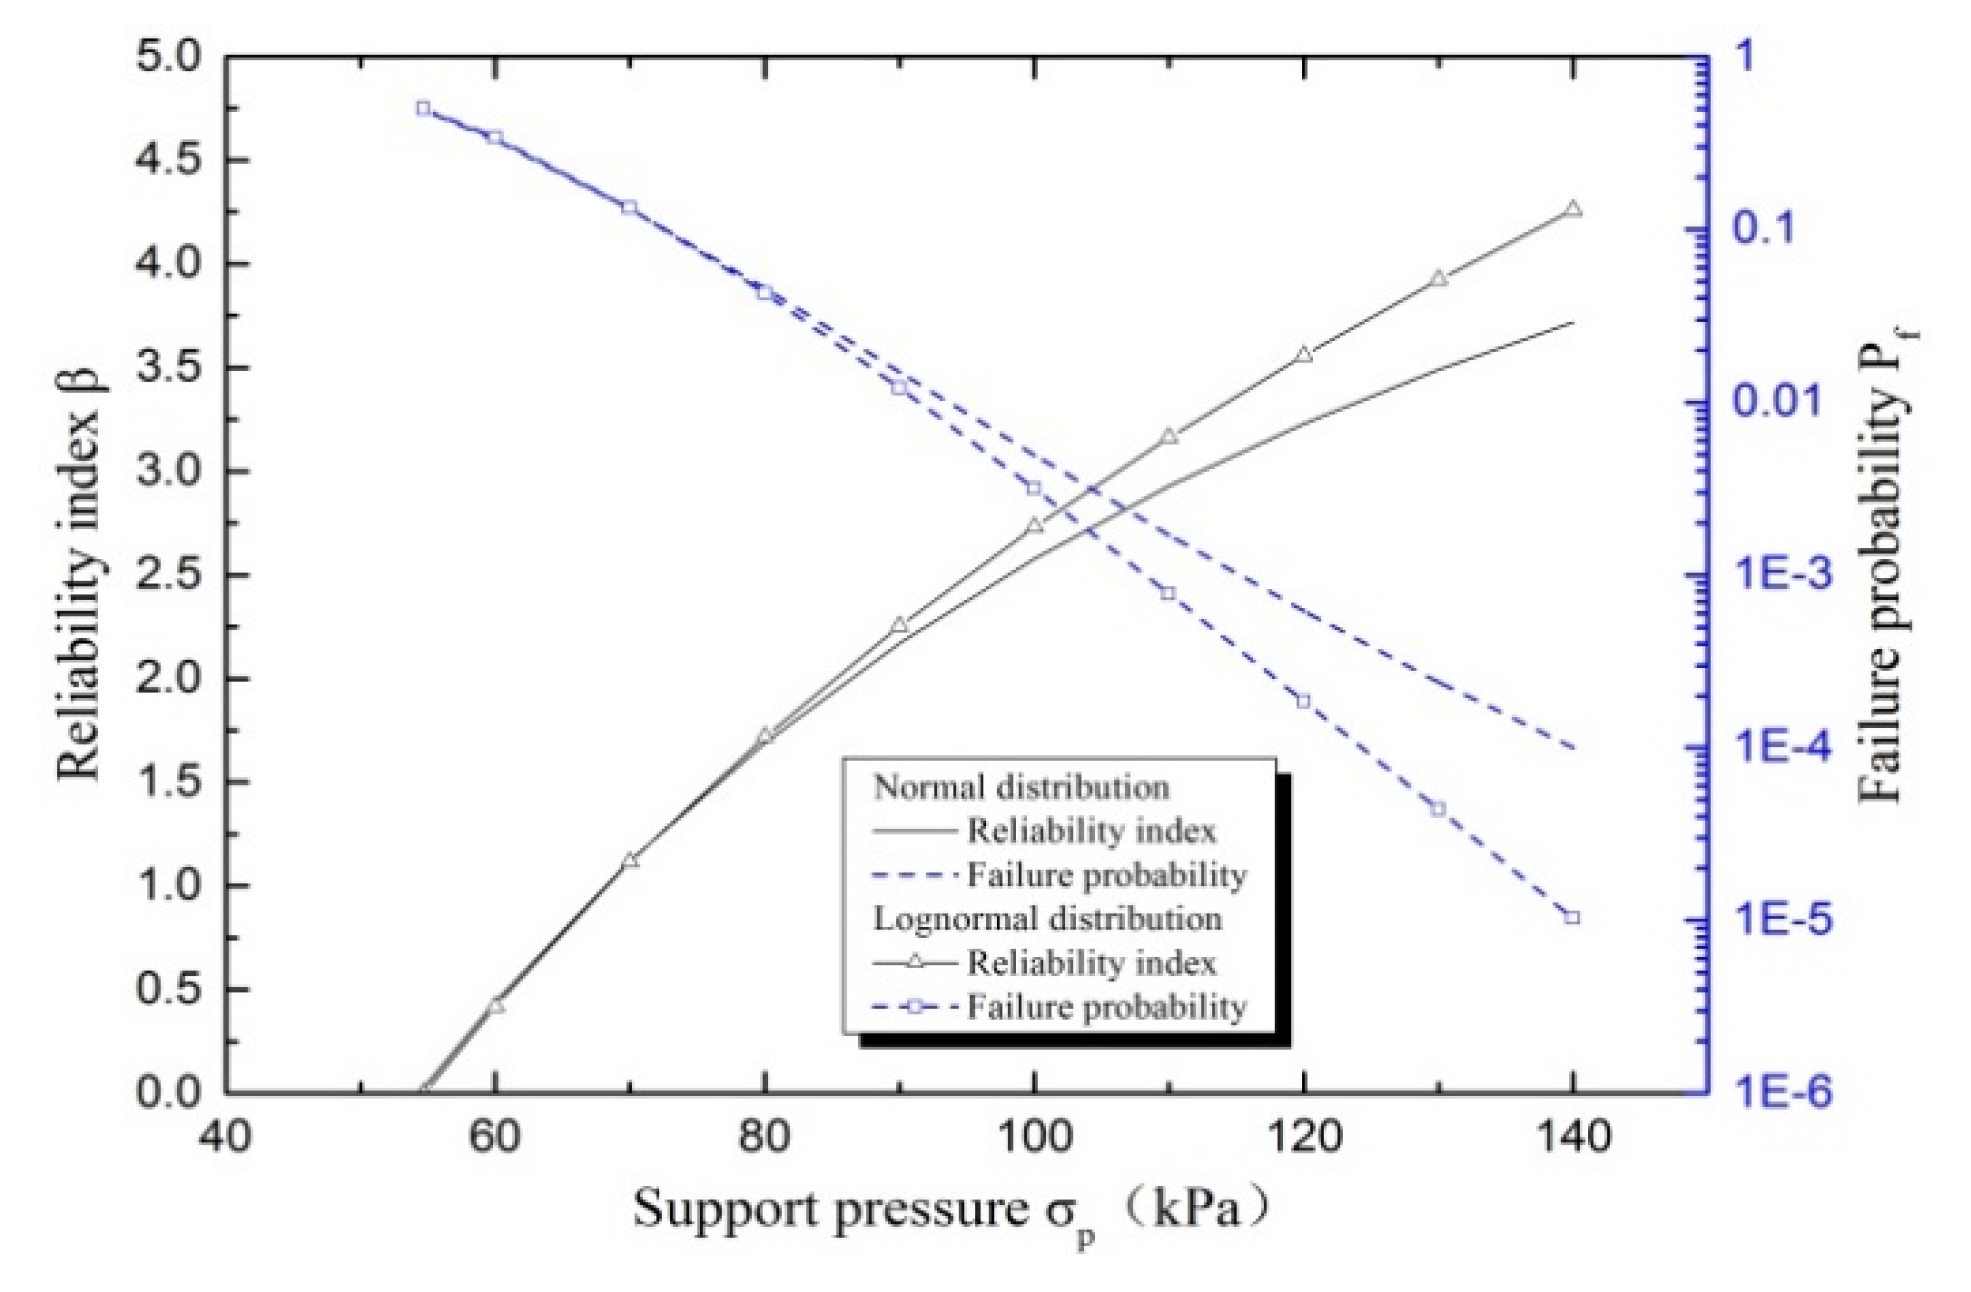
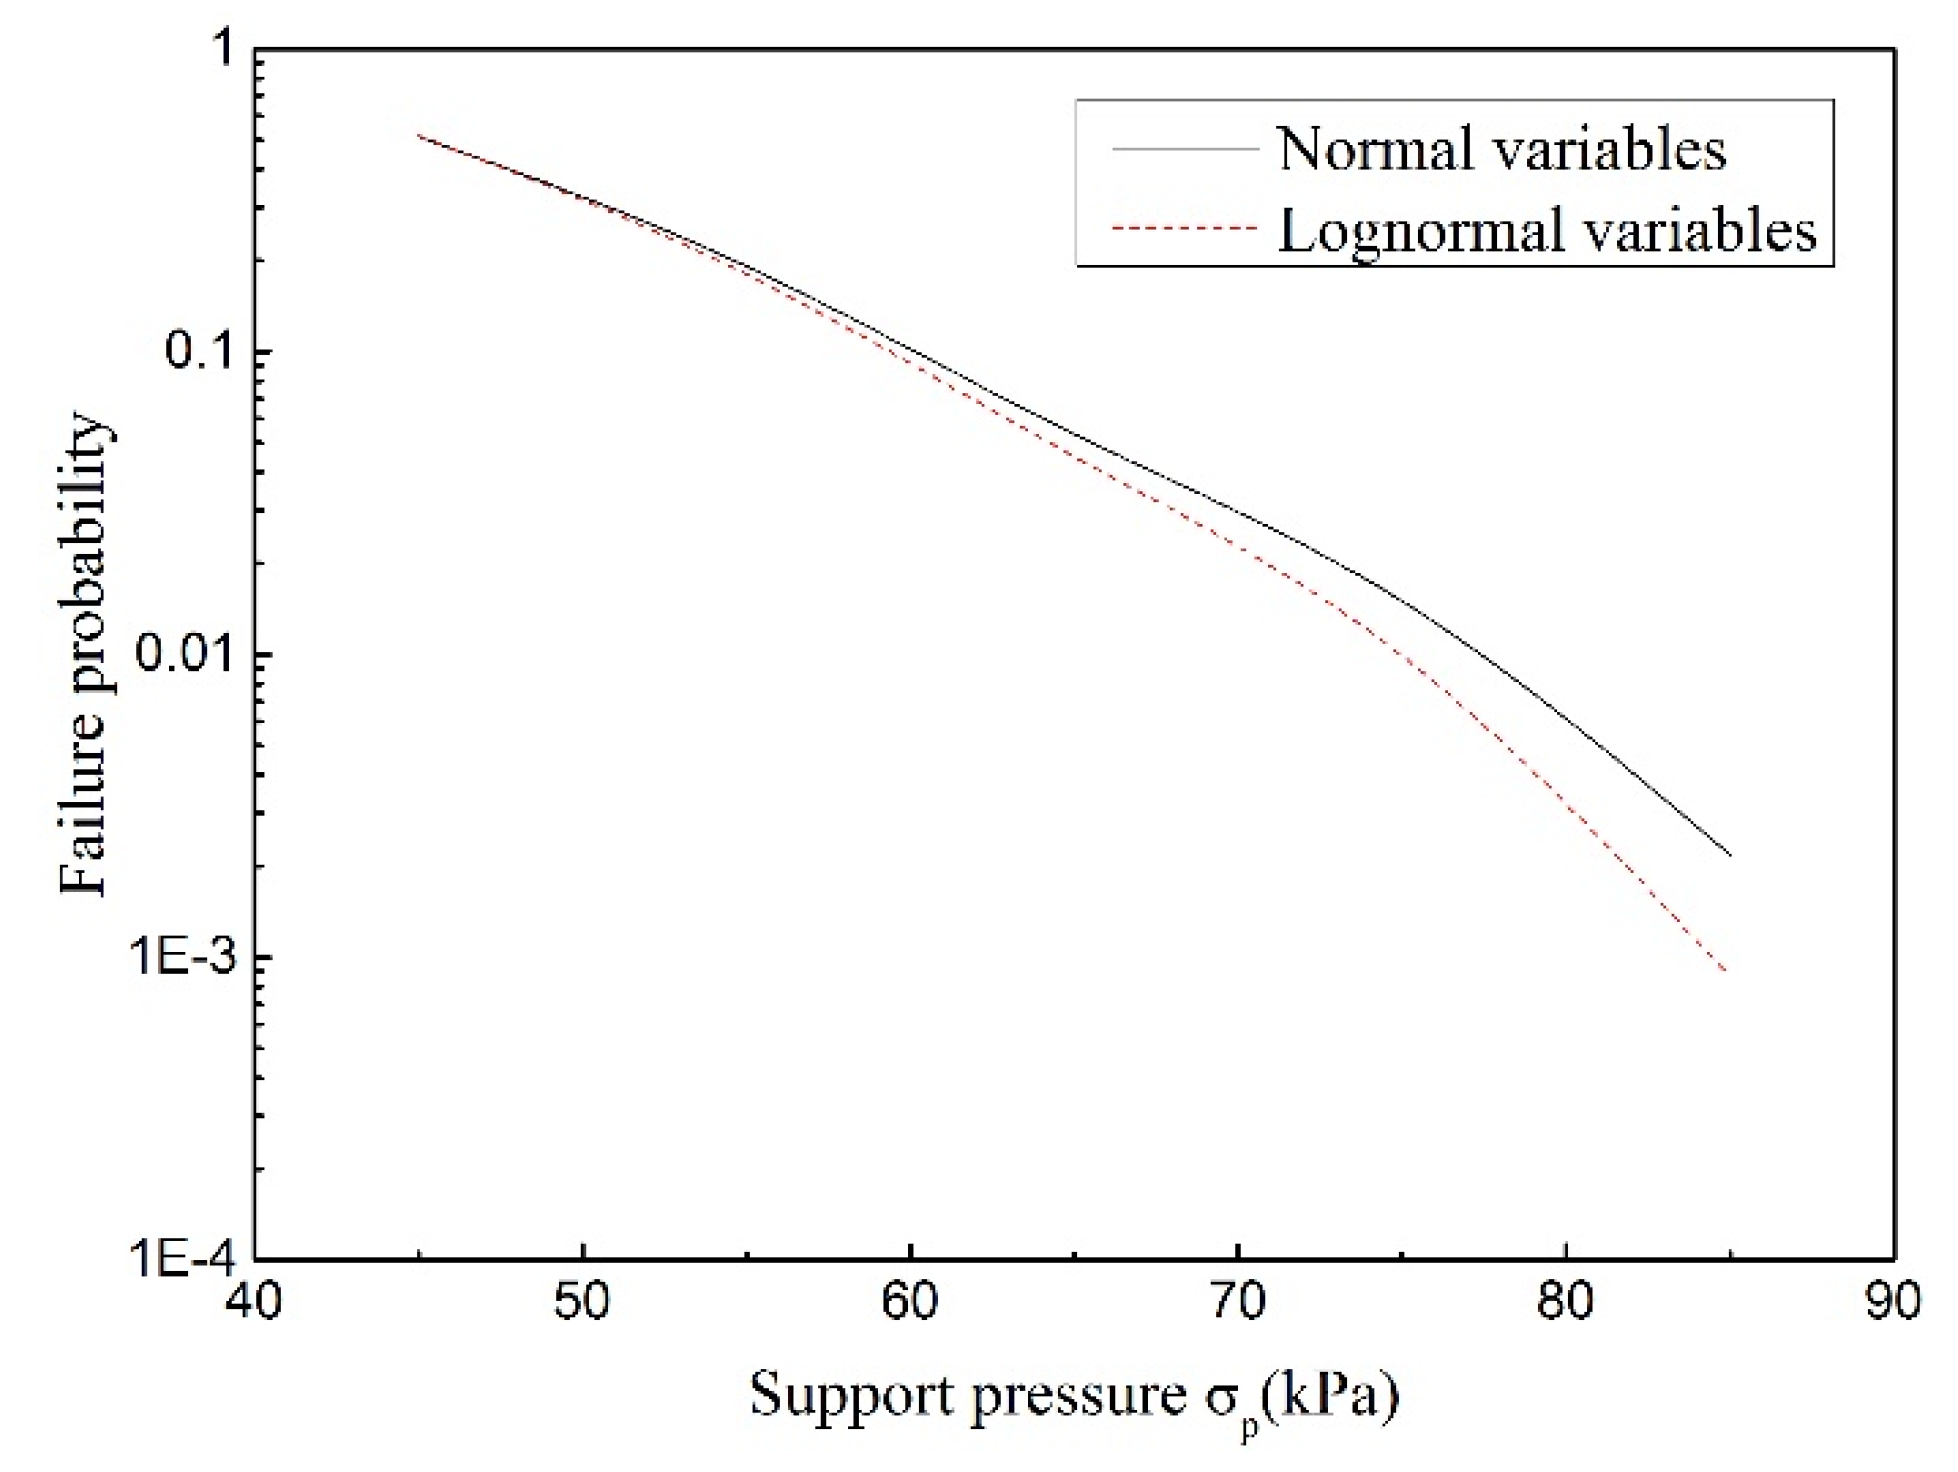
3.1.1. Reliability Index and Failure Probability

Based on the performance function Equation (24), the support pressure varies from 60 to 140 kPa to calculate the corresponding reliability index and failure probability. In reliability analysis, the surface corresponding to the minimum reliability index can be regarded as the critical probabilistic surface. According to the presented failure mechanism, the collapse pressure can be obtained when the reliability index is equal to zero. Thus, the collapse pressure is found to be 54.35 kPa for the normal variables, and it is 54.67 kPa for the lognormal variables.
Figure 3 illustrates the reliability index and corresponding failure probability versus the support pressure, using the FORM. It is found that the reliability index increases significantly with the increase of the support pressure and that the failure probability gradually decreases with the increase of support pressure. The failure probability is smaller than 1 × 10 4 when the support pressure increased to 140 kPa. For a target reliability index of 3.8 as proposed by Eurocode 7, the required support pressure obtained by lognormal variables is smaller than that of normal variables.
MCS is commonly regarded as an accurate method in reliability analysis and its accuracy is based on the number of Monte-Carlo sample size. Generally, the COV of the failure probability is used to estimate the required sample. Equation (7) shows that the COV of failure probability depends on the number of samples and the failure probability.
From Figure 4, it is found that the COV of failure probability comes to be lower than 1% when the sample size increased to 5 × 10 5 . Thus, it can be concluded that a failure probability obtained by MCS with a sample size of 1 × 10 6 may be regarded as credible. Besides, the lognormal variable requires a bigger sample size to obtain a steady failure probability.
FORM is employed to calculate the design point ( σ t ;   r u ;   B ). As Table 2 shows, the design point σ t is greater than its mean values and increases with the increase in support pressure. Conversely, the design point B and r u are slightly smaller than their mean value and decreases with the increase of support pressure.

3.1.2. Sensitivity Analysis

Sensitivity factors reflect the order of importance of the random variables in calculating the reliability index. To compute the sensitivity of the random variables, sensitivity analysis plays an increasingly vital role in reliability-based design. Based on FORM, cos θ X i is selected as the sensitivity factor of variable X i
cos θ X i = g X i | P σ X i i = 1 n ( g X i | P σ X i ) 2
where σ X i is the standard deviation of a random variable X i .
Table 3 presents the sensitivity factors of different normal variables with the change of support pressure, where γ σ t , γ B and γ r u represent the sensitivity factor of σ t , B and r u respectively. The sensitivity factor indicates the ‘load’ and ‘resistance’ of variables. The positive γ means a ‘load’ variable, and vice versa. These results, γ σ t is positive while γ B and γ r u are negative. Besides, the absolute value of γ σ t is greater than γ B or γ r u , which means σ t is the major factor that influences the reliability index. In these results, γ σ t experiences a downward trend with the increase of supporting pressure. The value of γ σ t decreases by 34.7%, when the supporting pressure increases from 60 to 120 kPa. The absolute difference between γ σ t and γ B decreases with the increase of supporting pressure. Thus, B should be taken seriously when high supporting pressure is applied.

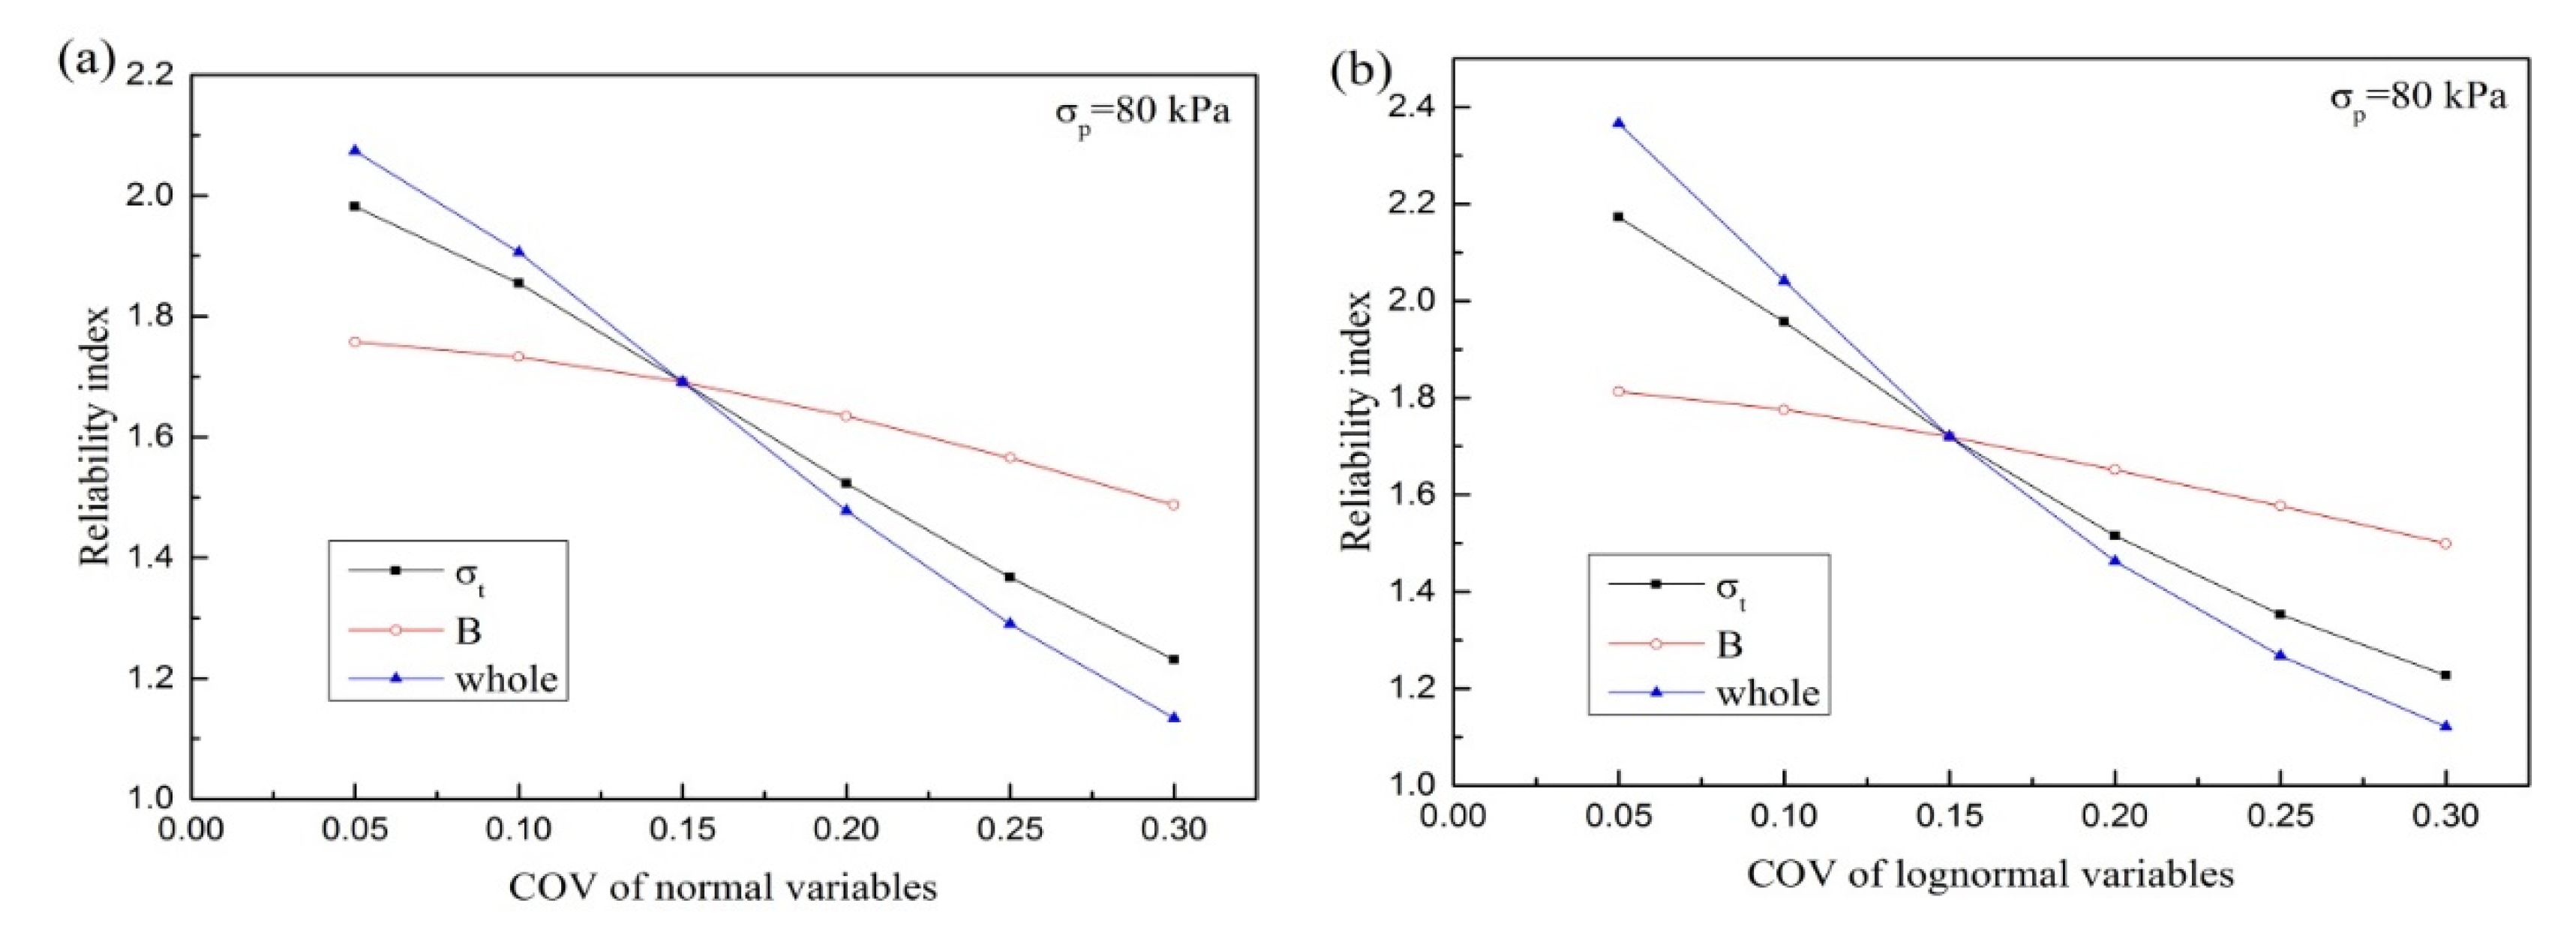
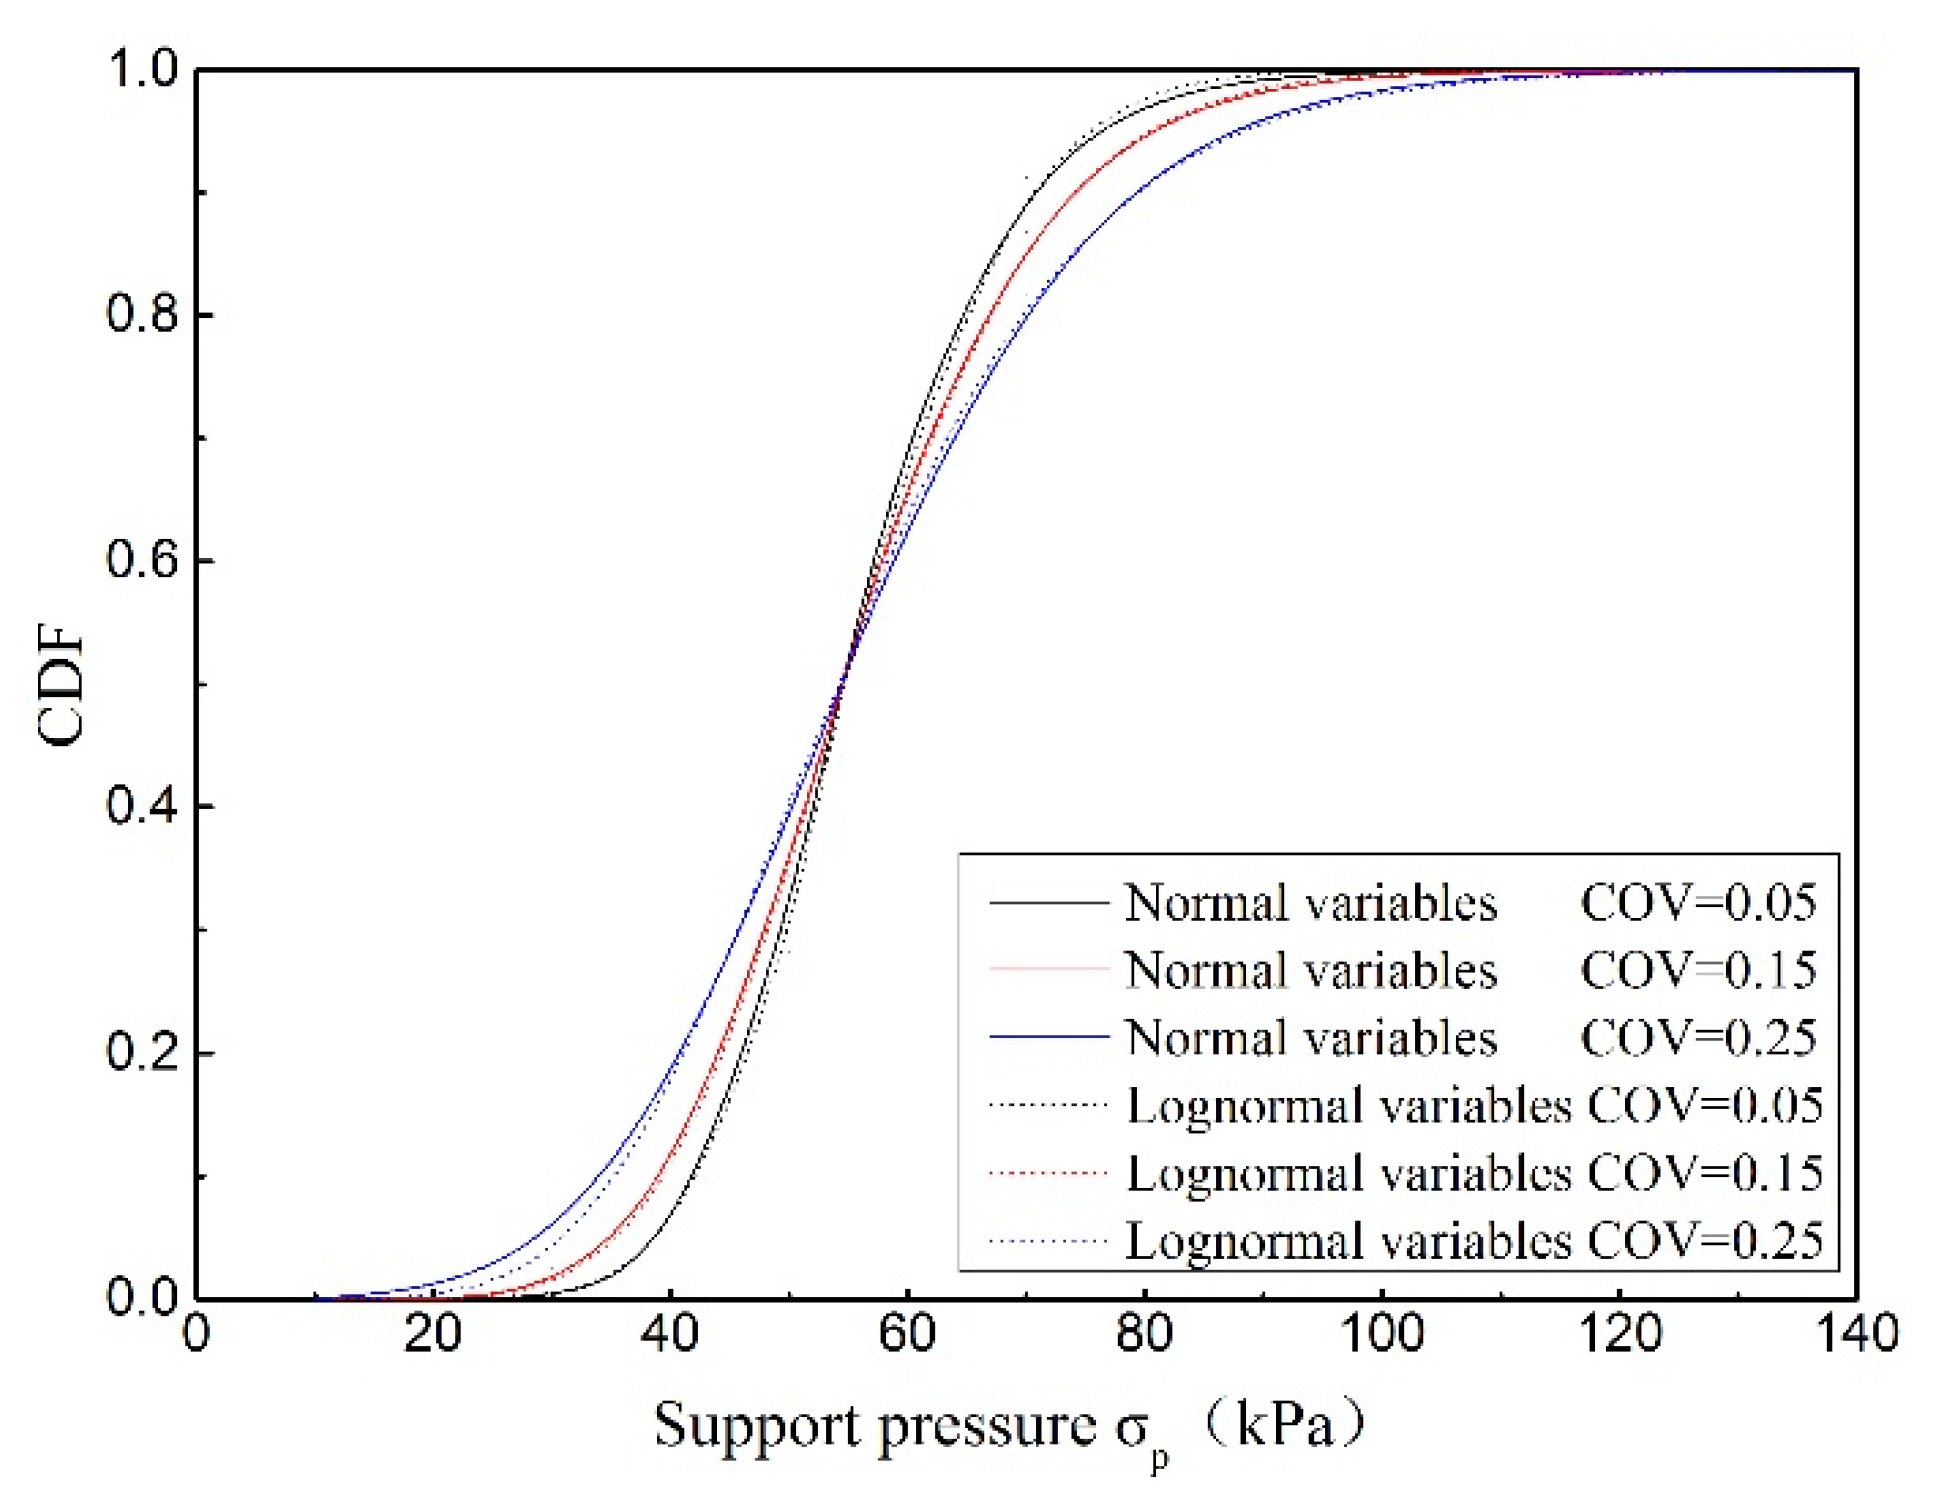
3.1.3. Influence of Coefficient of Variation

The COV is usually used to reflect the uncertainties of random variables. In this section, different COVs of random variables are employed to evaluate their influences on the reliability index.
Figure 5 illustrates the variation trend of reliability with the increase in the COVs of both normal and lognormal variables. In both cases, the increase in COV will lead to a decrease in reliability index. The COV of σ t has a greater influence than that of B on the reliability index. The reliability index of normal variables decreases by 37.9% when the COV of σ t increases from 0.05 to 0.30. However, it is worth mentioning that the reliability index of lognormal variables is more sensitive to the change in COV. The change in COV will lead to a faster decrease in the reliability index as the plots show. Concerning the sensitivity analysis presented above, only the COV of tensile strength was taken into consideration in the reliability-based design (RBD).
Figure 6 illustrates the CDF of the required supporting pressure for normal and lognormal variables when the COV of σ t varies from 0.05 to 0.25. It is found that the CDF curve is significantly affected by a small change in the coefficients of σ t , and a bigger COV of σ t will lead to a bigger failure probability. Thus, the accurate determination of COV of tensile strength σ t is significant in obtaining a credible reliability index. It is found that the probabilistic tunnel pressure increases with the greater variation in random parameters. For example, the required supporting pressure increases from 90.37 kPa to 97.93 kPa with an increase of 0.1 in the COV of tensile strength σ t . Based on that, the random variables should be seriously determined to perform reliable RBD.

3.2. Reliability Analysis of Circular Tunnels

In practice, there are many robust optimization methods [34,35] to optimize power system applications. However, as mentioned above, the performance function of a circular tunnel is implicit. Thus, FORM is no longer suitable to tackle this problem. MCS has been coded to implement the reliability analysis of the roof stability of circular tunnels of radius 4 m with implicit performance function Equation (26). In this section, σ c , σ t , A , B , γ , r u and supporting pressure σ p are considered as random variables, and two kinds of distribution of these variables are taken into account. The mean values and distribution types are provided in Table 4.
The number of simulations varies from 1 × 10 4 to 1 × 10 6 in order to ensure the credibility of results. In MCS, a relatively small sample size is used with low supporting pressure, and relatively large number of trials is used with high supporting pressure. Hence, the COV of failure probability may stay in an acceptable range (smaller than 3.5% in this section). The number of trials used in MCS and the corresponding supporting pressure are listed in Table 5.
As illustrated in Figure 7, the supporting pressure still has a significant effect on the failure probability. The collapse pressure of a circular tunnel is greater than that of rectangular tunnel. With the increase of supporting pressure, the failure probability of circular tunnel experiences a faster decline than that of a rectangular tunnel. Compared with rectangular tunnels, there is also less difference between the failure probabilities obtained by normally and log-normally distributed random variables. As expected, the supporting pressure for circular tunnels is smaller than that of rectangular tunnels when a target reliability index of 2.5 (failure probability equals 0.62%) is given.

4. Conclusions

Based upon the kinematics-based upper-bound theorem and nonlinear failure criterion, reliability analysis is presented to evaluate the roof stability of deep tunnels. Considering the influences of support pressure and pore water pressure, the performance functions of both circular and rectangular tunnels are derived and proposed, respectively. The FORM, RSM, and MCS are employed in reliability analyses to evaluate the stability of tunnel roofs under different materials and support pressure. The main conclusions are summarized as follows.
For rectangular tunnels, the minimum supporting pressure to maintain stability is related to the parameters σ t , r u and B. These parameters and support pressure are regarded as random variables, and two kinds of distributions of random variables are taken into account. The reliability index and failure probability calculated by FORM show good agreement with those of MCS and RSM. When the reliability index is zero, the collapse pressure of tunnel roofs corresponding to normally distributed variables is 54.35 kPa, and the collapse pressure is 54.67 kPa for the lognormal distribution. Therefore, the distribution type of variables does not significantly influence on the collapse pressure. It is found that the reliability index increases significantly with the increase of the supporting pressure, and the reliability index of the normal distribution is slightly smaller than that of the lognormal distribution. The uncertainty of σ t shows that the greater the variation in σ t , the smaller the reliability index. The sensitivity analyses indicate that σ t has a more significant influence on the reliability index than other parameters. Therefore, the COV of tensile strength σ t should be accurately determined in tunnel engineering.
For circular tunnels, σ c , σ t , A , B , γ , r u and supporting pressure σ p are considered as random variables to evaluate the reliability of tunnel roofs. MCS with enough sample size is used to calculate the failure probability with high confidence. The failure probability depends on the value of support pressure, and a small increase in support pressure leads to a significant increase in the reliability index. For a target reliability index of 2.5, the support pressure for circular tunnels is smaller than that of rectangular tunnels. This work merely considers the tunnel roof stability in the two-dimensional plane strain condition, however, the roof collapse, in practice, commonly presents an evident three-dimensional feature. Furthermore, previous works in processing the nonlinearity of the Hoek-Brown strength criterion normally adopt a straight line to roughly approximate the nonlinear envelope, this linear substitution is too simplified to give an accurate solution. The reliability analysis is based on the deterministic model which can provide an exact solution. Therefore, in the future, concerning the three-dimensional roof stability problem, the nonlinear characteristic of the Hoek-Brown strength criterion can be incorporated into the analysis by a piecewise linear method.

Author Contributions

Conceptualization, methodology, software: X.Y. and J.L.; validation, formal analysis, investigation: J.L.; resources, data curation, writing—original draft preparation, writing—review and editing: X.Y. and J.L.; visualization, supervision: J.L. All authors have read and agreed to the published version of the manuscript.

Funding

National Undergraduate Training Program for Innovation and Entrepreneurship (Project number: 202210538021) and Hunan Provincial Natural Science Foundation of China (Project number: 2021JJ31158).

Institutional Review Board Statement

Not applicable.

Informed Consent Statement

Not applicable.

Data Availability Statement

The data that support the findings of this study are available upon reasonable request.

Acknowledgments

Not applicable.

Conflicts of Interest

The authors declared that they have no conflict of interest in this work.

Appendix A

As Figure 1 shows, the curve of collapse rock mass is symmetrical concerning axis y. Based on the works of Fraldi and Guarracino [13,14], the energy dissipation at the impending collapse curve is given as
P D = s D i t d s = 0 L { σ c i [ A B f ( x ) ] 1 1 B ( 1 B 1 ) σ t } v d x
where f ( x ) is the first derivative of f ( x ) , t represents the thickness of the detaching surface, and L means the half width of collapsing block.
The work rate of collapse block produced by weight is given as
P γ = 0 L γ [ f ( x ) R ( x ) ] v d x
in which γ is the dry unit weight of the rock mass, R ( x ) is the equation describing the tunnel profile. Rectangular tunnel is represented by R ( x ) = 0 , and R ( x ) = b 2 x 2 b 2 L 2 represents the circular tunnel of radius b .
The work of water pressure can be expressed as a sum of pore pressure work on skeleton and the work of the water pressure on boundary. In order to obtain a credible upper bound solution of tunnel stability, the influence of pore pressure is taken into account. The work rate of the pore water pressure along the detaching surface is given as
P u = s n i v i u d s = 0 L r u γ [ f ( x ) R ( x ) ] v d x
where r u is the pore pressure coefficient.
In the construction of deep tunnel, supporting structure is necessary to guarantee the safety and stability. The support force is considered as external force and its work rate is
P p = σ p v L
where σ p is the supporting pressure.
Based on the energy-work balanced equation, the following objective function that describes the difference of the rate of energy dissipation and the entire rate of work is expressed as
ζ [ f ( x ) , f ( x ) , x ] = P D P γ P u P p = 0 L ψ [ f ( x ) , f ( x ) , x ] v d x + σ p v L
where ψ [ f ( x ) , f ( x ) , x ] is written as
ψ [ f ( x ) , f ( x ) , x ] = σ t + σ c ( A B ) 1 1 B ( 1 B 1 ) f ( x ) 1 1 B ( 1 + r u ) γ [ f ( x ) R ( x ) ]
By turning the expression of ψ ( x ) into Euler’s equation and integrating the results, the expression of f ( x ) is derived as
f ( x ) = A 1 B [ ( 1 + r u ) γ σ c ] 1 B B ( x + c 0 γ ) 1 B h
where c 0 and h are integration constants. As the detaching curve f ( x ) is symmetrical with respect to the y-axis, the integration constant c 0 is equal to zero. Thus, the expression of f ( x ) is obtained as follows:
f ( x ) = A 1 B [ ( 1 + r u ) γ σ c ] 1 B B x 1 B h
For rectangular tunnels shown in Figure 1a, substituting f ( x = L 1 ) = 0 into Equation (16) with R ( x ) = 0 and ζ [ f ( x ) , f ( x ) , x ] = 0 , it is found that
L 1 = ( σ t σ p ) B A ( 1 + B B ) B σ c 1 B [ ( 1 + r u ) γ ] 1
h 1 = ( 1 + B ) ( σ t σ p ) ( 1 + r u ) γ B
For circular tunnels shown in Figure 1b, based on the conditions of R ( x ) = b 2 x 2 b 2 L 2 2 and ζ [ f ( x ) , f ( x ) , x ] = 0 , it is found that
[ ( 1 + r u ) γ H σ t ] L 2 + ( 1 + r u ) γ b 2 2 [ arcsin L 2 b L 2 b 1 ( L 2 b ) 2 ] 1 B + 1 A 1 B σ c B 1 B [ ( 1 + r u ) γ ] 1 B L 2 1 + B B + σ p L 2 = 0
Although the analytical solution of L 2 is not available, L 2 can be easily obtained by numerical tool. Thus, the detaching curve f 2 ( x ) for circular tunnel can be determined after the calculation of L 2 .

Nomenclature

a i coefficients in response surface method
A material constant
b i coefficients in response surface method
B material constant
C covariance matrix
D energy dissipation density of the internal forces
f sampling range factor.
F failure region
f ( x ) collapsing curve
f ( x ) first derivative of f ( x )
f X i ( x i * ) original probability density function ordinate at x i *
F X i ( x i * ) original non-normal CDF evaluated at x i *
g ( x ) performance function
g 1 ( x ) performance function of a rectangular tunnel
g 2 ( x ) performance function of a circular tunnel
G weight of failure block
h height of the collapsing block
L half width of the collapsing block
n i unit vector
N number of samples
P D total energy dissipation at the impending collapse
P γ work rate done by weight
P u work rate of the pore pressure
P p work rate of supporting force
P f failure probability
Q support pressure
r u pore water coefficient

References

  1. Hou, C.; Zhong, J.; Yang, X. Three-dimensional stability assessments of a non-circular tunnel face reinforced by bolts under seepage flow conditions. Tunn. Undergr. Space Technol. 2023, 131, 104831. [Google Scholar] [CrossRef]
  2. Zhong, J.; Hou, C.; Yang, X. Three-dimensional face stability analysis of rock tunnels excavated in Hoek-Brown media with a novel multi-cone mechanism. Comp. Geotech. 2023, 154, 105158. [Google Scholar] [CrossRef]
  3. Chen, B.; Gong, B.; Wang, S.; Tang, C. Research on Zonal Disintegration Characteristics and Failure Mechanisms of Deep Tunnel in Jointed Rock Mass with Strength Reduction Method. Mathematics 2022, 10, 922. [Google Scholar] [CrossRef]
  4. Lee, Y.-L.; Zhu, M.-L.; Ma, C.-H.; Chen, C.-S.; Lee, C.-M. Effect of Overburden Depth and Stress Anisotropy on a Ground Reaction Caused by Advancing Excavation of a Circular Tunnel. Mathematics 2023, 11, 243. [Google Scholar] [CrossRef]
  5. Qiu, J.; Feng, F. Effect of Different Tunnel Distribution on Dynamic Behavior and Damage Characteristics of Non-Adjacent Tunnel Triggered by Blasting Disturbance. Mathematics 2022, 10, 3705. [Google Scholar] [CrossRef]
  6. Berisavljević, Z.; Bajić, D.; Jovičić, V. Development and application of methodology for quantification of overbreaks in hard rock tunnel construction. Appl. Sci. 2023, 13, 1379. [Google Scholar] [CrossRef]
  7. Su, Y.H.; Li, X.; Xie, Z.Y. Probabilistic evaluation for the implicit limit-state function of stability of a highway tunnel in China. Tunn. Undergr. Space Technol. 2011, 26, 422–434. [Google Scholar] [CrossRef]
  8. Lü, Q.; Low, B.K. Probabilistic analysis of underground rock excavations using response surface method and SORM. Comp. Geotech. 2011, 38, 1008–1021. [Google Scholar] [CrossRef]
  9. Hussaine, S.M.; Mu, L. Intelligent Prediction of Maximum Ground Settlement Induced by EPB Shield Tunneling Using Automated Machine Learning Techniques. Mathematics 2022, 10, 4637. [Google Scholar] [CrossRef]
  10. Goh, A.T.C.; Zhang, W. Reliability assessment of stability of underground rock caverns. Int. J. Rock Mech. Min. Sci. 2012, 55, 157–163. [Google Scholar] [CrossRef]
  11. Zhang, W.; Goh, A.T.C. Reliability assessment on ultimate and serviceability limit states and determination of critical factor of safety for underground rock caverns. Tunn. Undergr. Space Technol. 2012, 32, 221–230. [Google Scholar] [CrossRef]
  12. Mollon, G.; Dias, D.; Soubra, A.H. Probabilistic analysis of circular tunnels in homogeneous soil using response surface methodology. J. Geotech. Geoenviron. Eng. 2009, 135, 1314–1325. [Google Scholar] [CrossRef]
  13. Mollon, G.; Dias, D.; Soubra, A.H. Probabilistic analysis of pressurized tunnels against face stability using collocation-based stochastic response surface method. J. Geotech. Geoenviron. Eng. 2010, 137, 385–397. [Google Scholar] [CrossRef]
  14. Zeng, P.; Senent, S.; Jimenez, R. Reliability analysis of circular tunnel face stability obeying Hoek–Brown failure criterion considering different distribution types and correlation structures. J. Comput. Civ. Eng. 2014, 30, 04014126. [Google Scholar] [CrossRef]
  15. Pan, Q.J.; Dias, D. Probabilistic analysis of a rock tunnel face using polynomial chaos expansion method. Int. J. Geomech. 2018, 18. [Google Scholar] [CrossRef]
  16. Fraldi, M.; Cavuoto, R.; Cutolo, A.; Guarracino, F. Stability of tunnels according to depth and variability of rock mass parameters. Int. J. Rock Mech. Min. Sci. 2019, 119, 222–229. [Google Scholar] [CrossRef]
  17. Fraldi, M.; Guarracino, F. Analytical solutions for collapse mechanisms in tunnels with arbitrary cross sections. Int. J. Solids Struct. 2010, 47, 216–223. [Google Scholar] [CrossRef]
  18. Yang, X.L.; Huang, F. Collapse mechanism of shallow tunnel based on nonlinear Hoek-Brown failure criterion. Tunn. Undergr. Space Technol. 2011, 26, 686–691. [Google Scholar] [CrossRef]
  19. Yang, X.L.; Wang, J.M. Ground movement prediction for tunnels using simplified procedure. Tunn. Undergr. Space Technol. 2011, 26, 462–471. [Google Scholar] [CrossRef]
  20. Hasofer, A.M.; Lind, N.C. Exact and invariant second-moment code format. Am. Soc. Civ. Eng. 1974, 100, 111–121. [Google Scholar] [CrossRef]
  21. Chan, C.L.; Low, B.K. Practical second-order reliability analysis applied to foundation engineering. Int. J. Numer. Anal. Meth. Geomech. 2012, 36, 1387–1409. [Google Scholar] [CrossRef]
  22. Rackwitz, R.; Flessler, B. Structural reliability under combined random load sequences. Comp. Struct. 1978, 9, 489–494. [Google Scholar] [CrossRef]
  23. Tandjiria, V.; Teh, C.I.; Low, B.K. Reliability analysis of laterally loaded piles using response surface methods. Struct. Saf. 2000, 22, 335–355. [Google Scholar] [CrossRef]
  24. Theodorou, D.N. Progress and outlook in Monte Carlo simulations. Ind. Eng. Chem. Res. 2010, 49, 3047–3058. [Google Scholar] [CrossRef]
  25. Dias, D.; Kastner, R. Movements caused by the excavation of tunnels using face pressurized shields analysis of monitoring and numerical modeling results. Eng. Geol. 2013, 152, 17–25. [Google Scholar] [CrossRef]
  26. Zou, J.F.; Xia, M.Y. A new approach for the cylindrical cavity expansion problem incorporating deformation dependent of intermediate principal stress. Geomech. Eng. 2017, 12, 347–360. [Google Scholar] [CrossRef]
  27. Park, D.; Michalowski, R.L. Three-dimensional roof collapse analysis in circular tunnels in rock. Int. J. Rock Mech. Min. Sci. 2020, 128, 104275. [Google Scholar] [CrossRef]
  28. Qin, C.B.; Li, Y.Y.; Yu, J.; Chian, S.C.; Liu, H.L. Closed-form solutions for collapse mechanisms of tunnel crown in saturated non-uniform rock surrounds. Tunn. Undergr. Space Technol. 2022, 126, 104529. [Google Scholar] [CrossRef]
  29. Li, Z.W.; Yang, X.L. Active earth pressure for soils with tension cracks under steady unsaturated flow conditions. Can. Geotech. J. 2018, 55, 1850–1859. [Google Scholar] [CrossRef]
  30. Zhang, Z.L.; Zhu, J.Q.; Yang, X.L. Three-dimensional active earth pressures for unsaturated backfills with cracks considering steady seepage. Int. J. Geomech. 2023, 23, 04022270. [Google Scholar] [CrossRef]
  31. Li, Z.W.; Yang, X.L.; Li, T.Z. Static and seismic stability assessment of 3D slopes with cracks. Eng. Geol. 2020, 265, 105450. [Google Scholar] [CrossRef]
  32. Zhang, Z.L.; Yang, X.L. Pseudodynamic analysis of three-dimensional fissured slopes reinforced with piles. Int. J. Geomech. 2022, 23, 04022315. [Google Scholar] [CrossRef]
  33. Chen, W.F. Limit Analysis and Soil Plasticity; Elsevier Science: Amsterdam, The Netherlands, 1975. [Google Scholar] [CrossRef]
  34. Fang, X.; Du, E.; Zheng, K.; Yang, J.; Chen, Q. Locational pricing of uncertainty based on robust optimization. CSEE J. Power Energy Syst. 2020, 7, 1345–1356. [Google Scholar] [CrossRef]
  35. Xiao, D.; Qiao, W. Hybrid scenario generation method for stochastic virtual bidding in electricity market. CSEE J. Power Energy Syst. 2021, 7, 1312–1321. [Google Scholar] [CrossRef]
Figure 1. Collapse pattern with pore pressure for: (a) rectangular tunnel; (b) circular tunnel.
Mathematics 11 00937 g001
Figure 2. Comparisons of the probability distribution functions of normal and lognormal distribution for different variables.
Mathematics 11 00937 g002
Figure 3. The effect of support pressure on reliability index and failure probability.
Mathematics 11 00937 g003
Figure 4. Influence of sample size on COV of the failure probability.
Mathematics 11 00937 g004
Figure 5. Influence of coefficient of variation on reliability.
Mathematics 11 00937 g005
Figure 6. CDFs of the tunnel roof pressure.
Mathematics 11 00937 g006
Figure 7. The effect of support pressure on failure probability.
Mathematics 11 00937 g007
Table 1. Statistical values of random variables used in analysis with COV = 0.15.
Random VariableMean ValueDistribution Type
Case 1 σ t ( k P a ) 100normal
B0.7normal
r u 0.2normal
σ p ( k P a ) normal
Case 2 σ t ( k P a ) 100lognormal
B0.7lognormal
r u 0.2lognormal
σ p ( k P a ) lognormal
Table 2. Design points and reliability indexes versus different support pressure.
Case 1Case 2
Design PointReliability IndexDesign PointReliability Index
μ σ p σ t B r u FORMRSMMCS σ t B r u FORMRSMMCS
60104.2550.6860.1990.4420.4420.433103.1500.6790.1970.4200.4200.433
70109.9650.6640.1981.1221.1221.107110.6400.6590.1961.1161.1161.130
80113.9330.6480.1981.6911.6911.673117.5980.6420.1951.7201.7201.738
90116.6490.6350.1972.1712.1712.154124.1200.6280.1952.2532.2532.269
100118.4620.6270.1972.5792.5792.566130.2800.6160.1942.7312.7312.770
110119.6180.6210.1972.9292.9292.919136.1300.6050.1943.1643.1643.160
120120.2960.6180.1973.2303.2303.226141.7130.5960.1933.5593.5593.633
130120.6280.6160.1963.4913.4913.486147.0610.5880.1933.9233.9233.911
140120.7100.6160.1963.7193.7193.707152.2030.5800.1924.2604.2604.244
Table 3. Sensitivities for different support pressures.
μ σ p ( k P a ) γ σ t γ B γ r u
600.641−0.308−0.050
700.592−0.304−0.048
800.549−0.296−0.046
900.511−0.284−0.043
1000.477−0.271−0.041
1100.447−0.257−0.038
1200.419−0.243−0.036
Mean value0.520−0.280−0.043
Table 4. Statistical values of random variables used in the analysis.
Random VariablesNormal/Lognormal Distribution
Mean ValueCoefficient of Variation
σ t (MPa)0.10.15
σ c (MPa)100.15
A 0.50.15
B 0.70.15
γ (kN/m3)250.15
r u 0.20.15
σ p ( k P a ) 0.15
Table 5. The number of trials based on MCS.
Support Pressure
(kPa)
Sample SizeCOV of Failure Probability
Normal DistributionLognormal Distribution
45 1 × 10 4 0.00980.0097
55 5 × 10 4 0.00870.0090
65 15 × 10 4 0.01130.0122
75 40 × 10 4 0.01170.0140
85 100 × 10 4 0.02140.0340
Disclaimer/Publisher’s Note: The statements, opinions and data contained in all publications are solely those of the individual author(s) and contributor(s) and not of MDPI and/or the editor(s). MDPI and/or the editor(s) disclaim responsibility for any injury to people or property resulting from any ideas, methods, instructions or products referred to in the content.

