1. Introduction
The worldwide adoption of Science, Technology, Engineering, and Mathematics (STEM) educational guidelines in Higher Education Institutions (HEIs) pushed the latter to offer many undergraduate degrees with a flexible curriculum integrating knowledge, skills, and beliefs from many subjects areas [
1]. Flexible curricula allow students to tailor their educational plans to their academic careers and life goals, as identical learning pathways cannot best serve all students’ needs. This agility of curricula forces students to work with complex curriculum structures [
2]. This situation increased the need for available information and academic guidance for students to make more informed decisions in shaping their academic planning. Academic advising enhances students’ academic pathways and experiences by supporting them with insights about learning opportunities and outcomes and by improving their engagement, experience, skill development, and knowledge they acquired [
3]. Consequently, academic advising plays an essential role in students’ success and retention [
4,
5].
Many higher education institutions (HEIs) face the challenge of improving their students’ retention and graduation rates. To tackle this challenge, many institutions are continually improving the quality and amount of support services available to their students [
6,
7]. To achieve this goal, universities are employing analytical techniques and making efforts to improve factors that contribute to attrition and graduation rates [
8,
9]. One of the most critical factors that impact graduation rates is the structural conditions within the curricula [
10]. The amount of time a student takes to progress through their degree requirements is what graduation rate represents. Most undergraduate programs or majors start with general courses without any prerequisites, but some advanced courses require the completion of the first five or more prerequisite courses. However, the sequencing of these courses can be complicated by overlapping and layered prerequisites [
11]. This layering of prerequisites often necessitates that students and advisors plan several semesters or even years in advance to ensure timely degree completion.
Academic advising is a decision-making process whereby students and advisors are partners in achieving the students’ maximum learning outcomes and outlining the steps to achieve the students’ personal, academic, and career goals [
12,
13]. The nature of academic advising has evolved from providing students with information to a more comprehensive and holistic approach. The holistic academic advisor should possess knowledge of the curriculum, the institution, students’ developmental theories, their learning styles, cognitive abilities, and cultural diversities [
14]. As a result, the academic advisor’s role has become increasingly complex due to changes in the student body’s composition. Today, academic advisors must be equipped to serve the needs of a diverse population of students, who not only possess diverse racial and ethnic backgrounds but also have unique demographic characteristics [
15].
The availability of a plethora of courses in the university programs along with the flexibility of academic plans illustrate the significance of using recommender systems (RSs) in higher education [
16,
17]. Typically, these tools can be powerful in assisting students to select courses suited to their academic performance and personal interests. Additionally, ML has recently been employed to address numerous issues from behavioral change to autonomous vehicles. However, still various research and development areas do not benefit sufficiently from cutting-edge ML tools due to a lack of budget or interest [
18]. The education sector is one of them, although it poses an ensemble of challenging problems that can solved using big data analytics and ML [
19]. Among the interesting challenges is course planning optimization and student’s selection of a career path with an adequate academic plan [
20,
21].
To that end, this work aims to introduce an academic advising RS based on human-in-the-loop for academic recommendations about course planning optimizations. Moreover, the proposed system dynamically collects users’ feedback to update its knowledge base. The system communicates recommendations to students and advisors to give suggestions and hints to excel student success and graduation in-time sensitive to the student’s profile and performance, e.g., when to attempt a course or replace an elective. The proposed platform combines network analysis, artificial intelligence, and data management with mathematical graph theories. The proposed platform adds a novel way to form the basis for generating and delivering personalized academic plans where the right explainable recommendation should be disseminated to the end-users. Mainly, the three stages of the proposed platform are first the stage of capturing the students’ academic data. Second is the unit responsible for composing the suitable collection of actions necessary to achieve students’ academic goals. The last stage is responsible for disseminating the derived actions and information to the end-users using appropriate information representation and data channels. Overall, the main contributions of this paper are summarized as follows:
Conducting a comprehensive literature review by analyzing the state-of-the-art RS frameworks used in the academic advisory;
Introducing, to the best of the authors’ knowledge, the first academic advising RS in the Gulf Cooperation Council (GCC) region based on human-in-the-loop for academic recommendations about course planning optimizations;
Integrating ideas from graph theory, performance modeling, ML, explainable recommendations, and an intuitive user interface;
Developing a course grade modeling and prediction workflow based on students’ data collected at the University of Dubai;
Predicting students’ performance using the BSc in Computing 383 Information systems with a concentration in information system security (BSCIS-ISS) database offered by the University of Dubai. Data are recorded from the Student Enrollment 424 and grades record data, with 200 out of 500 students from 2016 to 2021;
Analyzing and interpreting the results with the proposed method and identifying room for future improvement.
The rest of this paper is organized as follows.
Section 2 presents a comprehensive literature review.
Section 3 explains the framework overview. The proposed course grade modeling and prediction workflow process is discussed in
Section 4. Additionally, the obtained results are analyzed and interpreted. Lastly, concluding remarks and future work are derived in
Section 8.
2. Literature Review
This section discusses the most salient expert systems and studies from the literature proposed to promote quality and long-term planning in academic advising in HEIs. Several research works have been conducted in building expert advising systems. Most of these works investigated issues related to selecting courses per term followed by long-term academic planning and choosing programs/majors. Therefore, we discuss the existing frameworks describing students’ advising decision support systems and academic planning RSs. However, it is worth noting that some other approaches and initiatives promote academic advising benefits, such as the “Global Community for Academic Advising (NACADA)”, which are not in this related-work study.
2.1. Objectives for Student Advising Systems
Generally speaking, advising is performed at many levels in HEIs. First, when the new students are admitted into the HEI, each student should be assigned to a specific academic program and an advisor who assists students with any academic concerns about the program. Second, the students are briefed about their academic program and career planning, required courses, core and elective courses, course sequencing, and the number of courses they can register for per semester to graduate on time. Third, at the beginning of each academic term, students customize their course loads to maximize their potential. Furthermore, students are encouraged to meet their advisors regularly to discuss their academic progress, experiences, and learning opportunities and improve their engagement [
22].
2.2. The RS Approach in Student’s Advising
An RS is a heavily used information filtering system for suggesting products to its users based on their preferences or history. An RS predicts the rating that a given user would give to a product based on their preferences, and then recommends products that match those preferences. By selecting products with high predicted ratings, the likelihood that the user will be satisfied with the recommended product is increased [
23,
24]. An RS uses various filtering techniques, such as collaborative filtering [
25], content-based filtering [
26], and hybrid filtering [
27]. Content-based filtering, for instance, relies on the user’s historical data and past preferences to rate items for the user. While collaborative filtering rates items based on other users’ past preferences, knowledge-based filtering rates items based on knowledge about the item, user preferences, and recommendation criteria [
28]. When collaborative and content-based filtering methods cannot be used, knowledge-based systems are applied instead. These systems rate items based on the item’s knowledge, user preferences, and recommendation criteria [
28]. In more complex systems where specific product properties and the relationship between customer requirements and products are modeled in the form of constraints, constraint-based techniques are used to restrict the recommended item list [
29]. Hybrid RSs, on the other hand, combine the filtering techniques mentioned above.
HEIs recognized the RSs’ impacts on advising and counseling services’ qualities in the early stages of computer systems. The problem of recommending course plans to students was initially perceived as an information retrieval task. Courses related to potential students’ needs are chosen based on their curriculum requirements and similarity to the student’s major. This idea gave rise to knowledge-based RSs for student advising. For example: as early as 1981, authors built a knowledge-based RS suggesting a multi-term courses plan and a term schedule including a list of courses based on student priorities, faculty utilization, and prerequisite rules. Later in 1989, other authors developed a knowledge-based RS for each department schedule, identifying each course’s time and room in a specific term. The above systems are pioneering works for developing knowledge-based RSs for selecting courses, planning, and scheduling; they lack combining curriculum knowledge with students’ preferences.
A content-based RS is widely used to suggest courses for students. For example, a student’s preferences are represented with agent ontology to build the course recommendations [
30]. Students’ previous semesters’ courses are used to recommend a list of courses for the following semester [
31]. The students’ Master thesis topic was used as a criterion for proposing courses [
32].
The idea that revolutionized RSs for advising in early 2005 was the investigation of the collaborative filtering (CF) approach to building an advising system. The authors in [
33] suggested borrowing the experience of graduated students as a template to recommend appropriate courses for the current students. The authors investigated a new approach to building an advising system based on suggesting courses to students using completed courses by other students with similar interests and academic performance [
34]. Another CP-based advising system was proposed in [
35]. The system used an unsupervised ML technique to segment students into groups of similar student profiles. Then, a group of similar students receives similar recommendations.
A recommender-system-based smart learning objects retrieval approach is proposed in [
36] for E-Learning, which is based on contextual recommendations based on collaborative filtering. In [
20], the authors develop a a hybrid multi-criteria RS to help university students in selecting appropriate courses using genetic optimization. Moving on, an ontology-based RS is introduced in [
37] based on ML models to orient students in higher education. It serves as an evaluation mechanism for students’ vocational weaknesses and strengths, capabilities, and interests.
2.3. Knowledge Sources for Student Advising
Like all intelligent processes, RSs for students’ advising have been used for suggesting courses and learning paths for students based on different forms of knowledge. This knowledge is based on explicit sources, such as program curriculum, HEI policies, students’ academic records, and preferences, as well as implicit sources such as inferential or ontological knowledge. Keeping students’ histories or profiles has long been the main asset for RSs. This personalizes the learning experience by suggesting students different courses or learning paths.
2.4. Curriculum Modeling and Visualization
Traditionally, academic planning tools have been used to assist students in making decisions about class schedules, planning for graduation, and many other academic-related activities. Many existing academic planning tools utilize web pages or PDF documents for displaying information about program requirements and course prerequisites. For example, a degree audit report consists of a list of the following: (1) required courses, (2) an indication of whether each course is satisfied, and (3) the remaining number of credits toward the degree [
38]. HEIs have a course catalog showing course descriptions and prerequisite mappings between these courses [
39,
40].
While the above methods of saving and visualizing programs and students’ data had the merit of promoting the idea of personalized course planning and scheduling, they have been criticized for not being geared toward the students’ profile and repeatedly requiring interpretation by a human to deduce decisions based on them [
41]. Appropriate data representation and visualization of advising and their knowledge sources have recently attempted to address these issues [
42]. For instance, building curriculum and advising visualization tools and a prescriptive and predictive learning analytics dashboard have been proposed as a holistic advising framework that is more student-centric [
39,
43].
The learning analytics (LA) dashboard was recently introduced to support the advising sessions between students and their advisors [
44]. In fact, authors in [
45] have extended the LA dashboard concept for advising to support several HEIs handling many issues.
2.5. Motivation of the Proposed Work
Although the development of academic advising platforms continues to receive increasing interest nowadays, many issues are still not addressed. Therefore, the doors are open for innovative solutions. For instance, most existing advising frameworks are implemented for a specific academic institute. However, the growing use of cloud computing makes it feasible to build a system that supports a larger variety of study programs across institutional boundaries. Furthermore, the marketplace may benefit from developing a reliable, engaging, holistic system that offers an individual approach to the learner. This paper presents a novel academic advising framework based on network analysis and performance modeling to provide an explainable recommendation for advisers and students. The proposed system supports cloud-based implementation to facilitate the sharing of the system among different HEIs. Moreover, prerequisite modeling is challenging as defining a unified data structure representing various degree requirements and course relationships across HEI programs requires a complex abstract definition that supports the most common types of degree requirements and HEI policies. This proposed method includes several components, which are (i) a unified data structure definition for the prerequisite structures and degree requirements that can handle any complex degree requirement, (ii) a learning path recommendation module, (iii) a students’ modeling engine, (iv) a visualization tool dashboard based on recent advances in network analysis. Thus, the proposed framework presented to the end-users’ dashboard is used to receive recommendations and visualize contextual data. Therefore, HEIs could benefit from developing an advising system that monitors students’ progress and promptly recommends action to facilitate academic planning efficiency.
3. Framework Overview
The course arrangements determine the curriculum’s structural complexity (e.g., prerequisites, number of courses, credits per course, etc. On the other hand, a program’s pedagogical complexity depends on the program courses’ inherent difficulties, the quality of the education, and the academic offerings. Together, these two components determine the complexity of the course. However, this work focuses on the structural complexity of the curriculum and analyzes its impact on academic performance.
3.1. RS Architecture
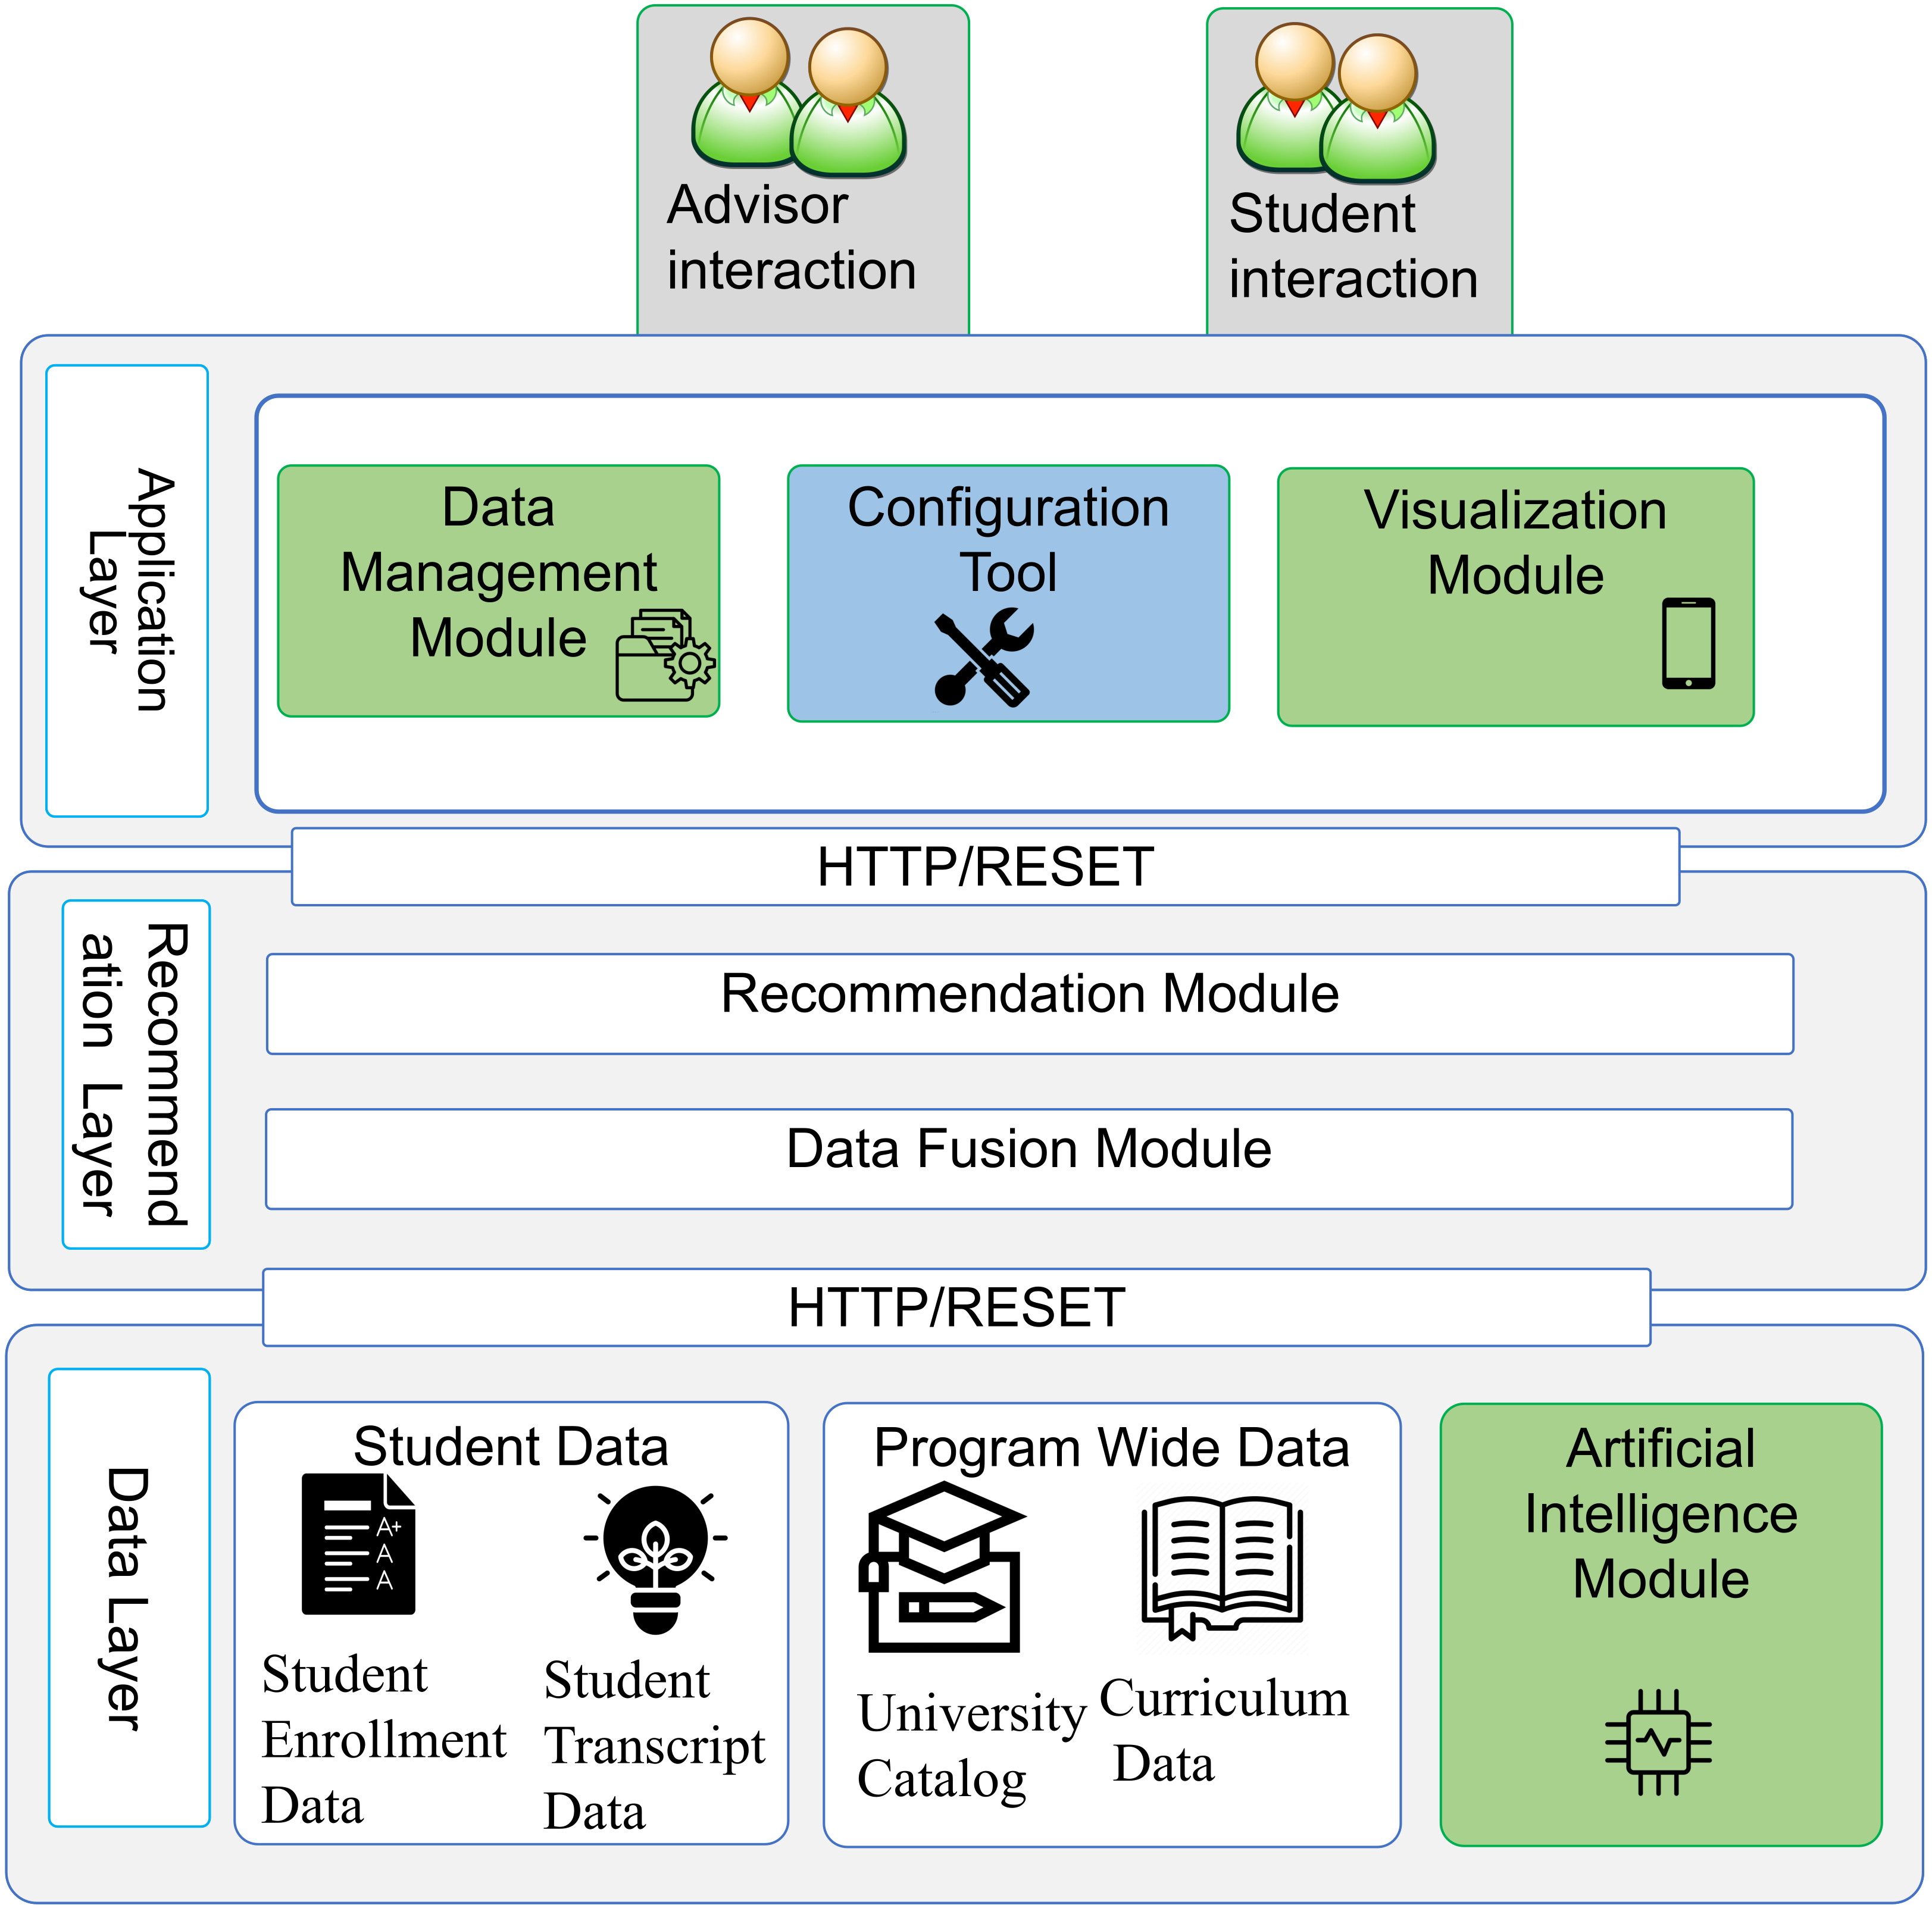
The systems model is based on a three-layer framework that categorizes the various subsystems and supports the effectiveness of student advising and curricular recommendations, as shown in
Figure 1.
Data layer: The data layer is a critical component of the system, responsible for collecting, storing, and maintaining data from various sources. It is designed to handle continuous data streams and ensure the quality and accuracy of the data through data cleaning, normalization, and validation techniques. The data sources include student academic records, demographic information, course registration data, and assessment results. The layer consolidates these data streams into a single reference point through a data fusion module, providing an easy-to-use dashboard and mobile application that supports the student advising system. The data layer is also responsible for ensuring the privacy and confidentiality of student information. This is achieved through data security measures to protect sensitive data from unauthorized access. The data layer provides a secure and reliable foundation for the rest of the system, enabling the generation of accurate and meaningful recommendations for students.
The recommendation layer is the heart of the advising system and is responsible for providing personalized recommendations to students. It encompasses the data fusion module and the recommendation module, which work together to generate tailored recommendations based on a comprehensive view of the student’s situation.
The data fusion module integrates multiple sources of information about a student, such as academic performance, interests, goals, and other relevant data, to create a comprehensive view of the student’s situation. The recommendation module then uses this information to make personalized recommendations about courses, majors, extracurricular activities, and other aspects of the student’s academic journey. The recommendation module operates through an AI module that leverages machine learning models to analyze low-level data, generating feedback messages and alerts that provide insight into students’ performance. The recommendation module uses recommendation-filtering algorithms and machine learning techniques to make predictions and provide recommendations. For example, the system may use a decision tree algorithm to recommend a course based on a student’s major and academic performance. In addition, the recommendation layer may also use AI algorithms for grade predictions, such as gradient boosting or random forest algorithms, to help students understand their performance trends and identify areas for improvement. The ultimate goal of the recommendation layer is to provide students with guidance and support that helps them succeed academically and achieve their goals.
The application layer is the uppermost component of the advising system and serves as the interface between the student and the recommendation engine. It contains various technologies that support data management and analysis, providing users with an intuitive and user-friendly experience. The data management module is responsible for efficiently storing and archiving data for future analysis and pattern recognition. This module ensures that the data are organized, easily accessible, and secure, allowing for a quick retrieval and effective data analysis. The configuration tools component is the single entry point for configuration, where university policies, rules, and student-specific settings such as scholarship schemes are set. This component is user-friendly and easy to use, allowing users to easily configure the system according to their specific needs. The visualization module aggregates data from multiple sources and creates visually appealing charts and graphs for easy interpretation. This module provides users with an intuitive and interactive way to view and understand the data, making it easier to identify trends and patterns. The visualizations are designed to be easily understood by a wide range of users, including students, advisors, and administrators. In summary, the application layer provides users with an easy-to-use and effective way to manage, analyze, and understand data, providing a valuable tool for making informed decisions and achieving academic success.
However, there are many factors that can influence a student’s grades, and it is important to consider these factors when building a grade prediction model. Some of these factors include student characteristics, course difficulty, teaching style, and personal circumstances. Some student characteristics, such as age, gender, and socio-economic status, may influence their grades. The difficulty of the course and the teaching style of the instructor may also play a role. Personal circumstances, such as home life, health, and workload, can also affect a student’s grades. It is also important to note that many of these factors can interact and influence a student’s grades in complex ways. For example, a student’s attendance may be affected by their personal circumstances, and their grades may be influenced by both their attendance and their test scores.
3.2. Course Pre-Requisite Network (CPN)
The set of courses in a program’s curriculum and the relationships of priorities between them are presented in the form of a system of mathematical graphics, known in the literature as course prerequisite network (CPN). The latter generalizes topics such as nodes in a graph and edges as prerequisites for connections between nodes.
Graph theory and complex network analysis have been used to represent the CPN of the academic curriculum as a complex system. CPN determines the program’s learning goals and greatly impacts completion time and dropping out. CPN analysis helps academic advisors determine when to register for certain classes, who is teaching them, and what is required to earn a degree in a particular field. Social network analysis characterizes prerequisite networks and studies the distribution of graduation time based on the network topology and the completion rate of the courses. In addition, it provides a method to identify courses that significantly affect the time to graduation. We can model policy and network changes’ effects using students’ flow analysis.
The CPN is formed by a weighted directed acyclic graph (DAG), and donated by , where V is a set of N courses. E is a set of edges representing the links among V. is the weight of (i.e., expressed in float number between ). For instance, the prerequisites’ edge between course and the course means that the course must be completed before attempting the and . At the same time, considering and edges together, where both course and are prerequisites for , then and . If there are more than two prerequisite courses, the weight is balanced among them. When any of them is enough as a prerequisite for , then .
Let us consider the hypothetical example of a given program curriculum shown in
Figure 2. The original CPN includes N = 16 courses, represented as circles, where N is the number of nodes in the graph. The edges encode the prerequisites between the nodes. A node represents any specific course or group of elective courses where the student should take only one of these courses. For instance, the node labeled with ITGN 130 is a specific curriculum course in the diagram. In contrast, the node is labeled “Elective Courses,” representing two electives: GUAG 100 UAE Government and GCUS 100 Culture and Society. The student must choose from them. The link between courses represents two different links between curriculum courses, i.e., prerequisite or co-requisite. The first type of link is a course that is a prerequisite to another course. For example, the course GMAT 100 is the prerequisite of ITGN 130, where a student must first complete GMAT 100 before attempting ITGN 130. The co-requisites edges are represented by two types: soft prerequisite, where both courses are recommended to be attempted together, e.g., ENGL 120 and BBAC 205. Another example is the course GMAT 105 and BBUS 200. Both are prerequisites for the course BNMG 310; in this case, a student should first complete both GMAT 105 and BBUS 200 before attempting BNMG 310. The third case is ENGL 105, and the prerequisite is ENGL 100 or ENGL 101, where the student can attempt ENGL 105 after completing ENGL 100 or ENGL 101. The last example of the prerequisites ITGN 465 is that the student should complete at least 111 CHs, and the student’s GPA should be higher than 2. In contrast, hard prerequisites require students to attempt both courses together. An example of this situation is the case of theory and practical part of the same course. As shown in
Figure 2, ITGN 130 and the laboratory unit of IGTN 131.
3.3. CPN Topological Indicators
3.3.1. Node Degree
In a directed graph, the degree a node
is the sum of its input edges (
in-degree) and output edges (
or out-degree). A node degree metric for each course is computed using Equation (1):
A course with a high in-degree has large number of prerequisites and is inherently integrative. A course with a high out-degree is a prerequisite for many other courses, which means it is likely a critical course in the curriculum. A node with a high degree is called a hub course.
3.3.2. Deferment Factor
This indicates whether graduation time will inevitably increase after failing in a particular subject [
46,
47].
3.3.3. Betweenness Centrality
Betweenness centrality is a node importance stat that uses information about the shortest paths in a network. It is defined as the fraction of all possible shortest paths between a pair of nodes passing through the node. The high betweenness course serves as a bridge between larger but isolated areas of the curriculum. The betweenness metric for each course is computed using Equation (2):
the total number of shortest paths from node
s to node
t is denoted as
, while
refers to the number of those paths that pass through a particular node
v [
47]. through
v [
47].
3.3.4. Connected Components
A connected component refers to the largest collection of nodes in a graph where all pairs of nodes can be connected by a path, while the intended graph is directed, in this context, an undirected graph is considered, which means we look at weakly connected components. By analyzing the connected components of a CPN, we can determine whether the curriculum is composed of independent groups of courses that are not linked by prerequisites for each other. A connected component analysis helps discover the independent knowledge area [
39,
47].
3.4. Courses Level Generation Algorithm
The level in which a course resides can also be determined by taking the max-path distance from the course to the farthest leaf course. That value can be obtained with Algorithm 1. The overall complexity of the Algorithm is
.
| Algorithm 1: Courses Level Generation. |
![Mathematics 11 01098 i001]() |
4. Course Grade Modeling and Prediction Workflow
The course performance prediction model aims to accurately determine the likely academic performance of a given student at the end of that course. This model helps the advisor and the student react to improve a given student’s outcomes, assuming a new intervention is needed at the right time. Additionally, one could use a predictive model to determine an elective that a given student is likely to complete with a higher grade. Applying this model to individual students may provide insight into when they may complete their degrees, assuming no intervention strategy is employed, and while predictive models should generate realistic performance scenarios, these models are a powerful tool for identifying and deploying the needed corrective strategy. However, many factors hinder the accuracy of predictive modeling and make it difficult or less desirable. For example, sparse and noisy data make it difficult to generate accurate predictive models. Missing data can occur for various reasons, such as when a student chooses not to provide additional information. Another example is when a course has undergone a major revision, such as changing the subject from a single paper to a weekly test. In that case, predicting final course grades based on the grade history of the original course structure becomes difficult.
The course grade modeling and prediction workflow can be broken down into several stages, each of which plays an important role in producing accurate predictions. These stages include data collection, pre-processing, feature engineering, feature selection, and machine learning modeling.
Figure 3 presents the system’s functional architecture.
Data Collection: In this stage, data are gathered from various sources, including students’ enrollment data, historical transcript data, and CPN graphs generated by course topology sorting algorithms. The data must be in a format that can be easily analyzed and transformed. The data collection stage in the course grade modeling and prediction workflow is a critical step in the process. The purpose of this stage is to identify and gather all relevant data that can be used to generate models of relationships between different variables. In this stage, researchers must identify the outcome variable they are interested in predicting, such as a student’s grade or achievement level. This is then followed by the identification of suspected correlates of this variable, such as gender, ethnicity, and access to certain resources. It is important to note that the data collected should only include those variables that can be known at or before the time when an intervention may be employed. This means that data values that would only be available after the intervention has been carried out, such as a midterm examination grade, should be left out of the modeling activity. Therefore, it is crucial to choose the right data for the model and to ensure that the collected data are accurate, relevant, and of high quality. This will provide a solid foundation for the subsequent stages of the workflow and help ensure the quality of the final prediction model.
Pre-Processing: This stage involves integrating heterogeneous data sources and correcting any errors, inconsistencies, misspellings, abbreviations, and different formats in the data. The data are then subjected to data analysis and transformation operations, such as aggregation and normalization.
Feature Engineering: In this stage, the characteristics of the CPN are transformed into candidate features that can be used to quantify the network characteristics of individual courses. These features are then used to predict students’ grades. Additionally, feature engineering also involves transforming data into compact representations to reduce the complexity and computational requirements of the modeling process. It also helps to identify and remove noise or irrelevant information from the data, ensuring that the predictive model is built on the most relevant information available. The outcome of the feature engineering stage is a set of meaningful features that can be used to build the predictive model, which can then be used to make predictions about student performance or grades.
Feature Selection: In this stage, the most informative features are selected to reduce computational complexity, reduce modeling, storage, and data collection requirements, and facilitate predictable patterns for interpretation. Any missing values in the dataset are corrected by removing the attributes (columns) or instances (rows) that have missing values. The process of feature selection is crucial in building a predictive model as it helps to identify the most important features that are relevant to the outcome prediction. The goal of feature selection is to choose a subset of features that provides the best predictive performance, while also reducing the complexity and computational cost of the model. This step is important because having too many features can lead to overfitting, where the model is too closely aligned to the training data and has poor generalization performance on new, unseen data. There are several methods for feature selection, including filter methods, wrapper methods, and embedded methods. Filter methods use statistical measures, such as correlation, to determine the relevance of each feature. Wrapper methods use the learning algorithm itself to evaluate the performance of different feature subsets. Embedded methods integrate feature selection as part of the learning algorithm. It is important to note that the choice of feature selection method depends on the nature of the data and the problem being solved. For example, if the data have a large number of features, a filter method may be more appropriate. On the other hand, if the data are complex and have interdependent features, a wrapper or embedded method may be more appropriate. In any case, feature selection should be performed with care and consideration of the trade-off between model accuracy and interpretability.
Machine Learning Modeling: This stage involves training, testing, and prediction. The selected features are used to train a machine learning model, which is then tested to determine its accuracy. The trained model is then used to make predictions about students’ grades. Grade prediction for student advising is an important application of predictive modeling in education. The goal of grade prediction is to provide students with information about their future academic performance based on their past performance and other relevant factors. This information can help students make informed decisions about their academic career and provide guidance to advisors who are supporting their academic journey.
To build a grade prediction model, the first step is to collect data relevant to the prediction. This may include past grades, attendance records, demographic information, and any other relevant information that may impact a student’s performance. After collecting the data, feature selection is performed to identify the most important variables that are correlated with the grade outcome. Once the data are collected and the relevant features are selected, a predictive model can be built using one of the methods discussed above. For example, linear regression could be used to predict a student’s future grades based on their past performance, or decision trees could be used to identify the most important factors that contribute to a student’s performance. It is important to note that the accuracy of a grade prediction model is influenced by many factors, including the quality of the data collected and the choice of the prediction method used. The practitioner should always consider the assumptions of the model and validate its accuracy using appropriate evaluation metrics, such as mean squared error or precision and recall.
Overall, grade prediction can play an important role in student advising by providing students and advisors with valuable information about future academic performance, and can help inform important decisions about a student’s academic career. In summary, the course grade modeling and prediction workflow is a multi-stage process that involves data collection, pre-processing, feature engineering, feature selection, and machine learning modeling. The outcome of this workflow is an accurate prediction of students’ grades, which can help support academic advising and help students succeed academically.
Grade prediction for student advising is an important application of predictive modeling in education. By providing students and advisors with valuable information about future academic performance, grade prediction can help students make informed decisions and provide guidance to advisors supporting their academic journey. The accuracy of the prediction model depends on various factors, such as the quality of data collected and the prediction method used. It is important to consider the assumptions of the model and validate its accuracy using appropriate evaluation metrics.
4.1. Building Predictive Models
The process of building a predictive model from a dataset of graduated students’ transcript data involves attribute selection and label prediction based on available information. This can be achieved through the use of various predictive modeling techniques, such as the Bayesian belief network (BBN), which is briefly introduced in this section. The main aim of the predictive model is to identify new students’ grades based on their already completed course grades, which is a crucial aspect of the advising application. This can be achieved by generating a class label based on the new student’s data, representing a supervised ML classification problem. The classifier is built based on a historical collection of student grade records, where each record is a tuple consisting of a prerequisite set and an outcome class label representing grade performance (A, B, C, and D values). The value of each class label corresponds to the following grade ranges. (Reference: withheld to avoid potential plagiarism)
Bayesian belief networks (BBNs), graphical models, are often manually constructed and provide probabilistic interpretations of classifications. A BBN is represented by a directed acyclic graph (DAG) consisting of set nodes (random variables) and their edges (conditional dependencies). Each node in a DAG is associated with a conditional probability table (CPT). CPT contains the conditional probability distribution of a given parent node in the DAG. In our model, the nodes represent the curriculum courses, and the edges represent the prerequisite relation between the courses. The DAG in the Bayesian network is the CPN, and an input from the model structure is built.
Figure 4 illustrates an overview of the BBN-based predictive model.
4.2. Predicting the Performance of First-Level Courses
There are no prerequisites for any other course before taking the first-semester courses. In this case, a student’s performance in high school can tell us about their future performance in the first semester. For example, excellent high school students are expected to perform better in college than other good students. However, many factors affect students’ success in college. In the context of a learning network, the BBN project aims to predict a student’s academic grades based on data on previous high school grades, age, gender, nationality, parental education, and emotional factors.
Table 1 shows the description considered in building the BBN to model the first-level courses grade prediction.
The students’ performance in a particular first-level course can be used as a measure to predict abilities in subsequent higher-level courses and so on for the higher levels. In other words, to predict the course grade in the curricula, we calculate the respective marginal probabilities based on the evidence of the grades of the previous courses taken for the same student. For this purpose, Let to indicate the sequence of letter grades assigned to a course and to indicate the sequence of discrete values of L. For a given course i, a decision is made when evidence is collected using two methods:
The maximum a posteriori probability (MAP) estimate:
the marginal probability of the states of course
i is denoted by
, where
e represents the set of grades obtained in the previous courses.
The expected grade (EG) estimate:
4.3. Data and Advising Domain
College of Engineering and IT, at University of Dubai, offers a BSc. in computing information systems with a concentration in information system security (BSCIS-ISS). BSCIS-ISS courses are offered over two full-time semesters (15 weeks) each year. The program has 57 courses divided into six categories. The students are required to complete 43 modules on their study plan, as shown in
Table 2.
BSCIS-ISS is driven by the market’s needs and the university’s vision. Furthermore, in addition to market research, the improvement of BSCIS-ISS curricula also took place through the interaction with the local Business and Security professional communities, in particular the cooperation with the stakeholders of the Dubai Chamber and Dubai Electronic Security Center (DESC), which complained that there were not enough security professionals with significant subject specialization and technical skills in Dubai in particular, and the UAE in general, who understand data protection processes and can lead their organizations to meet the highest security standards and policy requirements in the UAE. In this regard, in the context of institutional planning, the college invested time to design and develop the BSCIS-ISS syllabi and curriculum. The courses are categorized into four levels, where the basic courses are associated with the first level and the most advanced concentration courses are associated with the fourth level. The classification of courses is based on their level, where the first level includes introductory courses, and the difficulty and complexity of courses increase with each level up to the fourth level, which includes the most specialized and advanced courses. This categorization of courses into levels is important for designing the curriculum and managing the students’ progress [
48].
4.4. Analysis of the CPN of the BSCIS-ISS Program at UD
This section reviews the curriculum of the BSCIS-ISS program. The large number of students (about 100 enrollees per year) makes the sample suitable for analysis to estimate the completion rate reliably, which estimates the completion rate more reliably. We are reviewing the applied curriculum that has been in use since 2016.
Figure 5’s network shows the prerequisites of this eight-semester program.
The PSCIS-ISS program has a relatively lenient prerequisite network. Its topology can be described as follows: it contains a few lengthy paths, and the most extended path consists of five courses, namely ITGN115-Computer Applications, ITGN130 Programming in Python, ITGN230 Introduction to Programming, ITGN235Principle of Networking, ITGN345 Information System Security, and ITSS 456 Database Security and Auditing. Since the program is designed for eight semesters, students may fail two of these courses to graduate on time. Using the definition of betweenness and node degree measures, the following courses turned out to be critical: ITGN130 Programming in Python, ITGN230 Introduction to Programming → ITGN235Principle of Networking, ITGN345 Information System Security.
Figure 5 and
Table 3 show betweenness, node degree, and components factors for each IT and concentration course. The analysis indicates that ITGN230 Introduction to Programming has the highest betweenness centrality and acts as a connection between numerous courses. Courses in semester 6 and those on the longest path have the highest deferment factor. Moreover, ITGN230 Introduction to Programming and ITGN345 Information System Security are the most blocking courses with respect to prerequisites, including 16 courses that are not necessarily directly linked.
Table 4 provides an overview of the CPN analysis of the BSCIS-ISS Program at the University of Dubai.
4.5. Student Performance Prediction
4.5.1. Dataset
In this study, we used the BSCIS-ISS database obtained from the Student Enrollment and grades record data, with 200 out of 500 students from 2016 to 2021. The enrollment data encompass pre-college student performance and demographic information. Furthermore, grades record data include each course number, semester, instructor name, number of enrolled students in the section, attained grade on a scale A, A-, B+, B, B-, C+, C, C-, D+, D, and previous semester’s GPA. The total number of grade records is 6000. The GPA is calculated using a standard 4.00 scale, UAE’s most common grading system. The longest course of study is up to 12 semesters. The shortest is 6 semesters.
4.5.2. Course Performance Prediction Algorithm
To prepare the collected dataset for analysis, the data pre-processing step involved classifying and grouping students into two categories, namely “passed” (A, A-, B+, B-, C+, C) and “failed” (C-, D+, D), for ease of data manipulation. This group is created as a result of the predictor class. A score of C was chosen as the threshold score because it was equal to 2. A score below this score is less than 2. The minimum GPA requirement is 2.0, according to BSCIS-ISS. However, the class distribution of the dataset shows unbalanced cases by class with a high number of (5066) accepted cases and (922) rejected cases with a high rate of 0.18%. This section evaluates the performance of the ML model to predict a student’s course grades for the upcoming semesters based on previous course grades, required course grades, and enrollment information. The proposed model used several RS algorithms to evaluate which algorithms best predict students’ course performance. Experiments were performed on five different ML algorithms: BNN, nearest neighbors, decision tree, and AdaBoost algorithm, a random forest based on the same dataset. Accuracy is evaluated using 10-fold cross-validation within the same dataset, splitting the dataset into 75% for the training set and 25% for the test set.
In particular, the following theoretical models were used to build predictive models: Decision trees (CARTs) are widely used for various multiclass classifications that can handle missing values with high-dimensional data. It is efficiently implemented to provide optimal accuracy results with minimal functionality [
49]. K-nearest neighbor (kNN) is a non-parametric algorithm that utilizes distance functions to classify instances in a dataset based on their proximity to the nearest vector. The value of
k determines the distance in n-dimensional space that is considered when calculating the differences between instances. This algorithm is particularly useful for validating small dataset functions [
50]. Random forest (RF) is an ensemble learning classifier that uses many decision trees from different subsets to find the best features for high accuracy and avoid overfitting problems. RF is an effective outlier in classification and is relatively robust to noise [
51]. AdaBoost applies many classifiers to predict the best solution. That is adaptive because it adapts to cases where prior classifiers misclassify weak post-learners. Some applications may be more susceptible to overfitting problems than other learning algorithms. Individual classifiers may be weak, but if the performance of each classifier is slightly better than random guessing, it can be argued that the final model approximates a strong classifier.
We compare performance accuracy using 10-fold cross-validation to obtain the best predictive model for optimal results. The performance was measured using a variety of metrics, including classification accuracy, precision, recall (sensitivity), and f-measure.
Table 5 summarizes the predictive performance measures of the different classifiers on the student dataset.
The proposed BBN model evaluates the performance accuracy of students’ grade prediction.
Table 6 shows that the findings are a practical approach based on the data-level solution for students’ grade prediction. BBN has been applied to the whole BSCIS-ISS courses. The overall results show that the accuracy varies from one course to another. For instance, the best class accuracy is 100 for some courses, while the worst score is 0.7 for the course GCRT200.
4.5.3. Next Semester GPA Prediction
The performance of the GPA regression algorithms is assessed using two regression metrics, namely the mean squared regression (MSR) and the
estimate. MSR is calculated using the following equation:
where
N is the total number of test data entries,
is the actual
GPA entries in the test dataset, and
is the predicted
GPA entries. On the other hand,
is defined as follows:
In this context,
Figure 6 presents GPA values predicted by the random forest regressor vs. the actual data. Moving on,
Table 7 shows the performance of all models during the experimental run. Analyzing the data, we noticed that the random forest regressor performs better than other models.
5. Discussion
The results of this study show the performance of five machine learning algorithms in predicting the academic performance of students in a BSCIS-ISS course. The algorithms were compared based on accuracy, f1-score, precision, and recall.
The results show that the random forest algorithm had the highest accuracy of , followed by the AdaBoost regressor with an accuracy of and the BNN with an accuracy of . The decision tree algorithm had an accuracy of and the nearest neighbors algorithm had an accuracy of . The f1-score, precision, and recall of the random forest algorithm were , , and , respectively. The f1-score, precision, and recall of the AdaBoost regressor were , , and , respectively. The f1-score, precision, and recall of the BNN were , , and , respectively.
The results of the individual courses show that the ITGN120 course had the highest accuracy of , followed by the ITGN115 course with an accuracy of and the GMAT105 course with an accuracy of . The ENGL100 and ENGL105 courses had lower accuracy rates of and , respectively. The GUCR category had an overall accuracy of , which was higher than the accuracy of the individual courses.
In conclusion, the random forest algorithm showed the best performance in predicting the academic performance of students in a BSCIS-ISS course. The accuracy rates of the individual courses showed that the ITGN120 course had the highest accuracy, while the ENGL100 and ENGL105 courses had lower accuracy rates. The results of this study could provide valuable information for educators and academic administrators in developing strategies to improve student academic performance. Furthermore, the results could be used as a basis for further research on the use of machine learning algorithms in predicting student academic performance in other disciplines.
The results of our study are in line with previous findings, indicating that there are multiple factors that can influence a student’s grades. These results support the idea that student characteristics, course difficulty, teaching style, and personal circumstances can all play a role in determining a student’s academic performance [
52].
Our findings suggest that student characteristics such as age, gender, and socio-economic status can have an impact on grades. This highlights the importance of considering individual differences when developing a grade prediction model [
53].
Furthermore, our results indicate that course difficulty is a significant factor in determining a student’s grades. A more challenging course can result in lower grades, even for high-performing students. This highlights the need to take into account the level of difficulty of the course when building a grade prediction model [
54].
In addition, our findings suggest that teaching style can also impact a student’s grades. A student’s performance may be influenced by the teaching style of the instructor, the level of support provided, or the level of engagement in the class. This underscores the need for educators to consider how they can support and engage their students in the learning process [
55].
Finally, our results suggest that personal circumstances such as home life, health, and workload can also play a role in determining a student’s grades. This highlights the need for educators to be mindful of the impact that personal circumstances can have on a student’s academic performance, and to provide support and resources where needed [
56].
It is important to note that many of these factors can interact and influence a student’s grades in complex ways. For example, a student’s attendance may be affected by their personal circumstances, and their grades may be influenced by both their attendance and their test scores. In building a grade prediction model, it will be important to consider the potential interplay between these different factors in order to accurately predict a student’s grades.
6. Limitations of the Study
The limitations section is an important component of a research study as it highlights the constraints that were encountered during the study and how they may have affected the results. It is important to acknowledge these limitations so that the results can be interpreted with caution and the findings can be properly contextualized. This study is not without its limitations and the following section outlines several key limitations that should be considered when interpreting the results.
Sample size: The sample size for this study was 200 out of 500 students from 2016 to 2021. This relatively small sample size may limit the generalizability of the results to other universities or BSCIS programs.
Data quality: There were many missing grades in the period of the COVID-19 pandemic as many grades were recorded as “Pass” or “Fail” instead of the normal letter grade scale. This could have affected the accuracy and reliability of the results.
Unbalanced data for grade distribution: The grade distribution in the sample was unbalanced, with some grades being overrepresented and others underrepresented. This could have affected the results and the validity of the grade prediction model.
Limited scope: This study only covered one BSCIS program at the University of Dubai and may not apply to other programs or universities. The results should be interpreted in light of this limited scope.
It is important to consider these limitations when interpreting the results of this study and when considering future research in this area. Further studies with larger sample sizes, improved data quality, and a more balanced grade distribution are needed to validate and build upon the findings of this research.
7. Practical and Research Implications
The results of this study have significant practical and research implications for developing a student advising recommender system for the BSCIS program at the University of Dubai. These findings provide valuable insights into the key factors that influence a student’s grades and can inform the development of a recommender system that supports students in their academic journey. One practical implication of this study is recognizing the importance of considering a diverse range of factors in developing a student advising recommender system. The results show that student characteristics, course difficulty, teaching style, and personal circumstances are all significant factors that can impact a student’s grades. A recommender system that considers these factors can provide students personalized and accurate advice, helping them reach their academic goals. Another practical implication of the study is the importance of high-quality data for developing a student advising recommender system. The results reveal that the data quality was impacted during the COVID-19 pandemic, with many grades recorded as “Pass” or “Fail” rather than the normal letter grade scale. A recommender system that uses high-quality data will be more accurate and trustworthy, leading to improved outcomes for students.
This study also has research implications for future studies in this field. The limitations of this study, such as the limited sample size and unbalanced grade distribution data, suggest areas for further research that could deepen our understanding of the factors that influence a student’s grades. Moreover, this study only covers the BSCIS program at the University of Dubai, and future studies could examine the generalizability of these findings to other universities and programs. In conclusion, the results of this study have important implications for the development of a student advising recommender system. By gaining a deeper understanding of the factors that impact a student’s grades, a recommender system can help identify areas where individual students may need additional support and make personalized recommendations for improvement. Furthermore, the results of this study can inform the redesign of the curricula program and structure, ensuring that courses are appropriately challenging and instruction is effective.
8. Conclusions
This research proposed and validated an innovative RS to advise students and assist them in the courses selection BSCIS-ISS at the University of Dubai. Typically, through this study, we tested a new approach to help students choose a study path and showed that predicting student performance and elective choice is possible. In this context, using the designed and implemented RS, several students’ learning paths have been identified with different features and backgrounds. In addition, a method of recommendations based on many former students’ records has been introduced. Moreover, this system can provide recommendations for the distribution of students’ credit based on their learning styles and similar previous learning paths. The results of our study show the feasibility of the new approach in using big data and artificial intelligence technology for curriculum analysis and course recommendations. Future work aims at improving this work from different perspectives by (i) collecting various features such as students’ club activities and attendance, (ii) testing different time series algorithms, and (iii) implementing the system as a feature in a real University of Dubai core selection system.


 ,
, 


