Article

Multi-Stage Production and Process Outsourcing in Automobile-Part Supply Chain Considering a Carbon Tax Strategy Using Sequential Quadratic Optimization Technique

Industrial Engineering Department, College of Engineering, King Saud University, P.O. Box 800, Riyadh 11421, Saudi Arabia
*
Author to whom correspondence should be addressed.
Mathematics 2023, 11(5), 1191; https://doi.org/10.3390/math11051191
Submission received: 4 January 2023 / Revised: 1 February 2023 / Accepted: 13 February 2023 / Published: 28 February 2023

Abstract

:
This research focused on modeling and optimizing production and outsourcing operations in a supply chain (SC) while considering environmental challenges. The proposed mathematical model was nonlinear, implying outsourcing, and took into account reworking and carbon tax. It was solved using sequential quadratic programming (SQP) to achieve best solutions. Transportation significantly impacts carbon emission, which, herein, was considered the total cost of the SC. The model was tested using data from the automobile part industry, and sensitivity analyses were performed to understand the impacts of individual parameters on the total cost of the supply chain. The results could provide valuable insights for managers seeking to optimize production and outsourcing for a resilient supply chain.

1. Introduction

Businesses require resilient and competitive chains to supply and distribute goods to their customers on time and with minimal costs. Manufacturers in a centralized supply chain (SC) play a vital role in managing inventory, resources, production, and operations. Thus, limited resources, or unavailable resources, are a major concern to the performance of the SC. In response, industries have begun outsourcing operations for smooth flow of goods to the customers. Outsourcing is a major business strategy, and has become more important in recent years. Owing to technological advancements, there has been increasing competition in the market, in terms of product variety and product life cycle [1].
To remain competitive in the market, organizations have focused more on their core activities while outsourcing other processes [2]. Preferably, an organization would use strategic sourcing in procurement, intending to enhance partnerships with suppliers, reduce expenditures, simplify procurement processes, and reduce the total cost of ownership of strategic products or services [3]. The goal of outsourcing is to enhance the flexibility of the firm and let the company focus on its core activities as, in today’s environment, it has grown harder to fulfill customer requirements and achieve their trust [4]. Moreover, outsourcing is considered a key aspect of any organization because it enhances market coverage, reduces capital investment, reduces cost, and improves customer service. In the past, only non-core components were outsourced, but trends have changed. Today, every activity of a firm can be outsourced, whether core or non-core, including components, business processes, information technology processes, manufacturing and distribution activities, and customer support activities [5]. The core ability paradigm relies on corporations’ understanding. Aside from their core abilities, organizations must conjointly and absolutely perceive the aspects of their business—particularly their operations, tactics, and strategies [6,7].
In the traditional economic production quantity (EPQ) model, all items are considered perfect, but it is a matter of fact that, in all industries, products with imperfect quality are also produced [8]. Multiple causes can lead to product imperfection, including improper control of the process, poor labor, lack of management skills, maintenance issues, and problems during handling. Imperfect products are also produced when production goes out of control [9]. Such products are reworked at some cost to align with customers’ needs. Production systems with imperfect processes can produce two types of defective items: reworkable and nonreworkable items. The nonreworkable items are discarded and the reworkable items are sent to be reworked or sold at lower prices than perfect products [10]. Thus, imperfections in the production system are well managed and organized.
In 2005, the Kyoto Protocol was initiated. This protocol motivated countries around the globe to take effective measurements to reduce carbon emissions. However, carbon gas emissions reached a record high level in 2020 (according to World Meteorological Organization), with the average annual emission reaching higher levels than in the previous decade. Based on this, countries have dramatically increased their consumption of non-fossil fuel energy [11,12].
The issues of global warming and climate change, caused by excessive reliance on fossil fuels, are a major concern among researchers and policymakers. Efforts have been made to reduce greenhouse gas emissions, but one major obstacle is the high cost of implementing environmentally-friendly technologies. From a supply chain perspective, companies may increase capacity or outsource production to meet customer demand, but this often results in higher emissions [13]. Companies face a dilemma when it comes to reducing carbon emissions: invest in new eco-friendly production technologies, or use renewable energy sources.
Significant literature is available on product outsourcing, but the literature is lacking in studies on the modeling of process outsourcing in multi-echelon supply chains, where a particular process on the product is outsourced. Furthermore, this work directed attention to the inculcation of carbon tax strategies, which is a significant addition to the outsourcing model. Imperfect production was also addressed in order to optimize the overall costs of the supply chain. This study considered an automobile spare parts industry that had the capacity to perform multiple processes germane to their work, except for two: laser and coating. The mathematical model of the proposed SC model, including outsourcing, was modeled and tested using data from the automobile industry, which provided a platform to decision-makers and industry experts to optimize the production lot size and outsourcing quantity while considering carbon tax to achieve minimum costs.
The paper was organized as follows: in Section 2, we discussed previous literature reviews related to outsourcing, inventory, and carbon tax policies in production and supply chain management. Mathematical modeling of process outsourcing in the supply chain, including assumptions, notation, and model formulation, were covered in Section 3. The methodology of the proposed research, in which the numerical experiments were performed using two cases, was depicted in Section 4. The numerical experimentation results analysis and managerial insights are discussed in Section 5 and 6 respectively. The sensitivity analyses of the proposed mathematical model, with respect to the input parameters, were performed in Section 7. In Section 8, we provided the conclusion of this research, including future outcomes.

2. Literature Review and Conceptual Framework

Businesses’ supply chains (SC) are aimed at improving the quality of products and services by reducing production time and cost. This is achieved when management works cooperatively with other supply chain organizations. It has been observed that competition is no longer company against company, but rather supply chain against supply chain. SCs are focused on delivering value to the end customers. Effective planning and control of production and inventory are crucial components of an SC. Inventory management addresses questions such as how much to order and when to order. However, successful operations and customer satisfaction in the supply chain cannot be achieved without adequate resources. Process outsourcing is a significant factor for businesses to rely on, with significant benefits. According to Lankford and Parsa [14] an important part of business strategy is the outsourcing of selected operational tasks. The benefits of outsourcing are significant for corporations in reducing prices, and increasing services and skills. Outsourcing helps corporations to focus their assets on their core sector. Corporations may purchase technology from a vendor that would be too expensive to replicate internally. In such cases, the business goals may never be realized until the appropriate process is outsourced to a vendor. In traditional outsourcing, only non-core activities are outsourced, except for the processes that have a competitive edge [15,16].
Outsourcing in the supply chain is recognized as a key strategy for firms to achieve the best organizational performance [17]. Peter Chiu et al. [18] worked on product outsourcing in the production system by considering failures and scrap and used an analytical approach to optimize batch fabrication. Kumar et al. [19] proposed a logical approach to the vendor selection problem decision-making process. They used three fuzzy objectives and some crisp constraints in the multi-objective model. In depth, the work of weight assignments and the multi-objective factors that affected logistic outsourcing were addressed by [20]. Amid et al. [21] suggested a further fuzzy multi-objective model that simultaneously considered the formulation impression and defined the order quantities for each supplier. Rezaei et al. [22] suggested a model in which the consumer needed to determine the order quantity, suppliers, and times. To find the best suppliers and determine how to assign orders among them, Karpak et al. [23] used goal programming, evaluating trade-offs between multiple objectives such as cost, quality, and delivery simultaneously. Another study [24] was carried out to inculcate asymmetrical cost minimization in SC. Pricing strategies in a green SC can be even more critical; a recent study was carried out by [25] to address the optimal pricing and service level in supply chain. The concepts of sustainability and circular economy (CE) materialized over the past decade; remanufacturing strategies, aligned with outsourcing, in addition to core activities, are needed in production models nowadays. Such cases have been studied, e.g., by Stevic et. al. [26,27].
Governments have begun focusing on green supply chains [28] and remanufacturing in recent years because they represent clean production methods and help reduce carbon emissions [29,30]. Some manufacturers, referred to as original equipment manufacturers (OEMs), produce a high amount of carbon emissions due to the energy consumption during their manufacturing processes. To combat this, OEMs have been implementing green manufacturing practices to decrease their carbon footprint. Examples of this include Apple’s goal to achieve Scope 3 carbon neutrality by 2030 and Starbucks’ use of paper straws instead of plastic ones. Researchers have also looked into how carbon emission constraints affect the supply chain, specifically in different markets [31,32].
Recently, environmental aspects have been considered with respect to economic lot size modeling. EOQ and Newsvendor have primarily been used to determine lot-sizing with consideration for the environment [33,34]. According to a report, 75% of the greenhouse gas emissions of SCs are mostly due to cost-effective measures, rather than individual firms [35]. Global warming is a concerning issue in today’s world, and carbon emissions are a primary contributor to climate change. The supply chains of various industries emit tons of carbon annually. Carbon policies have been established to minimize CO2 emissions [36]. Five such major policies are the carbon tax, carbon cap, carbon cap and trade, carbon offset policy, and carbon subsidy. Carbon tax policies charge per unit emission of CO2 [37].
According to Setak et al. [38] there were 170 articles, published from 2000 to 2010, that related to vendor selection and order allocation methods. Different approaches have been used for the modeling and optimization of supply chains, considering production and outsourcing operations. These have included advanced evolutionary algorithms, analytical methods, simulation techniques, and multi-attribute decision-making (MADM) techniques, including the analytical hierarchy process (AHP), analytical network process (ANP), and others. Zhang et al. [39] used simulation analysis, using partial differential equations for modeling of a supply chain. Templmeier et al. [40] developed a new model formulation and a heuristic solution method to address the problem of dynamic order sizing and supplier selection under discount quantity conditions. Feng et al. [41], applied a stochastic linear model to simultaneous supplier selection. Liu [42] used artificial neural networks to reduce the risks involved in using digital transformation of a manufacturing supply chain. A noteworthy study by Wiseman [43] focused on the expected reduction in emission upon adoption of new autonomous vehicles; similarly, a study by Figliozzi, M. A. (2020) [44] addressed carbon emissions in autonomous vehicles. Further recent studies on vehicle car encompassing energy [45,46,47] and carbon tax [48,49,50] strategies are carried out by various researchers.
The author contribution table is given in Table 1 to represent the scientific research work done by researchers over past few decades for gap analysis of the proposed work.
Recently, researchers focused on various factors and extended the supply chain model with outsourcing strategies, imperfections, and carbon emission policies. However, the proposed research model dealt with management of production, process outsourcing, inventory, and imperfections for the smooth flow of the products to the customers in a resilient supply chain in which the carbon tax strategy was adopted in response to environmental concerns. The research model and optimization are providing a solution for managers and industries to cope with the limited resources problem with optimal outsourcing in the supply chain.

3. Mathematical Model

The model considered a two-echelon supply chain in consideration with process outsourcing. There were two players involved in this supply chain: the manufacturer and the outsourcers (vendors). The manufacturer had insufficient resources to fulfill all the processes required to obtain finished goods. Therefore, the process was contracted to outside vendors that had the capacity and resources. Contracting was based on cost. Figure 1 shows the supply chain model, in which the automobile spare parts industry performed different processes in three phases such that the mathematical model was based on multi-stage production systems. This model did not consider scrap while the defective part was isolated and reworked. The model was scrap-free and did not require recycling or disposal.

3.1. Assumptions

Before proceeding with modeling, the following assumptions were considered:
  • The model considered multiple types of items. The production system outsourced operations due to limited constraints. The imperfect products were produced, after which reworking was done and inspection cost was incurred.
  • Production and demand rates were constant and known throughout the supply chain. There were no shortages produced in the system (Pa > ∑ Pbi > Pc > D to avoid shortages). The demand rate was equal in all three phases.
  • Production and reworking were done in the same manufacturing system at the same production rate. Inventory holding costs were based on the average inventory.
  • There was no scrap during the rework process. The rework process was 100% perfect. All products were screened and the screening cost was negligible. Transportation cost was not considered the total cost of the supply chain.

3.2. Decision Variables

The following were the decision variables of this paper:
  • Q, production quantity for manufacturer.
  • (Qb1, Qb2, Qb3, …, Qbn) Production Quantity for n outsourcers.

3.3. Notation

There were certain notations used in this research work to represent the mathematical model discussed in this paper. These notations are presented and explained in Table 2.

3.4. Model Formulation

The main objective of this model was to minimize the total cost of the whole supply chain, which was equal to the sum of the outsourcing cost and manufacturing cost. The overall process was comprised of two major activities, i.e., manufacturing and outsourcing, and was almost completely dependent on its costs. Manufacturing costs involved in-house costs related to the operations performed on the parts being fabricated, while the outsourcing cost comprised all costs associated with outsourcing.

3.4.1. Cost of Manufacturer

Manufacturing took place in two phases, Phase A and C. Both phases had separate costs. The manufacturing cost included the setup cost, production cost, holding cost, carbon emission cost, inspection cost, and rework cost. Cost of manufacturer was given as:
Cost of Manufacturer = SCm + PCm + HCm + CEm + Ia

Setup Cost

Setup cost referred to the cost of setting up of the manufacturing line for the operations or placing the order for outsourcing the process. This was a fixed cost, independent of quantity and time. This cost included tool setting cost, changeovers, etc. It was the initial cost of the setup of the production system.
Setup cost for manufacturer was given as:
S C m = S m × D Q
Additionally, the setup cost of outsourcer i was given as:
S C b i = S b i × D Q b i

Manufacturing and Rework Cost

This cost depended highly on the demand for the product to be manufactured. This cost included processing cost, machine cost, labor cost, and material cost. It was assumed that the manufacturing cost per unit item was equal to the rework cost per unit item in the same phase, i.e., the production cost per unit item of the given demand at the rework rate of the respective phase. Therefore, the manufacturing cost and rework cost of phase A and C were given below.
Phase A manufacturing cost:
M C a j = j = 1 n ( M a j × D j × ( 1 + α a j ) )
Phase C manufacturing cost:
M C c j = j = 1 n ( M c j × D j × ( 1 + α c j ) )
Manufacturing and rework cost for outsourcer:
P C b i j = j = 1 n ( M b i j × D j ( 1 + α b i j ) )

Holding Cost

Holding cost was associated with the quantity of material and the duration for which it was held, which was a variable cost that depended on varying inventory at every instant. Holding cost included carrying the cost of works in process, finished goods, the cost of transportation of semi-finished goods from and to vendors, and insurance costs.
H C m = H m × Q × V
where:
V = { D ( 1 α a ) P a } ( 1 + 2 α a ) + 2 α a 2 D P a + ( 1 D p a α a D P a ) + D P c ( 1 D p c α c ) ( 1 + 2 α c ) + α c 2 D P a ( 1 D p c ) + ( 1 D p c α c D P c ) 2
The proof of holding cost was given for all three phases. Similarly, the holding cost of outsourcers was given as:
H C b i = h b i × Q b i × W   b i
where: i = (1, 2, 3)
W b i = Q b i 2 { D ( 1 + α b i ) P b i ( 1 + 2 α b i ) + α b 2 i D p b i + ( 1 D p b i α b i D p b i ) }

Transportation Cost

The transportation cost was associated with the moving of semifinished goods from 1st phase of manufacturer to corresponding outsourcer and then transporting goods from outsourcer to the final phase of manufacturer for finishing. There were two parts of transportation cost: fixed and variable. The manufacturer’s transportation cost was given as.
T R m = j = 1 n [ ( F m j D j ) Q j + V m j D j ]
On the other hand, the outsourcer transportation cost was given as:
T R b i j = j = 1 n [ ( F o i j D j ) Q o i j + V o i j D j ]

Carbon Tax

Carbon is emitted during production processes. The government has been regulating industries to minimize emissions, imposing a tax on tons of carbon emission called the carbon tax. It was utilized herein as the cost of emissions for respective demand. Carbon emission per unit product was calculated by dividing total carbon emission by total production. Carbon emission cost was also associated with transportation in the proposed supply chain.
For the manufacturer, it was represented as follows:
C E m j = j = 1 n ( e m j f m j D j + e t m j f t j D j )
For outsourcers, carbon emission cost, incurred with emission in production and transportation, was expressed as:
C E b i j = j = 1 n ( e b i j f b i j D j + e t o i j f t j D j )

Inspection Cost

This was directly related to the demand; the greater the quantity, the higher the inspection cost. Defective parts were reworked and good items were sent on to the next phase. For the manufacturer, every item was inspected, a cost represented as:
I C m = I m × D
For outsourcers, the inspection cost was:
I C b i = I b i × D

Total Manufacturing Cost

This comprised all costs associated with manufacturing and was the sum of the setup cost, production cost, holding cost, carbon emission cost, and inspection cost of the manufacturer.
T C m = h m Q 2 { ( D ( 1 α a P a ) ( 1 + 2 α a ) + 2 α a 2 D P a ) + ( 1 D P a + 2 α a D P a ) + D P c ( 1 D P c α c ) ( 1 + 2 α c ) + α a 2 D P a ( 1 D P c ) + ( 1 D P a + 2 α a D P a ) 2 } + + S m D Q + M a D ( 1 + α a ) + M c D ( 1 + α c ) + e m f m D + ( I a + I c ) D

3.4.2. Total Cost of Outsourcers

Outsourcing cost was defined herein as the cost of process outsourcing and was equal to the sum of the costs of all the outsourcers, bi (b1, b2, b3). The outsourcing cost included setup cost, holding cost, manufacturing cost, carbon emission cost, and inspection cost. The outsourcers marginal factor/profit was added into the total cost. The holding/inventory cost was formulated from the inventory diagram given in Appendix A and Appendix B. Similarly, setup cost, production cost, and other costs were derived in similar ways as cost of manufacturer. However, there were different parameters associated with the outsourcers. The mathematical expression was given as:
Cost of Outsourcers = SCoi + PCoi + HCoi + CEoi + Ioi
T C o = M R [ i = 1 n h b i Q b i ( 1 + α b i ) 2 { D ( 1 α b i P b i ) ( 1 + 2 α b i ) + 2 α b i 2 D P b i + ( 1 D P b i + 2 α b i D P b i ) } + S b i D Q + M b i D ( 1 + α b i ) + e b i f b i D + I b i D ]

3.4.3. Total Cost of the Supply Chain

The formulation of the total cost of manufacturer and outsourcers resulted in the total cost of the supply chain, considering multi-stage manufacturing (working in two phases) and multiple outsourcers processing the manufactured product. The mathematical expression to minimize the total cost of centralized SCM is given below.
T C j = j = 1 n [ h m j Q j 2 { ( D j ( 1 α a j P a j ) ( 1 + 2 α a j ) + 2 α a j 2 D j P a j ) + ( 1 D j P a j + 2 α a j D j P a j ) + D j P c j ( 1 D j P c j α c j ) ( 1 + 2 α c j ) + α a 2 D P a ( 1 D P c ) + ( 1 D P a + 2 α a D P a ) 2 } + S m j D j Q j + M a j D j ( 1 + α a j ) + M c j D j ( 1 + α c j ) + ( e m j f m j D j + e t m j f t j D j ) + ( I a j + I c j ) D j + ( F m j D j ) Q j + V m j D j + M R [ h b i j Q b i j ( 1 + α b i j ) 2 { D j ( 1 α b i j P b i j ) ( 1 + 2 α b i j ) + 2 α b i j 2 D j P b i j + ( 1 D j P b i j + 2 α b i j D j P b i j ) } + S b i j D j Q j + M b i D j ( 1 + α b i j ) + ( e b i j f b i j D j + e t o i j f t j D j ) + I b i j D j + ( F o i j D j ) Q o i j + V o i j D j ] ]

3.4.4. Constraints

There were some limitations in the proposed manufacturing system. To make the mathematical model behave like a real-life scenario, several constraints were defined, shown below. These constraints included both equality and non-equality constraints.
  • Production Constraints:
    Q = Q b 1 + Q b 2 + Q b 3 + Q b n
  • Demand Constraints:
    Q = Q a = Q b = Q c = = Q n D
  • Space Constraints:
    C Q C m C Q b 1 C b 1 C Q b 2 C b 2 C Q b 1 C b 1 C Q b n C b n
  • To avoid shortage:
    P a i = 1 3 P b i P c D

4. Methodology

The model was developed for the SC of a multi-stage manufacturer and multiple outsourcers (n); however, three outsourcers/vendors were considered for the methodology and numerical experiment of this study. The research aimed to obtain optimal lot quantity, Q, for the manufacturer: Qb1 for 1st vendor, Qb2 for 2nd vendor, and Qb3 for 3rd vendor. The mathematical model had a nonlinear constraint in solving.

Sequential Quadratic Programming (SQP)

The objective function could not be solved through the classical method because of its complexity. To solve this nonlinear equation, sequential quadratic programming (SQP) was used. The SQP approach, based on the Newton approach, was the best method with which to solve the unconstrained optimizations [61]. Schittkowski et al. [62] introduced and tested a version that, in terms of performance, accuracy and percentage, outperformed any other system. They also tested successful solutions to address a wide range of research concerns. The approach closely resembled the methodology for unconstrained optimization of the Newton method. An approximation was made of the Hessian using a quasi-Newton updating method at each major iteration. It was then used to generate a Quadratic Programming (QP) sub-problem that was used to create a search direction for a line solution. SQP had a fast execution time, compared to other optimization techniques, and solved objective functions with fewer iterations.

5. Numerical Experiment

To check the model robustness, two numerical experiments were performed. First, experimental data were taken from past papers and other experimental data were collected from a local Mat manufacturing industry. These two numerical experiments were discussed in cases 1 and 2, respectively.

5.1. Numerical Example 01

In the first case, the data were collected from a literature review, based on the automobile spare part manufacturing industry. The data related to the production rate, demand, setup cost, holding cost, and manufacturing cost were taken from a paper by Sarkar et al. (2014) [63]. The inspection data were collected from the research study by Sarkar (2016) [64]. The data on carbon emission, in tons per unit item production, were taken from work done by E. Bazan and M.Y. Jaber (2016) [65]. Other data, such as defective rates and marginal cost, were acquired directly from the industry because they relied on industrial conditions and state regulations. The data on the automobile spare part manufacturing industry of Phase A and C, taken from the literature review, are given in Table 3.
The setup cost and carbon emission cost were the sum of the costs of both phase A and phase C. In phase B, processes (laser and coating) were performed in outsourcing firms. The major costs of manufacturing in phase B are given in Table 4.

5.2. Numerical Example 02

For the second experiment, the data were collected from the local Woven Polypropylene Floor Mats Manufacturing industry. The manufacturing processes included mixing, extruding, weaving, sewing, pressing, and packaging. The data collected from the industry were based on per-kilogram production of polypropylene floor mats. The data for the mat manufacturing industry of Phase A and C, taken directly from the local industry, are given in Table 5.
The outsourcing data for phase B were collected from vendors in the mat manufacturing industry. Phase B was the manufacturing phase performed by outsourcers. The data on the mat manufacturing industry of Phase B, taken from vendors, are given in Table 6.
The collected data needed to be reliable in order to be usable in this research. Therefore, Cronbach’s reliability test was performed to find average data points. The test was performed for each question of the questionnaire. The accepted value was equal to or greater than 0.7, and the alpha value of the collected data was greater than 0.7. Thus, the data were accepted and deemed reliable. The collected data, from the questionnaire and literature, were used in the proposed model to find the best solution.

6. Numerical Results (Case1 & 2) and Managerial Insights

The mathematical model was a single objective constraint nonlinear model. SQP methodology was used to solve the objective function. The formulation was coded in MATLAB-16 version and optimum values of total cost and production quantities were calculated in the optimization toolbox. There were four decision variables in this model. One, Q*, was for the manufacturer and Qbi* was used for ith outsourcer, where i = (1, 2, and 3). When the product exited phase A, it was sent to the outsourcer for further processes that were unavailable at the manufacturing firm. Total Q* was distributed to vendors such that it gave minimum TC. This mathematical model could help managers to make better decisions in the production of optimal quantities for manufacture and shipment to outsourcers that would, in turn, give the optimum value of TC for the overall supply chain.
The output values generated from MATLAB for both experiments are given in Table 7 below.
An iterative and advanced evolutionary algorithm, SQP, was used to optimize the results of two experiments. The results were outstanding in both cases. The minimum total cost of the supply chain in Case 01 was $93,362.80, where the production outsourcing quantities of three outsourcers were set at 88, 28, 29, and 30 respectively. For Case 02, the optimal cost of SCM was obtained as SAR 350,233.46, where the decision variables, in term of manufacturer production quantity, were 1607 kg and outsourcing quantity for three outsourcers were 470 kg, 526 kg, and 611 kg, respectively.
This production scheduling policy was an output of the proposed research that could have relevance in a real multi-stage production system. Managers could take advantage of optimal production and multi-outsourcing processes for minimum cost of production. These outstanding results could be important for manufacturers and outsourcers seeking integrated inventory and supply chain management to deal with production and outsourcing needs with minimal costs. This model could help managers in determining the optimal quantities for production and lot size to shift to outsourcers in order to minimize the total cost of the supply chain. The model was based on deterministic demand, as demand was sensitive to the total cost of SCM.

7. Sensitivity Analysis

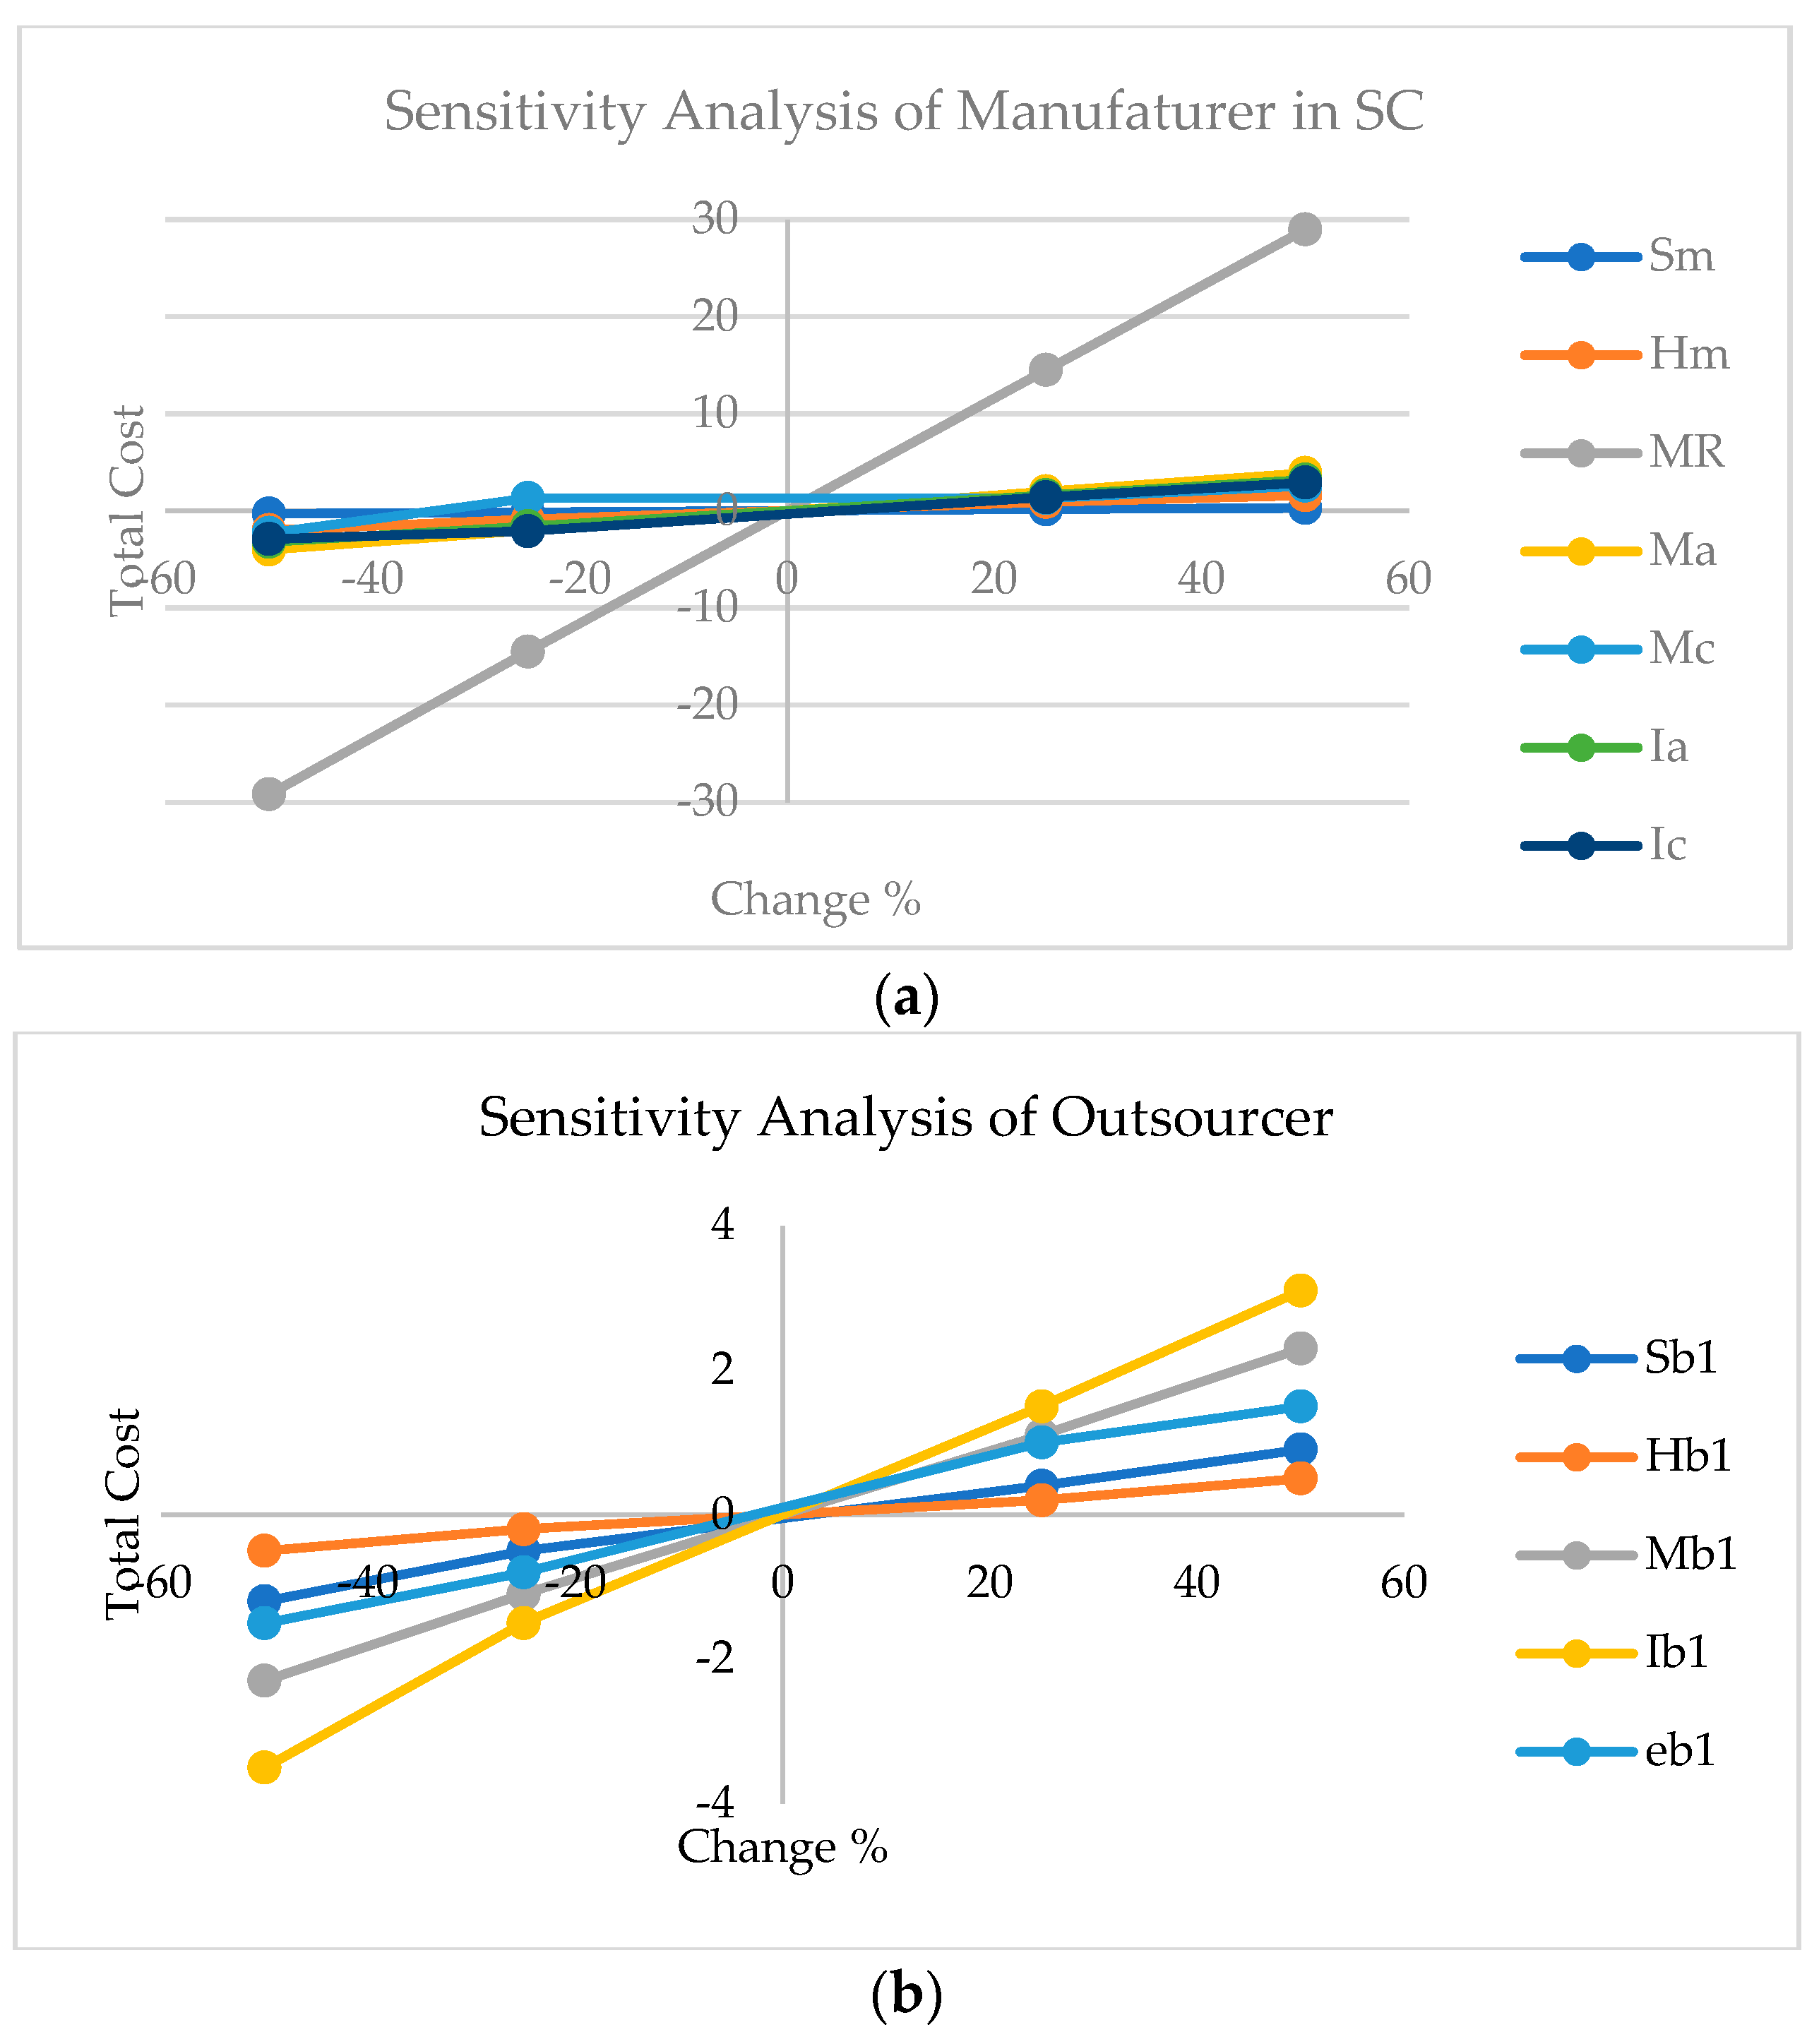
A sensitivity analysis was required to understand the importance of input parameters and their impacts on output. In the proposed research model, it was clear that most of the input parameters were cost-oriented, e.g., holding cost, setup cost, carbon tax, inspection cost, outsourcing cost, etc., and the cost was uncertain due to increasing inflation, supply chain disruption, taxes, and demand fluctuation. For these reasons, it was important to check the sensitivity of the mathematical model and total cost, as well as which cost parameters were essential input and which were unimportant. To check the sensitivity of variables, each input parameter was varied within the range of [−50% to +50%] at an increment 25%. Results are shown for sensitivity analysis of manufacturer and outsourcers in Table 8 and Table 9, respectively.
Figure 2 is a graphical representation of our sensitivity analysis, based on data given in Table 8 and Table 9, showing that the most dispersed lines had a high impact on the total cost of the supply chain (SC). By making small changes to these, the sensitive variables caused drastic variations in the total cost of SC.
The outcomes of the sensitivity analysis were as follows:
  • The marginal cost had a higher impact on the total cost. Changing the marginal cost by ±50% caused ±29% variation in the total cost.
  • A second significant parameter with a high impact on TC was manufacturing cost, Ma. Changing Ma ± 50% varied TC by ±4%. Similarly, inspection cost was the next most significant variable, with a reduction of 3.5% in TC.
  • Some variables (MR, Ia, Ic, Ibi, em, ebi, Ma, Mc, and Mbi) had no impact on decision variables, but had a direct impact on the total cost.
  • The production rates of manufacturers and outsourcers both had low impacts on the total cost. Comparatively, for any production system, the setup cost and holding cost were the main costs.
  • With all costs fixed, increasing these costs had a direct impact on the overall cost. It was observed that the setup cost was more sensitive than the holding cost, meaning that the industry could further reduce overall costs by using initial investment to decrease their setup cost.
  • In a traditional production system, inspection cost is controlled through human inspection. An increase in inspection costs could cause an increase in total costs. This could be minimized by replacing physical human inspection with machine inspection
  • em and ebi were variables for carbon emission, per unit item of production, for manufacturer and ith outsourcers, respectively. It was noted that em had a high impact on total cost, as compared to ebi. Carbon emission had a direct relationship with total cost, and would thus be of major concern for managers; government policy and customers increasingly demand environmentally friendly products. Therefore, to be competitive in the market, a business must minimize the overall carbon emissions in their supply chain.
  • In the case of outsourcers, the most impactful parameters on TC were inspection cost Ib1, manufacturing cost Mb1, carbon emission per unit item eb1, and setup cost Sb1.
  • A minor change in these two led to high impacts on the total cost. The other variables also impacted the total cost, albeit minorly. Abrupt changes in the total cost occurred only when the marginal and demand rates were changed slightly. All other variables’ lines merged into each other, showing that there was little or no impact on the percentage of the total cost. The results clearly showed that the marginal rate and demand had a significant impact on output.
  • Similarly, the manufacturing cost line had the second-highest impact on total cost; a small change in this was able to change the total cost. The third-highest impact in this category was the inspection cost, which had little impact on the objective function.

8. Conclusions

Outsourcing is an essential business function of any organization seeking to avoid huge cost/resource burdens. This research was based on the mathematical modeling of process outsourcing in order to cope with the limited resources of a firm. The proposed supply chain model considered data from the automobile spare part industry. The data from the automobile part manufacturing industry provided insight into the implications of the proposed supply chain model, which was focused on managing lot size, inventory, reworking, outsourcing, and production of a multi-stage manufacturing system. The production quantities and outsourcing quantities for each vendor were optimized to minimize the total cost of the supply chain.
The environmental objectives were achieved by assimilating waste management and carbon tax strategies in the model. The former dealt with reworking operations in the multi-stage production system, which guided determinations of optimal lot size and minimum total cost assuming the reworking of defective products in the same cycle. The latter was associated with the carbon tax and was also considered to avoid excess carbon emissions from production and outsourcing operations in the SC. The sequential quadratic programming technique (SQP) was used to optimize an objective function by experimenting with two numerical examples. Sensitivity analysis showed that the total cost and decision variables were mostly influenced by marginal cost, holding cost, and setup cost. The marginal cost had an impact on decision variables, while inspection cost and manufacturing cost did not.
The model could be extended by adding uncertainty in production. Additionally, the result would be better if the total optimal cost of production was fixed through fuzzy production quantity. The uncertainty in the model could be dealt with through the application of robust optimization methods i.e., probabilistic, nonlinear, and other stochastic methods. Near-optimal solutions could be obtained using advanced iterative algorithms. The proposed model was based on the assumption that all the defective items were reworkable; however, the model could be extended by adding rejected items to the multi-objective, optimizing it through goal programming and genetic algorithms. Therefore, in the future, the model could be extended with variable demands, depending on multiple variables, which could be obtained using probabilistic, fuzzy, stochastic, or linear regression approaches. The model considered two echelons for production and outsourcing firms, managing inventory, lot size and production; however, it could be modeled for three-echelon SCM. Overall, this research could help managers to decide on optimal lot sizes and allocations of semi-finished product quantities to outsourcers, thereby minimizing total cost.

Author Contributions

Conceptualization, M.A.; methodology, M.M.; software, L.H.; validation, M.A. and L.H.; formal analysis, M.A.; investigation, M.M.; data curation, M.A.; writing—original draft preparation, M.A.; writing—review and editing, M.M. and L.H.; supervision, M.A.; funding acquisition, M.A. All authors have read and agreed to the published version of the manuscript.

Funding

This project was funded by the National Plan for Science, Technology and Innovation (MAARIFAH), King Abdulaziz City for Science and Technology, Kingdom of Saudi Arabia, Award Number 15-MAT4882-02.

Institutional Review Board Statement

Not applicable.

Informed Consent Statement

Not applicable.

Data Availability Statement

Not applicable.

Acknowledgments

This project was funded by the National Plan for Science, Technology and Innovation (MAARIFAH), King Abdulaziz City for Science and Technology, Kingdom of Saudi Arabia, Award Number 15-MAT4882-02.

Conflicts of Interest

The authors declare no conflict of interest.

Appendix A

It includes clear Inventory Diagrams for each phase of the Manufacturer and outsourcer. The inventory diagram includes three phases; A, B, and C. Phase A and phase C represent manufacturing activities while phase 2 depicts outsourcing processes. The total time is divided into three parts: T1, T2, and T3 that are sub-divided into t1, t2, t3, t4, t5, t6, t7, t8, and t9. D represents the customer demand rate, where Imax represents the maximum inventory of phase1 and Imaxa2 represents production without defectives parts. Similarly, Imaxbi and Imax represent the maximum inventory level of ith outsourcer and manufacturer in phases 2 and 3 respectively. In the first phase, the manufacturer produced quantity Qa with full inspection in time t1 in which the defective parts are removed and reworked during time t2.

Appendix A.1. Inventory Diagram of the First Phase of Manufacture
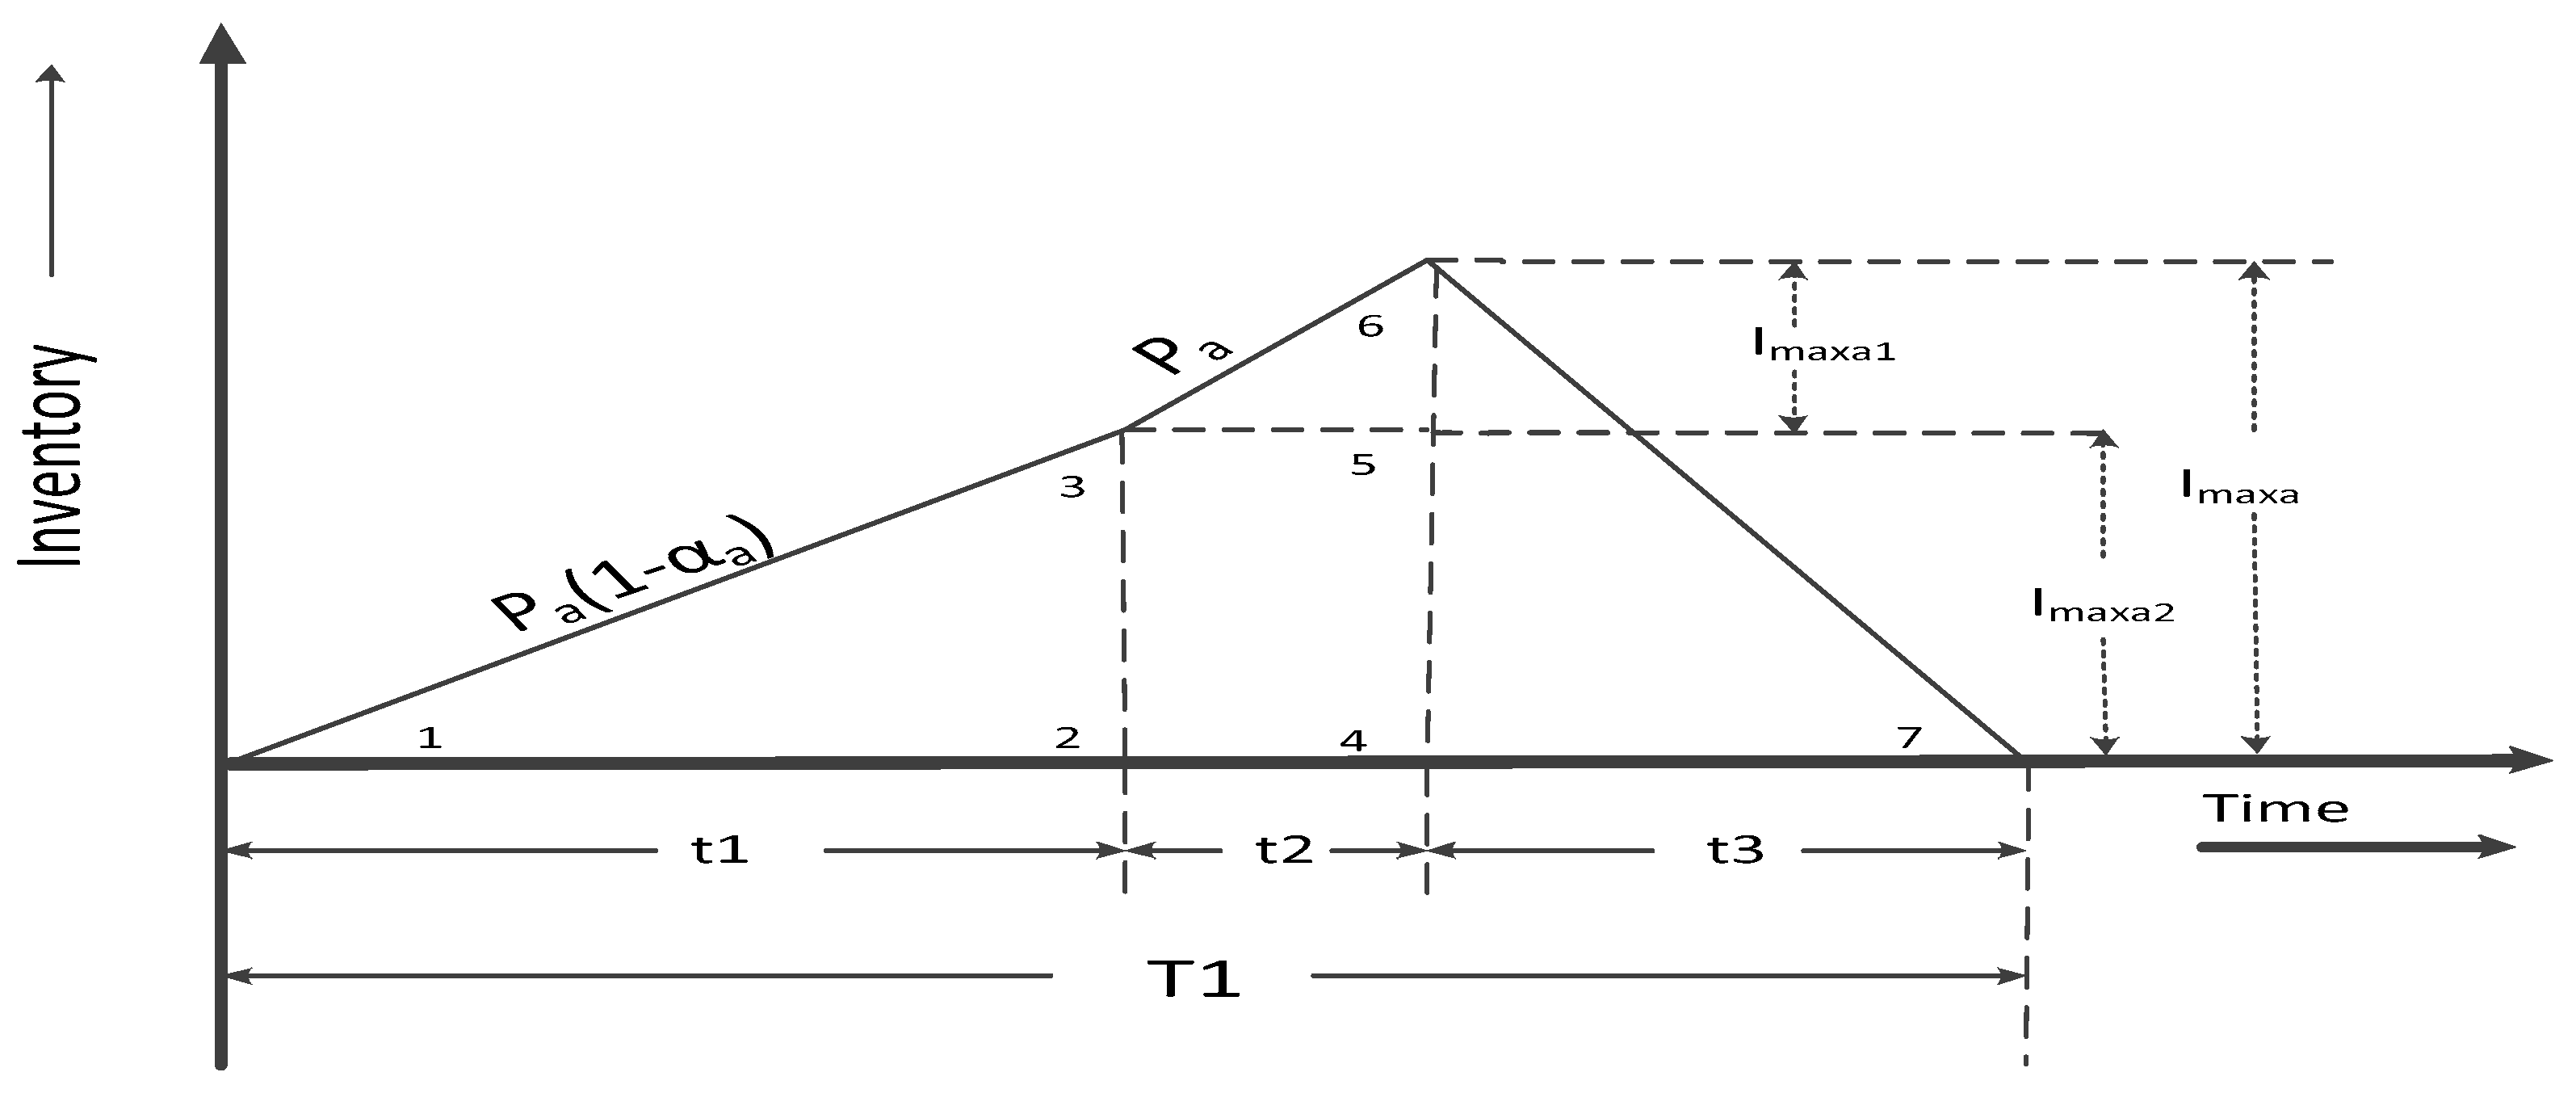
Figure A1. Inventory diagram of the first phase of the manufacturer.
Mathematics 11 01191 g0a1

Appendix A.2. Inventory Diagrams of 2nd Phase of Outsourcers
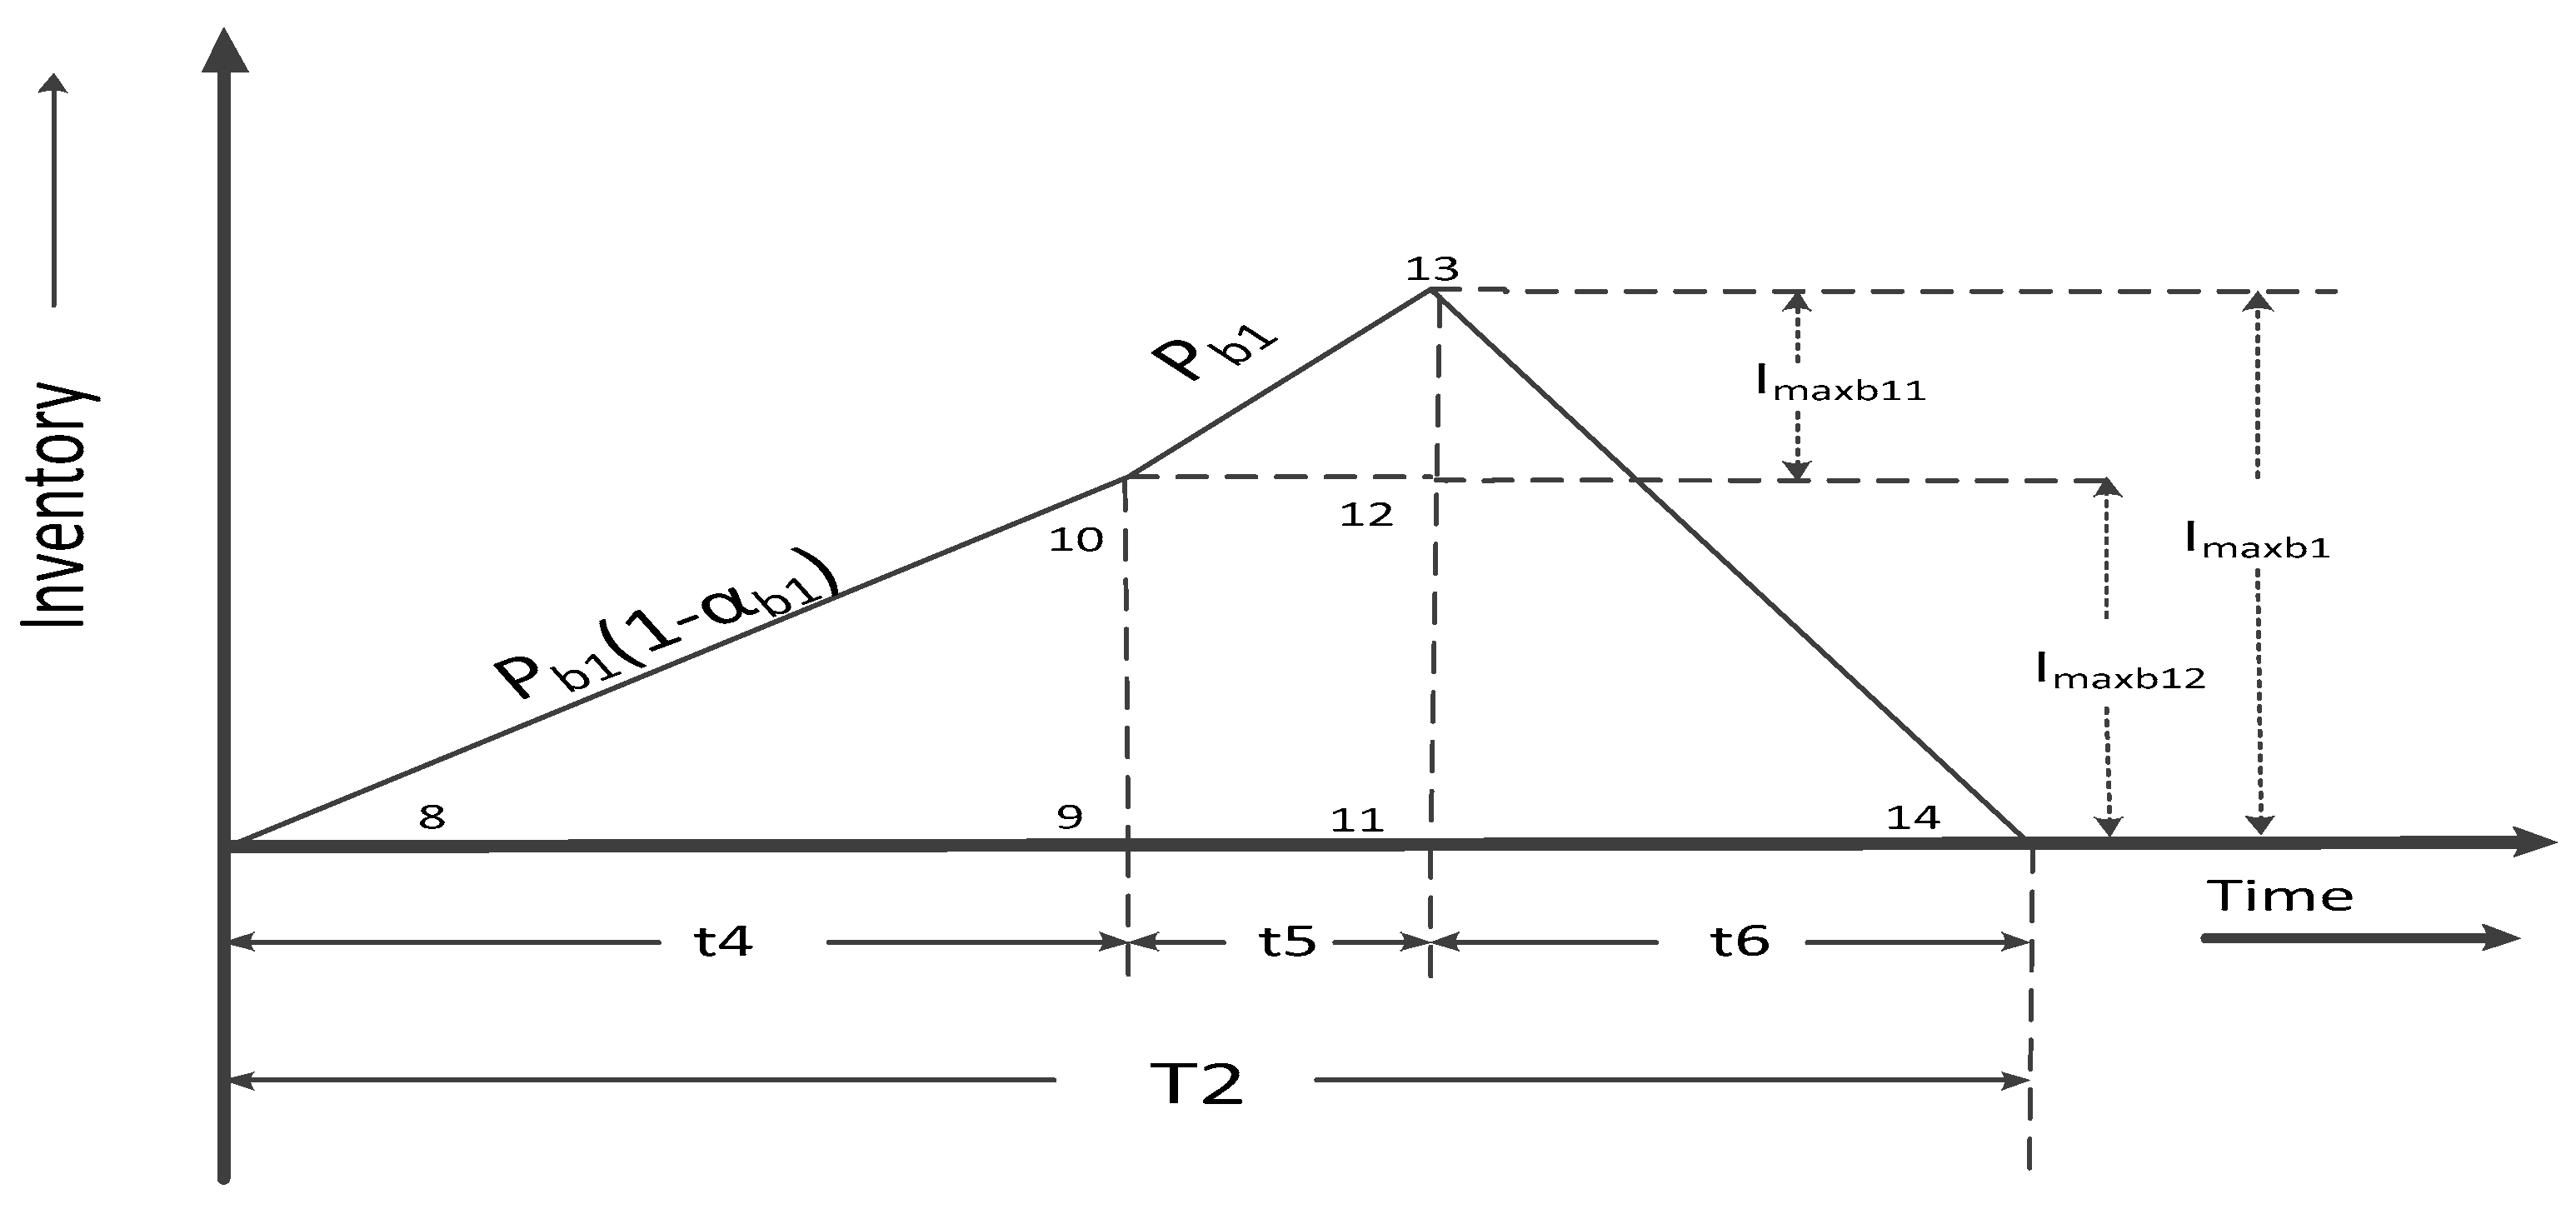
Figure A2. Inventory diagram of 1st outsourcer.
Mathematics 11 01191 g0a2

Appendix A.3. Inventory Diagram of 2nd Phase of Outsourcer 2
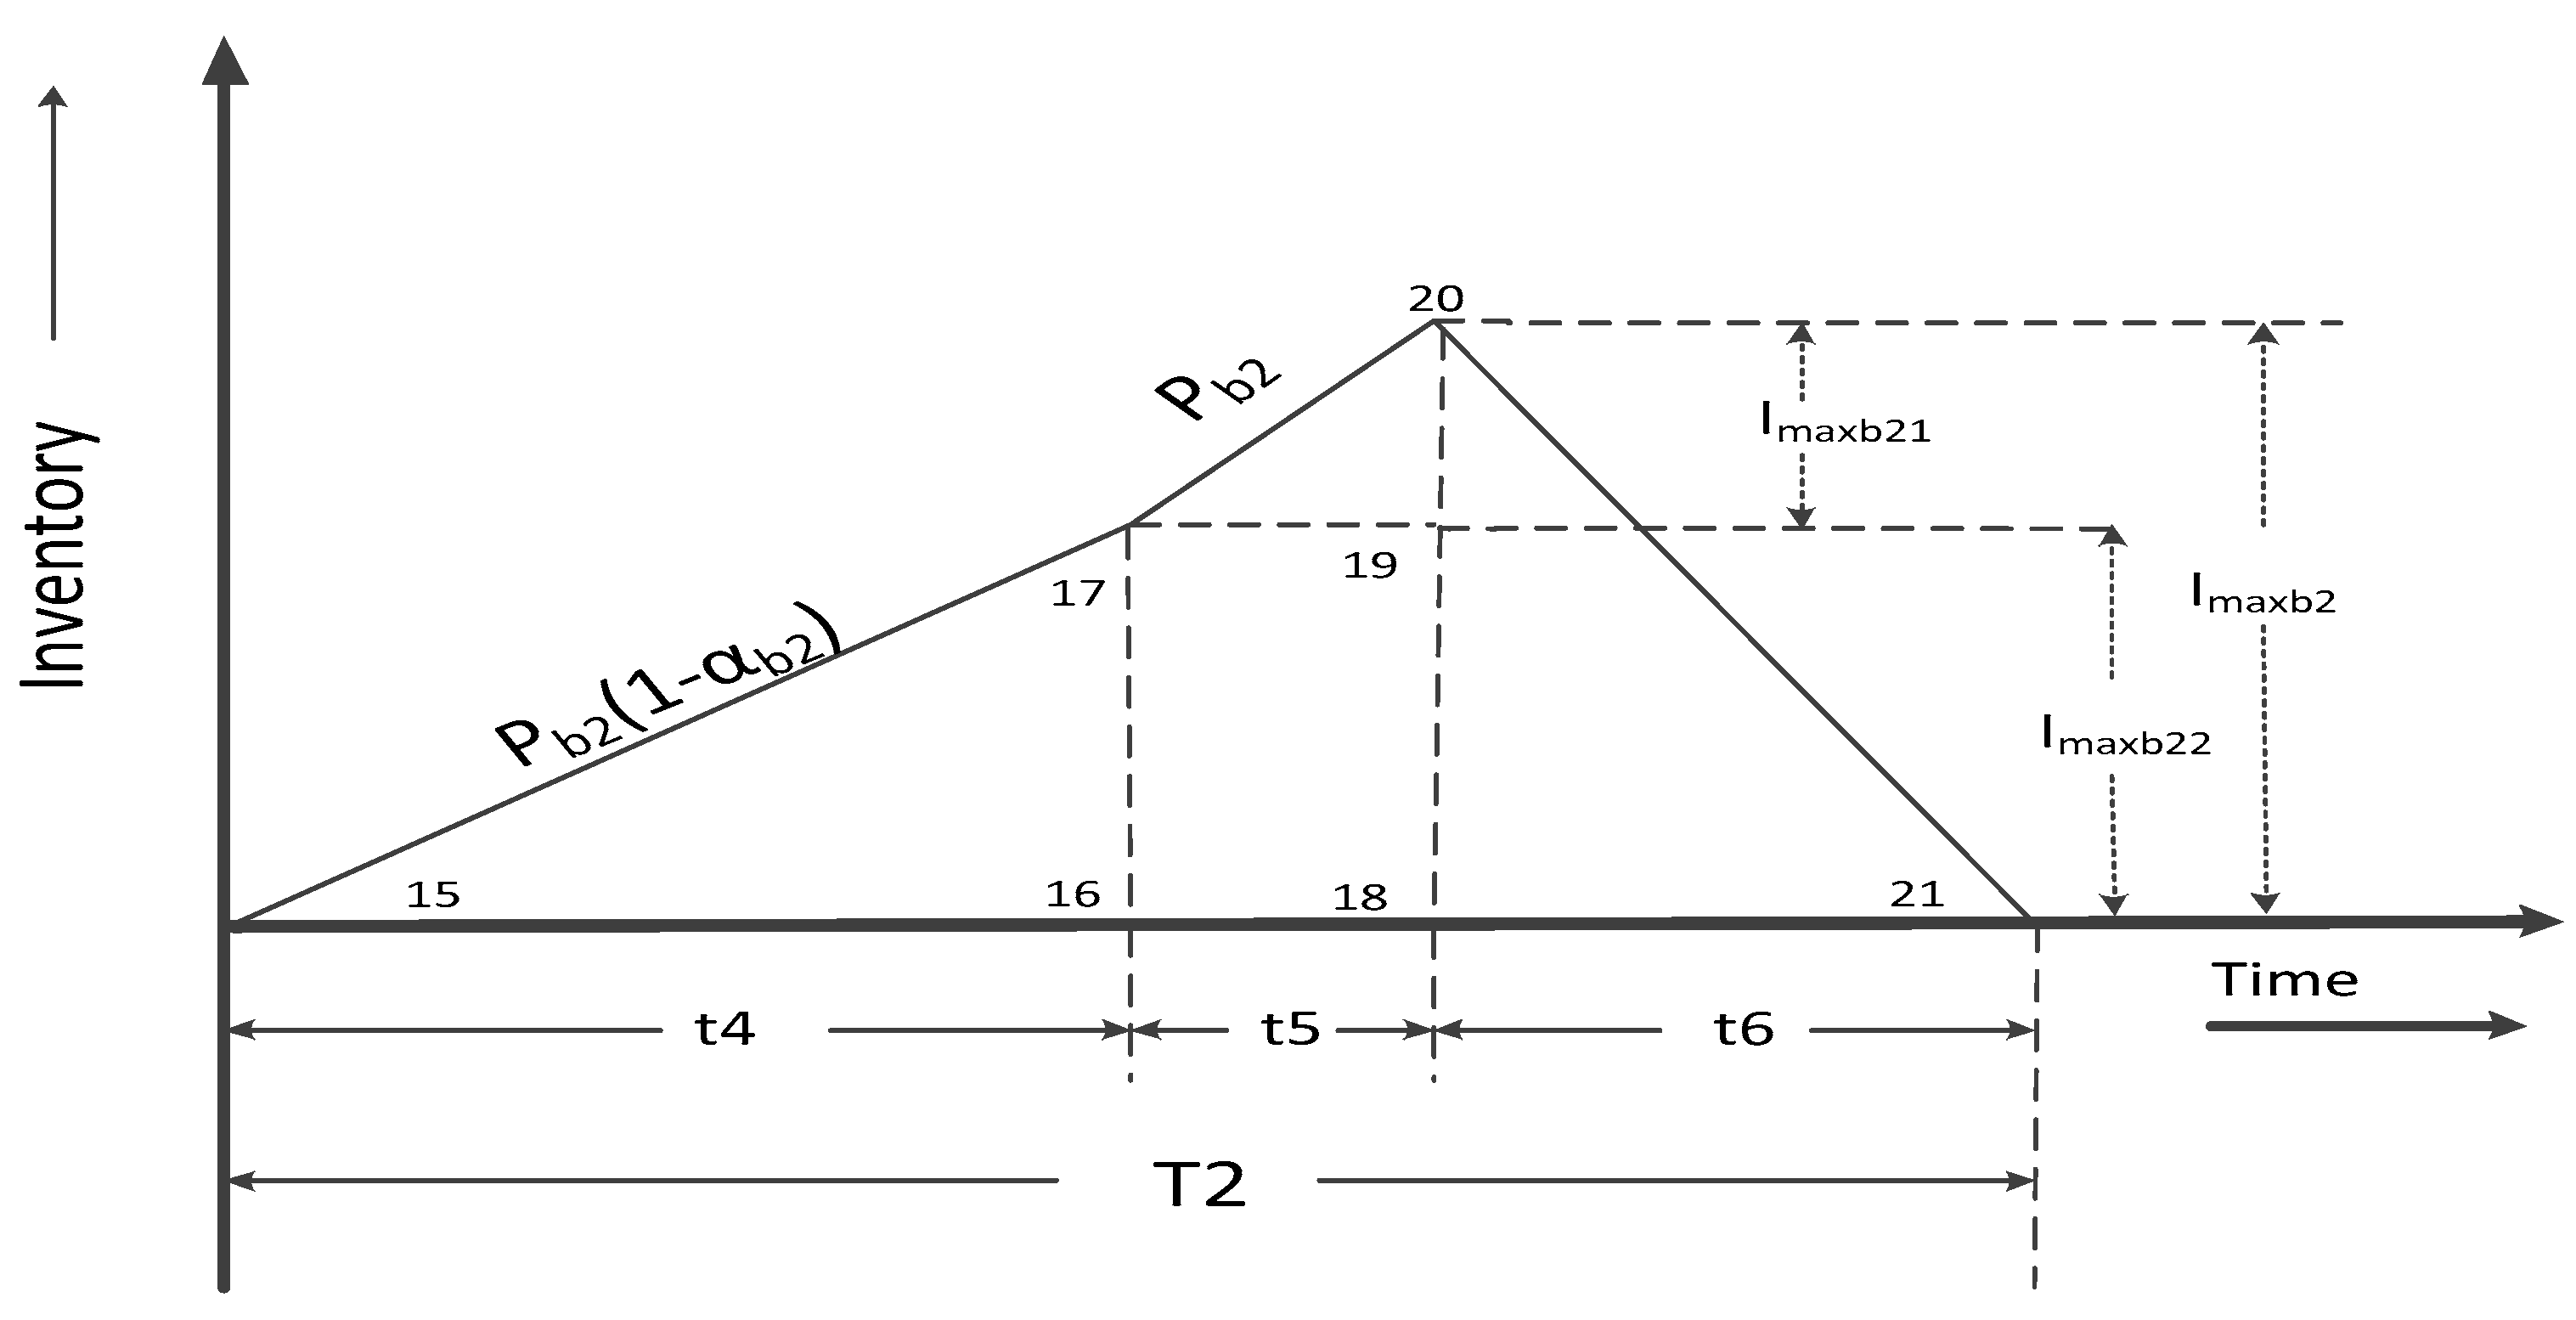
Figure A3. Inventory diagram of 2nd outsourcer.
Mathematics 11 01191 g0a3

Appendix A.4. Inventory Diagram of 2nd Phase of Outsourcer 3
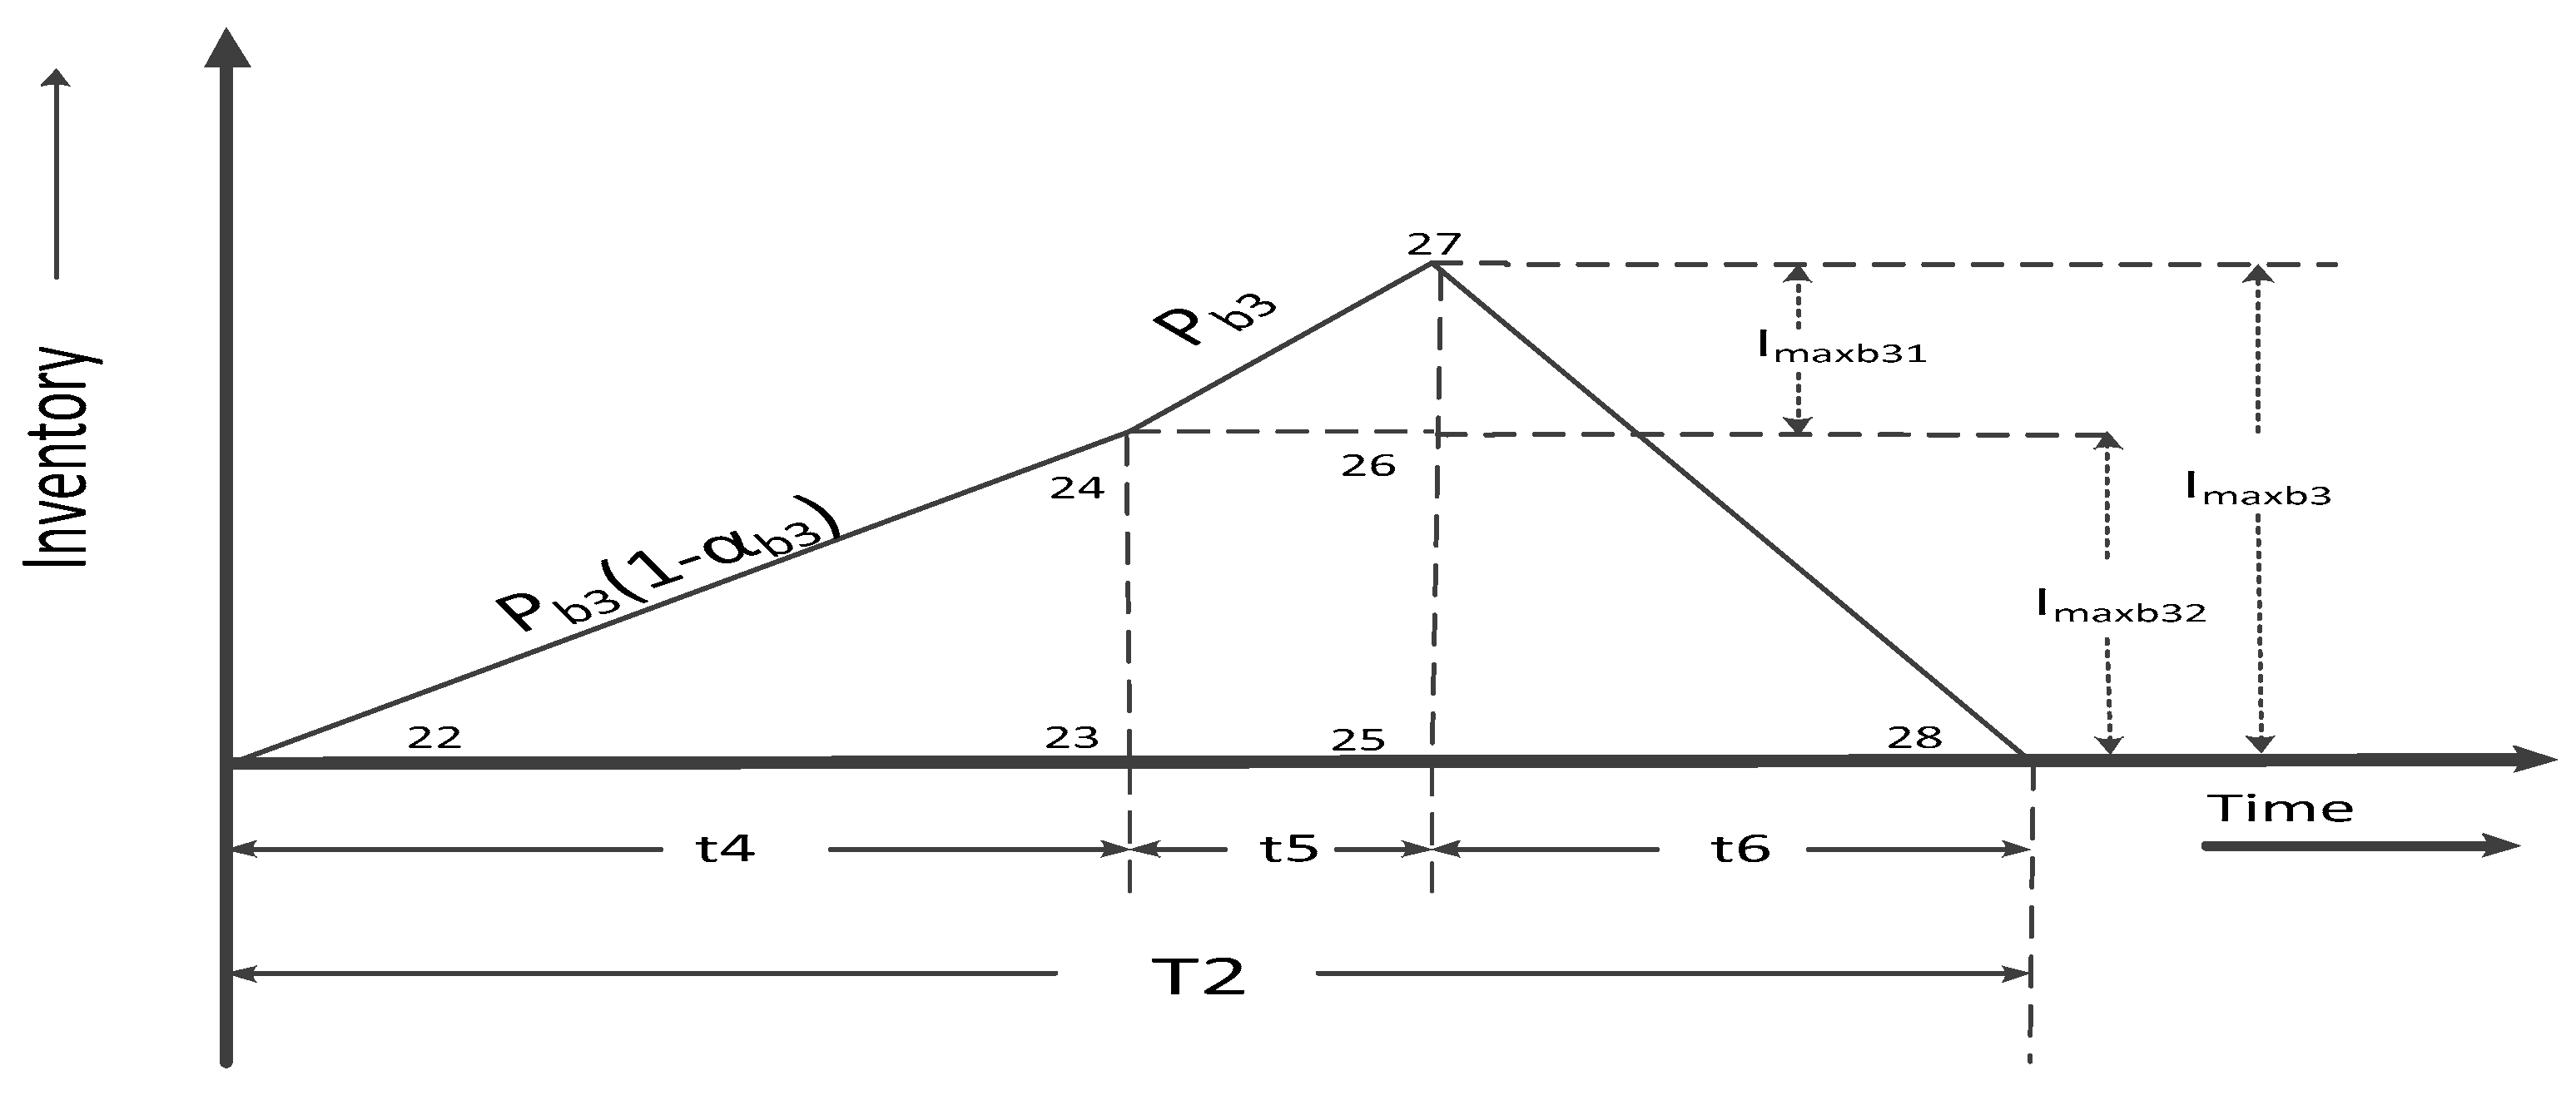
Figure A4. Inventory diagram of 3rd outsourcer.
Mathematics 11 01191 g0a4

Appendix A.5. Inventory Diagram of 2nd Phase of the ith Outsourcer

Figure A5. General form for inventory diagram of the ith outsourcer.
Mathematics 11 01191 g0a5

Appendix A.6. Inventory Diagram of the Last Phase of Manufacturer
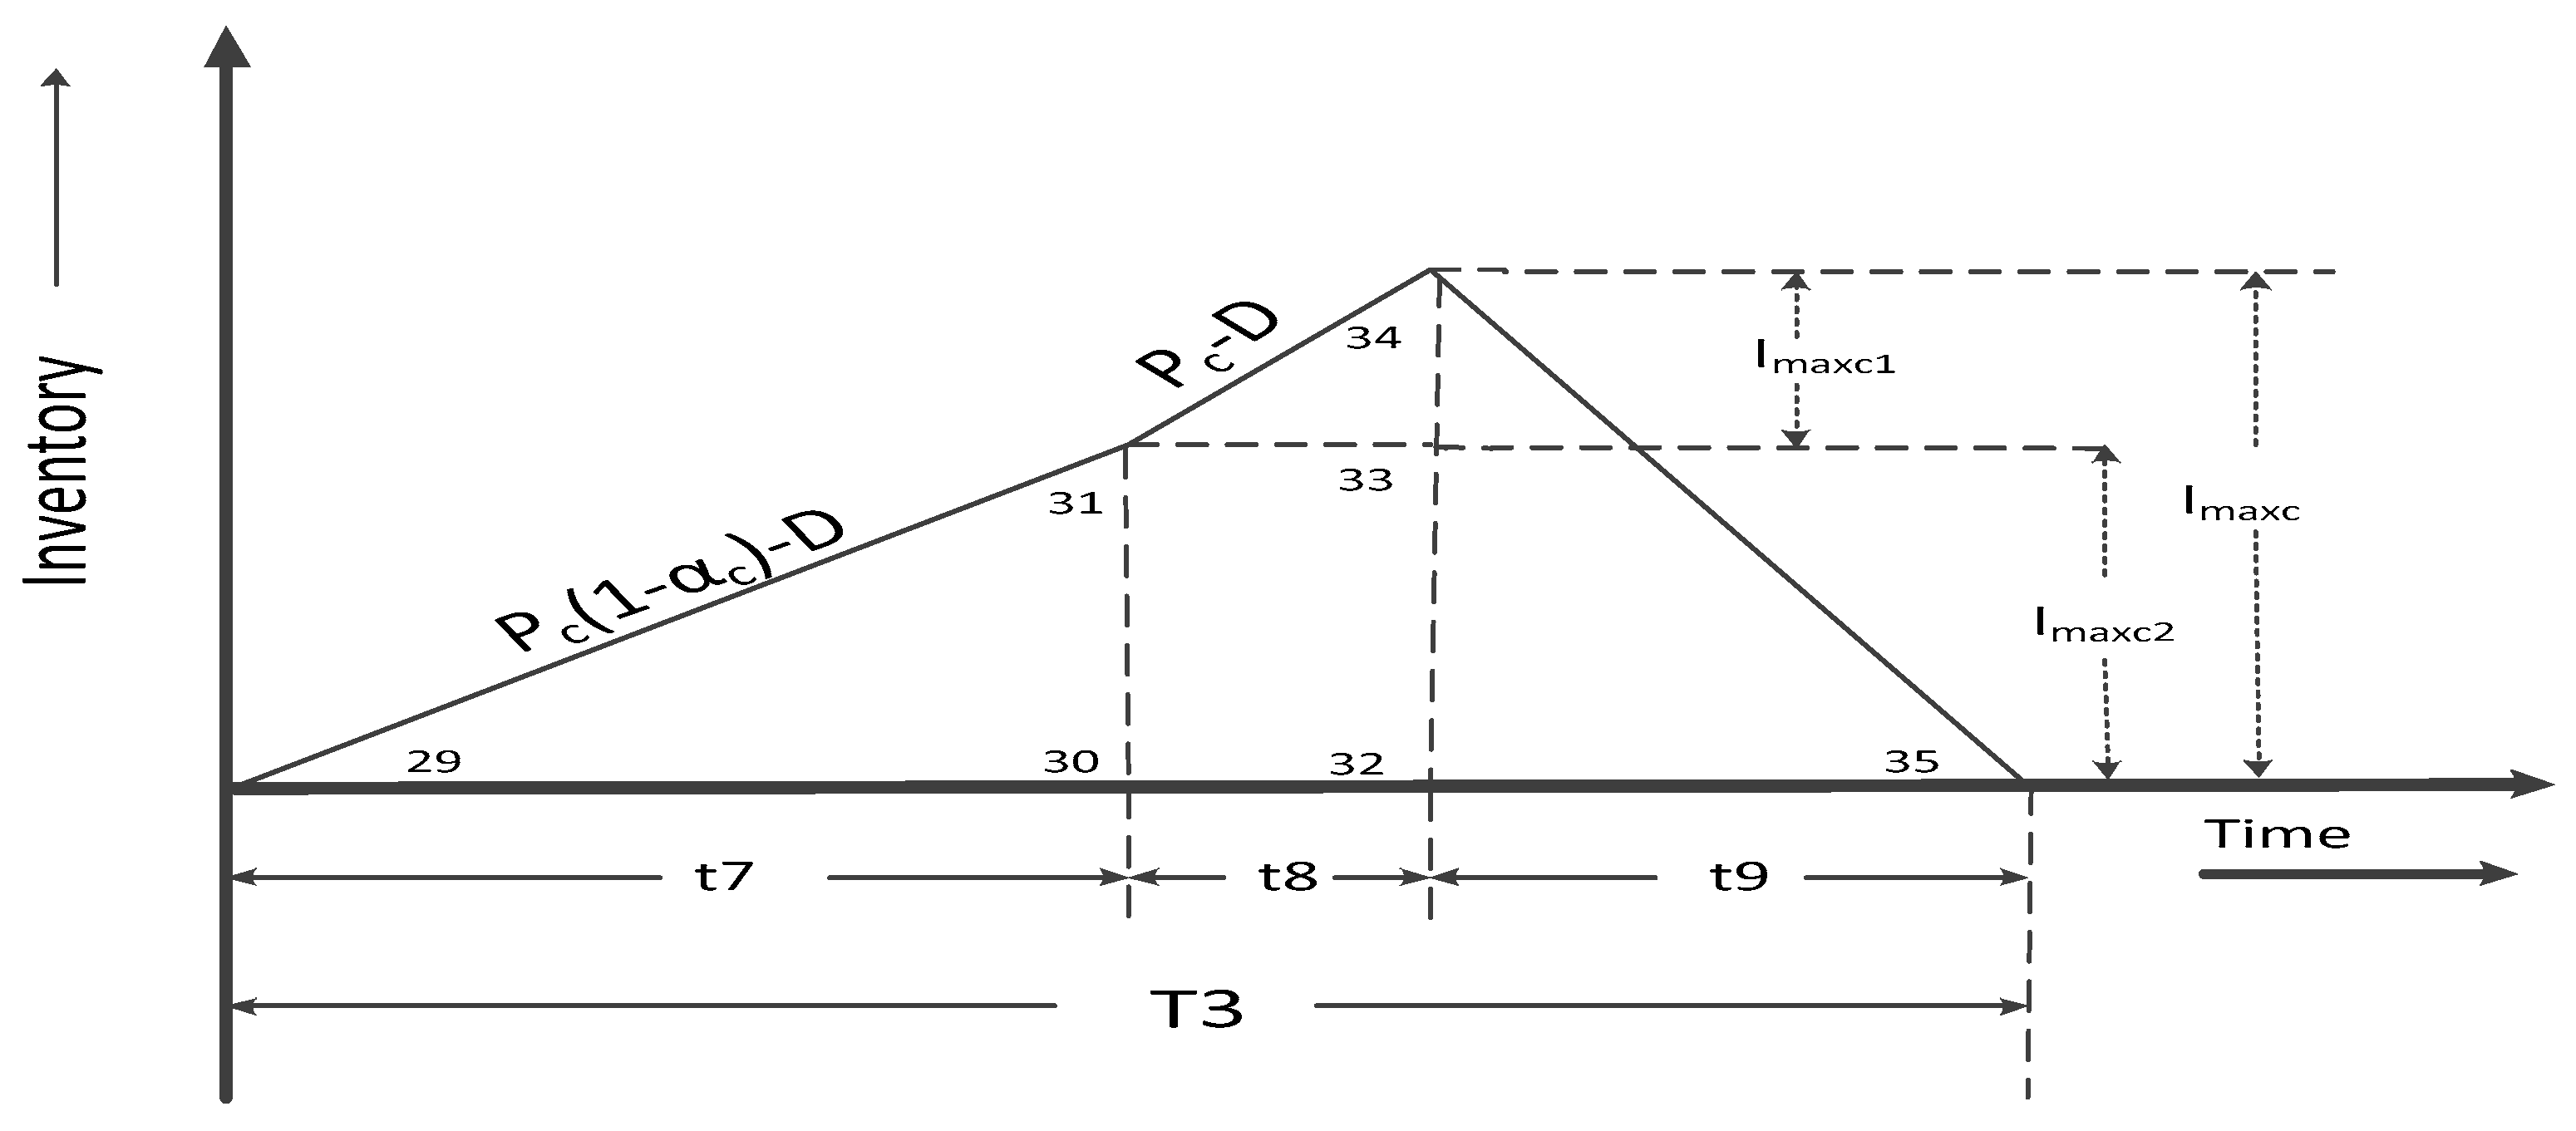
Figure A6. Inventory diagram of the last phase of the manufacturer.
Mathematics 11 01191 g0a6

Appendix B

Appendix B.1. Mathematical Modeling

The inventory diagram includes three phases. Phase A and phase C shows manufacturing phases while phase B shows the outsourcing phase. The total time is divided into three parts; T1, T2, and T3 that are further composed of t1, t2, t3, t4, t5, t6, t7, t8, and t9. D represents the customer demand rate. The detailed mathematical modeling of each phase is discussed below.
The total cycle time of production is T which is the combination of three T1, T2, and T3
T = T 1 + T 2 + T 3
while
T 1 = t 1 + t 2 + t 3 T 2 = t 4 + t 5 + t 6 T 3 = t 7 + t 8 + t 9
so
T = t 1 + t 2 + t 3 + t 4 + t 5 + t 6 + t 7 + t 8 + t 9
also,
t 1 = Q P a , t 2 = α a Q P a ,   t 3 = Q D [ 1 D P a α a D P a ] ,   t 4 = Q P b i ,   t 5 = α b i Q b i P b i ,   t 6 = Q b i D [ 1 D p b i α b i D P b i ] ,   t 7 = Q P c ,   t 8 = α c Q c P c   and   t 9 = Q D [ 1 D p c α c D P c ]

Appendix B.2. Phase A

From Figure 2 the total inventory of phase A is equal to the area under the curve which is
Total   inventory = Δ 123 + 2345 + Δ 356 + Δ 467   Now , I max a 2 = Q ( 1 α a ) I max a 1 = Q α a Area   of   Δ 123 = 1 2 I max a 1 × t 1 And   slope = tan Q = P a ( 1 α a ) tan Q   = p e r p e n d i c u l a r b a s e = > P a ( 1 α a ) = I max a 2 t 1
Area   of   Δ 123 = Q 2 ( 1 α a 2 P a )
Area   of   2345 = t 2 × I a 2
Area   of   2345 = α a Q P a × Q ( 1 α )
Area   of   2345 = Q 2 α a ( 1 α a ) P a
Area   of   Δ 356 = 1 2 t 2 × I a 1
Area   of   Δ 356 = 1 2 Q α a P a × Q α a   Area   of   Δ 467 = 1 2 t 3 × I a [ I a = I a 1 + I a 2 ]
Area   of   Δ 356 = Q 2 α a 2 2 P a
now
Area   of   Δ 467 = Q 2 2 D [ 1 D P a α a D P a ] 2 × D
Area   of   Δ 467 = Q 2 2 [ 1 D P a α a D P a ] 2
Now   total   inventory   of   phase   A = I a = Area   of   Δ 123 + 2345 + Δ 356 + Δ 467
I a = Q 2 ( 1 α a 2 P a ) + Q 2 α a ( 1 α a ) P a + Q 2 α a 2 2 P a + Q 2 2 [ 1 D P A α a D P a ] 2
I a = Q 2 { 1 α a 2 P a + α a ( 1 α a ) P a + α a 2 2 P a + 1 2 [ 1 D P a α a D P a ] 2 }

References

  1. Kroes, J.R.; Ghosh, S. Outsourcing congruence with competitive priorities: Impact on supply chain and firm performance. J. Oper. Manag. 2010, 28, 124–143. [Google Scholar] [CrossRef]
  2. Bernard, K. The effect of outsourcing on supply chain performance at cadbury kenya limited. Int. J. Logist. Procure. Manag. 2019, 1, 123–138. [Google Scholar]
  3. Jilani, P.A. Indirect Procurement Strategies for Supply Chain Sustainability. Ph.D. Thesis, Walden University, Minneapolis, MN, USA, 2018. [Google Scholar]
  4. Hila, C.M.; Dumitraşcu, O. Outsourcing Within a Supply Chain Management Framework. In Proceedings of the 8th International Management Conference “Management Challenges for Sustainable Development”, Bucharest, Romania, 6–7 November 2014; pp. 328–336. [Google Scholar]
  5. Kroes, J.R. Outsourcing of Supply Chain Processes: Evaluating the Impact of Congruence between Outsourcing Drivers and Competitive Priorities on Performance. Ph.D. Thesis, Georgia Institute of Technology, Atlanta, GA, USA, 2007. [Google Scholar]
  6. Fill, C.; Visser, E. The outsourcing dilemma: A composite approach to the make or buy decision. Manag. Decis. 2000, 38, 43–50. [Google Scholar] [CrossRef]
  7. Mazlan, R.M.R.; Ali, K.N. Relationship between Supply Chain Management and Outsourcing. Ph.D. Thesis, Heriot-Watt University, Edinburgh, UK, 2005. [Google Scholar]
  8. Sana, S.S. A production-inventory model of imperfect quality products in a three-layer supply chain. Decis. Support Syst. 2011, 50, 539–547. [Google Scholar] [CrossRef]
  9. Rad, M.A.; Khoshalhan, F.; Glock, C. Optimizing inventory and sales decisions in a two-stage supply chain with imperfect production and backorders. Comput. Ind. Eng. 2014, 74, 219–227. [Google Scholar] [CrossRef]
  10. Sarkar, S.; Giri, B.J. Logistics. Stochastic supply chain model with imperfect production and controllable defective rate. Int. J. Syst. Sci. 2018, 7, 133–146. [Google Scholar]
  11. Nabernegg, S.; Bednar-Friedl, B.; Wagner, F.; Schinko, T.; Cofala, J.; Clement, Y.M. The Deployment of Low Carbon Technologies in Energy Intensive Industries: A Macroeconomic Analysis for Europe, China and India. Energies 2017, 10, 360. [Google Scholar] [CrossRef] [Green Version]
  12. Bian, J.; Zhao, X. Tax or subsidy? An analysis of environmental policies in supply chains with retail competition. Eur. J. Oper. Res. 2020, 283, 901–914. [Google Scholar] [CrossRef]
  13. Deng, J.; Luo, X.; Hu, M. Implications of a Carbon Tax Mechanism in Remanufacturing Outsourcing on Carbon Neutrality. Int. J. Environ. Res. Public Health 2022, 19, 5520. [Google Scholar] [CrossRef]
  14. Lankford, W.M.; Parsa, F. Outsourcing: A primer. Manag. Decis. 1999, 37, 310–316. [Google Scholar] [CrossRef] [Green Version]
  15. Franceschini, F.; Galetto, M.; Pignatelli, A.; Varetto, M.J. Outsourcing: Guidelines for a structured approach. Benchmarking Int. J. 2003, 10, 246–260. [Google Scholar] [CrossRef] [Green Version]
  16. Quinn, J.B.; Hilmer, F.G.J. Strategic outsourcing. MIT Sloan Manag. Rev. 1994, 35, 43. [Google Scholar]
  17. Hilletofth, P.; Hilmola, O.P.J. Role of logistics outsourcing on supply chain strategy and management. Strateg. Outsourcing Int. J. 2010, 3, 46–61. [Google Scholar] [CrossRef]
  18. Chiu, Y.-S.P.; Jhan, J.-H.; Chiu, V.; Chou, C.-L. Incorporating outsourcing, stochastic failure, and scrap into batch fabrication planning. Alex. Eng. J. 2020, 59, 5273–5284. [Google Scholar] [CrossRef]
  19. Kumar, M.; Vrat, P.; Shankar, R. A fuzzy goal programming approach for vendor selection problem in a supply chain. Comput. Ind. Eng. 2004, 46, 69–85. [Google Scholar] [CrossRef]
  20. Karamaşa, Ç.; Demir, E.; Memiş, S.; Korucuk, S. Weighting the factors affecting logistics outsourcing, Infinite Study. Decis. Mak. Appl. Manag. Eng. 2020, 4, 19–32. [Google Scholar] [CrossRef]
  21. Amid, A.; Ghodsypour, S.; O’Brien, C. A weighted additive fuzzy multiobjective model for the supplier selection problem under price breaks in a supply chain. Int. J. Product. Econ. 2009, 121, 323–332. [Google Scholar] [CrossRef]
  22. Rezaei, J.; Davoodi, M. A deterministic, multi-item inventory model with supplier selection and imperfect quality. Appl. Math. Model. 2008, 32, 2106–2116. [Google Scholar] [CrossRef]
  23. Karpak, B.; Kumcu, E.; Kasuganti, R.R. Purchasing materials in the supply chain: Managing a multi-objective task. Eur. J. Purch. Supply Manag. 2001, 7, 209–216. [Google Scholar] [CrossRef]
  24. Ji, Y.; Li, H.; Zhang, H.J. Risk-averse two-stage stochastic minimum cost consensus models with asymmetric adjustment cost. Group Decis. Negot. 2022, 31, 261–291. [Google Scholar] [CrossRef]
  25. Qu, S.; Shu, L.; Yao, J.J.C. Optimal pricing and service level in supply chain considering misreport behavior and fairness concern. Comput. Ind. Eng. 2022, 174, 108759. [Google Scholar] [CrossRef]
  26. Stević, Ž.; Karamaşa, Ç.; Demir, E.; Korucuk, S.J. Assessing sustainable production under circular economy context using a novel rough-fuzzy MCDM model: A case of the forestry industry in the Eastern Black Sea region. J. Enterp. Inf. Manag. 2021; ahead of print. [Google Scholar]
  27. Verma, V.; Bisht, P.; Joshi, S. Sustainable Supply chain Systems of Food and Beverages SMEs in developing countries: Theoretical perspective. J. Decis. Anal. Intell. Comput. 2022, 2, 36–52. [Google Scholar] [CrossRef]
  28. Tao, Z.; Guiffrida, A.L. Carbon Emission Modeling in a Two Stage Supply Chain. Am. J. Manag. 2017, 17, 82–92. [Google Scholar]
  29. Su, L.; Xiao, B.; Suo, C.; Yang, Y.J. Models for operation management under carbon policies—A review. Chem. Eng. Trans. 2016, 51, 1159–1164. [Google Scholar]
  30. Ameknassi, L.; Aït-Kadi, D.; Rezg, N.J. Integration of logistics outsourcing decisions in a green supply chain design: A stochastic multi-objective multi-period multi-product programming model. Int. J. Prod. Econ. 2016, 182, 165–184. [Google Scholar] [CrossRef]
  31. Zhang, Y.M.; Chen, W.D.; Mi, Y. Third-party remanufacturing mode selection for competitive closed-loop supply chain based on evolutionary game theory. J. Clean. Prod. 2020, 263, 121305. [Google Scholar] [CrossRef]
  32. Yan, W.; Li, H.Y.; Chai, J.W.; Qian, Z.F.; Chen, H. Owning or Outsourcing? Strategic Choice on Take-Back Operations for Third-Party Remanufacturing. Sustainability 2018, 10, 151. [Google Scholar] [CrossRef] [Green Version]
  33. He, P.; Zhang, W.; Xu, X.; Bian, Y.J. Production lot-sizing and carbon emissions under cap-and-trade and carbon tax regulations. J. Clean. Prod. 2015, 103, 241–248. [Google Scholar] [CrossRef]
  34. Van Hezewijk, L.; Dellaert, N.; Van Woensel, T.; Gademann, N.J. Using the proximal policy optimisation algorithm for solving the stochastic capacitated lot sizing problem. Int. J. Prod. Res. 2022, 22, 1–24. [Google Scholar] [CrossRef]
  35. Osintsev, N.; Rakhmangulov, A.; Baginova, V. Evaluation of logistic flows in green supply chains based on the combined DEMATEL-ANP method. Facta Univ. Ser. Mech. Eng. 2021, 19, 473–498. [Google Scholar] [CrossRef]
  36. Long, T.B.; Young, W.J.J.o.C.P. An exploration of intervention options to enhance the management of supply chain greenhouse gas emissions in the UK. J. Clean. Prod. 2016, 112, 1834–1848. [Google Scholar] [CrossRef]
  37. Xu, Z.; Elomri, A.; Pokharel, S.; Mutlu, F.J.S. The Design of Green Supply Chains under Carbon Policies: A Literature Review of Quantitative Models. Sustainability 2019, 11, 3094. [Google Scholar] [CrossRef] [Green Version]
  38. Setak, M.; Sharifi, S.; Alimohammadian, A. Supplier selection and order allocation models in supply chain management: A review. World Appl. Sci. J. 2012, 18, 55–72. [Google Scholar]
  39. Zhang, M.; Chen, J.; Chang, S.-H. An adaptive simulation analysis of reliability model for the system of supply chain based on partial differential equations. Alex. Eng. J. 2020, 59, 2401–2407. [Google Scholar] [CrossRef]
  40. Tempelmeier, H. A simple heuristic for dynamic order sizing and supplier selection with time-varying data. Prod. Oper. Manag. 2002, 11, 499–515. [Google Scholar] [CrossRef]
  41. Feng, C.-X.J.; Wang, J.; Wang, J.-S. An optimization model for concurrent selection of tolerances and suppliers. Comput. Ind. Eng. 2001, 40, 15–33. [Google Scholar] [CrossRef]
  42. Liu, C. Risk Prediction of Digital Transformation of Manufacturing Supply Chain Based on Principal Component Analysis and Backpropagation Artificial Neural Network. Alex. Eng. J. 2022, 61, 775–784. [Google Scholar] [CrossRef]
  43. Wiseman, Y. Autonomous Vehicles. In Encyclopedia of Information Science and Technology, 5th ed.; IGI Global: Hershey, PA, USA, 2020; Volume 1, pp. 1–11. Available online: https://u.cs.biu.ac.il/~wiseman/Autonomous-Vehicles-Encyclopedia.pdf (accessed on 19 October 2022).
  44. Figliozzi, M.A. Carbon emissions reductions in last mile and grocery deliveries utilizing air and ground autonomous vehicles. Transp. Res. Part D Transp. Environ. 2020, 85, 102443. [Google Scholar] [CrossRef]
  45. Liu, Z.; Wang, Y.; Feng, J.J.K. Vehicle-type strategies for manufacturer’s car sharing. Kybernetes, 2022; ahead-of-print. [Google Scholar] [CrossRef]
  46. Chen, Y.J. Research on collaborative innovation of key common technologies in new energy vehicle industry based on digital twin technology. Energy Rep. 2022, 8, 15399–15407. [Google Scholar] [CrossRef]
  47. Wang, L.; Zhao, H.; Liu, X.; Zhang, Z.; Xia, X.-H.; Evans, S.J. Optimal remanufacturing service resource allocation for generalized growth of retired mechanical products: Maximizing matching efficiency. IEEE Access 2021, 9, 89655–89674. [Google Scholar] [CrossRef]
  48. Guo, B.; Wang, Y.; Zhou, H.; Hu, F. Can environmental tax reform promote carbon abatement of resource-based cities? Evidence from a quasi-natural experiment in China. Environ. Sci. Pollut. Res. 2022, 1–13. [Google Scholar] [CrossRef]
  49. Chen, J.; Sun, C.; Wang, Y.; Liu, J.; Zhou, P.J. Carbon emission reduction policy with privatization in an oligopoly model. Environ. Sci. Pollut. Res. 2023, 1–22. [Google Scholar] [CrossRef]
  50. Zhang, S.; Zhou, Z.; Luo, R.; Zhao, R.; Xiao, Y.; Xu, Y.J. A low-carbon, fixed-tour scheduling problem with time windows in a time-dependent traffic environment. Int. J. Prod. Res. 2022, 1–20. [Google Scholar] [CrossRef]
  51. Yang, X.; Yang, X.; Teo, K.L. Huard type second-order converse duality for nonlinear programming. Appl. Math. Lett. 2005, 18, 205–208. [Google Scholar] [CrossRef] [Green Version]
  52. Peng, Y.; Ablanedo-Rosas, J.H.; Fu, P. A multiperiod supply chain network design considering carbon emissions. Math. Probl. Eng. 2016, 2016, 1581893. [Google Scholar] [CrossRef] [Green Version]
  53. Bao, X.-Y.; Zhang, L. Green procurement relationships development under carbon emissions regulations: A Bi-level programming approach. Int. J. Environ. Res. Public Health 2018, 15, 2183. [Google Scholar] [CrossRef] [Green Version]
  54. Jin, M.; Granda-Marulanda, N.A.; Down, I. The impact of carbon policies on supply chain design and logistics of a major retailer. J. Clean. Prod. 2014, 85, 453–461. [Google Scholar] [CrossRef]
  55. Coman, A.; Ronen, B. Production outsourcing: A linear programming model for the theory-of-constraints. Int. J. Prod. Res. 2000, 38, 1631–1639. [Google Scholar] [CrossRef]
  56. Qureshi, M.; Kumar, D.; Kumar, P. Modeling the logistics outsourcing relationship variables to enhance shippers’ productivity and competitiveness in logistical supply chain. Int. J. Product. Perform. Manag. 2007, 56, 689–714. [Google Scholar] [CrossRef]
  57. Li, J.; Su, Q.; Ma, L. Production and transportation outsourcing decisions in the supply chain under single and multiple carbon policies. J. Clean. Prod. 2017, 141, 1109–1122. [Google Scholar] [CrossRef]
  58. Benjaafar, S.; Li, Y.; Daskin, M.; Qi, L.; Kennedy, S. Low Carbon Logistics through Supply Chain Design and Coordination; United States, Department of Transportation, Research and Innovative Technology: Washington, DC, USA, 2010.
  59. Mashud, A.H.M.; Uddin, M.S.; Sana, S.S. A two-level trade-credit approach to an integrated price-sensitive inventory model with shortages. Int. J. Appl. Comput. Math. 2019, 5, 121. [Google Scholar] [CrossRef]
  60. Birgin, E.G.; Haeser, G.; Ramos, A. Augmented Lagrangians with constrained subproblems and convergence to second-order stationary points. Comput. Optim. Appl. 2018, 69, 51–75. [Google Scholar] [CrossRef]
  61. Mostafa, N.; Khajavi, M. Optimization of welding parameters for weld penetration in FCAW. J. Achiev. Mater. Manuf. Eng. 2006, 16, 132–138. [Google Scholar]
  62. Schittkowski, K. NLPQL: A FORTRAN subroutine solving constrained nonlinear programming problems. Ann. Oper. Res. 1986, 5, 485–500. [Google Scholar] [CrossRef]
  63. Sarkar, B.; Cárdenas-Barrón, L.E.; Sarkar, M.; Singgih, M.L. An economic production quantity model with random defective rate, rework process and backorders for a single stage production system. J. Manuf. Syst. 2014, 33, 423–435. [Google Scholar] [CrossRef]
  64. Sarkar, B. Supply Chain Coordination with Variable Backorder, Inspections, and Discount Policy for Fixed Lifetime Products. Math. Probl. Eng. 2016, 2016, 14. [Google Scholar] [CrossRef] [Green Version]
  65. Bazan, E.; Jaber, M.Y.; Zanoni, S.J. Carbon emissions and energy effects on a two-level manufacturer-retailer closed-loop supply chain model with remanufacturing subject to different coordination mechanisms. Int. J. Prod. Econ. 2017, 183, 394–408. [Google Scholar] [CrossRef]
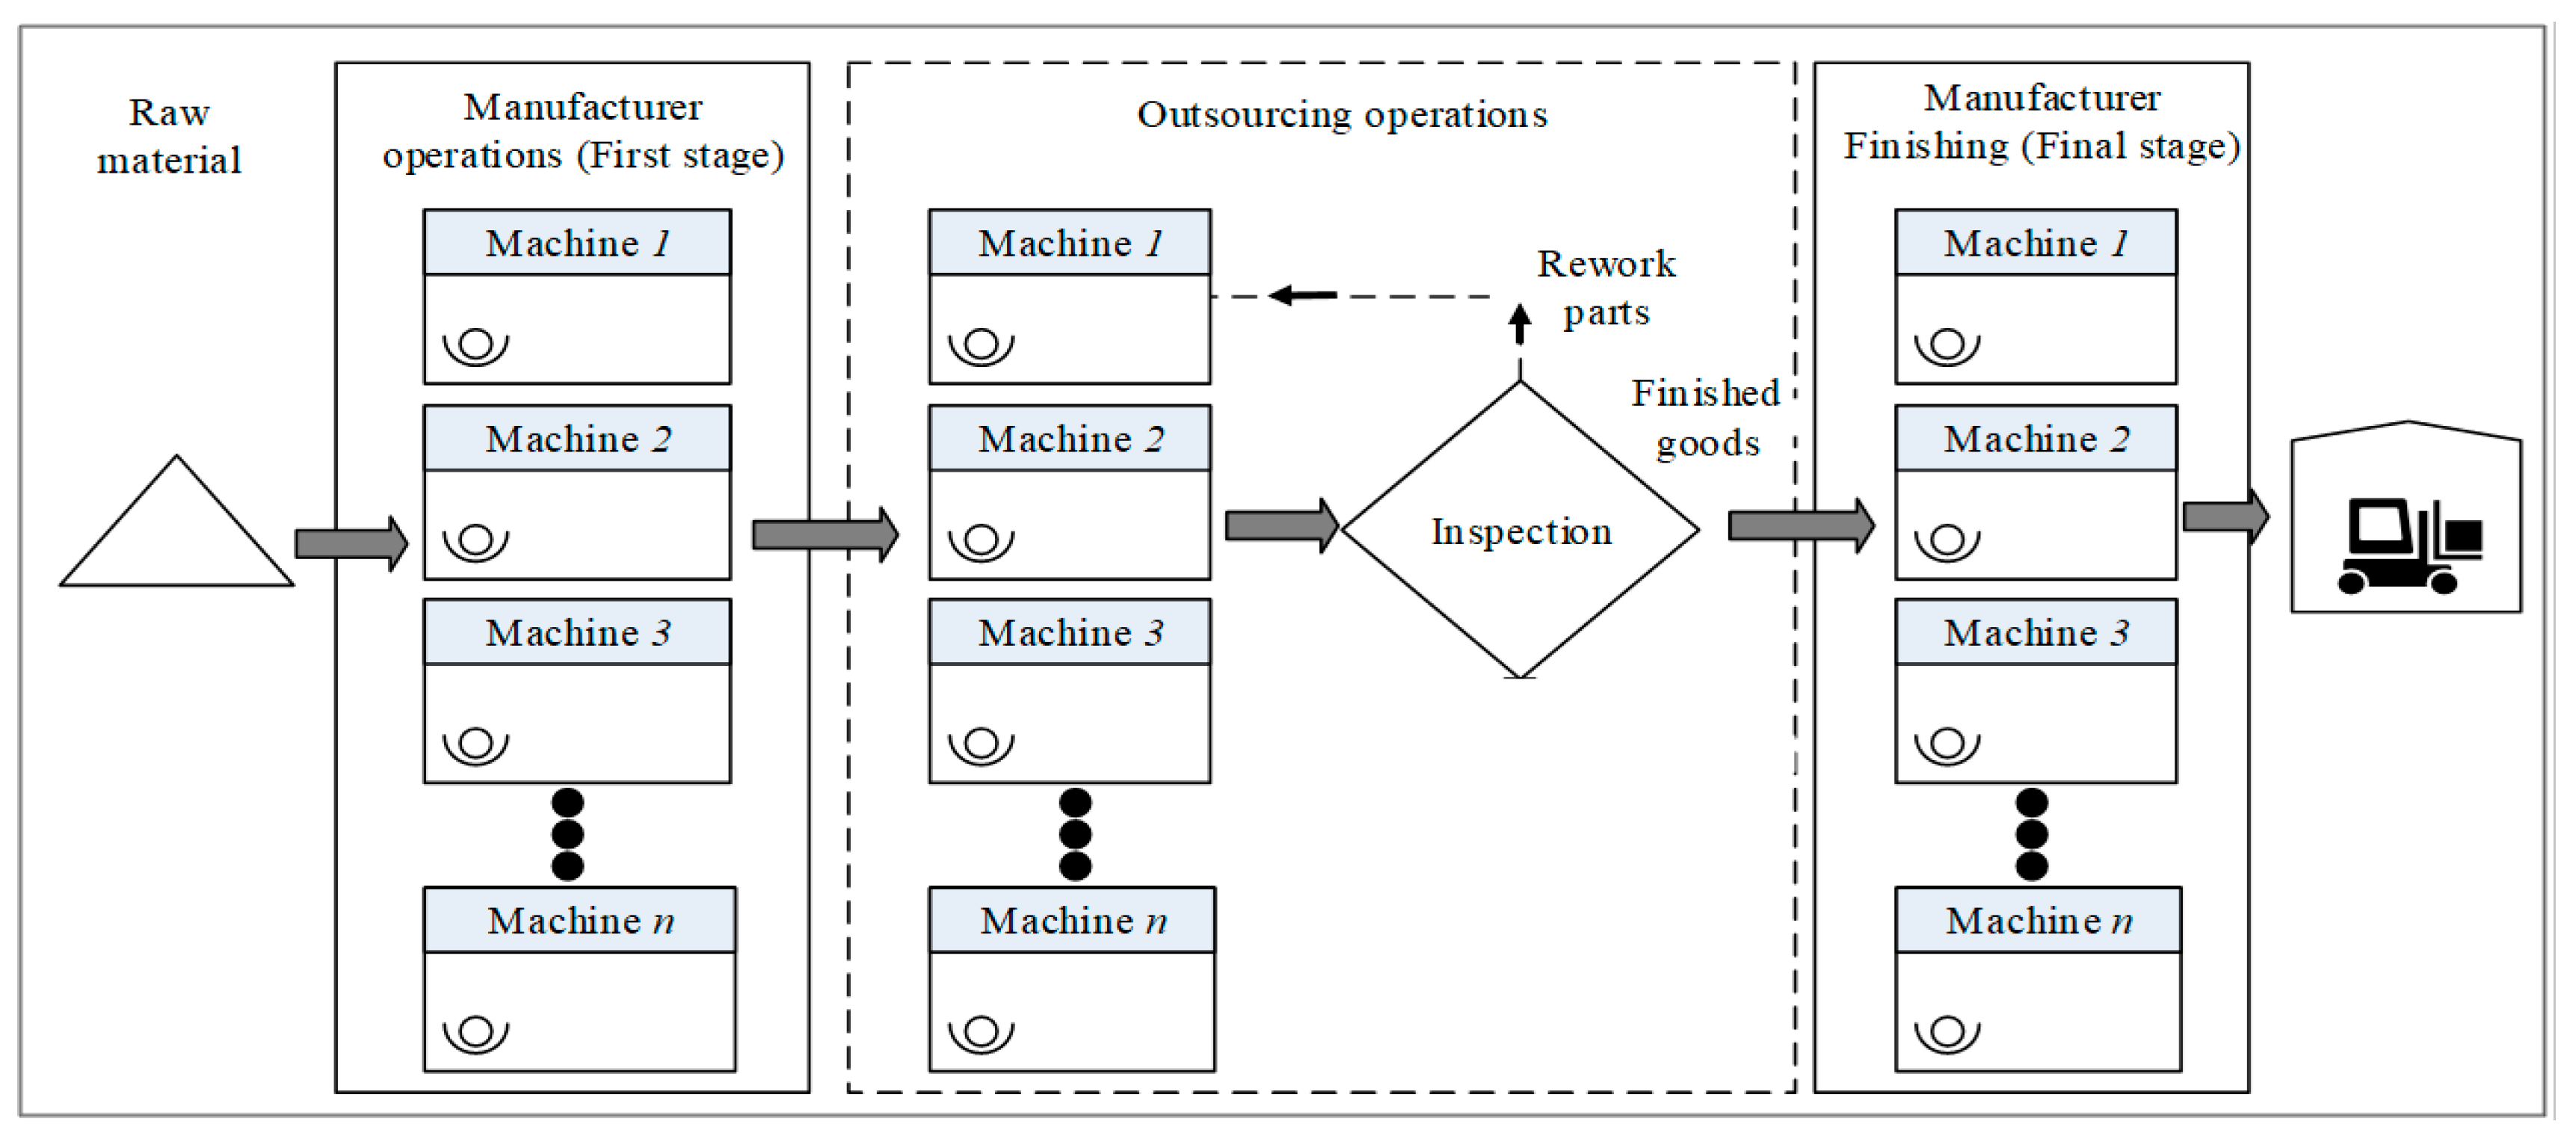
Figure 1. Production flow diagram process between manufacturer and outsourcers.
Mathematics 11 01191 g001
Figure 2. Graphical representation of sensitivity analysis: (a) manufacturer (b) outsourcer.
Mathematics 11 01191 g002
Table 1. Author contribution table.
AuthorsOutsourcingSupply ChainOptimizationMethodologyImperfectionCarbon Policy
ProcessProductLogisticCentralizedDecentralizeNLPLP and IPSQPAnalyticalCarbon TaxCarbon CapCarbon Trad
Yang et al. (2005) [51]
YangPeng (2016) [52]
Xiao-Ying Bao (2018) [53]
Mingzhou Jin (2014) [54]
Lhoussaine ameknassi
(2016) [30]
Alex coman (2000) [55]
M.N Qureshi, Dinesh Kumar (2007) [56]
Jian Li, Qin Su (2017) [57]
Saif benjaafar, Mark daskin (2010) [58]
Abolfazl Gharaei (2019) [59]
Yuwan Shyi Peter Chiu et al. (2020) [60]
Proposed Work
Table 2. Notations used in this study.
NotationDescription
MIndex for manufacturer
IIndex for outsourcers
JIndex for item
TCjTotal cost of the supply chain
TCmjTotal cost of manufacturer
TCoijTotal cost of ith outsourcer
HCmjHolding cost of manufacturer
HCoijHolding cost of outsourcer i
HmjHolding cost per unit item of manufacturer
HoijHolding cost per unit item of ith outsourcer
SCmjSetup cost of manufacturer
SCoijSetup cost of outsourcer i
SmjSetup cost per unit item of manufacturer
SoijSetup cost per unit item of ith outsourcer
PCmjProduction cost of manufacturer
PCoijProduction cost of outsourcer i
MajProduction cost per unit item of Phase A for manufacturer
McjProduction cost per unit item of Phase C for manufacturer
MoiProduction cost per unit item of ith outsourcer
DjConstant rate of demand
PajProduction rate of phase A
PcjProduction rate of phase C
PbijProduction rate of phase B for ith outsourcer
CEmjCarbon emission cost for the manufacturer
CEoijCarbon emission cost for outsourcer i
fmjCarbon emission cost per ton CO2 emission for manufacturer
emjCarbon emission per unit item production for the manufacturer
fbijCarbon emission cost per ton CO2 emission for outsourcer i
ebijCarbon emission per unit item production for outsourcer i
ftjCarbon emission cost per ton CO2 emission in transportation
etmjCarbon emission per unit item transportation of manufacturer
etoijCarbon emission per unit item transportation of oustourcer i
αjRate of rework of phase A for the manufacturer
αcjRate of rework of phase C for manufacturer
αbijRate of rework for the ith outsourcer
MRMarginal cost of outsourcers
IajInspection cost per unit item at phase A
IcjInspection cost per unit item at phase C
IbijInspection cost per unit item at phase B for ith outsourcer
FmjFixed transportation cost of manufacturer
FoijFixed transportaiotn cost of outsourcer i
VmjVariable transportation cost of manufacturer
VoijVariable transportaion cost of outsourcer i
Table 3. Manufacturing data for Phase A and Phase C (automobile spare part manufacturing industry).
ManufacturerDemandProduction RateManufacturing
Cost
Holding CostSetup CostInspection CostCarbon TaxCO2 Emission/ItemDefectivesTransportation Cost
Phase A30060012505010230.80.05Fixed = 03
Variable = 15
CO2 Cost = 6
Phase C3004008509230.02
Table 4. Outsourcing data (automobile spare part manufacturing industry).
Phase BOutsourcersProduction RateManufacturing CostHolding CostSetup CostRework CostInspection CostCarbon Emission CostDefectivesCO2 Emission/ItemTransporation Cost
14506564569.5230.040.18Fixed = 03
Variable = 15
CO2 Cost = 6
255075050710230.040.2
358084755810.5230.040.22
Table 5. Manufacturing data for phase A and phase C.
ManufacturerDemandProduction RateManufacturing
Cost
Holding CostSetup CostInspection CostCarbon Emission CostCO2 Emission/kgDefectivesTransportation Cost
Phase A2,160,0003,854,400305081.6230.80.05Fixed = 03
Variable = 15
CO2 Cos t = 6
Phase C2,160,0003,854,40030501230.02
Table 6. Outsourcing data.
Phase BOutsourcersProduction RateManufacturing CostHolding CostSetup CostRework CostInspection CostCarbon Emission CostDefectivesCO2 Emission/ItemTransportation Cost
14506801561.2230.040.18Fixed = 03
Variable = 15
CO2 Cost = 6
25507501071.2230.040.2
3580840581.2230.040.22
Table 7. Optimal results, with respect to production and outsourcing quantity, for two cases (where 1USD = 3.75 SAR).
CaseTotal Cost (TC)Manufacturer Optimal Quantity (Q)1st Outsourcer Optimal Quantity (Qb1)2nd Outsourcer Optimal Quantity (Qb2)3rd Outsourcer Optimal Quantity (Qb3)
Case 1USD 93,362.8$87.6 parts28.1 parts29.4 parts30.3 parts
Case 2SAR 350,233.461606.9 kg469.9 kg526.5 kg610.6 kg
Table 8. Sensitivity analysis of manufacturer parameters.
Parameters% Change in ValuesDecision Variables% Change in the Total Cost
QQb1Qb2Qb3
Sm−5050.415.516.817.9−0.3
−255115.71718.1−0.15
2552.11617.418.60.15
5052.716.217.618.80.3
Hm−5060.418.420.221.7−2
−2555.51718.619.8−0.9
2548.414.916.217.20.9
5046.214.315.416.41.6
MR−5043.313.114.515.3−29.2
−2548.114.916.117.1−14.5
2554.116.718.117.314.5
5056.217.218.820.129
Ma−5051.615.917.218.4−4
−2551.615.917.218.4−2
2551.615.917.218.42
5051.615.917.218.43.9
Mc−5051.615.917.218.4−2.3
−2551.615.917.218.41.3
2551.615.917.218.41.3
5051.615.917.218.42.6
Ia−5051.615.917.218.4−3.2
−2551.615.917.218.4−1.6
2551.615.917.218.41.6
5051.615.917.218.43.2
Ic−5051.615.917.218.4−2.9
−2551.615.917.218.4−2.1
2551.615.917.218.41.4
5051.615.917.218.42.9
Table 9. Sensitivity analysis of outsourcers’ parameters.
Parameters% Change in ValuesDecision Variables% Change in the Total Cost
QQb1Qb2Qb3
Sb1−5047.311.3617.418.5−1.2
−2549.613.817.318.4−0.5
2553.317.717.218.30.4
5054.819.417.118.30.9
hb1−505418.417.218.3−0.5
−2552.61717.218.3−0.2
2550.714.917.318.40.2
5049.915.915.518.40.5
Mb1−5051.615.917.218.4−2.3
−2551.615.917.218.4−1.1
2551.615.917.218.41.1
5051.615.917.218.42.3
Ib1−5051.615.917.218.4−3.5
−2551.615.917.218.4−1.5
2551.615.917.218.41.5
5051.615.917.218.43.1
eb1−5051.615.917.218.4−1.5
−2551.615.917.218.4−0.8
2551.615.917.218.41.0
5051.615.917.218.41.5
Disclaimer/Publisher’s Note: The statements, opinions and data contained in all publications are solely those of the individual author(s) and contributor(s) and not of MDPI and/or the editor(s). MDPI and/or the editor(s) disclaim responsibility for any injury to people or property resulting from any ideas, methods, instructions or products referred to in the content.