Article

An Intelligent Edge-as-a-Service Framework to Combat COVID-19 Using Deep Learning Techniques

by
Mohammad Mehedi Hassan
1,*,
Mabrook S. AlRakhami
1,
Amerah A. Alabrah
1 and
Salman A. AlQahtani
2
1
Information Systems Department, College of Computer and Information Sciences, King Saud University, Riyadh 11543, Saudi Arabia
2
Computer Engineering Department, College of Computer and Information Sciences, King Saud University, Riyadh 11543, Saudi Arabia
*
Author to whom correspondence should be addressed.
Mathematics 2023, 11(5), 1216; https://doi.org/10.3390/math11051216
Submission received: 19 December 2022 / Revised: 24 February 2023 / Accepted: 28 February 2023 / Published: 1 March 2023
(This article belongs to the Special Issue Application of Mathematical Methods in Artificial Intelligence)

Abstract

:
This study proposes and develops a secured edge-assisted deep learning (DL)-based automatic COVID-19 detection framework that utilizes the cloud and edge computing assistance as a service with a 5G network and blockchain technologies. The development of artificial intelligence methods through services at the edge plays a significant role in serving many applications in different domains. Recently, some DL approaches have been proposed to successfully detect COVID-19 by analyzing chest X-ray (CXR) images in the cloud and edge computing environments. However, the existing DL methods leverage only local and small training datasets. To overcome these limitations, we employed the edges to perform three tasks. The first task was to collect data from different hospitals and send them to a global cloud to train a DL model on massive datasets. The second task was to integrate all the trained models on the cloud to detect COVID-19 cases automatically. The third task was to retrain the trained model on specific COVID-19 data locally at hospitals to improve and generalize the trained model. A feature-level fusion and reduction were adopted for model performance enhancement. Experimental results on a public CXR dataset demonstrated an improvement against recent related work, achieving the quality-of-service requirements.

1. Introduction

The COVID-19 pandemic has resulted in over 1.1 million deaths in the US alone as of January 2023 [1]. While lockdown measures have been put in place to control the spread of COVID-19, early diagnoses and prognoses are still needed to reduce casualties [2]. Modern technologies such as cloud/edge computing, 5G, artificial intelligence (AI), and blockchain can play a crucial role in enhancing COVID-19 diagnoses and keeping patients’ data safe. Integrating these technologies into healthcare facilities can lead to a secure and efficient health data analysis and diagnosis system [3,4].
The utilization of 5G allows healthcare professionals to collect and access patient data remotely with enhanced efficiency [5,6]. AI technology, such as deep learning (DL), enables the extraction of higher-level features from raw input, such as CT or chest X-ray (CXR) scan images, through a training dataset available at edge devices [7]. The training process of DL can be distributed by combining the power of 5G with the unique DL architecture at the edges. Finally, blockchain technology allows for the safe storage of information and data from malicious or accidental theft, loss, or modification. Therefore, a combination of 5G, DL, and blockchain can provide a secure and efficient health data analysis and diagnosis system.
Many researchers have proposed and developed automatic COVID-19 identification using CT or CXR scan images, in contrast to the polymerase chain reaction (PCR) test, which requires a laboratory with a PCR machine and analyzes the sample at a micro-array level. Various studies have proposed DL for COVID-19 case identification, including CNN [8], ResNet-50 [9], ImageNet [10], and transfer learning [11], with varying degrees of success. Recent works have focused on combining 5G, edge computing, and DL to monitor and combat COVID-19 [12,13,14,15,16,17,18,19,20]. For instance, Hossain et al. [12] presented a 5G framework that utilizes the 5G network’s CXR or CT scan images to detect COVID-19. Rahman et al. [13] presented Signature–Home, an automated IoT-based algorithm that cost-effectively monitors and enforces home quarantine. Rahman et al. [14] proposed a new B5G network architecture for COVID-19 diagnosis, leveraging high-bandwidth features and low-latency 5G networks.
Additionally, an enhanced distributed DL paradigm was proposed, in which each edge node uses and trains the models through its local DL datasets. Roy et al. [15] introduced an IoT-based framework for monitoring and tracing the contact and infection of COVID-19 using device-to-device (D2D) communication links over 5G/4G wireless. Ranaweera et al. [16] presented a mobile edge computing (MEC)-based edge computing approach for treating COVID-19 patients within a medical facility. Although these studies have proposed recent technologies such as 5G networks, IoT, and DL, most have focused on optimizing DL performance while overlooking many equally relevant issues related to a large number of patients, their geographical distribution, and the security of their data.
This paper proposes a secure framework that utilizes cloud and edge computing as a service with a 5G network, DL, and blockchain technology. The 5G network facilitates fast data transmission between edges and the cloud, while DL is locally deployed at each edge to detect COVID-19 cases using CXR images. Blockchain is used to secure the collected data at each edge. The overall framework follows the concept of edge computing as a service.
In summary, this research investigates the core challenge of using edge-based DL as a service due to a lack of big data as a training set for analyzing infectious diseases. We present solutions demonstrating the feasibility of building an efficient and reliable 5G network-based COVID-19 detection application powered by collecting massive CXR images at distributed locations and deploying local deep learning models at edges and cloud computing environments. Thus, a major contribution of this research is exploiting the service of edge DL assistance, 5G network, blockchain, and cloud computing technologies, as well as a deep feature-level fusion approach to detect and control the impact of the COVID-19 pandemic. The following are the contributions of this study to the development of an intelligent edge-as-a-service framework to detect COVID-19 cases at different locations:
  • First, we propose a secured edge DL-assisted framework that benefits from the power of cloud computing and the service assistance of the edge and 5G network, in addition to the security advantage of blockchains to collect and detect COVID-19 cases.
  • Second, we propose a fusion-based DL approach to improve the accuracy of COVID-19 diagnosis and detection.
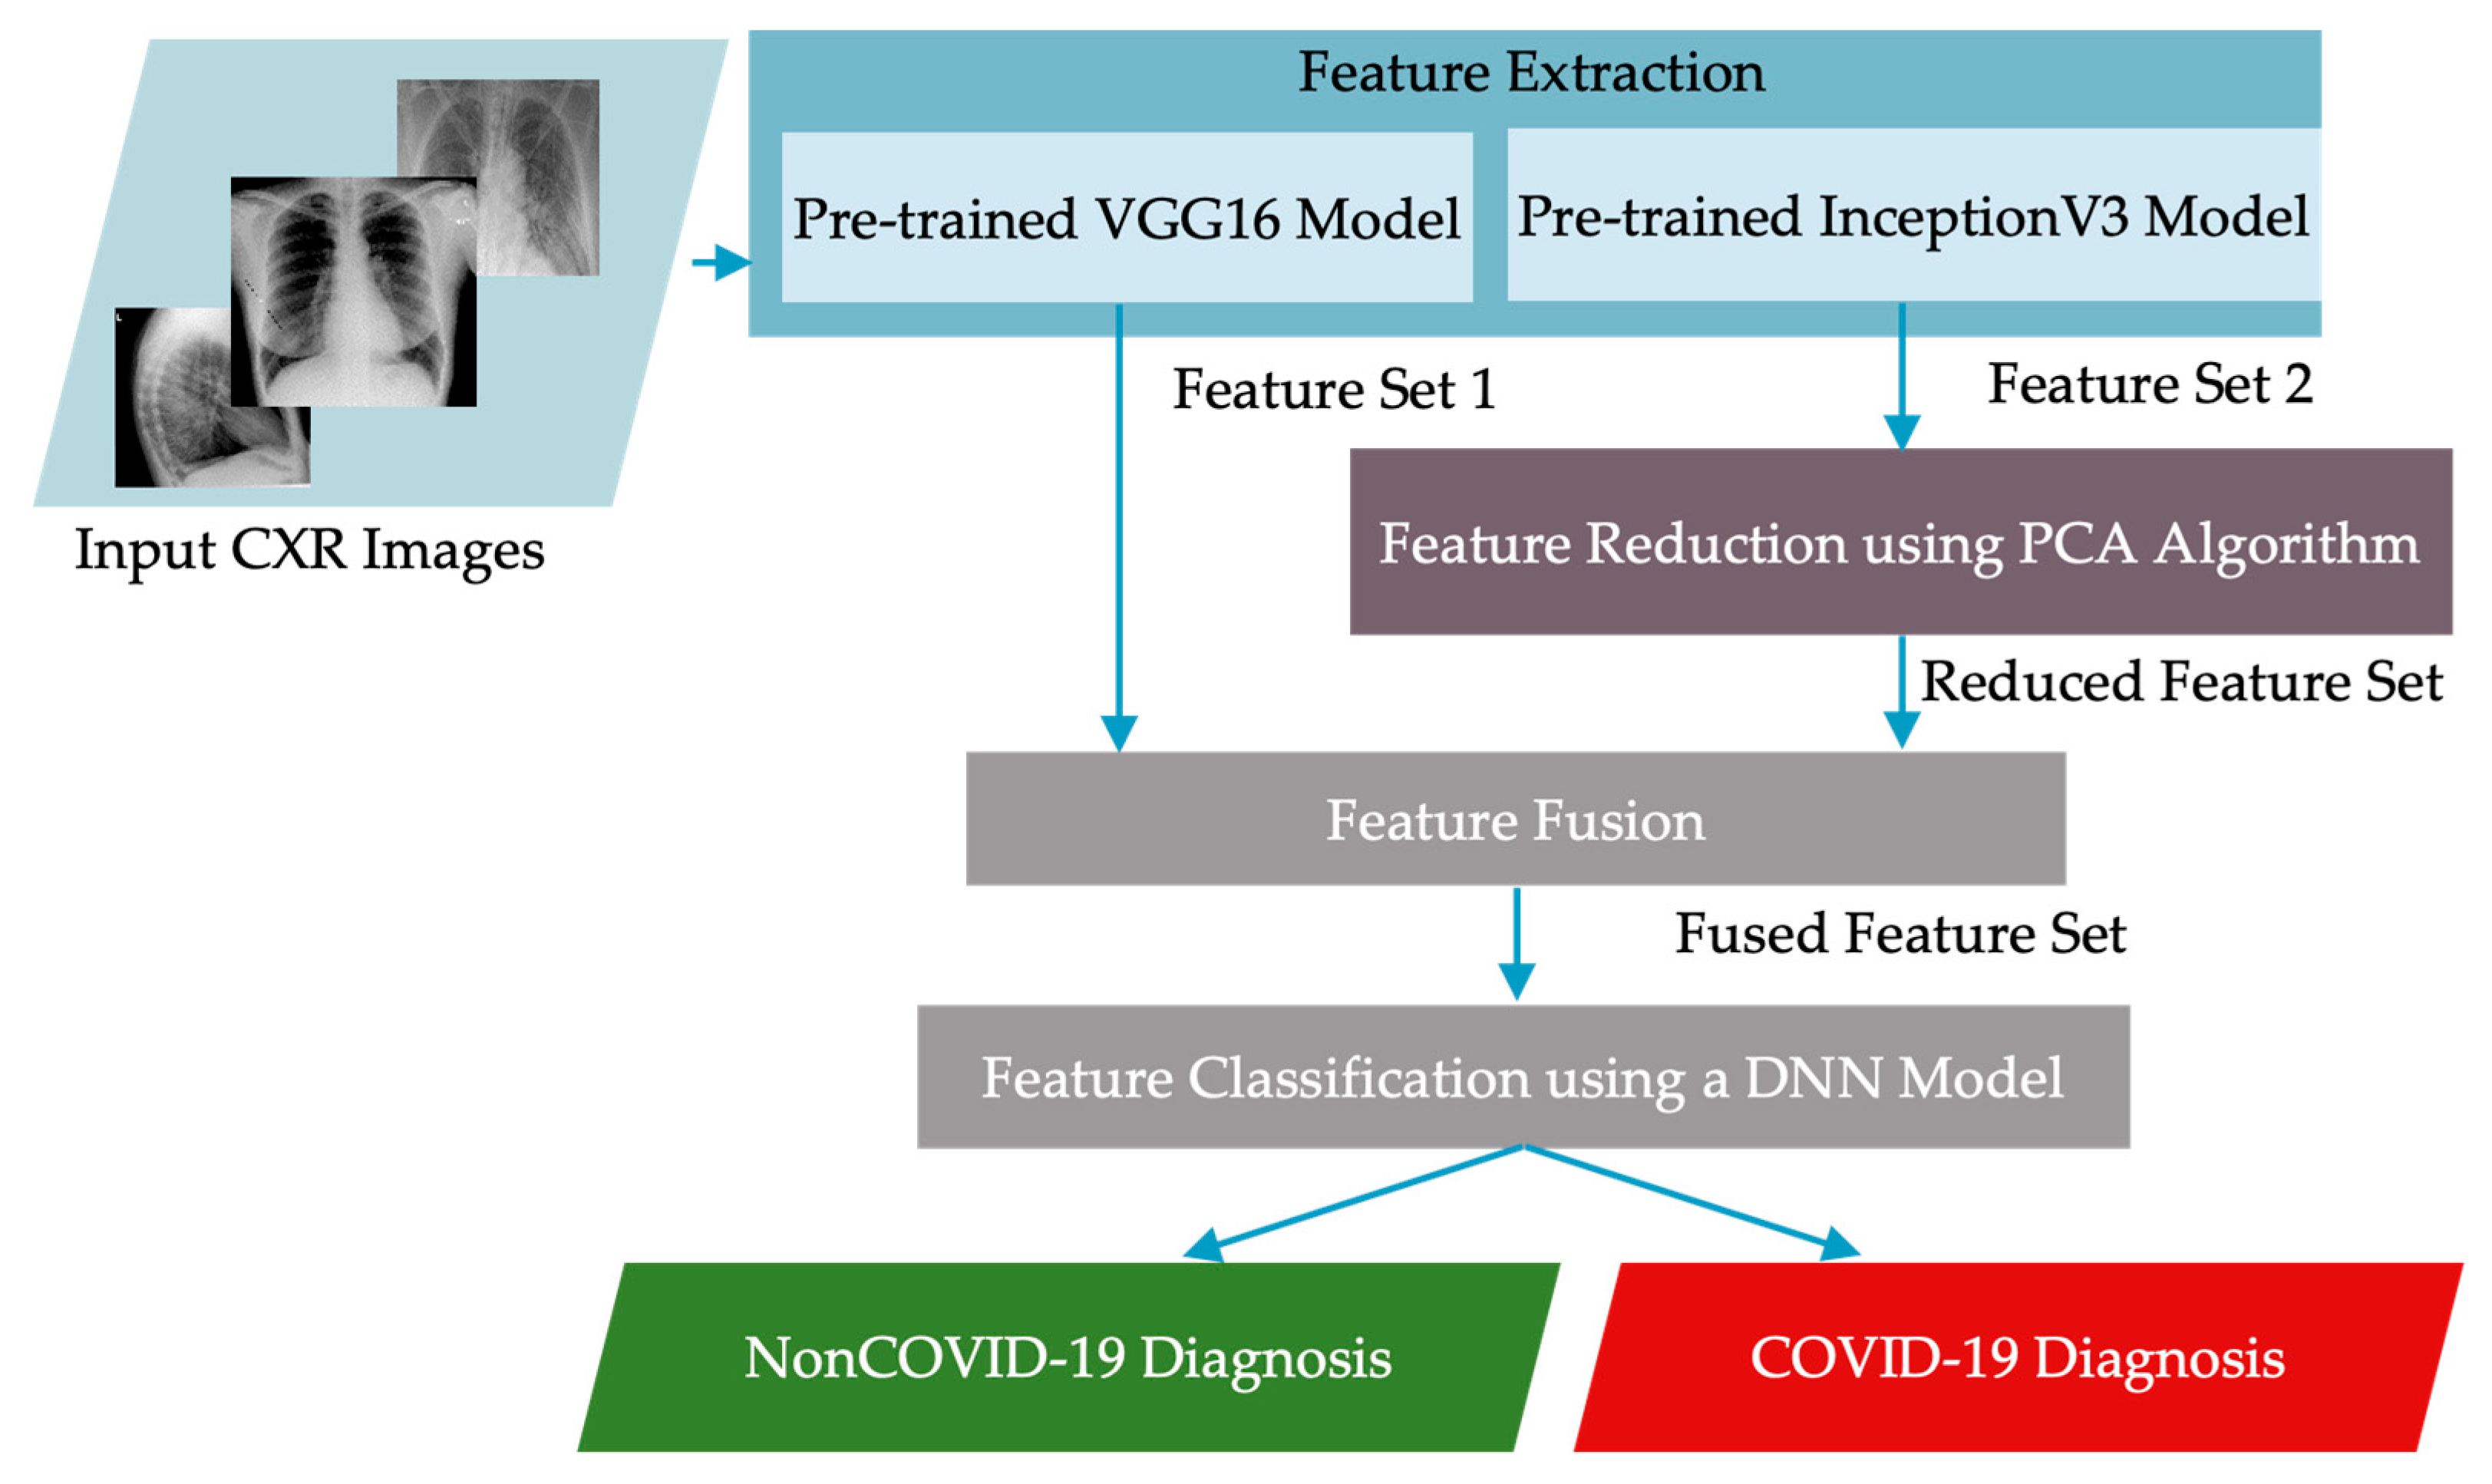
  • Third, our proposed approach adopts appropriate DL models, namely VGG-16 and InceptionV3. Functionally, VGG-16 uses a fixed kernel size to reduce the number of trainable variables, speed up the training time, and increase the robustness of the overfitting problem. The Inception model also uses a variable kernel size to extract global and local features, providing good results in detecting area-specific features. However, the global and local features contain some redundant features, leading to a dimensionality problem. We applied principal component analysis (PCA) to reduce the high dimensionality of features extracted by the InceptionV3 model while maintaining the essential features.
  • Lastly, we conducted a set of experiments to evaluate the DL model accuracy and the efficiency of the network and blockchain.
The remainder of this article proceeds as follows. In Section 2, we describe the details of the proposed framework. Section 3 reports the feature-level fusion-based deep learning approach. Experiments are described in Section 4, with a discussion of the approach’s performance compared to the current related work. Section 5 concludes the article and outlines future research directions.

2. Overview of the Proposed Framework

Our proposed framework utilizes 5G technology to connect edges and facilitate efficient data communication, combined with blockchain technology to secure data transfer, to combat the spread of COVID-19. Figure 1 illustrates our concept for universal sharing of COVID-19 data and detection models, with the goal of enabling cross-validation and improving the reliability of new insights. The proposed framework addresses the challenging issue of COVID-19 data accessibility and sharing during epidemics.
The main idea is to gather data from edge computing in hospitals and healthcare centers to identify new COVID-19 cases using a locally trained deep learning model. When not in use, the data are sent to the cloud to improve the global training model. Then, the updated model is transferred back to the edge computing environment for better testing. Overall, the collected data and models will enhance COVID-19 detection and diagnosis worldwide using blockchain and 5G networks.
Figure 2 depicts the three-layer architecture of our proposed framework, consisting of the end-user equipment and application layer, edge computing with a 5G network layer, and cloud computing layer. The bottom layer is the end-user equipment and application layer, where data are collected and utilized. Hospitals store local CXR or CT scan images for COVID-19 cases, which can be diagnosed and detected using DL models. However, DL requires massive data to achieve high accuracy, the acquisition of which is not feasible for a single hospital. Our proposed work aims to gather extensive data from multiple health institutions and use edge and cloud computing with a 5G network to feed it into a global deep learning model. The application in the end-user layer allows healthcare practitioners to diagnose COVID-19 cases using the trained DL model and generate various reports.
The middle layer of the system is composed of edge computing and 5G network technologies. This layer has two main functions: first, it locally tests the data collected from medical equipment used by end-users and provides immediate diagnosis and detection. Second, it connects to the cloud computing layer via a 5G network to ensure fast and reliable data transfer. Blockchain technology is used in this layer to secure the transmission of data and models to protect sensitive health data. Specifically, blockchain verifies the identities of connected nodes and monitors access requests to training models and data in a tamper-proof manner through continuous execution and checking of smart contracts.
The top layer is the cloud computing layer. It collects and trains data from various healthcare sectors globally. The cloud layer processes and trains pre-trained deep CNN models based on the collected data from the edge layer. The edge data help refine the pre-trained deep CNN models globally. Once completed, the global trained model is transferred and loaded to the edge layer server to test new cases. The cloud layer uses blockchain and 5G network technologies, such as the middle layer, to ensure security and low-latency service.

3. Feature-Level Fusion Deep Learning Approach

One of the major components of the framework is to detect COVID-19, given the CXR image data. The feature-level fusion DL approach is responsible for detecting COVID-19 from CXR images. It contains a set of core steps, which are described here in detail:

3.1. Feature Extraction

In this step, important information is taken from the CXR image to improve classification accuracy. Extracting features from image data is a difficult task, but using convolutional neural networks (CNNs), invented in 2012 by Alex, has made it easier. CNNs are built using a deep-learning neural network structure where multiple layers of neurons are connected through connection weights. The weight value between two neurons shows the importance of the corresponding feature. We will describe what type of CNN we will use in our framework after explaining how CNNs extract features from an image.
Let us consider two neurons, ‘i’ and ‘j’, from two consecutive layers, ‘m’ and ‘n’. In this case, the output of jth neuron is computed as follows:
O j n = i = 1 k w i j O i m
Here, w i j is the connection weight from ith neuron to jth neuron and O i m is the feature value that is propagated from ith neuron to jth neuron. From Equation (1), it is obvious that the value of w i j will help the ith neuron about how much proportion of the feature value will be propagated from ith neuron to the jth neuron. For example, if the value of w i j is zero, the feature value represented by the ith neuron will not be propagated to the jth neuron. Hence, we can consider the respective feature has less significance in modeling the system/problem. In CNN, the connection weights between neurons of two consecutive layers form a matrix that can form a 2D image. Mathematically, we can represent the relationship of Equation (1) as follows:
O n = W O m
Here, O n represents a feature vector (if the DL is considered a traditional deep-learning neural network) of size k (considering there are total k neurons in layer n) from layer n that is propagated to the next layer m. However, in CNN the O n represents a 2D matrix of size k × k in place of a feature vector of size k; because CNN can deal with images (i.e., matrix). In CNN, W represents a matrix of size r × r where r < k and the operation ‘ ’ represents a convolutional operation. Note that in the traditional DL approach, the mathematical operation between weight values and feature values is multiplication, while in CNN, this operation is considered matrix convolution. Matrix convolution is a popular technique in image processing for the extraction of features that represent significant edges in the image.
In the past, researchers used a matrix to convolute an input image’s pixels and identify significant edges, known as convolution matrices. However, CNNs use multiple convolutional matrices (called kernels) to connect neurons from one layer to another, with the kernels adapting to detect an image using backpropagation. Pooling and dropping are also used in CNNs. Pooling downsamples the feature image O n to a smaller size, while dropping randomly removes some connections between neurons based on probability. In our case, this helps determine whether a CXR image shows COVID-19 or not.
It is evident that CNN is effective in extracting important features from an image to classify or detect an object. However, it requires a large amount of input and output data for the kernels to adapt. In the case of COVID-19, there is a lack of representative data. To address this, one can use pre-trained CNNs to extract features from CXR images. These models have kernels determined by many images for object detection/classification. Popular pre-trained CNNs such as visual geometry group (VGG16) and InceptionV3 can extract important features from any image, including CXR images for COVID-19 classification.
The VGG16 is a DL network structure with 16 layers of neurons that have been trained using a large number of different images. In our proposed framework, we use the VGG16 model to extract important feature sets from each CXR image. There are many pre-trained DL structures available that have varying numbers of layers and architectures. One such popular pre-trained model is the InceptionV3, which has 12 layers of neurons embedded to extract features from an image. In our proposed framework, we use the InceptionV3 model in parallel with VGG16 to extract another feature set from a CXR image.
Thus, we achieve two different feature sets for the same CXR image, one using VGG16 and the other using Inception V3. We apply a principal component analysis (PCA) approach to the selected features to deselect some features that would not impact the classification performance. PCA is a popular method for identifying significant features from a dataset and is mainly used to reduce the dimensionality of a dataset without losing any meaningful implicit information. In PCA, we compute the first covariance values for each pair of features in the dataset, and a covariance matrix is achieved. After following a series of mathematical equations, we compute the eigenvalue for each of the features. These eigenvalues quantify the significance level of the respective features, where a higher eigenvalue represents a better feature compared to those with a lower eigenvalue. By applying the PCA approach, we remove comparatively less significant features from the preselected feature sets, which reduces the dimensionality of the dataset and does not impact classification performance. PCA is a linear algebra technique that can perform as a dimensionality reduction tool using the following computational steps:
  • Computing the sample mean and the sample covariance matrix by
    μ x = 1 n i = 1 n x i
    C o v x = 1 n 1 i = 1 n ( x i μ x ) ( x i μ x ) T
  • Computing the eigenvalues and eigenvectors of C o v x ;
  • Defining the transformation matrix T = [ w 1 , w 2 , , w d ] with the d eigenvectors associated to the d largest eigenvalues;
  • Projecting the data X = ( x 1 ,   x 2 , , x n ) into the PCA subspace Y = ( y 1 ,   y 2 , , y n ) as follows:
    y i = T x i   ,   f o r   i = 1 ,   2 , , n

3.2. Feature Fusion

In this step, the selected features from the previous approaches are combined/fused to be input into the classifier. As previously mentioned, VGG16 produces a feature size of 512, while InceptionV3 produces a feature size of 2408 due to extracting a larger number of features. However, we believe that reducing the number of features extracted by InceptionV3 would further improve COVID-19 detection from CXR images. Therefore, we used the widely used PCA approach to reduce the extracted InceptionV3 features. No feature selection mechanism was applied to the VGG16 features since their size is already small. Specifically, Figure 3 displays how the selected features from VGG16 and InceptionV3 with PCA were combined to form a single dataset for a CXR image.

3.3. Classification Using a Deep Neural Network (DNN) Model

In this step, a deep neural network (DNN) classifier is utilized to classify COVID-19 positives from non-COVID cases automatically. The DNN consists of several fully connected dense hidden layers, including an input layer and an output layer. Each hidden layer is followed by a dropout layer to prevent over-fitting. The DNN classifier uses various activation functions based on the nature of the input data. One of the activation functions used in the DNN’s hidden layers is the rectified linear unit (ReLU), a linear function that outputs the input if positive and is zero otherwise. This function facilitates easy training and better performance. The softmax function is the second activation function used in the output layer of the DNN model. It predicts the probability distribution of each output class value and transforms the model’s outputs into a vector of probabilities over the input classes. The output of the DNN model is a binary classification label that indicates whether the input CXR image is COVID-19 positive or non-COVID-19.

4. Experiments and Discussion

In this section, we present a series of experiments and their results related to deep learning performance and network efficiency. Specifically, we introduce the dataset used and the technique used to select and initialize the models’ hyperparameters. We then discuss the initial results based on evaluation metrics such as accuracy, F1-score, precision, and recall. The accuracy metric measures the number of correctly classified cases for all instances in the testing samples. Precision computes the number of true positives that were correctly classified out of the total number of false positives and true positives. Recall measures the number of true positives that were correctly classified out of the total number of false positives and true negatives in the testing samples. Lastly, the F1-score represents the weighted average of precision and recall. The following equations show how these metrics are computed:
Accuracy = T P + T N T P + T N + F P + F N
Precision = T P T P + F P
Recall = T P T P + F N
F 1 - score = 2 × ( Precision × Recall ) ( Precision + Recall )
For obtaining the performance on imbalanced data samples, the weighted average of precision, recall, and F1-score metrics are used and calculated by taking the mean of all per-class precision, recall, and F1-score values weighted by the number of examples of each class’s support.

4.1. Deep-Learning Performance Results

The proposed framework’s deep learning method was evaluated using an extensive dataset of CXR images. The dataset comprised CXR and CT images for COVID-19 and non-COVID-19 cases collected from multiple sources by El-Shafai and Abd El-Samie [21]. Various augmentation techniques were used to generate approximately 17,099 CXR and CT images to increase the dataset size. The main folder of the dataset had two sub-folders. The first sub-folder contained CT images, which were further divided into two separate sub-folders. The first sub-folder had 5427 COVID-19 images, and the second sub-folder had 2628 non-COVID-19 images. The second sub-folder was for CXR images, which also included two sub-folders. One sub-folder contained 4,044 COVID-19 images, and the other had 5500 non-COVID-19 images. Experiments were conducted on a dataset of CXR images to validate the DL model, which had 9544 images. All images in the dataset were resized to 224 × 224 pixels to be appropriate for pre-trained CNN models. Additionally, the dataset was divided into a training set (70% randomly selected), a validation set (10%), and a test set (20%).

4.1.1. Hyper-Parameter Tuning of the DNN Model

A grid search technique was used to tune the hyper-parameters of the DNN model. Initially, the model was built with random values for the main hyper-parameters, including the number of hidden layers, number of neurons, dropout ratio, learning rate, batch size, and number of epochs. The model was then evaluated on a validation set, and the process was repeated by searching for new hyper-parameter values until desirable evaluation results were achieved. Once the hyper-parameters were tuned, specific values were set for the learning rate (0.0001), number of epochs (100), batch size (64), dropout ratio (0.2), number of hidden layers (3), and the number of neurons in each hidden layer (256, 128, and 64).

4.1.2. Experimental Results

After training the DNN model on fused extracted features from the training and validation sets, it was then evaluated using a test set. The accuracy and loss results of the training and validation sets at different epoch numbers, as well as the confusion matrix of the test set, are shown in Figure 4.
The confusion matrix of the test set is a table that includes the number of true positives (TP), true negatives (TN), false positives (FP), and false negatives (FN). Figure 5 presents the confusion matrix for the test set instances during the testing process of the DNN model.
The DNN model’s training and validation accuracies were stable after 50 epochs, with saturation points of 98.4% and 96.6%, respectively, as seen in Figure 4. This guided us to stop training at epoch 40. The confusion matrix in Figure 5 shows that the DNN model classified 754 COVID-19 cases out of 804 and 1052 non-COVID-19 cases out of 1105, achieving an overall accuracy of 94.6% on the test dataset. Table 1 lists the model’s precision, recall, and F1-score, which all had a weighted average of 94.6%. These results demonstrate the impressive performance of our framework and its potential to be used by medical professionals.
To identify the advantage of feature-level fusion, we applied PCA to many features extracted using well-known DL methods, namely Inception V3, VGG16, and fusion of the features obtained from a combination of Inception V3 and VGG16, as described in Section 3. Figure 6 exhibits the accuracy results of the feature method used and the number of reduced features using PCA. It is evident that the feature-level fusion of VGG16 with reducing features of InceptionV3 to 12 components reached the highest accuracy score (95% approx.).
In a study by Abhishek [15], COVID-19 detection accuracies using ResNet50 (a variant of the DL method that is a pre-trained model) through analysis of CXR images achieved 96.68%, 90.62%, and 87.23% for the training, validation, and test datasets, respectively. Obviously, our proposed method achieved at least 11.7% accuracy, higher than that of the ResNet50 test classification. This signifies that the feature-level fusion of the proposed framework outperforms the available work for detecting COVID-19 from CXR images of the same dataset.
To compare and validate the results of different models against the proposed model shown in Figure 6, a non-parametric Mann–Whitney U test was performed on a total of 120 runs for four models in the statistical analysis. Specifically, the proposed fused model with feature reduction was compared to both single models and a fused model without feature reduction. This involved running each model 30 times in order to draw statistically significant conclusions. In each run, a different random seed was used for the test split. The Mann–Whitney U test involves taking all observations from the two groups being compared and ranking them in order of size. The ranks for each group are then summed, and the statistic test is calculated using the following formula:
U = S 1 k 1 ( k 1 1 ) 2 + S 2 k 2 ( k 2 1 ) 2
Here, k 1 and k 2 represent the size of sample 1 and sample 2 while S 1 , and S 2 are the sum of the ranks in sample 1 and sample 2. By using the sum of ranks and the mean rank, the best group has a mean rank of one, and the second-best has a mean rank of two.
According to Siegel and Castellan [22], a sample size of at least 15 or more is required to achieve statistical power for common non-parametric tests. However, to ensure robust results, we conducted 30 runs to obtain 30 data samples of accuracies for each model, as shown in Figure 7.
The test question for this statistical analysis was, “Are there statistically significant differences in accuracies attained by the proposed model and other models?” The hypotheses to address this question were as follows:
Null Hypothesis:
There are no statistically significant differences between the accuracies of the two models to classify the COVID-19 and Non-COVID-19 classes.
Alternate Hypothesis:
There are statistically significant differences between the accuracies of the two models to classify the COVID-19 and Non-COVID-19 classes.
We used the SPSS statistical tool to implement the statistical test. Table 2 illustrate the ranks and test statistics of the two models regarding the accuracies of COVID-19 and Non-COVID-19 classification.
From Table 2, we can see that the proposed model has the highest mean rank and sum of ranks, making it the best group in this statistical test. In Table 2, we can also see that the two-tailed p-value is less than 0.05, indicating that the null hypothesis can be rejected and the alternate hypothesis accepted. This confirms that there are statistically significant differences between the accuracies of the two models to classify the COVID-19 and Non-COVID-19 classes, proving the superiority of the proposed fused model with feature reduction over the other models.

4.2. Network Efficiency Results

In addition to evaluating the proposed algorithm’s accuracy, we also wanted to model the hospital system and test its networking performance using the design parameters listed in Table 3. The three-layer architecture of the proposed framework arrangement is shown in Figure 2, and it consists of an edge–cloud model design based on a 5G network, multiple edge devices, and a cloud computing component.
Our proposed model organizes the network and computational components hierarchically, with edge and core cloud computing serving similar functions but having different resource availability. Cloud computing offers a large pool of shared resources, while edge computing, situated near the hospital, has limited resources. In the analysis that follows, we consider computing, latency, and application modeling. Table 4 summarizes the system parameters used in the simulation.
Our research proposes a three-tuple <D; G; T> to represent the detection model as follows:
  • D represents the time of detection per unit, ranging from 1 to n. The tasks must be completed within a defined latency threshold, or the system’s performance will suffer.
  • G indicates the geolocation of the edge devices. We subdivide the area into square Gis, and any city is regarded as a compilation of Gi blocks (cells of a network), where i ∈ [1; N], and N signifies the total number of blocks. We evaluate the necessity of enhancing the cloud–edge system’s capacity in any of the blocks by examining the number of hospitals served by them.
  • T represents the detection model’s maximum bearable latency.
To model the delays caused by computing, we used a multi-server queuing model. Different queue models are defined using the Kendall Notation [23], which has five parameters (A/B/c/K/Z) to describe the queue characteristics needed for queuing analysis. A queue is described by the following parameters:
  • A: the distribution of time between arrivals. M is for Markovian (i.e., exponential), D is for deterministic (constant), and G is for general distribution (i.e., an unknown distribution). There are other values for less common distributions.
  • B: the service time distribution, which can generally have the same values as the inter-arrival distribution.
  • c: the number of servers taking parts of the queue.
  • K: the capacity of the system, i.e., the maximum length of the queue plus the number of servers. For this reason, it is sometimes written as K + c. If the value is omitted, the queue is infinite.
  • Z: the service discipline, e.g., First-In, First-Out (FIFO), The Last-In, First-Out (LIFO) priority. When this is left blank, the discipline is assumed to be FIFO.
The M/M/1 queue is the simplest queue type and the one discussed in this section, which has Markovian arrival and service durations, a single server for processing parts, and a queue with no maximum length. An M/M/1 queue can be written more completely as M/M/1/∞/FIFO. On the other hand, an M/M/c queue is defined as a shorthand notation for the Markovian arrival rate and Markovian service rate, and c represents the number of resources [24].
In our scenario, every cloud (central or edge) processes numerous requests on a work-conserving FCFS queue principle (first-come, first-served) with supposed infinite buffers. The total latency depends on the rates of arrival and service, as well as the number of servers c. It is worth noting that since the computing performance is consistent, an increase in the edge’s capacity automatically causes a decrease in the same resources in the center, where queues and delays will start growing instantly as a result. With the increasing load and arrival rate within the system, the overall latency of computing per task increases.
The simulated network model in our experiment was built to mimic a realistic network that consists of 10,000 hospitals in a random distribution approach. Our sample for each hospital consists of five machines to represent the baseline of edge resources. Therefore, our framework considered 10,000 hospitals. The system load represents the percentage of hospitals using the detection model at the same time. When the load = 10%, this means that 10% of the hospitals are operating the detection model. Load = 100% indicates that all 10,000 hospitals are using the detection model (i.e., the fusion of features along with PCA followed by a DNN) at any given moment. The expected time consumed by a task within the server consists of transmission, queuing, and processing delays.
There are different approaches to edge selection for a load of transactions in a cloud–edge system, depending on whether the control is distributed or centralized. With the M/M/c queuing system, it is possible to estimate the service time required for each request, accounting for common networking delays. However, routing toward the nearest cloud–edge scheme may not be enough when hospitals are unevenly distributed geographically. In this case, a distribution strategy is preferable, where routers maintain availability states of resources in neighboring cloud–edge schemes. Requests are first directed to the closest cloud–edge system, which decides to serve it, re-route it to a nearby edge with free resources, or re-route it to the core cloud based on the traffic load and application requirements. In a detection model, the nearest available edge is selected using a decision metric. Our simulation showed that this distributed strategy improved response time by only 10% compared to a cloud-only approach.

4.2.1. Network Experimental Results

In this section, we evaluate the capacity of different cloud–edge arrangements, considering the distribution of resources and traffic load. We consider three scenarios: (i) only core cloud, (ii) only cloud–edge system, and (iii) both core and cloud–edge schemes, with the same number of resources in each scenario. As shown in Table 4, the system parameters used in the simulation are selected based on previous experiments that evaluated the scalability and performance of edge cloud systems [25].

4.2.2. Impact of Network Bandwidth Parameters

Figure 8 depicts the typical response times for edge-only and cloud-only systems with different loads and no limits on edge–cloud bandwidths. No restrictions on bandwidth caused the predominance of queuing delays. When the system loaded for edge-only arrangement achieved 60%, the response time passed the 50-ms threshold. Our simulation showed that if the core cloud has unlimited capacity, the latency of the network influences the overall response time of the application.
Figure 9 shows the effect of limited bandwidth on the average time of response within the cloud system. The overall restriction of the bandwidth lies between the central cloud cluster and the edge. In the case of this scenario and a 500-Gbps cloud bandwidth, the average response time was comparable to the response time of a scenario with unlimited bandwidth. By contrast, for a 50-Gbps bandwidth, we observed an exponential rise with increasing load.
In lower bandwidths (10–25 Gbps), the system fails to manage higher system loads. Since cloud systems with limited bandwidth could not beat the edge-only arrangement for the effectiveness of their response time, we further evaluated an unconstrained bandwidth cloud scenario in our framework.
Figure 10 outlines the average time of response for the central cloud and edge-only schemes with various edge bandwidths. While the 100 Gbps front-haul bandwidth can be compared to the unlimited bandwidth edge-only system, which means that each of the resources on the edge is employed, once the system is considerably full (load = 70%), the core-only system starts outperforming the edge-only arrangement with 1 Gbps of edge bandwidth.
This occurs because in the baseline approach, once the capacity of the edge was full, all incoming requests were routed toward the nearby edges using the edge bandwidth. When the limited bandwidth was divided between several application streams, the delays (propagation and queuing) started to rise, which automatically increased the response time for high loads.
According to the baseline scenario, the edge determines whether it will forward the request to some of the neighboring edges or pass it on to the core cloud. When considering 1 Gbps edge bandwidth, the response time averages for the load = 10% remained only 30 ms, whereas if the load = 100%, it rose to 170 ms since the bandwidth became exhausted and queuing delays started to grow.
Most detection models consider any delay above 100 ms inappropriate. With a doubled bandwidth in the load = 100% situations, the response time grew to ≈ 120 ms on average. When the bandwidth increased, the standard time of response for a fully loaded scheme was reduced. Nevertheless, at any point past 10 Gbps, we did not observe any practical benefit of the baseline approach since queuing delays remained prominent for a loaded edge either at the current detection model or the neighboring detection model.
Once the load point was reached, we observed any significant decrease in average response time regardless of the edge front haul connectivity’s quality. This scenario included a crossover of load = 70%, which is why, in Figure 11, we compared the CDF of edge-only and center-only systems with the 1 Gbps outline. In a static load outline, it was possible to observe a linearly rising response time. This implies that an edge bandwidth of 1 Gbps is unsuitable for operating a massively loaded system.

4.2.3. Impact of Resource Distribution

In the following section, we focus mainly on the effect that the distribution of the computational resources between the edge and the core clouds has on the average time of response. In total, there are 5500 processors, with each of them having a speed of 3.33 GIPS, ready to serve as computing resources. They represent an equivalent of 1100 full-edge racks. Figure 12 indicates the baseline performance of latency for the edge-only, core-only, and cloud–edge schemes, considering various simulation specifications (listed in Table 4).
Cloud–edge schemes that possess 80% of the computational resources are readily available directly in the cloud, whereas 20% of cloud–edge schemes are located at the edge beside the detection models. This scenario assumes that the edge bandwidth is unrestricted. It was no surprise that the edge-only scheme surpassed the other system, regardless of the system load. When resources were moved from the core to the edge, the response time became comparable to the edge-only scheme. If resources are not available at the edge, the cloud–edge scheme will forward the request to the core. In all scenarios, except the edge-only scheme, some requests may have similar response times to the core cloud-only outline. Increasing edge resources led to a decrease in response time, assuming unlimited bandwidth.

4.2.4. Detection Model Traffic Parameters and Their Impact

Figure 13 confirms the importance of edge bandwidth in our framework. The response time of the cloud–edge scheme with 28% computing resources, a cloud–edge resource distribution of 20–80%, and a 1 Gbps edge bandwidth increased faster compared to the scenario with 82% compute resources. This is because, in the baseline scenario (cloud–edge scheme with 28% resources), finding the closest available neighbor may not be enough if the connectivity is weak. If edge resources are low or missing, the system will automatically choose the core cloud, which outperforms the cloud–edge system. This is observed in the scenario with a load of 80% crossover points.
To sum up, our framework and model provided several key observations based on the baseline approach:
  • With unlimited computing resources, the cloud–edge scheme outperforms the core due to lower latency in proximity to hospitals.
  • Increasing core bandwidth beyond the load point will not reduce overall application latency as computational latency takes over.
  • Higher loads result in increased propagation and queuing delays as limited bandwidth is shared among multiple application streams.
  • Continuous increases in front haul edge connectivity cannot improve response time beyond the load level.
  • Distributing additional resources only at the edge worsens application performance with lower bandwidth.

4.3. Blockchain Experimental Results

In this paper, we chose to implement and evaluate our proposed framework using Ethereum for several reasons. Ethereum has a large global community of developers and supports a variety of use cases, such as decentralized applications and smart contracts, on top of its blockchain [26]. The Ethereum blockchain is designed to be flexible and adaptable with Turing complete scripting, which has led to a significant body of the literature on benchmarking and scalability analysis [27,28,29]. Rather than evaluating the Ethereum platform itself, our focus was on analyzing the impact of introducing new entities, such as IoT devices and edge nodes, to the framework. Specifically, we studied the effects of adding local edge pools to the blockchain structure on efficiency and scalability, considering the large number of transactions made by IoT devices in the network.

4.3.1. Testbed Configurations

The proposed framework was implemented using Go-Ethereum [30] on a testbed consisting of ten virtual machines. One machine served as the global blockchain using Proof-of-Work (PoW) consensus protocol, while the other nine machines emulated edge layer pools using the Proof-of-Authority (PoA) protocol. PoA was chosen due to its suitability for managing large amounts of IoT data and the complexity of the edge layer. The PoA system has two types of nodes: sealers and signers [31]. Signers are added after a certain number of sealers have been added and require positive voting for block mining. During the experiment, each local edge-mining pool was configured with a single node as a sealer and had 10 IoT devices per hospital, sending synchronous transactions. Node.js [32] was used for interactions between the blockchain platform and hospitals, while the web3.js [33] library was accessed through JSONRPC call APIs for simulating transactions [34]. The efficiency of the proposed framework was evaluated by analyzing sealing time, performance, average efficiency, ledger storage, and latency. The experiment was conducted 10 times, and an average reading was computed for each setting. A comparison was then made between the proposed framework and a conventional Ethereum-based blockchain using the PoA consensus mechanism.

4.3.2. Execution Time

The time it takes for sealers to group and validate non-verified transactions from the transaction pool to create a new block is known as execution time. We examined how execution time changes with the number of transactions during two processes: device registration and IoT data update. As shown in Figure 13, an increase in the number of simultaneous transactions leads to an increase in execution time for updating data. Similarly, Figure 14 illustrates that the device registration process takes twice as long as the data update process.
Figure 15 compares the execution time of the proposed framework and PoA. In a hospital setting, ten IoT devices generate ten simultaneous transactions, and ten nodes send 100 transactions concurrently to the network. Our framework had an execution time of 227 ms for 100 transactions in ten hospitals with ten IoT devices and 533 ms for 200 transactions in twenty hospitals. When the number of transactions was doubled to 1000 transactions made by four hundred hospitals, the execution time only increased slightly to 3090 ms. Notably, this was almost 50% faster than PoA.
The time between a block’s validation and chaining is known as sealing time. Figure 16 compares the sealing time of the proposed framework with PoA as the number of hospitals increases. Our framework recorded a sealing time of 32 ms for 100 transactions in four hospitals and only 413 ms for 1000 transactions. In contrast, PoA recorded a sealing time of almost 810 ms, indicating that our framework reduced the sealing time by almost 51%.

4.3.3. Throughput

We evaluated the efficiency of the system by determining the number of successful transactions, starting from the first transaction and checking all transactions until the last chained one. We conducted 10 experiments with varying loads and plotted the average efficiencies (Figure 17). Our framework was found to be more efficient than PoA, with the maximum average efficiency recorded at 200 transactions. This value was around 60% higher than the lowest efficiency recorded with 1000 transactions, which was 3.4 transactions per ms. We observed a greater variation in the average efficiency of our framework with varying transaction loads while PoA had already reached its maximum efficiency point. In contrast, our proposed framework demonstrated greater efficiencies before a reduction in efficiency occurred with an increase in the number of transactions.

5. Conclusions

At the onset of a disease pandemic, such as COVID-19, local data may be insufficient for analysis and control. DL methods are powerful tools for disease analysis, but they require big data to enhance their accuracy and performance. To address this, we proposed a secure healthcare framework that integrates DL models with cloud and edge computing environments through blockchain and 5G networks. Cloud computing enables the collection of massive data from hospitals and care facilities to build and train DL models as pre-trained models. The edge-based DL algorithms leverage the high bandwidth and low latency provided by 5G networks to enable healthcare tools and applications to work as one system and fight the COVID-19 spread.
The proposed framework employs a feature-level fusion deep learning approach that uses the VGG-16 and InceptionV3 pre-trained models to extract two different sets of features from CXR images of COVID-19 patients. PCA is used to reduce the high dimensionality of InceptionV3 features while maintaining essential features. The feature sets are fused into a new feature vector and subsequently used for classification with a DNN model. Experimental results on the public dataset of COVID-19 CXR images demonstrated that the proposed DL approach can effectively exploit the fusion of multiple features and improve recent related work.
One limitation of the developed detection system is the need for testing the system during the deployment process in terms of accuracy, reliability, privacy, and task implementation. Another limitation is evaluating the system model on different large-scale datasets for generalization.
In future work, we plan to implement all parts of the proposed framework and deploy the edge deep learning approach on local hospitals to perform online detection of COVID-19 cases. We will test and analyze the security trust part of the proposed framework against attacks on healthcare data and DL models. Additionally, we aim to evaluate the system model on different large-scale datasets for generalization and test the 5G network’s efficiency in latency and bandwidth utilization.

Author Contributions

Conceptualization, M.M.H., M.S.A., A.A.A. and S.A.A.; methodology, M.M.H. and M.S.A.; software, M.S.A.; validation, M.M.H., M.S.A., A.A.A. and S.A.A.; formal analysis, M.M.H. and M.S.A.; investigation, M.M.H. and M.S.A.; resources, M.S.A.; data curation, M.M.H. and M.S.A.; writing—original draft preparation, M.M.H., M.S.A., A.A.A. and S.A.A.; writing—review and editing, M.M.H., M.S.A., A.A.A. and S.A.A.; supervision, M.M.H. and S.A.A.; project administration, M.M.H., M.S.A., A.A.A. and S.A.A.; funding acquisition, M.M.H. and S.A.A. All authors have read and agreed to the published version of the manuscript.

Funding

The authors extend their appreciation to the Deanship for Research Innovation, Ministry of Education in Saudi Arabia, for funding this research work through project number IFKSUDR_H122.

Data Availability Statement

Not applicable.

Conflicts of Interest

The authors declare no conflict of interest.

References

  1. News.Google.Com. Before You Continue. Available online: https://news.google.com/covid19/map?hl=en-US&gl=US&ceid=US%3Aen (accessed on 27 January 2023).
  2. Akay, M.; Subramaniam, S.; Brennan, C.; Bonato, P.; Waits, C.; Wheeler, B.; Fotiadis, D. Healthcare innovations to address the challenges of the COVID-19 pandemic. IEEE J. Biomed. Health Inform. 2022, 26, 3294–3302. [Google Scholar] [CrossRef] [PubMed]
  3. Qayyum, A.; Ahmad, K.; Ahsan, M.; Al-Fuqaha, A.; Qadir, J. Collaborative federated learning for healthcare: Multi-modal covid-19 diagnosis at the edge. IEEE Open J. Comput. Soc. 2022, 3, 172–184. [Google Scholar] [CrossRef]
  4. Hassan, M.; Ismail, W.; Chowdhury, A.; Hossain, S.; Huda, S.; Hassan, M. A framework of genetic algorithm-based CNN on multi-access edge computing for automated detection of COVID-19. J. Supercomput. 2022, 78, 10250–10274. [Google Scholar] [CrossRef] [PubMed]
  5. Li, B.; He, Q.; Cui, G.; Xia, X.; Chen, F.; Jin, H.; Yang, Y. READ: Robustness-oriented edge application deployment in edge computing environment. IEEE Trans. Serv. Comput. 2020, 15, 1746–1759. [Google Scholar] [CrossRef]
  6. Hao, P.; Hu, L.; Jiang, J.; Hu, J.; Che, X. Mobile edge provision with flexible deployment. IEEE Trans. Serv. Comput. 2018, 12, 750–761. [Google Scholar] [CrossRef]
  7. Liu, C.; Cao, Y.; Luo, Y.; Chen, G.; Vokkarane, V.; Yunsheng, M.; Chen, S.; Hou, P. A new deep learning-based food recognition system for dietary assessment on an edge computing service infrastructure. IEEE Trans. Serv. Comput. 2017, 11, 249–261. [Google Scholar] [CrossRef]
  8. Wang, S.; Kang, B.; Ma, J.; Zeng, X.; Xiao, M.; Guo, J.; Cai, M.; Yang, J.; Li, Y.; Meng, X. A deep learning algorithm using CT images to screen for Corona Virus Disease (COVID-19). Eur. Radiol. 2020, 31, 6096–6104. [Google Scholar] [CrossRef]
  9. Song, Y.; Zheng, S.; Li, L.; Zhang, X.; Zhang, X.; Huang, Z.; Chen, J.; Zhao, H.; Jie, Y.; Wang, R. Deep learning enables accurate diagnosis of novel coronavirus (COVID-19) with CT images. IEEE/ACM Trans. Comput. Biol. Bioinform. 2020, 18, 2775–2780. [Google Scholar] [CrossRef]
  10. Sethy, P.K.; Behera, S.K. Detection of coronavirus disease (COVID-19) based on deep features. Preprints 2020, 2020030300, 2020. [Google Scholar]
  11. Wang, L.; Lin, Z.Q.; Wong, A. COVID-net: A tailored deep convolutional neural network design for detection of COVID-19 cases from chest x-ray images. Sci. Rep. 2020, 10, 19549. [Google Scholar] [CrossRef]
  12. Hossain, M.S.; Muhammad, G.; Guizani, N. Explainable AI and mass surveillance system-based healthcare framework to combat COVID-I9 like pandemics. IEEE Netw. 2020, 34, 126–132. [Google Scholar] [CrossRef]
  13. Rahman, M.A.; Hossain, M.S.; Alrajeh, N.A.; Guizani, N. B5G and explainable deep learning assisted healthcare vertical at the edge: COVID-I9 perspective. IEEE Netw. 2020, 34, 98–105. [Google Scholar] [CrossRef]
  14. Rahman, M.A.; Hossain, M.S.; Islam, M.S.; Alrajeh, N.A.; Muhammad, G. Secure and Provenance Enhanced Internet of Health Things Framework: A Blockchain Managed Federated Learning Approach. IEEE Access 2020, 8, 205071–205087. [Google Scholar] [CrossRef] [PubMed]
  15. ARoy; Kumbhar, F.H.; Dhillon, H.S.; Saxena, N.; Shin, S.Y.; Singh, S. Efficient Monitoring and Contact Tracing for COVID-19: A Smart IoT-Based Framework. IEEE Internet Things Mag. 2020, 3, 17–23. [Google Scholar]
  16. Ranaweera, P.S.; Liyanage, M.; Jurcut, A.D. Novel MEC based Approaches for Smart Hospitals to Combat COVID-19 Pandemic. IEEE Consum. Electron. Mag. 2020, 10, 80–91. [Google Scholar] [CrossRef]
  17. Alanazi, S.A.; Kamruzzaman, M.; Alruwaili, M.; Alshammari, N.; Alqahtani, S.A.; Karime, A. Measuring and preventing COVID-19 using the SIR model and machine learning in smart health care. J. Healthc. Eng. 2020, 2020, 1–12. [Google Scholar] [CrossRef] [PubMed]
  18. Jamshidi, M.; Lalbakhsh, A.; Talla, J.; Peroutka, Z.; Hadjilooei, F.; Lalbakhsh, P.; Jamshidi, M.; La Spada, L.; Mirmozafari, M.; Dehghani, M. Artificial intelligence and COVID-19: Deep learning approaches for diagnosis and treatment. IEEE Access 2020, 8, 109581–109595. [Google Scholar] [CrossRef]
  19. Hussain, A.A.; Bouachir, O.; Al-Turjman, F.; Aloqaily, M. AI techniques for COVID-19. IEEE Access 2020, 8, 128776–128795. [Google Scholar] [CrossRef]
  20. Aloi, G.; Fortino, G.; Gravina, R.; Pace, P.; Savaglio, C. Simulation-driven platform for Edge-based AAL systems. IEEE J. Sel. Areas Commun. 2020, 39, 446–462. [Google Scholar] [CrossRef]
  21. El-Shafai, W.; El-Samie, F.A. Extensive COVID-19 X-Ray and CT Chest Images Dataset. Mendeley Data 2020, V3. [Google Scholar] [CrossRef]
  22. Siegal, S.; Castellan, N.J. Nonparametric Statistics for the Behavioral Sciences; McGraw-Hill: New York, NY, USA, 1988. [Google Scholar]
  23. Gelenbe, E.; Pujolle, G.; Gelenbe, E.; Pujolle, G. Introduction to Queueing Networks; Wiley: New York, NY, USA, 1998. [Google Scholar]
  24. Lee, H.L.; Cohen, M.A. A note on the convexity of performance measures of M/M/c queueing systems. J. Appl. Probab. 1983, 20, 920–923. [Google Scholar] [CrossRef]
  25. Maheshwari, S.; Raychaudhuri, D.; Seskar, I.; Bronzino, F. Scalability and performance evaluation of edge cloud systems for latency constrained applications. In Proceedings of the 2018 IEEE/ACM Symposium on Edge Computing (SEC), Seattle, WA, USA, 25–27 October 2018; pp. 286–299. [Google Scholar]
  26. Chen, H.; Pendleton, M.; Njilla, L.; Xu, S. A survey on ethereum systems security: Vulnerabilities, attacks, and defenses. ACM Comput. Surv. 2020, 53, 1–43. [Google Scholar] [CrossRef]
  27. Li, M.; Qin, Y.; Liu, B.; Chu, X. Enhancing the efficiency and scalability of blockchain through probabilistic verification and clustering. Inf. Process. Manag. 2021, 58, 102650. [Google Scholar] [CrossRef]
  28. Yang, D.; Long, C.; Xu, H.; Peng, S. A review on scalability of blockchain. In Proceedings of the 2020 the 2nd International Conference on Blockchain Technology, Hilo, HI, USA, 12–14 March 2020; pp. 1–6. [Google Scholar]
  29. Khan, D.; Jung, L.T.; Hashmani, M.A. Systematic literature review of challenges in blockchain scalability. Appl. Sci. 2021, 11, 9372. [Google Scholar] [CrossRef]
  30. Christyono, B.B.A.; Widjaja, M.; Wicaksana, A. Go-Ethereum for electronic voting system using clique as proof-of-authority. TELKOMNIKA (Telecommun. Comput. Electron. Control) 2021, 19, 1565–1572. [Google Scholar] [CrossRef]
  31. Ivanov, N.; Yan, Q. System-Wide Security for Offline Payment Terminals. In Proceedings of the Security and Privacy in Communication Networks: 17th EAI International Conference, SecureComm 2021, Virtual Event, 6–9 September 2021; pp. 99–119. [Google Scholar]
  32. Tilkov, S.; Vinoski, S. Node. js: Using JavaScript to build high-performance network programs. IEEE Internet Comput. 2010, 14, 80–83. [Google Scholar] [CrossRef]
  33. Lee, W.-M. Using the web3. js APIs. Beginning Ethereum Smart Contracts Programming; Apress: Berkeley, CA, USA, 2019; pp. 169–198. [Google Scholar]
  34. Samsel, C.; Gökay, S.; Heiniz, P.; Krempels, K.-H. Web Service to JSON-RPC Transformation. In Proceedings of the 8th International Joint Conference on Software Technologies (ICSOFT), Reykjavík, Iceland, 29–31 July 2023; pp. 214–219. [Google Scholar]
Figure 1. A conceptual design of the proposed framework.
Mathematics 11 01216 g001
Figure 2. The three-layer architecture of the proposed framework.
Mathematics 11 01216 g002
Figure 3. Flowchart of the feature-level fusion deep learning approach.
Mathematics 11 01216 g003
Figure 4. Loss and accuracy results of training and validation over 100 epochs.
Mathematics 11 01216 g004
Figure 5. Confusion matrix of DNN model on test set.
Mathematics 11 01216 g005
Figure 6. Accuracy results of the feature method used and the number of reduced features using PCA.
Mathematics 11 01216 g006
Figure 7. The thirty data samples of accuracies for each model in the statistical analysis.
Mathematics 11 01216 g007
Figure 8. Detection average response time for cloud-only and edge-only scenarios.
Mathematics 11 01216 g008
Figure 9. Detection average response time with a variant uplink bandwidth.
Mathematics 11 01216 g009
Figure 10. Cloud–edge schemes with 20% computing resources are available in the cloud.
Mathematics 11 01216 g010
Figure 11. Cloud–edge schemes with 80% computing resources are available in the cloud.
Mathematics 11 01216 g011
Figure 12. Response time CDF for different resource distributions.
Mathematics 11 01216 g012
Figure 13. Average response time for a cloud–edge system with different load and resource distribution.
Mathematics 11 01216 g013
Figure 14. Execution time of main processes in the proposed framework.
Mathematics 11 01216 g014
Figure 15. Average execution time of the proposed framework compared with PoA.
Mathematics 11 01216 g015
Figure 16. Average sealing time of proposed framework compared with PoA.
Mathematics 11 01216 g016
Figure 17. Average throughput of proposed framework compared with PoA.
Mathematics 11 01216 g017
Table 1. Experimental results of evaluation metrics.
Class NamePrecisionRecallF1-Score
COVID-190.9340.9380.936
Non-COVID-190.9550.9520.953
Weighted avg.0.9460.9460.946
Table 2. Ranks and statistics of proposed model and other models for comparing COVID-19 and Non-COVID-19 classification.
Test VariableModelNMean RankSum of Ranks
AccuracyOthers (InceptionV3, VGG16, VGG16+ InceptionV3)9045.504095.00
Our Model30105.503165.00
Total12026.00210.00
StatisticsWilcoxon W4095.00
Z−8.183125
Asymp. Sig. (2-tailed) (p-value)0.0000000000000003
Table 3. System design parameters.
ParameterValue/Range
Cloud Bandwidth10–500 Gbps
Core Cluster0–5 K servers
Edge Clusters0–5 K servers
Latency Requirements50–100 ms
Table 4. Simulation parameters.
ParameterValue
Area5.18 km2
Number of hospitals10 K
Distribution of hospitalsRandom
Bandwidth (Uplink)27, 150, and 300 Mbps
Bandwidth (downlink)54, 300, and 600 Mbps
Packet Size1500 Bytes
Edge Resources (baseline)5 Machines/hospital
Disclaimer/Publisher’s Note: The statements, opinions and data contained in all publications are solely those of the individual author(s) and contributor(s) and not of MDPI and/or the editor(s). MDPI and/or the editor(s) disclaim responsibility for any injury to people or property resulting from any ideas, methods, instructions or products referred to in the content.

