Abstract
Online education has been still a common way for teaching and learning in the post epidemic era. However, the related research on service quality for the online Yue kiln celadon art education industry is still a vital research gap during this period. Thus, a hybrid method of FANP and GRA is proposed in this study to analyse and evaluate the key factors for providing and maintaining high service quality of online Yue kiln celadon art education industry in the post coronavirus era. In this research, whether in the model of FANP and GRA, factors such as safety mechanism of transaction and education, personnel quality, and the ability of customer need handling are essential conditions for providing excellent service quality in the post-COVID-19 era. The main contribution of this study is to propose an integrated method of FANP and GRA to calculate and rank potential solutions of online Yue kiln celadon art education service quality in the post-COVID-19 era under fuzzy environment and discrete conditions. Finally, the research findings of this study have a guiding role, thereby becoming a guide for the industries related to online Yue kiln celadon art education to maintain good service quality in similar scenarios in the future.
Keywords:
online art education; Yue kiln celadon; service quality; fuzzy analytic network process (FANP); Grey Rational Analysis (GRA); multi-criteria decision-making (MCDM) MSC:
68U35
1. Introduction
China’s porcelain industry flourished during the Tang (618–907 CE) and Five Dynasties (907–960 CE). Celadon from the Yue kiln was produced in huge quantities. It was famous for the quality of its production and established by the imperial court as a “tribute kiln” [1]. Literature from the Tang and Song Dynasties (960–1127 CE) indicates that Mi-se porcelain was produced by the Yue kiln as a tribute to the emperor [2,3]. According to archaeological results [4,5,6], the Yue kiln is closely related to the origin of Mi-se porcelain, which is a major discovery of Chinese archaeology. Zhao [7] argued that porcelain is still one of the representative objects of Chinese culture. Coupled with major archaeological discoveries, the education subjects related to Yue Kiln celadon began to develop gradually before the COVID-19 pandemic [7], especially among comprehensive higher education institutions in China.
Since the outbreak of COVID-19, many educational institutions have changed their teaching methods from traditional face-to-face teaching to online teaching. Sabol et al. [8] reported that art educators must learn to teach in a different way during this period. Therefore, it was necessary to explore the impact of the COVID-19 pandemic on activities of art education to understand how methods of art education could be adjusted to reflect the new art education landscape in the post coronavirus era. Tuttle et al. [9] mentioned that these methods of online teaching and hybrid teaching were helpful for art education industry in the face of such unprecedented disaster scenarios.
Meanwhile, the learning perception of higher educational students was studied in China [10]. These scholars [10] discovered that the degree to which learners interacted with course content has a significant impact on learning satisfaction. Pratama et al. [11] introduced that online classroom was popular and effective for students studying the performing arts. Martyniv et al. [12] considered that fundamental creativity skills are best developed through interdisciplinary collaboration in STEM-education method during the period of COVID-19 outbreak. Additionally, Gamage et al. [13] provided some suggestions of online lab teaching strategies in the coronavirus pandemic era. Moreover, Tolmach et al. [14] presented a case study of higher educational students that studying culture and art in Ukraine during the period of coronavirus pandemic. The research result of Tolmach et al. [14] mentioned that students should focus on developing digital technology skills in the online learning process.
Furthermore, we have noticed that some scholars [15,16,17] have begun to consider the development trend of art education and Yue kiln celadon in the post COVID-19 era. For example, Dik et al. [15] provided some suggestions of policies for art education industry in the post COVID-19 era. Li et al. [16] proposed a case study of the perspective for the hybrid performing art education in Hong Kong. Jin et al. [18] used scientific instruments to analyse Yue kiln celadon to find out the corresponding dynasty colour characteristics. This is the first research achievement to standardise the colour characteristics of Yue kiln celadon in the post pandemic era. Xie et al. [19] applied the flipped classroom to the field of art education to investigate students’ positive psychological performance on art education teaching in the post epidemic era.
In addition, much research [20,21,22,23,24,25,26,27,28,29] proposed some research results of service quality for online education industry using various methods in the era of COVID-19 pandemic and post coronavirus epidemic.
Despite the above research has provided many suggestions for the online education industry from many perspectives in the recent three years. However, the research related to online art education in the post coronavirus era is still insufficient, particularly in the field of online Yue kiln celadon art education.
Accordingly, this research will explore important factors that should be noticed and considered for the online Yue kiln celadon art education from the perspective of service quality, thereby providing decision-making basis and filling the research gap in the post COVID-19 era.
1.1. Fuzzy Analytic Network Process
The Analytic Network Process (ANP) was proposed by Saaty in 1996 [30]. Nowadays, it has been proven by many studies to be one of the effective ways to solve multi-criteria decision-making (MCDM) problems in many fields, particularly problems with special relational structures among sub-criteria, alternatives and identified nonlinear links [31,32,33,34,35,36,37,38].
However, ANP is not suitable for solving MCDM-related problems involving uncertain phenomena. It is necessary to introduce fuzzy theory. Fuzzy theory was proposed by Dr. Lotfi Zadeh in 1965 [39]. Since variables of human psychological perception are difficult to accurately assess. Therefore, fuzzy theory uses mathematical language to describe the fuzzy phenomenon of human psychology, which can make the statistical results closer to the state of human psychological perception [40,41].
Meanwhile, Kahraman et al. [42] further integrated fuzzy theory and ANP into a comprehensive approach, called Fuzzy ANP (FANP), thereby dealing with related decision-making problems caused by imprecise psychological perception variables.
In recent decades, FANP has been widely implemented in the research field of MCDM problems and proven to be a highly reliable and valid research method for MCDM problems [43,44,45,46,47,48,49,50,51].
1.2. Grey Rational Analysis
Grey Rational Analysis was proposed by Deng [52]. This method is mainly aimed at problems with uncertainty and incomplete information for solving problems with uncertain or discrete data through steps such as correlation analysis, model building, prediction and decision-making [53]. Such characteristics make the GRA a suitable method for solving MCDM problems of multi-attribute and multi-scenario [54,55,56,57].
Meanwhile, many scholars [58,59,60,61] integrated the GRA with other MCDM research methods, such as: AHP and ANP, for solving MCDM problems in many fields within these decades. Additionally, some studies [62,63] proposed some hybrid approaches of FAHP, FANP, and GRA for energy storage industry and ERP packages evaluation.
The above research results provided significant inspiration for the development of research process and methodology for this study.
1.3. Research Objectives
In the view of this, we will construct the structure for the measurement of online Yue kiln celadon art education service quality through expert questionnaires and literature review from other’s research. Afterwards fuzzy analytic network process (FANP) will be implemented to calculate weights of evaluation dimensions and indicators. Finally, grey rational analysis (GRA) will be applied to rank all alternatives, thereby achieving the following research objectives:
- To construct the structure of service quality evaluation for the online Yue kiln celadon art education industry.
- To integrate the perspective of experts for analysing weights of evaluation dimensions and indicators for the service quality of online Yue kiln celadon art education using FANP.
- To evaluate and rank alternatives of online Yue kiln celadon art education service quality by applying GRA.
- To fill in the research gap of online Yue kiln celadon art education service quality in the post COVID-19 era, thereby providing relevant decision-making suggestions for online Yue kiln celadon art education industry.
2. Materials and Methods
In this study, a hybrid approach of FANP and GRA was proposed for the service quality evaluation of online Yue kiln celadon art education in the post COVID-19 era. The research process is shown in Figure 1.
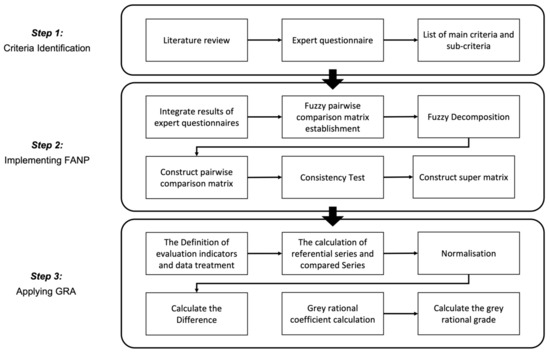
Figure 1.
Research Processes.
2.1. The Identification of Evaluation Criteria
Firstly, evaluation criteria were identified and selected based on expert questionnaires and literature review. As for the literature review, extensive searches and discussions using keywords such as “Yue Kiln Celadon”, “Art Education”, “Multi-Criteria Decision Analysis”, “Fuzzy ANP”, and “Gray Rational Analysis” were conducted using SCI and SSCI databases in this study. Then, the study aggregated the search results. Afterwards experts were asked to provide suggestions. Finally, this study revised the statement of evaluation criteria based on expert suggestions.
As for the number of experts, Darko et al. [64] argued that a large number of experts will easily produce “cold-called” experts, which could seriously affect the results of consistency assessment. Meanwhile, we found that much research [65,66,67,68,69,70,71,72,73,74] utilised small sample size of four to nine experts to obtain valuable and reliable decision-making basis. In the view of this, this study selected ten experts in online Yue kiln celadon art education to avoid the influence on consistency check. Accordingly, the evaluation criteria were identified and selected by ten experts. Afterwards the result of evaluation criteria identification was obtained. It consisted of four levels; the first level is the goal of service quality evaluation for online Yue kiln celadon art education in the post COVID-19 era. The second level consists of five main criteria, followed by the 15 sub-criteria and five alternatives, as shown in Figure 2.
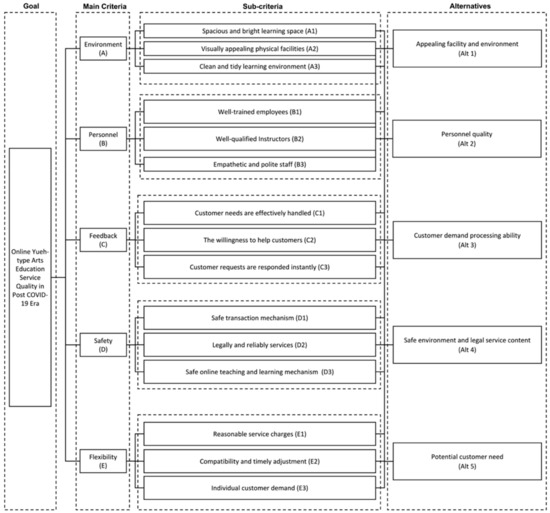
Figure 2.
Evaluation criteria identification.
Additionally, this study obtained the interdependence of sub-criteria and alternatives based on suggestions of above-mentioned 10 experts, thereby establishing the hierarchy and network structure of service quality evaluation for online Yue kiln celadon art education industry in the post coronavirus era, as shown in Figure 3.
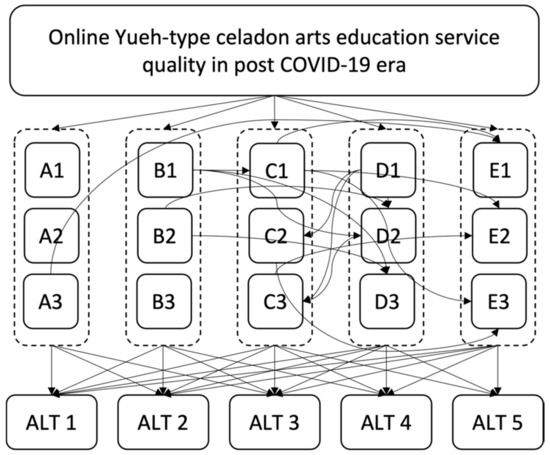
Figure 3.
The hierarchy and network structure of this research.
2.2. Questionnaire Establishment and Measuring
After the hierarchy and network structure was obtained. We inputted the associated evaluation indicators in the hierarchy and network structure into the Super Decision software to create a pairwise comparison questionnaire of a nine-point evaluation scale. The result of pairwise comparison questionnaires were integrated by geometric mean method and analysed by Fuzzy ANP. Meanwhile, this study established a direct rating scale questionnaire of five alternatives. The results of direct rating scale questionnaires were analysed using GRA.
Then, in this study, a total of 30 expert questionnaires, including 15 pairwise comparison questionnaires and 15 direct scoring questionnaires, were sent to the online Yue Kiln Celadon art education experts from 10 April 2022 to 15 June 2022. Subsequently, a total of 20 valid questionnaires were recovered, including 10 valid pairwise comparison questionnaires and 10 valid direct rating scale questionnaires.
2.3. Fuzzy Logic and Linguistic Variables
Scholars [75,76] considered that linguistic variables utilised measuring importance, such as “Very important”, “Relatively important”, and “Unimportant”, are often ambiguous. Therefore, it is necessary to introduce fuzzy logic to clarify the state of human psychological perception.
Fuzzy logic was proposed by Zadeh in 1975 [77]. It is an algorithm involving fuzzy numbers, which introduces a concept like reasoning, thereby finding the result that is closest to the variable of human psychological perception.
Therefore, we studied fuzzy numbers and found that fuzzy numbers are generally expressed in mathematical way [78,79,80,81,82,83,84,85]. For example, triangular fuzzy number (, , ) given by the following equation is shown in Figure 4.
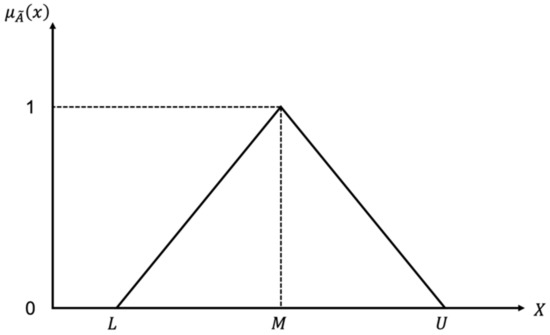
Figure 4.
Fuzzy triangular numbers.
Meanwhile, much research [78,79,80,81,82,83,84,85] mentioned that the most likely evaluation value of triangular fuzzy numbers is the crisp value. The crisp value of triangular fuzzy numbers is given by the following equation.
Additionally, Buckley [86] reported that the characteristics of triangular fuzzy numbers is helpful to accurately present human fuzzy psychological perception variables through converting fuzzy numbers into clear and practical numbers. Moreover, triangular fuzzy numbers have been proven by Pedrycz [87] to be very suitable for expressing the degree of relative psychological perception and judgment of each criteria and alternative in the hierarchy and network structure. Accordingly, triangular fuzzy numbers are utilised to represent linguistic variable scales in this research.
Furthermore, ANP used a nine-point evaluation scale to indicate the importance of each evaluation criterion and alternative. Therefore, we integrate the triangular fuzzy number and ANP evaluation scale, thereby assessing and measuring human psychological true preferences for specific options. The corresponding fuzzy numbers are provided in Table 1.

Table 1.
Fuzzy numbers and scales.
2.4. Fuzzy Analytic Network Process
2.4.1. Consolidate Opinions of All Experts
In ANP model, the method of geometric mean is suggested by Saaty [88] to integrate perspectives of all experts and calculated as follows:
where
is the number of experts.
2.4.2. The Construction of Fuzzy Pairwise Comparison Matrix
In this step, a fuzzy pairwise comparison matrix is performed and presented as follows:
where
represents the fuzzy pairwise comparison matrix.
is triangular fuzzy mean value for comparing priority pairs among elements.
2.4.3. Fuzzy Decomposition
As for fuzzy decomposition, the process of defuzzification is presented as follows [89,90,91]:
where
where
is the lower bound value of the triangular fuzzy number.
represents the median value of the triangular fuzzy number.
is the upper bound value of the triangular fuzzy number.
When the diagonal matrix is matching, we have
2.4.4. Set up the De-Fuzzified Comparison Matrix
The de-fuzzified pairwise comparison matrix can be built using and in Equation (5) for calculating the weight of each dimension and indicator. The de-fuzzified pairwise comparison matrix is expressed as follows:
2.4.5. The Calculation of Priority Vector
The local priority vector is used in ANP model to estimate the relative importance associated with elements or components being compared. The local priority vector is calculated as follows:
where
is the de-fuzzified pairwise comparison matrix.
represents the maximum value of the matrix.
is the eigenvector.
If was the consistency matrix, the eigenvector would be calculated as follows:
2.4.6. Consistency Check
Saaty [92] proposed adopting the consistency index (C.I.) and consistency ratio (C.R.) to verify the consistency of the comparison matrix. The C.I. and C.R. are defined as follows:
where
is the number of criteria.
Random index (R.I.) is a consistency index that produced by positive reciprocal matrices of different orders. Table 2 shows values of random index.
Table 2.
Random indexes (R.I.).
When , it refers to the best acceptable error. When , it means that the consistency of the matrix is satisfactory [92].
2.4.7. The Construction of Super Matrix
After completing the above steps, the super matrix is formed as follows:
where
represents the weight of indicators in the super matrix.
is the vector of the feature.
means the vector of the criterion.
represents the dependency of dimensions.
is the dependency of criteria.
Finally, the weight of indicators in the super matrix () is calculated as follows:
where
is the weight matrix of main criteria considering the interdependence degree.
is the evaluation weight matrix of sub-criteria considering the interdependence degree.
2.5. Grey Rational Analysis
2.5.1. The Definition of Evaluation Indicators and Data Treatment
The five alternatives in this study correspond to the 15 sub-criteria. Meanwhile, the direct evaluation (with a rating from 1 to 9, with a higher value indicating better the ability) is utilized to measure these 15 sub-criteria. In this study, experts are asked to score 15 sub-criteria. Then, the average scores of experts are taken as the score of the indicator corresponding to the five alternatives.
2.5.2. The Calculation of Referential Series and Compared Series
The referential series () with the number of indicators () is defined as follows:
Then, the compared series () is defined as follows:
2.5.3. Normalisation
Afterwards the data of referential series and compared series should be normalised, thereby making them comparable.
In this research, scores of all criteria are larger-the-better. Thus, the process of normalisation for referential series and compared series is expressed as follows [93]:
where
is the maximum value of indicator.
represents the minimum value of indicator.
2.5.4. Calculate the Difference between Referential Series and Compared Series
The series difference is calculated as follows:
where
is the referential series of 15 sub-criteria.
represents the compared series of 15 sub-criteria.
2.5.5. Calculate the Grey Rational Coefficient
The grey relational coefficient between the compared series () and the referential series () at the indicator is defined as follows:
2.5.6. The Calculation the Grey Rational Grade
The grey rational grade (GRG) of a series () is calculated as follows:
Finally, the alternatives are prioritised based on the magnitude of GRG values (). The alternative with the largest GRG value represents the best alternative and so on.
3. Results
3.1. Numerical Analysis
3.1.1. Fuzzy Analytic Network Process
The expert questionnaires were utilized in FANP model for gathering opinions from experts. Then, Equation (3) were used to integrate experts’ opinions. Afterwards the fuzzy pairwise comparison matrix for all criteria from FANP model was established.
Table 3 reveals the fuzzy pairwise comparison matrix for five main criteria.
Table 3.
The fuzzy pairwise comparison matrix for five main criteria from FANP model.
The process of fuzzy decomposition using and for main criteria between Environment (A) and Personnel (B) is as follows [94,95,96]:
The processes of fuzzy decomposition for remaining main criteria are like the above calculation. Afterwards the de-fuzzified pairwise comparison matrix for five main criteria from FANP model are shown in Table 4.
Table 4.
The de-fuzzified pairwise comparison matrix for five main criteria from FANP model.
The calculation process of maximum individual value for each main criteria is shown in Table 5.
Table 5.
The maximum individual value calculation process.
The calculation process of weight for each dimension is shown in Table 6.
Table 6.
The calculation of weight for five dimensions.
The calculation of normalised matrix is shown in Table 7.
Table 7.
Normalised matrix calculation.
The calculation of maximum eigenvector () is shown in Table 8.
Table 8.
The calculation of maximum eigenvector for five main criteria.
Afterwards the numbers of main dimensions are 5, we get . Therefore, and are calculated as follows:
For , with , we have .
The calculation result of de-fuzzified pairwise comparison matrix between five main criteria is shown in Table 9.
Table 9.
The pairwise comparison matrix for five main criteria from FANP model.
Additionally, the calculation processes of defuzzification, maximum eigenvalue (), consistency index () and consistency ratio () for all sub-criteria are like above calculation. Afterwards the de-fuzzified pairwise comparison matrix for all sub-criteria is shown in Table 10.
Table 10.
The de-fuzzified pairwise comparison matrix for all sub-criteria.
Moreover, Table 11 demonstrates the de-fuzzified pairwise comparison matrix for each criterion under specific criterion.
Table 11.
The de-fuzzified pairwise comparison matrix for each criterion under specific criterion.
As shown in Table 9, Table 10 and Table 11, Values of consistency index () and consistency ratio () for main criteria and sub-criteria are all less than 0.1. It means that the data in the pairwise comparison matrix is consistent.
Finally, the super matrix was calculated using Super Decision software. The value of each column in the limit super matrix is the weight of each indicator, as shown in Table 12.
Table 12.
The super matrix.
3.1.2. Grey Rational Analysis
In this study, scores of all sub-criteria given by experts are larger-the-better. Therefore, the largest value of each sub-criteria is considered as referential series (), the value of each indicator is considered as compared series (). Table 13 reveals the referential series () and compared series ().
Table 13.
Referential series and compared series.
Then, the normalised data is calculated using Equation (18). After that, the calculation of deviation sequences using Equation (19). Afterwards the calculation of grey rational coefficient using Equation (20). Finally, the calculation results of normalised data, deviation sequences and grey rational coefficient are shown in Table 14, Table 15 and Table 16.
Table 14.
Normalised data.
Table 15.
Deviation sequences.
Table 16.
Grey rational coefficient.
3.2. Research Results
3.2.1. Fuzzy Analytic Network Process
As for the ranking of all criteria in FANP model, they are ordered by overall weights. Therefore, we inputted all data in the pairwise comparison matrix into Super Decision software. Afterwards overall weights of main criteria and sub-criteria were calculated. The overall weights and ranking of main criteria and sub-criteria are shown in Figure 5 and Figure 6.
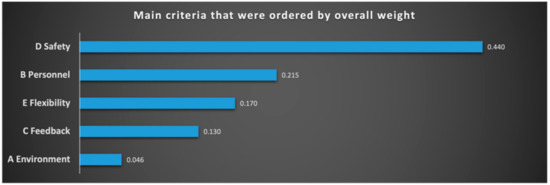
Figure 5.
The overall weight and ranking of five main criteria.
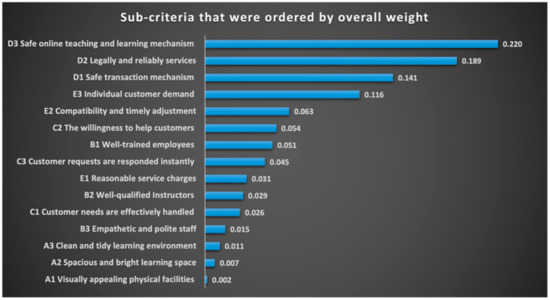
Figure 6.
The overall weight and ranking of sub-criteria.
As shown in Figure 5, the main criteria that were ordered by overall weights as safety (0.44), personnel (0.215), flexibility (0.17), feedback (0.13), and environment (0.046).
As shown in Figure 6, the top 3 sub-criteria that were ordered by overall weights as “Safe online teaching and learning mechanism” (0.22), “Legally and reliably services” (0.189), and “Safe transaction mechanism” (0.141).
The overall weights of sub-criteria ranked fourth to fifth are “Individual customer demand” (0.116) and “Compatibility and timely adjustments” (0.063).
The sixth to eighth important sub-criteria are “The willingness to help customers” (0.054), “Well-trained employees” (0.051) and “Customer requests are responded instantly” (0.045).
3.2.2. Grey Rational Analysis
The priority of all alternatives is based on the grey rational grade (). The calculation of grey rational grade using Equation (21) is shown in Table 17.
Table 17.
Grey rational grade.
The larger value of grey rational grade () represents that the alternative is closer to optimal solution. Accordingly, rankings of all alternatives based on grey rational grade are “Safe environment and legal service content” (0.9556), “Potential customer need” (0.7772), “Personnel quality” (0.5451), “Customer demand processing ability” (0.4278) and “Appealing facility and environment” (0.3333).
4. Discussion
In this study, the overall weight of all criteria is calculated and obtained using Super Decision software in FANP model. Afterwards all criteria are ranked based on the overall weight in FANP model. Meanwhile, the score of each alternative with respect to each sub-criterion is obtained based on the judgement of experts on each alternative under each sub-criterion. Afterwards all alternatives are ranked according to the grey rational grade (GRG) in the GRA model.
As for the ranking of main criteria in FANP model, the most vital main criterion ordered by overall weight is safety. It means that service providers of online Yue kiln celadon art education should give top priority to the security of service content in the post COVID-19 era.
The second to fourth important main criteria are personnel, flexibility, and feedback. Therefore, personnel factors such as employees and teachers, the flexibility of service content and the ability to respond to customer needs are important factors for maintaining high service quality of online Yue kiln celadon art education industry in the post coronavirus era.
As for ranking of sub-criteria in FANP model, the most three vital sub-criteria are “Safe online teaching and learning mechanism”, “Legally and reliably services”, and “Safe transaction mechanism”. Accordingly, the service providers of online Yue kiln celadon art education should pay attention to the safety and legality of the education mechanism, service content and transactions. In the view of this, this study suggests that the service providers of online Yue kiln celadon art education can ensure that the service content in the post COVID-19 era is safe and legal through employee training and the establishment of a safe transactional mechanism.
The fourth and fifth important sub-criteria are “Individual customer demand” and “Compatibility and timely adjustment”. Thus, we suggest that service providers of online Yue kiln celadon art education should care about the individual needs of consumers and establish highly compatible and flexible service capabilities, thereby maintaining high service quality in the post coronavirus era.
The sixth to eighth important sub-criteria are “The willingness to help customers”, “Well-trained employees” and “Customer requests are responded instantly”. It means that factors such as the willingness of customer service, the level of staff training and the respond speed to customer need are crucial condition to provide good service quality for online Yue kiln celadon art education industry in the post coronavirus era.
As for the ranking of all alternatives in the GRA model, the top alternative ordered by grey rational grade is “Safe environment and legal service content”, followed by “Potential customer need”, “Personnel quality” and “Customer demand processing ability”. In the view of this, this research suggests that the safe environment and legal service content should be the primary goals of online Yue kiln celadon art education industry. Meanwhile, personnel quality and abilities of customer needs discovery and processing are also the key factors for maintaining excellent service quality of online Yue kiln celadon art education industry in the post epidemic era.
Finally, whether in the model of FANP and GRA, the main criterion and alternative ranked last is environmental factors. This means that the environment of online Yue kiln celadon art education industry is relatively less important in the post coronavirus era.
5. Conclusions
This research established the hierarchy and network structure of service quality evaluation for the online Yue kiln celadon art education industry based on suggestions of experts. Then, the overall weight of all criteria was calculated and obtained in FANP model. Afterwards all alternatives were analysed and ranked using GRA.
The main contribution of this research is to propose a hybrid approach of FANP and GRA for the service quality evaluation of online Yue kiln celadon art education in the post COVID-19 era under fuzzy environment and discrete condition. Meanwhile, whether in the model of FANP and GRA, factors such as safety mechanism of transaction and education, personnel quality and the ability of potential customer need discovery and handling are crucial conditions for providing and maintaining excellent service quality in the post COVID-19 era.
Additionally, this study has an indicative role for the online Yue kiln celadon art education industry to provide good service quality in the post COVID-19 era. Finally, the research findings of this study provide the guidance for the online English teaching industry to maintain good service quality in future related scenarios.
Author Contributions
Conceptualisation, investigation, J.W. and C.-L.L.; formal analysis, writing and editing, C.-L.L.; methodology, J.W. and C.-L.L.; validation, J.W. and C.-L.L.; writing—original draft preparation, J.W.; writing—review and editing, J.W. All authors have read and agreed to the published version of the manuscript.
Funding
This paper is supported by Zhejiang Provincial Philosophy and Social Sciences Planning Project (22NDJC317YBM) and is funded by the Educational and Teaching Reform Series Project of Ningbo Polytechnic (jg2022026).
Data Availability Statement
Not applicable.
Conflicts of Interest
The authors declare no conflict of interest.
References
- Wan, E.-P. Research on the Epitaph of the Porcelain Pot-Shaped Tombstone in the Third Year Tang Guangqi and Relate Questions. Southeast Cult. 1989, 4, 172–176. [Google Scholar]
- Wang, Q.-Z. Mi’ Se Glaze and Ai’ Se Glaze of Yue Kiln in Tang Dynasty. Relics Museol. 1995, 69, 75–85. [Google Scholar]
- Chen, J.-J.; Xie, X.-Y. The Appearance and Deduction of the Concept of Mi’ Se Porcelain. Orient. Collect. 2018, 111, 16–24. [Google Scholar]
- Shaanxi Academy of Archaeology; Famen Temple Museum; Baoji Administration Cultural Heritage; Fufeng County Museum. Archaeological Excavation Report of Famen Temple; Cultural Relics Publishing Houses: Beijing, China, 2007. [Google Scholar]
- Wood, N. Chinese Glazes; University of Pennsylvania Press: London, UK, 1999. [Google Scholar]
- Zhejiang Institute of Cultural Relics and Archaeology. Cixi Cultural Relics Management Committee Office, Mi’ Se Porcelain of the Tang and Five Dynasties Unearthed at the Housi’ Ao Kiln Site in Shanglin Lake; Cultural Relics Publishing Houses: Beijing, China, 2017. [Google Scholar]
- Zhao, B. The Advantage of Implementation of Raku Class in Elective Courses at Comprehensive University in China. In Design, User Experience, and Usability: Designing Interactions; Marcus, A., Wang, W., Eds.; Lecture Notes in Computer Science; Springer International Publishing: Cham, Switzerland, 2018; pp. 169–183. [Google Scholar] [CrossRef]
- Sabol, F.R. Art Education during the COVID-19 Pandemic: The Journey across a Changing Landscape. Arts Educ. Policy Rev. 2022, 123, 127–134. [Google Scholar] [CrossRef]
- Tuttle, L.; Hansen, D. Arts Education in a Virtual Learning Environment: An Introduction to the Lessons, Policies, Budgets and Practices from the COVID-19 Era. Arts Educ. Policy Rev. 2022, 123, 115–116. [Google Scholar] [CrossRef]
- Su, C.-Y.; Guo, Y. Factors Impacting University Students’ Online Learning Experiences during the COVID-19 Epidemic. J. Comput. Assist. Learn. 2021, 37, 1578–1590. [Google Scholar] [CrossRef]
- Pratama, U.N.; Surahman, E. Investigating Student Responses of Online Learning during the COVID-19 Pandemic in Performing Art Education. In Proceedings of the 2020 6th International Conference on Education and Technology (ICET), Malang, Indonesia, 17 October 2020; pp. 64–69. [Google Scholar] [CrossRef]
- Martyniv, L.; Sokolova, A.; Kurinna, S.; Kopeliuk, O.; Sediuk, I.; Khomova, O. Modern Problems and Prospects of Music Formation and Art Education Development during COVID-19. Int. J. Health Sci. 2021, 5, 670–680. [Google Scholar] [CrossRef]
- Gamage, K.A.A.; Wijesuriya, D.I.; Ekanayake, S.Y.; Rennie, A.E.W.; Lambert, C.G.; Gunawardhana, N. Online Delivery of Teaching and Laboratory Practices: Continuity of University Programmes during COVID-19 Pandemic. Educ. Sci. 2020, 10, 291. [Google Scholar] [CrossRef]
- Tolmach, M.; Chaikovska, O.; Khrushch, S.; Kotsiubivska, K.; Trach, Y. Organization of Training in the Art Education Institution in the Context of the COVID-19 Pandemic. In Lecture Notes in Networks and Systems, Proceedings of Seventh International Congress on Information and Communication Technology, London, UK, 21–24 February 2022; Yang, X.-S., Sherratt, S., Dey, N., Joshi, A., Eds.; Springer Nature: Singapore, 2023; pp. 631–639. [Google Scholar] [CrossRef]
- Dik, D.A.; Morrison, R.; Sabol, F.R.; Tuttle, L. Looking beyond COVID-19: Arts Education Policy Implications and Opportunities. Arts Educ. Policy Rev. 2022, 123, 160–168. [Google Scholar] [CrossRef]
- Li, Z.; Li, Q.; Han, J.; Zhang, Z. Perspectives of Hybrid Performing Arts Education in the Post-Pandemic Era: An Empirical Study in Hong Kong. Sustainability 2022, 14, 9194. [Google Scholar] [CrossRef]
- Tam, P.-C. Response to COVID-19 ‘Now I Send You the Rays of the Sun’: A Drama Project to Rebuild Post-COVID-19 Resilience for Teachers and Children in Hong Kong. Res. Drama Educ. J. Appl. Theatre Perform. 2020, 25, 631–637. [Google Scholar] [CrossRef]
- Jin, X.; Wang, X.; Liang, Y.; Qi, Y.; Wang, F.; Luo, H. Celadon Colour Data Association Classification and Its Dynasty-Kiln Site Characteristics. Ceram. Int. 2021, 47, 29567–29575. [Google Scholar] [CrossRef]
- Xie, N.; Deng, H. Research on the influence of aesthetic education teaching based on flipped classroom on college students’ positive psychology. Psychiatr. Danub. 2022, 34, 395–397. [Google Scholar]
- Chen, T.; Peng, L.; Yin, X.; Rong, J.; Yang, J.; Cong, G. Analysis of User Satisfaction with Online Education Platforms in China during the COVID-19 Pandemic. Healthcare 2020, 8, 200. [Google Scholar] [CrossRef] [PubMed]
- Shahzad, A.; Hassan, R.; Aremu, A.Y.; Hussain, A.; Lodhi, R.N. Effects of COVID-19 in E-Learning on Higher Education Institution Students: The Group Comparison between Male and Female. Qual. Quant. 2021, 55, 805–826. [Google Scholar] [CrossRef] [PubMed]
- Camilleri, M.A. Evaluating Service Quality and Performance of Higher Education Institutions: A Systematic Review and a Post-COVID-19 out-Look. Int. J. Qual. Serv. Sci. 2021, 13, 268–281. [Google Scholar] [CrossRef]
- Ramírez-Hurtado, J.M.; Hernández-Díaz, A.G.; López-Sánchez, A.D.; Pérez-León, V.E. Measuring Online Teaching Service Quality in Higher Education in the COVID-19 Environment. Int. J. Environ. Res. Public Health 2021, 18, 2403. [Google Scholar] [CrossRef]
- Busto, S.; Dumbser, M.; Gaburro, E. A Simple but Efficient Concept of Blended Teaching of Mathematics for Engineering Students during the COVID-19 Pandemic. Educ. Sci. 2021, 11, 56. [Google Scholar] [CrossRef]
- MacLeod, K.R.; Swart, W.W.; Paul, R.C. Continual Improvement of Online and Blended Teaching Using Relative Proximity Theory. Decis. Sci. J. Innov. Educ. 2019, 17, 53–75. [Google Scholar] [CrossRef]
- Li, X.; Yang, Y.; Chu, S.K.W.; Zainuddin, Z.; Zhang, Y. Applying Blended Synchronous Teaching and Learning for Flexible Learning in Higher Education: An Action Research Study at a University in Hong Kong. Asia Pac. J. Educ. 2022, 42, 211–227. [Google Scholar] [CrossRef]
- Seo, Y.J.; Um, K.H. The Role of Service Quality in Fostering Different Types of Perceived Value for Student Blended Learning Satisfaction. J. Comput. High. Educ. 2022, 1–29. [Google Scholar] [CrossRef] [PubMed]
- Zibarzani, M.; Abumalloh, R.A.; Nilashi, M.; Samad, S.; Alghamdi, O.A.; Nayer, F.K.; Ismail, M.Y.; Mohd, S.; Mohammed Akib, N.A. Customer Satisfaction with Restaurants Service Quality during COVID-19 Outbreak: A Two-Stage Methodology. Technol. Soc. 2022, 70, 101977. [Google Scholar] [CrossRef] [PubMed]
- Nilashi, M.; Abumalloh, R.A.; Alghamdi, A.; Minaei-Bidgoli, B.; Alsulami, A.A.; Thanoon, M.; Asadi, S.; Samad, S. What Is the Impact of Service Quality on Customers’ Satisfaction during COVID-19 Outbreak? New Findings from Online Reviews Analysis. Telemat. Inform. 2021, 64, 101693. [Google Scholar] [CrossRef] [PubMed]
- Saaty, T.L. Decision Making with Dependence and Feedback: The Analytic Network Process; RWS Publications: Pittsburgh, PA, USA, 1996. [Google Scholar]
- Chen, S. A Combined MCDM Model Based on DEMATEL and ANP for the Selection of Airline Service Quality Improvement Criteria: A Research Based on the Taiwan Airline Industry. J. Air Transp. Manag. 2016, 57, 7–18. [Google Scholar] [CrossRef]
- Tsai, W.C.; Kung, P.T.; Weng, R.H.; Chang, Y.H.; Lee, S.Y. Applying the SERVQUAL Questionnaire to Establish Quality Indicators for Chinese Medicine. Taiwan J. Public Health 2008, 27, 309–319. [Google Scholar]
- Wu, C.S.; Lin, C.T.; Lee, C. Optimal Marketing Strategy: A Decision-Making with ANP and TOPSIS. Int. J. Prod. Econ. 2010, 127, 190–196. [Google Scholar] [CrossRef]
- Ashouri, F. Quality Indicators in the Mobile Industry Rankings Based on Indicators of Customer Satisfaction with the Hybrid Approach DEMATEL and ANP Appropriate Strategy Based on Gray System. Orig. Sci. Pap. 2016, 3, 62–72. [Google Scholar] [CrossRef]
- Saaty, T.L. Rank from Comparisons and from Ratings in the Analytic Hierarchy/Network Processes. Eur. J. Oper. Res. 2006, 168, 557–570. [Google Scholar] [CrossRef]
- Azimi, R.; Yazdani-Chamzini, A.; Fouladgar, M.M.; Zavadskas, E.K.; Basiri, M.H. Ranking the Strategies of Mining Sector through ANP and TOPSIS in a SWOT Framework. J. Bus. Econ. Manag. 2011, 12, 670–689. [Google Scholar] [CrossRef]
- Chen, C.C.; Lin, Y.J. The Key Success Factors of Development of New Products with Design Flexibility by Analytic Network Process—A Case Study of a High-Tech Company. Manag. Inf. Comput. 2015, 4, 150–161. [Google Scholar]
- Ma, Y.-Y.; Chen, J.-J.; Lin, C.-L. Research on the Priority of Service Quality Index for Online English Teaching during the COVID-19 Pandemic: Dual Perspective. Mathematics 2022, 10, 3642. [Google Scholar] [CrossRef]
- Zadeh, L.A. Fuzzy Sets. Inf. Control 1965, 9, 338–353. [Google Scholar] [CrossRef]
- Liu, C.C.; Chen, J.J. Analysis of the Weights of Service Quality Indicators for Drone Filming and Photography by the Fuzzy Analytic Network Process. Appl. Sci. 2019, 9, 1236. [Google Scholar] [CrossRef]
- Vanegas, L.V.; Labib, A.W. A Fuzzy Quality Function Deployment (FQFD) Model for Deriving Optimum Targets. Int. J. Prod. Res. 2001, 39, 99–120. [Google Scholar] [CrossRef]
- Kahraman, C.; Ertay, T.; Büyüközkan, G. A Fuzzy Optimization Model for QFD Planning Process Using Analytic Network Approach. Eur. J. Oper. Res. 2006, 171, 390–411. [Google Scholar] [CrossRef]
- Lupo, T. A Fuzzy Framework to Evaluate Service Quality in the Healthcare Industry: An Empirical Case of Public Hospital Service Evaluation in Sicily. Appl. Soft Comput. 2016, 40, 468–478. [Google Scholar] [CrossRef]
- Chang, S.C.; Tsai, P.H.; Chang, S.C. A Hybrid Fuzzy Model for Selecting and Evaluating the E-Book Business Model: A Case Study on Taiwan e-Book Firms. Appl. Soft Comput. 2015, 34, 194–204. [Google Scholar] [CrossRef]
- Ozdemir, Y.; Basligil, H. Aircraft Selection Using Fuzzy ANP and the Generalized Choquet Integral Method: The Turkish Airlines Case. J. Intell. Fuzzy Syst. 2016, 31, 589–600. [Google Scholar] [CrossRef]
- Parameshwaran, R.; Baskar, C.; Karthik, T. An Integrated Framework for Mechatronics Based Product Development in a Fuzzy Environment. Appl. Soft Comput. 2015, 27, 376–390. [Google Scholar] [CrossRef]
- Ramík, J.; Vlach, M. Generalized Concavity in Fuzzy Optimization and Decision Analysis; Springer Science and Business Media: Berlin/Heidelberg, Germany, 2012; Volume 41. [Google Scholar]
- Yu, M.; Keng, I.; Chen, H. Measuring Service Quality via a Fuzzy Analytical Approach. Int. J. Fuzzy Syst. 2015, 17, 292–302. [Google Scholar] [CrossRef]
- Kargari, M. Ranking of Performance Assessment Measures at Tehran Hotel by Combining DEMATEL, ANP, and SERVQUAL Models under Fuzzy Condition. Math. Probl. Eng. 2018, 2018, 5701923. [Google Scholar] [CrossRef]
- Wicher, P.; Zapletal, F.; Lenort, R. Sustainability Performance Assessment of Industrial Corporation Using Fuzzy Analytic Network Process. J. Clean. Prod. 2019, 241, 118132. [Google Scholar] [CrossRef]
- Chang, B.; Kuo, C.; Wu, C.H.; Tzeng, G.H. Using Fuzzy Analytic Network Process to Assess the Risks in Enterprise Resource Planning System Implementation. Appl. Soft Comput. 2015, 28, 196–207. [Google Scholar] [CrossRef]
- Deng, J.-L. Control Problems of Grey Systems. Syst. Control Lett. 1982, 1, 288–294. [Google Scholar] [CrossRef]
- Deng, J.L. Introduction to Grey System. J. Grey Syst. 1989, 1, 1–24. [Google Scholar]
- Hinduja, A.; Pandey, M. Comparative Study of MCDM Methods under Different Levels of Uncertainty. Int. J. Inf. Decis. Sci. 2021, 13, 16–41. [Google Scholar] [CrossRef]
- Wang, Q.B.; Peng, A.H. Developing MCDM Approach Based on GRA and TOPSIS. Appl. Mech. Mater. 2010, 34–35, 1931–1935. [Google Scholar] [CrossRef]
- Asjad, M.; Talib, F. Selection of Optimal Machining Parameters Using Integrated MCDM Approaches. Int. J. Adv. Oper. Manag. 2018, 10, 109–129. [Google Scholar] [CrossRef]
- Esangbedo, M.O.; Xue, J.; Bai, S.; Esangbedo, C.O. Relaxed Rank Order Centroid Weighting MCDM Method with Improved Grey Relational Analysis for Subcontractor Selection: Photothermal Power Station Construction. IEEE Trans. Eng. Manag. 2022; Early Access. [Google Scholar] [CrossRef]
- Kabak, M.; Dagdeviren, M. A hybrid approach based on ANP and grey relational analysis for machine selection. Teh. Vjesn. Tech. Gaz. 2017, 24, 109–118. [Google Scholar] [CrossRef]
- Hinduja, A.; Pandey, M. An ANP-GRA-Based Evaluation Model for Security Features of IoT Systems. In Intelligent Communication, Control and Devices; Choudhury, S., Mishra, R., Mishra, R.G., Kumar, A., Eds.; Advances in Intelligent Systems and Computing; Springer: Singapore, 2020; pp. 243–253. [Google Scholar] [CrossRef]
- Hsu, P.-F. Evaluation of Advertising Spokespersons via the ANP-GRA Selection Model. J. Grey Syst. 2009, 21, 35–48. [Google Scholar]
- Hsu, P.-F. Selection Model Based on ANP and GRA for Independent Media Agencies. Qual. Quant. 2012, 46, 1–17. [Google Scholar] [CrossRef]
- Gumus, A.T.; Yayla, A.Y.; Çelik, E.; Yildiz, A. A Combined Fuzzy-AHP and Fuzzy-GRA Methodology for Hydrogen Energy Storage Method Selection in Turkey. Energies 2013, 6, 3017–3032. [Google Scholar] [CrossRef]
- Ayağ, Z.; Yücekaya, A. A Fuzzy ANP-Based GRA Approach to Evaluate ERP Packages. Indones. J. Electron. Instrum. Syst. 2019, 15, 45–68. [Google Scholar] [CrossRef]
- Darko, A.; Chan, A.; Ameyaw, E.; Owusu, E.; Pärn, E.; Edwards, D. Review of Application of Analytic Hierarchy Process (AHP) in Construction. Int. J. Constr. Manag. 2018, 19, 436–452. [Google Scholar] [CrossRef]
- Zhang, G.; Zou, P.X.W. Fuzzy Analytical Hierarchy Process Risk Assessment Approach for Joint Venture Construction Projects in China. J. Constr. Eng. Manag. 2007, 133, 771–779. [Google Scholar] [CrossRef]
- Hyun, C.; Cho, K.; Koo, K.; Hong, T.; Moon, H. Effect of Delivery Methods on Design Performance in Multifamily Housing Projects. J. Constr. Eng. Manag. 2008, 134, 468–482. [Google Scholar] [CrossRef]
- Lam, K.C.; Lam, M.C.K.; Wang, D. MBNQA–Oriented Self-Assessment Quality Management System for Contractors: Fuzzy AHP Approach. Constr. Manag. Econ. 2008, 26, 447–461. [Google Scholar] [CrossRef]
- Pan, N.F. Fuzzy AHP Approach for Selecting the Suitable Bridge Construction Method. Autom. Constr. 2008, 17, 958–965. [Google Scholar] [CrossRef]
- Dalal, J.; Mohapatra, P.K.; Chandra, M.G. Prioritization of Rural Roads: AHP in Group Decision. Eng. Constr. Archit. Manag. 2010, 17, 135–158. [Google Scholar] [CrossRef]
- Zou, P.X.W.; Li, J. Risk Identification and Assessment in Subway Projects: Case Study of Nanjing Subway Line 2. Constr. Manag. Econ. 2010, 28, 1219–1238. [Google Scholar] [CrossRef]
- Li, J.; Zou, P.X.W. Fuzzy AHP-Based Risk Assessment Methodology for PPP. Projects. J. Constr. Eng. Manag. 2011, 137, 1205–1209. [Google Scholar] [CrossRef]
- Pan, W.; Dainty, A.R.J.; Gibb, A.G.F. Establishing and Weighting Decision Criteria for Building System Selection in Housing Construction. J. Constr. Eng. Manag. 2012, 138, 1239–1250. [Google Scholar] [CrossRef]
- Akadiri, P.O.; Olomolaiye, P.O.; Chinyio, E.A. Multi-Criteria Evaluation Model for the Selection of Sustainable Materials for Building Projects. Autom. Constr. 2013, 30, 113–125. [Google Scholar] [CrossRef]
- Chou, J.; Pham, A.; Wang, H. Bidding Strategy to Support Decision-Making by Integrating Fuzzy AHP and Regression-Based Simulation. Autom. Constr. 2013, 35, 517–527. [Google Scholar] [CrossRef]
- Herrera, F.; Herrera-Viedma, E. Linguistic Decision Analysis: Steps for Solving Decision Problems under Linguistic Information. Fuzzy Sets Syst. 2000, 115, 67–82. [Google Scholar] [CrossRef]
- Zimmermann, H. Fuzzy Set Theory—And Its Applications, 2nd ed.; Kluwer Academic: Dordrecht, The Netherlands, 1992. [Google Scholar]
- Zadeh, L.A. The Concept of a Linguistic Variable and Its Application to Approximate Reasoning-I. Inf. Sci. 1975, 8, 199–249. [Google Scholar] [CrossRef]
- Lee, A.H.I. A Fuzzy Supplier Selection Model with the Consideration of Benefits, Opportunities, Costs and Risks. Expert. Syst. Appl. 2009, 36, 2879–2893. [Google Scholar] [CrossRef]
- Lee, A.H.I.; Kang, H.Y.; Hsu, C.F.; Hung, H.C. A Green Supplier Selection Model for High-Tech Industry. Expert. Syst. Appl. 2009, 36, 7917–7927. [Google Scholar] [CrossRef]
- Lee, A.H.I.; Kang, H.Y.; Chang, C.T. Fuzzy Multiple Goal Programming Applied to Tft-Lcd Supplier Selection by Downstream Manufacturers. Expert. Syst. Appl. 2009, 36, 6318–6325. [Google Scholar] [CrossRef]
- Lee, A.H.I.; Kang, H.Y.; Wang, W.P. Analysis of Priority Mix Planning for the Fabrication of Semiconductors under Uncertainty. Int. J. Adv. Manuf. Technol. 2006, 28, 351–361. [Google Scholar] [CrossRef]
- Chang, C.H. Evaluating Weapon Systems Using Ranking Fuzzy Numbers. Fuzzy Sets Syst. 1999, 107, 25–35. [Google Scholar] [CrossRef]
- Lin, Y.-H. The Algorithm of Fuzzy Linguistic Numbers and Its Comparison of Scoring. J. Natl. Taichung Teach. Coll. 2003, 17, 279–304. [Google Scholar]
- Chen, D.-C. Evaluation and Inspection of Domestic Civil Aviation Safety Performance. Master’s Thesis, National Chiao Tung University, Hsinchu, Taiwan, 2003. [Google Scholar]
- Dehghani, M.; Esmaeilian, M.; Tavakkoli-Moghaddam, R. Employing Fuzzy Anp for Green Supplier Selection and Order Allocations: A Case Study. Int. J. Econ. Manag. Soc. Sci. 2013, 2, 565–575. [Google Scholar]
- Buckley, J.J. Fuzzy Hierarchical Analysis. Fuzzy Sets Syst. 1985, 17, 233–247. [Google Scholar] [CrossRef]
- Pedrycz, W. Why Triangular Membership Functions? Fuzzy Sets Syst. 1994, 64, 21–30. [Google Scholar] [CrossRef]
- Saaty, T.L. Theory and Applications of the Analytic Network Process: Decision Making with Benefits, Opportunities, Costs, and Risks; RWS Publications: Pittsburgh, PA, USA, 2005. [Google Scholar]
- Adamo, J.M. Fuzzy Decision Tree. Fuzzy Sets Syst. 1980, 4, 207–219. [Google Scholar] [CrossRef]
- Kwong, C.K.; Bai, H. A Fuzzy AHP Approach to the Determination of Importance Weights of Customer Requirements in Quality Function Deployment. J. Intell. Manuf. 2002, 13, 367–377. [Google Scholar] [CrossRef]
- Lin, R.; Lin, J.S.-J.; Chang, J.; Tang, D.; Chao, H.; Julian, P.C. Note on Group Consistency in Analytic Hierarchy Process. Eur. J. Oper. Res. 2008, 190, 672–678. [Google Scholar] [CrossRef]
- Saaty, T.L. How to Make a Decision: The Analytic Hierarchy Process. Eur. J. Oper. Res. 1990, 48, 9–26. [Google Scholar] [CrossRef]
- Wu, H.J.; Chen, C.B. An Alternative Form for Grey Relational Grades. J. Grey Syst. 1999, 11, 7–12. [Google Scholar]
- Tseng, M.L.; Lin, Y.H.; Chiu, A.S.F.; Liao, J.C.H. Using FANP Approach on Selection of Competitive Priorities Based on Cleaner Production Implementation: A Case Study in PCB Manufacturer, Taiwan. Clean Technol. Environ. Policy 2008, 10, 17–29. [Google Scholar] [CrossRef]
- Wang, C.-N.; Yang, C.-Y.; Cheng, H.-C. Fuzzy Multi-Criteria Decision-Making Model for Supplier Evaluation and Selection in a Wind Power Plant Project. Mathematics 2019, 7, 417. [Google Scholar] [CrossRef]
- Wang, C.-N.; Su, C.-C.; Nguyen, V.T. Nuclear Power Plant Location Selection in Vietnam under Fuzzy Environment Conditions. Symmetry 2018, 10, 548. [Google Scholar] [CrossRef]


Disclaimer/Publisher’s Note: The statements, opinions and data contained in all publications are solely those of the individual author(s) and contributor(s) and not of MDPI and/or the editor(s). MDPI and/or the editor(s) disclaim responsibility for any injury to people or property resulting from any ideas, methods, instructions or products referred to in the content. |
© 2023 by the authors. Licensee MDPI, Basel, Switzerland. This article is an open access article distributed under the terms and conditions of the Creative Commons Attribution (CC BY) license (https://creativecommons.org/licenses/by/4.0/).