Abstract
Due to its severity, the outbreak of COVID-19 led to unprecedented levels of social isolation that affected educational institutions, among others. Digital technologies such as cloud computing and video broadcasting helped the adoption of e-learning during the crisis. However, the speed and efficiency of e-learning adoption during the COVID-19 period varied across countries. This paper compares the adoption of e-learning in European countries before and during the COVID-19 pandemic and the relationship between the pandemic, e-learning, and economic development. First, the adoption of e-learning in European countries before and during the pandemic is compared. Second, using fuzzy C-means clustering, homogeneous groups of European countries are formed based on e-learning indicators for the periods before and during the pandemic. Third, GDP per capita is used as an indicator of economic development and severity indices are used as an indicator of the severity of the response to the pandemic to compare the different clusters. The research results show that economically and digitally advanced countries led the adoption of e-learning in both the period before and the period during the pandemic. However, they also responded less strictly to the pandemic. Less-advanced countries responded more strictly to the pandemic, likely due to a lack of healthcare resources, and also fell behind in the adoption of e-learning.
MSC:
91B44; 91B15; 97B40
1. Introduction
In the past, the adoption of new technologies at the national level was mainly driven by economic development. Digitization has boomed in recent decades but not for everyone at the same time, indicating a digital divide [1,2], which refers to the gap between different demographic groups and countries/regions based on their access to modern information and communication technologies [3].
Countries that had insufficient funds for the early development of novel infrastructure such as broadband fell behind. European countries were no exception. The harsh difference between the more developed and the less-developed member countries of the European Union (EU) was evident in the first decade of the 21st century [4]. To overcome this gap, the European Commission introduced several initiatives. It started to measure digital and social development using different indicators under the umbrella term, the DESI index (The Digital Economy and Society Index), but this did not provide the planned outcome of the equal digital development of EU countries [5].
When the COVID-19 pandemic hit, isolation occurred at an invisible level, leading to massive closures of businesses, schools, universities, and public transportation. E-learning, e-commerce, e-business, and e-government became the primary online venues for conducting activities that previously required a physical presence. Based on previous findings, wealthier countries adopted new technologies faster and it was assumed that the same phenomenon would occur with the adoption of e-learning during the pandemic [6]. Therefore, the question arose as to whether this was also the case in European countries.
Considering that European countries did not uniformly adopt e-learning during the pandemic, this paper aims to shed light on the relationship between the pandemic, e-learning, and economic development. To this end, we compare a sample of European countries in two years, 2017 (pre-COVID-19) and 2020 (during COVID-19).
To investigate the relationship between the pandemic, e-learning, and economic development, we pose three research questions: (i) RQ1—How did the level of e-learning change in European countries during the pandemic compared to before the pandemic? (ii) RQ2—How homogeneous was the adoption of e-learning in European countries during the pandemic? and (iii) RQ3—What was the impact of GDP per capita on e-learning before and during the pandemic?
To address the above questions, we compare e-learning levels and economic and COVID-19 indicators before and during the pandemic in European countries using fuzzy C-means clustering, ANOVA, and post hoc methods.
This article is organized as follows. Section 2 details the research methodology. In the Section 3, the empirical results are presented using descriptive statistics and the results of the fuzzy C-means clustering analysis. Further analyses are performed using ANOVA. In the Section 5, the concluding remarks, limitations, and recommendations for further research are presented.
2. Background
2.1. The Notion of E-Learning
Digital technologies, such as cloud computing, augmented reality, artificial intelligence, and video broadcasting, have transformed teaching from a traditional approach into a more contemporary and modernized approach [7,8]. E-learning falls under the broader concept of technology-based learning, which is based on innovations in digital transformation [9].
E-learning, the platform for delivering educational content and facilitating learning through technology, has recently gained popularity due to its convenience and adaptability. In contrast, traditional classrooms still use “chalk and lecture” and conventional face-to-face teaching methods in which a teacher writes on a blackboard and speaks to a group of students. Both approaches have advantages and disadvantages and the decision about which one to use depends on variables such as the subject matter, learning objectives, and available resources [10,11]. The “chalk and talk” method is preferable for subjects that focus on practical applications and are more difficult to teach using e-learning methods via an online platform [12]. The combination of both methods seems to be a reasonable option for most subjects in many cases [13].
2.2. E-Learning during the COVID-19 Era
National boundaries did not constrain the COVID-19 pandemic; therefore, it affected people of all nationalities, education and income levels, and genders. COVID-19 resulted in nationwide school closures in most countries, most of which lasted at least 10 weeks [14]. Children and students had to rely more on their resources to continue learning remotely via the Internet and other media, despite concerted efforts by the education community to ensure continuity of learning during this time [15]. Teachers also had to adapt to new pedagogical approaches and teaching methods for which they had not been adequately prepared [16,17].
During the COVID-19 pandemic, e-learning supported the abilities of students, academic staff, and professionals to develop professionally and personally [18,19,20]. Most higher education institutions offered online courses to students both on and off campus during the pandemic, and some have continued this practice [21,22]. Government spending on “education” as a percentage of GDP at the EU level has fluctuated between 4.7% and 5.1% between 1995 and 2021. In 1995, it was 4.9% of GDP, stagnated over the next decade, and declined to 4.7% in 2007. During the COVID-19 pandemic, government spending on education as a percentage of GDP at the EU level increased to 5.0% by 2020 [23].
However, the adoption of e-learning in response to the isolation caused by COVID-19 was not universally positive. During the pandemic, students with sufficient resources who were motivated and able to learn found alternative learning options, even when their schools or universities were not open [24]. Those from resource-poor backgrounds were often excluded when their schools or universities were closed [25,26]. Therefore, this crisis exposed the many deficiencies and inequities in education systems worldwide, from the lack of broadband access to the availability of portable devices [27,28]. Nevertheless, various strategies to bridge the digital divide in e-learning were implemented during the pandemic [29].
During the pandemic, several advantages and disadvantages of e-learning became apparent. Among the positive aspects, virtual classrooms allowed instructors to communicate effortlessly with students about their assignments and homework [30,31,32]. The negative aspects included that students could passively attend and leave lectures whenever they wanted and they were provided with little or no feedback from the instructor [30,31]. In addition, isolation during the pandemic contributed to psychological problems such as lower concentration, loneliness, and sleep problems. For this reason, during and after the pandemic, higher education institutions shifted their focus from a purely virtual to a hybrid approach by combining e-learning and a “talk and talk” approach [33,34].
Future educational programs must address the sense of community that was missing during the pandemic as it was dominated by online learning [35,36]. For this reason, many universities in the post-pandemic period are embracing hybrid degree programs, which offer a better solution, to ensure that students gain hands-on experience and have face-to-face contact so that they can stay motivated and take advantage of on-campus facilities and support while enjoying the flexibility of distance learning.
Although the COVID-19 pandemic has almost disappeared from European countries due to vaccinations, its effects have exposed the vulnerability of countries in their ability to adapt to crises. Moreover, new pandemics are likely to increase due to increased traffic and populations [37]. Therefore, it is of utmost importance to study the variations among countries in e-learning adoption during the most recent pandemic, along with the impact of economic development and the severity of the pandemic response on the use of e-learning.
3. Methodology
This article compares the adoption of e-learning in European countries before and during the pandemic. To examine the relationship between e-learning adoption, economic development, and the severity of the pandemic response, we use fuzzy C-means clustering, ANOVA, and a post hoc analysis. In this section, we present the data sources and the methodological approach.
3.1. Data Sources
This study focuses on the impact of the COVID-19 pandemic on the adoption of e-learning in European countries. For this purpose, we compared two periods: before and during the pandemic. The outbreak of COVID-19 occurred in 2019 and 2020 can be considered a year that was fully affected by the pandemic. Because changes in technology use during a particular year could be due to methodological errors or random fluctuations, we did not choose 2018 as the base year. Instead, we opted for two years prior to the pandemic and thus used 2017 as the base year (prior to COVID-19) and 2020 as the observation year (during COVID-19).
We used three data sources. First, we collected data from the Eurostat database on e-learning (e.g., the percentage of people taking an online course). Second, we collected data from the Oxford COVID-19 Government Response Tracker (OxCGRT) (e.g., the Average Stringency Index) as an indicator of the severity of the response to the COVID-19 outbreak. Third, we used the Gross Domestic Product (GDP) per capita, which is a good indicator of economic development. The severity indices [38] were taken from the Oxford COVID-19 Government Response Tracker (OxCGRT). The severity index (Avg_string_index) represents the average measure based on 9 response indicators (closure of schools, closure of workplaces, cancellation of public events, restrictions on meetings, closure of public transport, requests to stay at home, restrictions on domestic movement, international travel restrictions, and public information campaigns). In contrast, the strict reopening index (SI_reopen) uses the same 9 response indicators but measures the days a country was fully open. The research variables are explained in Table 1 for both 2017 and 2020.

Table 1.
Research variables.
3.2. Methodological Process
Table 2 shows the detailed methodological framework, which consisted of three phases. The table includes the following elements of the research questions defined in the introduction: the conjecture of the research questions, observed variables, data sources used, statistical methods, expected results of the analysis, and expected conclusions.
Table 2.
Detailed methodological framework.
For example, the second research question (RQ2) examines whether European countries implemented e-learning uniformly in the periods before and during the pandemic.
It was assumed that European countries could be divided into homogeneous groups based on the e-learning indicators in the periods before and during the pandemic.
The e-learning indicators from Eurostat for 2017 and 2020 were used and analyzed using fuzzy C-means clustering and ANOVA.
We assumed that the differences in the e-learning indicators between the 2020 and 2017 clusters indicated that the level of e-learning was not uniform across European countries, with different levels of implementation of e-learning in the periods before and during the pandemic.
Figure 1 shows a summary of the methodological framework, which consisted of three steps.
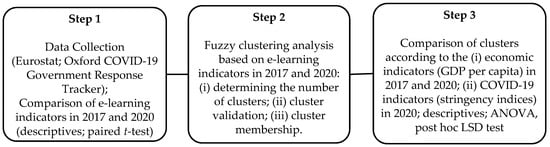
Figure 1.
Summary of methodological framework. Source: Authors’ work.
First, in Step 1, the descriptive statistics of the e-learning indicators were calculated, comparing the e-learning indicators in 2017 and 2020 using box plots and t-paired tests.
Second, the fuzzy C-means clustering analysis identified the research clusters for 2017 and 2020. In addition, ANOVA was performed for the e-learning indicators in 2017 and 2020 and a comparison is shown on a country map.
Third, we compared the cluster members using stringency indicators representative of the severity of the pandemic response and GDP per capita using descriptive statistics, ANOVA, and a post hoc LSD test.
3.2.1. Step 1: Analysis of E-Learning in 2017 and 2020 in Selected European Countries
We compared the level of e-learning in European countries using a descriptive analysis for 2017 and 2020, including all EU countries, as well as Iceland, Kosovo, Montenegro, Northern Macedonia, Switzerland, Turkey, Serbia, and the United Kingdom. The descriptive analysis, box plots, and t-paired tests were used to compare the e-learning variables for 2017 and 2020.
3.2.2. Step 2: Fuzzy C-Means Clustering Analysis of E-Learning Indicators in 2017 and 2020
Cluster analysis is widely used to study the digital divide and national differences in technology use [39]. In this paper, we used fuzzy C-means clustering analysis, a technique developed by Jim Bezdek [40] in 1973 and improved and extended in 1981 [41,42]. The main objective of this technique is to overcome the uncertainty and imprecision of data sources and research hypotheses. Unlike other methods such as k-means, fuzzy C-means clustering allows the researcher to represent data points in different clusters based on probability [43]. The fuzzy C-means clustering algorithm uses fuzzy partitioning so that the data points can belong to each group with different degrees of 0 and 1. It is also suitable for the case of unit variability, making it a good solution for studying the digital divide [44,45,46].
The fuzzy C-means clustering algorithm has been widely used for e-learning analysis [47,48,49]. As suggested by [42], this algorithm was selected as a suitable method for research due to its ability to generate approximate solutions in a more expedient manner, as well as its ability to address problems related to understanding patterns, incomplete/noisy data, mixed-media information, and human interaction.
Fuzzy C-means clustering was used to identify clusters of European countries according to the e-learning indicators for 2017 and 2020. The following steps used in the fuzzy C-means clustering analysis were based on [50].
Firstly, a value for 𝑐 was fixed, where 𝑐 is (2 < 𝑐 < 𝑛), followed by selecting the value for parameter 𝑚′ to initialize the partition matrix, 𝑈-(0). Each step was labeled as 𝑟, where 𝑟 = 0, 1, 2…𝑡. In the next phase, the center vector {,-𝑖.} for each step 𝑐 was calculated, as in Equation (1):
where
is the degree of membership of in the cluster j,
is the ith of the d-dimensional measured data,
is the d-dimensional center of the cluster.
In the next phase, the distance matrix was calculated:
In the final phase, the partition matrix needed to be updated for the step, as follows:
if otherwise, return to STEP 2 by updating the cluster centers and grades for the data point.
Source: Authors’ work based on [45].
JASP ver. 0.17.1, the statistical software for fuzzy C-means clustering, was used to perform the cluster analysis and investigate the heterogeneity of European countries in terms of e-learning. The variables that characterize the level of e-learning described in Table 1 were used for clustering. The appropriate number of clusters was determined using the elbow technique and the homogeneity of the clusters was assessed using a t-Distributed Stochastic Neighbor Embedding (t-SNE) cluster plot. The following training settings were used: maximum number of iterations (25), fuzziness parameter (2), and optimization of the number of clusters (Silhouette optimization).
3.2.3. Step 3: The Economic and COVID-19 Indicators in E-Learning Clusters in 2017 and 2020
In the third step, in addition to the results from step 2, the economic and COVID-19 severity indicators were considered as proxies for the severity of the response to the pandemic. First, the GDP per capita in 2017 and 2020 were compared between clusters using ANOVA and a post hoc analysis. Second, the COVID-19 severity indices (the average severity index and the severity index at the reopening of the country) were compared between clusters in 2020 using ANOVA and a post hoc analysis. A post hoc LSD test was used to detect specific differences between individual clusters [51].
4. Results
This section presents the research results of the three steps described above.
4.1. Step 1: Analysis of E-Learning in 2017 and 2020 in Selected European Countries
In the first step, we analyzed the e-learning indicators in 2017 and 2020 in selected European countries to address the first research question (RQ1). Table 3 shows the descriptive statistics for the e-learning indicators in 2017 and 2020.
Table 3.
Descriptive statistics for e-learning indicators in 2017 and 2020.
All e-learning indicators showed a strong increase in 2020 compared to 2017. The highest increase was in the variable representing people taking an online course (any subject) or using online learning materials (ONLINE_C), which increased by 7.7%. Figure 2 shows the mean values of the e-learning indicators in 2017 and 2020.
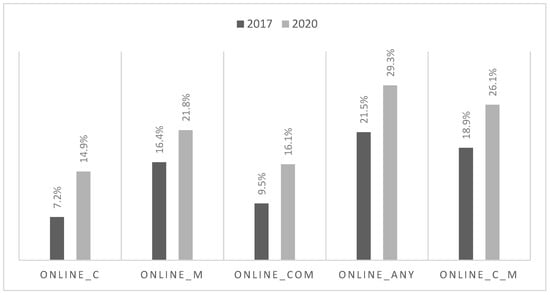
Figure 2.
Mean values of e-learning indicators in 2017 and 2020. Source: Authors’ work based on Eurostat data.
Table 4 shows the paired samples t-test. The differences in the e-learning indicators between 2020 and 2017 were significantly below the 1% level.
Table 4.
Paired samples t-test of e-learning indicators in 2020 compared to 2017.
The largest difference (7.647) was observed in the variable measuring the percentage of people taking an online course (any subject) (ONLINE_C). In contrast, the smallest difference (3.265) was observed in the variable measuring the percentage of individuals who used online learning materials (ONLINE_M). This result probably indicates that during the pandemic, the use of e-learning increased the most in formal education (measured by participation in an online course). Informal education (measured by the use of online learning materials), on the other hand, fell behind.
These results were confirmed by Cohen’s d, which relates the difference in means to the variability. Cohen’s d is calculated as the ratio between the mean differences and the pooled standard deviation. A higher Cohen’s d indicates that the mean difference is greater than the variability measured by the pooled standard deviation. The variable measuring the percentage of people taking an online course (any subject) (ONLINE_C) had the highest Cohen’s d value (1.957). In contrast, the lowest value (0.864) was shown for the variable measuring the percentage of individuals who used online learning materials (ONLINE_M).
Figure 3 shows the box plots for the e-learning indicators in 2017 and 2020. It can be seen that for the majority of variables, the country listed at number 14 (Iceland) was the biggest outlier, followed by the countries numbered 7 (Denmark) and 9 (Finland) in 2020 and 31 (Switzerland) in 2017.
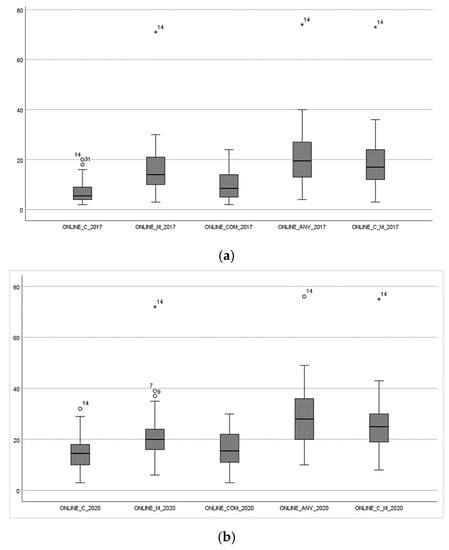
Figure 3.
Box plots for e-learning indicators in (a) 2017, and (b) 2020. Note: 14—Iceland; 7—Denmark; 31—Switzerland; 9—Finland. Source: Authors’ work based on Eurostat data; ⋆ extreme outliner; ° mild outlier.
4.2. Step 2: Fuzzy C-Means Clustering Analysis of E-Learning Indicators for 2017 and 2020
In the second step, we used the fuzzy C-means clustering analysis to divide the European countries into homogeneous groups. The validity of the cluster was determined using similarity measures that evaluated intensity, connectivity, and distance. The elbow method was used to determine the number of clusters. In addition, the validity of the cluster solution was demonstrated using a t-SNE map by visualizing the map in a high-dimensional space. ANOVA was used to confirm the relevance of the e-learning variables in the cluster analysis.
4.2.1. Determining the Number of Clusters
Figure 4 shows the plot of the elbow method. This method is used to determine the number of clusters using indicators such as the Akaike Information Criterion (AIC), Bayesian Information Criterion (BIC), and Within-Cluster Sum of Squares (WSS). The AIC and BIC are measures of model performance that are used to determine the complexity of a model and WSS measures the distance of each cluster observation from the cluster center [52]. The elbow plot shows (on the y-axis) the AIC, BIC, and WCSS values for different cluster numbers (on the x-axis). When an elbow shape is observed in a graph, the number of clusters at which the elbow is formed is selected. This location is called the elbow point. Increasing the number of clusters beyond the elbow point does not significantly decrease the AIC, BIC, or WSS. The first elbow can be seen at three, which means that the solution with three clusters is optimal for the 2017 and 2020 datasets.
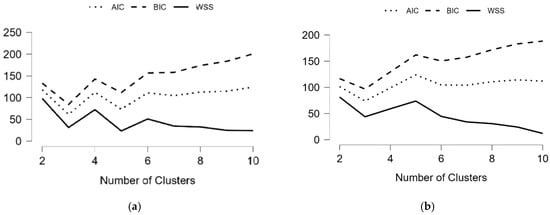
Figure 4.
Elbow method plots for (a) 2017, and (b) 2020 to determine the number of clusters. Source: Authors’ work based on Eurostat data.
4.2.2. Cluster Validation
t-SNE is a method used to plot high-dimensional data, where each point is assigned a position on a two- or three-dimensional graph. The approach is a variant of Stochastic Neighbor Embedding (SNE), which is much easier to optimize and produces much better visualizations [53]. t-SNE can capture a significant portion of the local structure of high-dimensional data while displaying the global structure, such as clusters at many scales, using an unsupervised machine learning algorithm. It shows the probability distribution of similar data points, which are later transferred into clusters. Figure 5 shows the t-SNE cluster plot for the 2017 and 2020 cluster solutions. Since the cluster members shown in different colors are close to each other, the plot shows that the cluster solutions are valid.
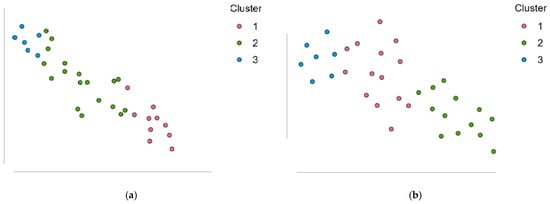
Figure 5.
the -SNE cluster plots for the (a) 2017, and (b) 2020 cluster solutions. Source: Authors’ work based on Eurostat data.
The cluster solution with three clusters had the optimal AIC and BIC values, as shown in Figure 4. Table 5 shows the AIC, BIC, and Silhouette indicators of the fuzzy C-Means clustering solution for 2017 and 2020, which measured whether the data were interpreted consistently within the clusters [54]. The Silhouette score ranged from −1 to 1 and should be maximized to obtain the optimal clustering solution, whereas the BIC and AIC values should be minimized. All three indicators performed better for the solution calculated for 2020 than for the one calculated for 2017.
Table 5.
AIC, BIC, and Silhouette indicators of the fuzzy C-means clustering solution for 2017 and 2020.
Table 6 shows additional evaluation metrics for the cluster solutions for 2017 and 2020: Pearson’s γ, the Calinski–Harabasz index, the Dunn index, and the entropy.
Table 6.
Evaluation metrics of the fuzzy C-means clustering solution for 2017 and 2020.
Pearson’s γ-measure determines the Pearson correlation for all pairwise distances against a vector of ones and zeros, where 0 indicates that they are in the same cluster and 1 indicates that they are in different clusters [55]. According to the Calinski–Harabasz index, successful clustering has the highest proportion of variation that the clusters can explain [56]. This measure compares the sum of squares between and within clusters. The Dunn index is based on the dissimilarity of clusters and the maximum diameter [57]. Finally, a highly ordered system, such as a dense cluster solution, has very low entropy and a highly disordered system has high entropy [58]. Based on all the evaluation metrics, except for the entropy, the density of the clusters increased in 2020 compared to 2017.
Table 7 shows the ANOVA results for the e-learning indicators for 2017 and 2020. The ANOVA compared the variances between the means of the different e-learning variables used in the study. The significance value indicates whether the clusters differed from each other with respect to the respective e-learning measure.
Table 7.
ANOVA results of the differences in e-learning for the cluster solutions (2017 and 2020).
In this study, all variables were found to have statistical significance below the 1% level, indicating that the differences between clusters were statistically significant for both 2017 and 2020.
4.2.3. Cluster Solution
Table 8 shows the fuzzy C-means clustering solutions for 2017 and 2020. The table contains information about the cluster size, cluster heterogeneity, and corresponding sum of squares.
Table 8.
Fuzzy C-means clustering solutions for 2017 and 2020.
The results show that Cluster 1 in 2017 and Cluster 2 in 2020 had the highest explained proportions of within-cluster heterogeneity and within-sum of squares. On the other hand, in both 2017 and 2020, Cluster 3 had the lowest explained proportion of within-cluster heterogeneity and within-sum of squares.
Table 9 shows the mean values of the e-learning indicators for the clusters in 2017 and 2020, which are also shown in Figure 6. The mean values of all the variables increased for all clusters from 2017 to 2020. The best-performing e-learning indicator for each cluster was the variable measuring the percentage of people doing any e-learning activities (ONLINE_ANY) with the highest mean value overall. The mean values of all variables measuring e-learning behavior were the highest for Cluster 1 and the lowest for Cluster 3.
Table 9.
E-learning indicators according to clusters in 2017 and 2020.
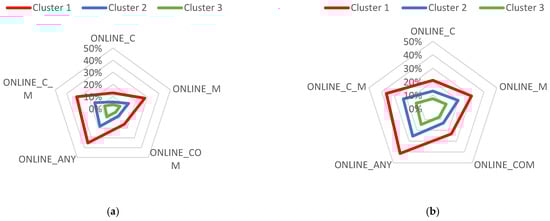
Figure 6.
Mean values of e-learning indicators according to clusters in (a) 2017, and (b) 2020. Source: Authors’ work based on Eurostat data.
4.2.4. Cluster Members and Characteristics
Table 10 lists the countries by cluster. There was an increase in the number of countries in Cluster 1 (from 10 to 14) and Cluster 3 (from 6 to 7), whereas there was a decrease in the number of countries in Cluster 2 (from 18 to 13). There was also a change in the participating countries in each cluster.
Table 10.
Countries by cluster in 2017 and 2020.
Several countries switched from Cluster 2 in 2017 to Cluster 1 in 2020 (Belgium, Denmark, Portugal, Switzerland). In addition, only the United Kingdom moved from Cluster 1 in 2017 to Cluster 2 in 2020, whereas Croatia and Hungary moved from Cluster 3 in 2017 to Cluster 2 in 2020, indicating a moderately developed European country. Finally, Cluster 3 represented the lowest level of e-learning among the European countries in the sample and the Czech Republic, Romania, and Serbia moved from Cluster 2 in 2017 to Cluster 3 in 2020.
Figure 7 shows a map of European countries. Red represents Cluster 1, blue represents Cluster 2, and green represents Cluster 3.
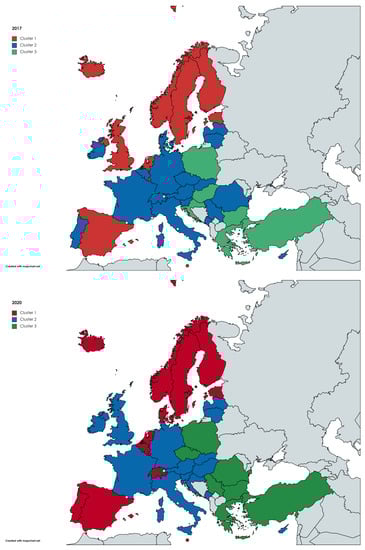
Figure 7.
European countries according to clusters in 2017 (upper), and 2020 (below). Source: Authors’ work based on Eurostat data using mapchart.net.
In summary, the results of this section provide information that addresses the second research question (RQ2), which examines the extent of the homogeneity of e-learning in European countries during the pandemic. The research results show that the cluster solution generated by fuzzy C-means clustering for 2017 and 2020 had a high degree of homogeneity and that the countries in the periods both before and during the pandemic can be grouped into meaningful clusters.
4.3. Step 3: The Impact of Economic and COVID-19 Indicators on E-Learning Clusters for 2017 and 2020
Table 11 shows the descriptive statistics for the GDP per capita for 2017 and 2020.
Table 11.
Descriptive statistics for the economic indicator (Gross Domestic Product per capita in EUR) in 2017 and 2020 according to clusters.
Cluster 1 had the highest mean GDP per capita in 2017, whereas Cluster 2 had the highest mean GDP per capita in 2020.
Cluster 3 consistently had the lowest GDP per capita in both 2017 and 2020. These results are consistent with countries shifting from one cluster to another, such as the United Kingdom’s shift from Cluster 1 to Cluster 2 from 2017 to 2020.
The results of the Shapiro–Wilk test show that the GDP per capita was normally distributed across all clusters in both of the observed years, allowing for the use of ANOVA to test the significance of the differences between clusters.
The ANOVA results (Table 12) show that the differences in GDP per capita among cluster members in 2017 are statistically significant at the 5% level. However, in 2020, the differences in GDP per capita among cluster members are no longer statistically significant.
Table 12.
ANOVA results according to clusters for economic indicators and COVID-19 indices.
Table 13 shows the descriptive statistics for the COVID-19 severity indicators used as proxies for the severity of the pandemic response for the clusters in 2020.
Table 13.
Descriptive statistics for average stringency index and average stringency index in days of reopening in 2020 according to clusters.
The COVID-19 indicators are represented by the average severity index (Avg_stringency_index) and the severity index for reopening the country (SI_days_reopen).
One might expect that stringency, as an indicator of the severity of the response to the pandemic, would be the highest in countries that implemented the most e-learning during the COVID-19 pandemic, as the countries most affected by the pandemic had a greater need for e-learning as a measure to overcome isolation. However, the results are counterintuitive.
Countries in Cluster 1, where e-learning was most prevalent, had the lowest average stringency index (51.869) and the highest stringency index for reopening the country (85.470). These results are actually the opposite of what one might expect given that the lower average stringency index and the higher stringency index for reopening the country indicate a less severe impact of the pandemic. Considering that the countries from Cluster 1 are the most economically developed, they could still push for the adoption of e-learning even if they were not the most affected by the pandemic.
Table 14 shows the ANOVA results for the differences between the average severity index (Avg_stringency_index) and the severity index for reopening the country (SI_days_reopen). The results indicate that there are significant differences between cluster members in 2020 at the 10% level for the average stringency index and at the 5% level for the severity index for reopening the country.
Table 14.
ANOVA analysis according to clusters of economic indicators and COVID-19 indices.
Although the ANOVA provided information about whether there were significant differences between the clusters, it did not provide accurate information about specific clusters that were significantly different. For this purpose, we used the Least Significant Difference (LSD) post hoc test (Table 15). The results showed that the economic indicator (GDP per capita in EUR) influenced the relationship between Cluster 2 and Cluster 3 by 1% in 2017. Moreover, COVID-19 indicators, such as the average stringency index in 2020, had a significant relationship between Cluster 1 and Cluster 2 of below 5%. On the other hand, the stringency reopening index showed a statistically significant relationship between Cluster 1 and Cluster 2 of below 1% and between Cluster 3 and Cluster 1 of below 5%.
Table 15.
Post hoc LSD test for differences between clusters according to the economic indicator and stringency indices.
The results presented provide insights into the third research question (RQ3), which examines the estimated impact of GDP per capita on e-learning before and during the COVID-19 pandemic. The results suggest that economic development had a significant impact on e-learning adoption in the pre-pandemic period while it was no longer relevant during the pandemic. In contrast, during the pandemic, stringency measures differed statistically across clusters. This indicates that the pandemic had a greater and more positive impact on the use of e-learning in the countries in the sample that were grouped into clusters based on economic prosperity. However, the effects were counterintuitive, suggesting that the countries with the less stringent pandemic measures were able to use e-learning to a greater extent, likely due to their higher levels of economic development.
5. Discussion and Conclusions
5.1. Summary of the Research
Due to the intensity of the COVID-19 outbreak, educational institutions, among others, experienced levels of social isolation never before experienced. On the positive side, digital technologies, such as cloud computing and video broadcasting, have accelerated the adoption of e-learning. However, the speed and effectiveness of e-learning adoption during the pandemic varied across countries.
This article examined the adoption of e-learning in European countries before and during the pandemic and the relationship between the pandemic, e-learning, and economic development. The research findings suggest that before and during the pandemic, economically and digitally developed nations led the way in e-learning adoption.
First, we compared the adoption of e-learning in European countries before and during the pandemic to address the first research question (RQ1). The overall average increase for the e-learning variables for the countries sampled in this research was 6.94%. The largest increase was observed for the variable ONLINE C, which represents those taking an online course (any topic) or using online learning materials, with an increase of 7.7%.
Second, fuzzy C-Means clustering was used to create clusters of European countries for two periods (before and during the pandemic) to investigate the homogeneity of European countries in adopting e-learning and address the second research question (RQ2). Using the elbow method in combination with different validity indicators, three clusters were extracted for the two periods, confirming the strong homogeneity among European countries in terms of e-learning adoption. The countries in Cluster 1 were mainly located in Northern Europe and were the most advanced in terms of economic development and e-learning adoption. The countries in Cluster 2 were mainly located in Central Europe and were the second best in terms of economic development and e-learning adoption. The countries in Cluster 3 were mainly located in Southern Europe and were behind in terms of economic development and e-learning adoption. Several countries moved out of the different clusters during the COVID-19 pandemic.
The degree of homogeneity was the highest for Cluster 3, which in 2017, included Bulgaria, Croatia, Greece, Hungary, Poland, and Turkey. The countries in Cluster 3 remained almost unchanged in 2020, with the Czech Republic, Romania, and Serbia joining from Cluster 1, whereas Croatia moved to Cluster 2. The second-highest homogeneity was found for Cluster 1, whose structure improved in 2020 compared to 2017. The countries belonging to Cluster 1 in 2020 were Austria, Croatia, Cyprus, France, Germany, Hungary, Ireland, Italy, Latvia, Lithuania, Montenegro, Slovakia, Slovenia, and the United Kingdom. Finally, Cluster 2 was found to have the lowest homogeneity.
Third, we compared the GDP per capita as an indicator of economic development and the severity indices as an indicator of the severity of the response to the pandemic in the different clusters to address the third research question (RQ3). The results indicate that the countries with the highest average GDP per capita both before and during the pandemic rapidly adopted e-learning, even though they had the least severe response to the pandemic. At the same time, less-developed countries had a more rigorous response to the pandemic due to their limited healthcare resources but were still behind in terms of e-learning adoption.
5.2. Main Conclusions
The main conclusions of this research are as follows.
First, the Mathews effect on e-learning adoption persisted during the pandemic [5]. Thus, the digital divide was evident both before and during the pandemic. The countries that were ahead in e-learning adoption before the pandemic were also ahead during the pandemic, and the countries that were behind in e-learning before the pandemic were also behind during the pandemic.
Second, there were some exceptions in e-learning adoption and cluster membership in terms of countries’ mobility from less advanced to more advanced clusters (Table 10). Several countries, such as Belgium, Denmark, Portugal, Switzerland, and Croatia, advanced their use of e-learning due to the pandemic. These countries moved up from the lower clusters to the higher clusters (e.g., from Cluster 3 to Cluster 2 in the case of Croatia). On the other hand, only a few countries moved from the more advanced clusters to the less advanced ones.
Third, the countries with the highest average GDP per capita both before and during the pandemic rapidly adopted e-learning, although they had the weakest response to the pandemic. However, the differences between clusters in terms of average GDP per capita were statistically different only before the pandemic. During the pandemic, on the other hand, the differences were no longer statistically significant, even though the most developed countries had the highest penetration of e-learning. Less-developed countries were more responsive to the pandemic due to their poor healthcare but they also fell behind in e-learning adoption.
5.3. Practical Implications
The following are practical recommendations for implementing the conclusions summarized above.
First, strong policy initiatives should be made at the EU level to address the close relationship between economic development and e-learning adoption. These policies should aim to use e-learning to better integrate students from geographically distant areas into educational institutions at all levels, as well as to better integrate students with disabilities. In addition to top-down initiatives, a bottom-up approach could also be used to develop resilient e-learning infrastructures at the country level.
Second, policymakers should examine the countries that rapidly improved their adoption of e-learning and moved from the less-advanced cluster to the more advanced cluster. This investigation could focus on micro and macro initiatives and develop a roadmap of best practices to improve e-learning adoption.
Third, although the DESI index currently covers a broad spectrum (human capital, connectivity, digital technology integration, and digital public services), it does not yet include indicators to measure e-learning. There have been proposals to complement the DESI index with a new measurement that reflects e-learning in all dimensions. For example, one of the e-learning indicators already covered by Eurostat (e.g., use of online courses) could be included in the human capital dimension.
Finally, this study could be of interest to software companies that specialize in e-learning, as their market grew strongly after the COVID-19 pandemic. Market-driven initiatives have been proven to be a valuable driver for bridging the digital divide, and their impact should be encouraged and further studied.
5.4. Research Limitations and Future Research Directions
The limitations of this study stem from the geographic and temporal coverage, as well as the research methodology.
First, the research was conducted on a sample of European countries. Therefore, examining a broad sample of countries would provide a more comprehensive perspective on the research questions. It would be interesting to compare data from countries outside Europe with the results of this research to verify that the GDP variable did not affect the adoption of e-learning in less-developed countries after the COVID-19 pandemic.
Second, the comparison of the periods before and during the pandemic only focused on two time periods. Examining a longer time series would provide insights into issues that were not covered by this study, e.g., in addition to examining the increase in e-learning, the year-to-year changes in the longer time series could also be compared, providing insights into the rate of change.
Author Contributions
Conceptualization, M.P.B. and I.J.; methodology, M.P.B. and M.M.; software, I.J.; validation, M.P.B., I.J. and B.J.; formal analysis, M.P.B. and I.J.; investigation, B.J.; resources, M.M.; data curation, I.J.; writing—original draft preparation, I.J.; writing—review and editing, M.P.B., B.J. and M.M.; visualization, B.J.; supervision, M.P.B.; project administration, B.J. All authors have read and agreed to the published version of the manuscript.
Funding
This research received no external funding.
Institutional Review Board Statement
Not applicable.
Informed Consent Statement
Not applicable.
Data Availability Statement
Data are available from the authors upon request.
Conflicts of Interest
The authors declare no conflict of interest.
References
- Bach, M.P.; Zoroja, J.; Vukšić, V.B. Review of corporate digital divide research: A decadal analysis (2003–2012). Int. J. Inf. Syst. Proj. Manag. 2022, 1, 41–55. [Google Scholar] [CrossRef]
- Bach, M.P.; Zoroja, J.; Vukšić, V.B. Determinants of Firms’ Digital Divide: A Review of Recent Research. Procedia Technol. 2013, 9, 120–128. [Google Scholar] [CrossRef]
- Cullen, R. Addressing the digital divide. Online Inf. Rev. 2001, 25, 311–320. [Google Scholar] [CrossRef]
- Cruz-Jesus, F.; Oliveira, T.; Bacao, F. Digital divide across the European Union. Inf. Manag. 2021, 49, 278–291. [Google Scholar] [CrossRef]
- Kovács, T.Z.; Bittner, B.; Huzsvai, L.; Nábrádi, A. Convergence and the Matthew Effect in the European Union Based on the DESI Index. Mathematics 2022, 10, 613. [Google Scholar] [CrossRef]
- Maatuk, A.M.; Elberkawi, E.K.; Aljawarneh, S.; Rashaideh, H.; Alharbi, H. The COVID-19 pandemic and E-learning: Challenges and opportunities from the perspective of students and instructors. J. Comput. High. Educ. 2022, 34, 21–38. [Google Scholar] [CrossRef]
- Šumak, B.; Heričko, M.; Pušnik, M. A meta-analysis of e-learning technology acceptance: The role of user types and e-learning technology types. Comput. Hum. Behav. 2011, 27, 2067–2077. [Google Scholar] [CrossRef]
- Liu, S.H.; Liao, H.L.; Pratt, J.A. Impact of media richness and flow on e-learning technology acceptance. Comput. Educ. 2009, 52, 599–607. [Google Scholar] [CrossRef]
- Hunady, J.; Pisár, P.; Vugec, D.S.; Bach, M.P. Digital Transformation in European Union: North is leading, and South is lagging behind. Int. J. Inf. Syst. Proj. Manag. 2022, 10, 58–81. [Google Scholar] [CrossRef]
- Siriopoulos, C.; Pomonis, G.A. Alternatives to “Chalk and Talk”: Active Vs. Passive Learning—A Literature Review of the Debate. SSRN Electron. J. 2006. [Google Scholar] [CrossRef]
- Malin, M. Enhancing lecture presentation through tablet technology. Account. Res. J. 2014, 27, 212–225. [Google Scholar] [CrossRef]
- Głodowska, A.; Wach, K.; Knežević, B. Pros and Cons of e-Learning in Economics and Business in Central and Eastern Europe: Cross-country Empirical Investigation. Bus. Syst. Res. Int. J. Soc. Adv. Innov. Res. Econ. 2022, 13, 28–44. [Google Scholar] [CrossRef]
- Shallcross, D.E.; Harrison, T.G. Lectures: Electronic presentations versus chalk and talk—A chemist’s view. Chem. Educ. Res. Pract. 2007, 8, 73–79. [Google Scholar] [CrossRef]
- Engzell, P.; Frey, A.; Verhagen, M.D. Learning loss due to school closures during the COVID-19 pandemic. Proc. Natl. Acad. Sci. USA 2021, 118, e2022376118. [Google Scholar] [CrossRef]
- Brozović, M.; Ercegović, M.; Meeh-Bunse, G. e-Learning in Higher Institutions and Secondary Schools during COVID-19: Crisis Solving and Future Perspectives. Bus. Syst. Res. Int. J. Soc. Adv. Innov. Res. Econ. 2022, 13, 45–71. [Google Scholar] [CrossRef]
- Kern, E.; Wehmeyer, E. The Palgrave Handbook of Positive Education; Springer Publishing: Berlin/Heidelberg, Germany, 2021. [Google Scholar]
- Grah, B.; Penger, S. COVID-19 and the Challenges of Transition to Online Learning. ENTRENOVA-ENTerprise REsearch InNOVAtion 2021, 7, 134–148. [Google Scholar] [CrossRef]
- Coman, C.; Țîru, L.G.; Meseșan-Schmitz, L.; Stanciu, C.; Bularca, M.C. Online Teaching and Learning in Higher Education during the Coronavirus Pandemic: Students’ Perspective. Sustainability 2020, 12, 10367. [Google Scholar] [CrossRef]
- Favale, T.; Soro, F.; Trevisan, M.; Drago, I.; Mellia, M. Campus traffic and e-Learning during COVID-19 pandemic. Comput. Netw. 2020, 176, 107290. [Google Scholar] [CrossRef]
- Dečman, N.; Rep, A. Digitalization in Teaching Economic Disciplines: Past, Current and Future Perspectives. Bus. Syst. Res. Int. J. Soc. Adv. Innov. Res. Econ. 2022, 13, 1–7. [Google Scholar] [CrossRef]
- Vaneva, M.; Bojadjiev, M.I. Doing Business in the ‘New Normal’: COVID-19 School Leaders’ Language Manners. ENTRENOVA-ENTerprise REsearch InNOVAtion 2021, 7, 401–409. [Google Scholar] [CrossRef]
- Leem, B.H. An effect of value co-creation on student benefits in COVID-19 pandemic. Int. J. Eng. Bus. Manag. 2021, 13, 18479790211058320. [Google Scholar] [CrossRef]
- Eurostat Statistics Explained. Available online: https://ec.europa.eu/eurostat/statistics-explained/index.php?title=Government_expenditure_on_education (accessed on 20 January 2023).
- Tadesse, S.; Muluye, W. The impact of COVID-19 pandemic on education system in developing countries: A review. Open J. Soc. Sci. 2020, 8, 159–170. [Google Scholar] [CrossRef]
- Darling-Hammond, L.; Flook, L.; Cook-Harvey, C.; Barron, B.; Osher, D. Implications for educational practice of the science of learning and development. Appl. Dev. Sci. 2019, 24, 97–140. [Google Scholar] [CrossRef]
- UNESCO Institute for Lifelong Learning. Embracing a Culture of Lifelong Learning: Contribution to the Futures of Education Initiative: Report: A Transdisciplinary Expert Consultation; UNESCO Institute for Lifelong Learning: Hamburg, Germany, 2020; Available online: https://unesdoc.unesco.org/ark:/48223/pf0000374112 (accessed on 8 January 2023).
- Barrot, J.S.; Llenares, I.I.; del Rosario, L.S. Students’ online learning challenges during the pandemic and how they cope with them: The case of the Philippines. Educ. Inf. Technol. 2021, 26, 7321–7338. [Google Scholar] [CrossRef]
- Zakota, Z. Analysing Web 2.0 Usage of High School Students in the Partium Region before the COVID-19 Pandemic. ENTRENOVA-ENTerprise REsearch InNOVAtion 2020, 6, 258–264. [Google Scholar]
- Singh, S.; Singh, U.S.; Nermend, M. Decision analysis of e-learning in bridging digital divide for education dissemination. Procedia Comput. Sci. 2022, 207, 1970–1980. [Google Scholar] [CrossRef]
- Pikoos, T.; Buzwell, S.; Sharp, G.; Rossell, S. The ‘Zoom Effect’: Exploring the Impact of Video-Calling on Appearance Dissatisfaction and Interest in Cosmetic Treatment during the COVID-19 Pandemic. Aesthet. Surg. J. 2021, 41, 2066–2075. [Google Scholar] [CrossRef]
- Shin, M.; Hickey, K. Needs a Little TLC: Examining College Students’ Emergency Remote Teaching and Learning Experiences during COVID-19. J. Furth. High. Educ. 2020, 45, 973–986. [Google Scholar] [CrossRef]
- Watermeyer, R.; Crick, T.; Knight, C.; Goodall, J. COVID-19 and Digital Disruption in UK Universities: Afflictions and Affordances of Emergency Online Migration. High. Educ. 2020, 81, 623–641. [Google Scholar] [CrossRef] [PubMed]
- Bashir, A.; Bashir, S.; Rana, K.; Lambert, P.; Vernallis, A. COVID-19 Adaptations; the Shifts Towards Online Learning, Hybrid Course Delivery and the Implications for Biosciences Courses in the Higher Education Setting. Front. Educ. 2021, 6, 711619. [Google Scholar] [CrossRef]
- Cunha, M.N.; Chuchu, T.; Maziriri, E. Threats, Challenges, and Opportunities for Open Universities and Massive Online Open Courses in the Digital Revolution. Int. J. Emerg. Tech. Learn 2020, 15, 191–204. [Google Scholar] [CrossRef]
- Chatterjee, R.; Correia, A.P. Online Students’ Attitudes Toward Collaborative Learning and Sense of Community. Am. J. Distance Educ. 2019, 34, 53–68. [Google Scholar] [CrossRef]
- Czerniewicz, L.; Trotter, H.; Haupt, G. Online teaching in response to student protests and campus shutdowns: Academics’ perspectives. Int. J. Educ. Technol. High. Educ. 2019, 16, 43. [Google Scholar] [CrossRef]
- Zhang, W.F.; Stephen, P.; Theriault, J.F.; Wang, R.; Lin, S.X. Novel coronavirus polymerase and nucleotidyl-transferase structures: Potential to target new outbreaks. J. Phys. Chem. Lett. 2020, 11, 4430–4435. [Google Scholar] [CrossRef]
- Ma, Y.; Mishra, S.R.; Han, X.K.; Zhu, D.S. The relationship between time to a high COVID-19 response level and timing of peak daily incidence: An analysis of governments’ Stringency Index from 148 countries. Infect. Dis. Poverty 2021, 10, 96. [Google Scholar] [CrossRef]
- Pejić Bach, M.; Bertoncel, T.; Meško, M.; Suša Vugec, D.; Ivančić, L. Big Data Usage in European Countries: Cluster Analysis Approach. Data 2020, 5, 25. [Google Scholar] [CrossRef]
- Bezdek, J.C. Fuzzy Mathematics in Pattern Classification. Ph.D. Thesis, Graduate School, Cornell University, Ithaca, NY, USA, 1973. [Google Scholar]
- Bezdek, J.C.; Coray, C.; Gunderson, R.; Watson, J. Detection and characterization of cluster substructure i. linear structure: Fuzzy c-lines. SIAM J. Appl. Math. 1981, 40, 339–357. [Google Scholar] [CrossRef]
- Bezdek, J.C.; Coray, C.; Gunderson, R.; Watson, J. Detection and characterization of cluster substructure II. Fuzzy c-varieties and convex combinations thereof. SIAM J. Appl. Math. 1981, 40, 358–372. [Google Scholar] [CrossRef]
- Ghosh, S.; Kumar, S. Comparative Analysis of K-Means and Fuzzy C-Means Algorithms. Int. J. Adv. Comput. Sci. Appl. 2013, 4, 35–39. [Google Scholar] [CrossRef]
- Razavi Hajiagha, S.H.; Hashemi, S.S.; Amoozad Mahdiraji, H. Fuzzy C-means based data envelopment analysis for mitigating the impact of units’ heterogeneity. Kybernetes 2016, 45, 536–551. [Google Scholar] [CrossRef]
- Anggoro, F.; Caraka, R.E.; Prasetyo, F.A.; Ramadhani, M.; Gio, P.U.; Chen, R.-C.; Pardamean, B. Revisiting Cluster Vulnerabilities towards Information and Communication Technologies in the Eastern Island of Indonesia Using Fuzzy C Means. Sustainability 2022, 14, 3428. [Google Scholar] [CrossRef]
- Ziemba, P.; Becker, J. Analysis of the Digital Divide Using Fuzzy Forecasting. Symmetry 2019, 11, 166. [Google Scholar] [CrossRef]
- Wang, Q.; Liu, L.; Liu, Z.; Qiao, W.; Liu, F. Application of Fuzzy Clustering in Higher Education General Management Based on Internet Environment. Math. Probl. Eng. 2022, 2022, 3438666. [Google Scholar] [CrossRef]
- Xu, Z. College Students’ Mental Health Support Based on Fuzzy Clustering Algorithm. Mol. Imaging 2022, 2022, 5374111. [Google Scholar] [CrossRef]
- Parvathavarthini, S.; Sharvanthika, K.S.; Jagadeesh, M.; Kishore, B. Analysis of Student Performance in E-learning Environment using Crow search based Fuzzy clustering. In Proceedings of the 2nd International Conference on Smart Electronics and Communication (ICOSEC), Thottiyam, India, 7 October 2021. [Google Scholar] [CrossRef]
- Pejić Bach, M.; Kamenjarska, T.; Žmuk, B. Targets of phishing attacks: The bigger fish to fry. Procedia Comput. Sci. 2022, 204, 448–455. [Google Scholar] [CrossRef]
- Williams, L.J.; Abdi, H. Fisher’s least significant difference (LSD) test. Encycl. Res. Des. 2010, 218, 840–853. [Google Scholar]
- Nainggolan, R.; Perangin-angin, R.; Simarmata, E.; Tarigan, A.F. Improved the performance of the K-means cluster using the sum of squared error (SSE) optimized by using the Elbow method. J. Phys. Conf. Ser. 2019, 1361, 012015. [Google Scholar] [CrossRef]
- Kang, B.; García García, D.; Lijffijt, J.; Santos-Rodríguez, R.; De Bie, T. Conditional t-SNE: More informative t-SNE embeddings. Mach. Learn. 2020, 110, 2905–2940. [Google Scholar] [CrossRef]
- Jun, S.H.; Lee, S.J. Empirical Comparisons of Clustering Algorithms using Silhouette Information. Int. J. Fuzzy Log. Intell. Syst. 2010, 10, 31–36. [Google Scholar] [CrossRef]
- Mingrui, Z.; Wei, Z.; Sicotte, H.; Yang, P. A new validity measure for a correlation-based fuzzy c-means clustering algorithm. In Proceedings of the Annual International Conference of the IEEE Engineering in Medicine and Biology Society, Minneapolis, MN, USA, 3 September 2009. [Google Scholar] [CrossRef]
- Łukasik, S.; Kowalski, P.A.; Charytanowicz, M.; Kulczycki, P. Clustering using flower pollination algorithm and Calinski-Harabasz index. In Proceedings of the 2016 IEEE Congress on Evolutionary Computation (CEC), Vancouver, BC, Canada, 24–29 July 2016; IEEE: Piscataway, NJ, USA, 2016; pp. 2724–2728. [Google Scholar]
- Bezdek, J.C.; Pal, N.R. Cluster validation with generalized Dunn’s indices. In Proceedings of the 1995 Second New Zealand International Two-Stream Conference on Artificial Neural Networks and Expert Systems, Dunedin, New Zealand, 20–23 November 1995; IEEE: Piscataway, NJ, USA, 1995; pp. 190–193. [Google Scholar]
- Celeux, G.; Soromenho, G. An entropy criterion for assessing the number of clusters in a mixture model. J. Classif. 1996, 13, 195–212. [Google Scholar] [CrossRef]


Disclaimer/Publisher’s Note: The statements, opinions and data contained in all publications are solely those of the individual author(s) and contributor(s) and not of MDPI and/or the editor(s). MDPI and/or the editor(s) disclaim responsibility for any injury to people or property resulting from any ideas, methods, instructions or products referred to in the content. |
© 2023 by the authors. Licensee MDPI, Basel, Switzerland. This article is an open access article distributed under the terms and conditions of the Creative Commons Attribution (CC BY) license (https://creativecommons.org/licenses/by/4.0/).