Abstract
Floor-cleaning robots are becoming popular and operating in public places to ensure the places are clean and tidy. These robots are often operated in a dynamic environment that is less safe and has a high probability of ending up in accidents. Sound event-based context detection is expected to overcome drawbacks in a robot’s visual sensing to avoid a hazardous environment, especially in improper illumination and occlusion situations. Even though numerous studies in the literature discuss the benefits of sound-based context detection, there is no work reported related to context avoidance for cleaning robots. To this end, we propose a novel context avoidance framework based on a deep-learning method that can detect and classify a specific sound and localize the source from a robot’s frame to avoid that environment. The proposed model receives the spectrogram from the array of microphones as the input and produces two parallel outputs. The first output provides information about the spectrum class after running the classification task. The second output contains the localization message of the identified sound source. With the identity of the location that needs to be avoided, the proposed module will generate an alternative trajectory. The proposed model is evaluated in two real-world scenarios, wherein the model is trained to detect the escalator sound in the robot’s surroundings and avoid its location. In all considered scenarios, the developed system accomplished a significantly higher success rate in detecting and avoiding the escalator.
Keywords:
sound-based event detection; escalator detection; sound source localization; service robots; deep neural network; obstacle avoidance MSC:
68T40
1. Introduction
Floor-cleaning robots are becoming famous nowadays, and many robots are operating in public places as professional cleaners. The growth is attributed to the growing concern about maintaining proper hygiene following the COVID-19 pandemic outbreak, which is driving the adoption of autonomous professional cleaning robots, especially in commercial spaces such as retail stores, big box retailers, hospitals, and corporate offices. As the technologies such as artificial intelligence (AI) and visualization are getting developed at a rapid pace, adopting these technologies in cleaning robots improves efficiency and productivity. With such an increase in usage, the global Cleaning Robot Market is expected to gain market growth in the forecast period of 2022 to 2029 with a CAGR of 23.9% and is expected to reach USD 38,142.05 million [1]. Although there is a steep increase in the number of cleaning robots operating in public areas, these robots often encounter hazardous situations for themselves and neighboring humans. The major factor behind such a hazardous situation is the environment itself which is primarily uncontrollable and rapidly changing. So, it is expected that these robots should perform the cleaning task effectively while considering safety criticality. Aspects of safety criticality include the malfunction or failure of the system that may injure humans or damage the physical property and fail the assigned task [2].
To operate safely in a deployed environment, cleaning robots use their existing peripherals, such as cameras, LiDAR, and cliff sensors. With the equipped sensors, the robot usually avoids those hazardous environments using the following methods:
- Navigate in a known environment using a 2D or 3D map;
- Detect the hazardous situation during the operations.
However, the mapped environment changes rapidly in the mentioned procedures, wherein new hazards may appear, making robots hazardous. One exemplary instance of change in the map is where the workers perform maintenance or renovation works that may impact the robot’s safety. Another instance is the maps often fail to identify movable terrains, such as escalators and moving walkways, that are hazardous for robot operation [3]. The next procedure to avoid a hazardous environment is detecting such a context while the robot performs the given task. Real-time hazardous context detection can be achieved mostly by utilizing visual sensors such as cameras. Even in such detection methods, there are a few drawbacks as listed as follows [4]:
- Degradation in performance due to different lighting conditions;
- False prediction or detection when the features are changed;
- Impotence when there are fewer or no proper visual features.
To overcome these drawbacks in implementing visual aids is to use other modes of sensors. One viable sensor system that can be utilized to detect the safety context in an open environment is the microphone which can easily filter out the noise to extract the desired features perfectly [5]. This article introduces an acoustic-based approach to detecting the safety context for a cleaning robot around its working environment. The main objective of this study is to develop an acoustic-based safety context detection and avoidance framework that aids a cleaning robot in understanding and avoiding a scene that is considered hazardous for operation.
Sound-based scene understanding and event detection has emerged as a new research field in recent years [6]. So far, numerous studies have been reported in the literature focusing on sound event detection. To accomplish the objective of this study, merely detecting the sound event is insufficient. Additionally, it is essential to locate the sound source. This located sound source will be used to avoid detected hazardous scenes effectively. The execution of both detection and localization of sound events in an operating environment involves various levels of signal processing that have their challenges. To simplify this process, with the recent development in the field of artificial intelligence, researchers proposed distinct deep neural network models that can be trained to classify and locate the sound source [7]. Even though numerous DCNN-based sound event detection and localizing models have been proposed in the literature, most of these works are not targeted at detecting hazardous areas in a given environment. Moreover, none of the existing work was studied in the context of scene avoidance for cleaning robots.
To this end, we propose a novel hazardous scene avoidance framework based on the deep convolution neural network that can use a microphone to classify and localize a sound event that can possibly be a hazardous area. Once the event is detected, the framework generates an alternative path for the cleaning robot to avoid the hazardous area. This article introduces the technical details of the proposed framework, the system description of a cleaning robot wherein the proposed framework is implemented, and its conversion of theoretical concept to physical realization. The paper finally concludes with the evaluation of the proposed framework wherein the cleaning robot is deployed to detect and avoid an ascending and descending escalator as a case study in two distinct scenarios. With the above description, this article considered the following aspects as its main contributions:
- Development of a DCNN-based hazardous scene avoidance framework using acoustic sensors;
- Cleaning robot system development and the integration of the developed framework;
- Evaluation of the proposed system wherein the robot detects escalator sound and avoids it in two distinct scenarios.
To the best of our knowledge, this article presents the first systematic investigation into the state of the art on sound-based hazardous scene avoidance for cleaning robots. The work presented in this article exhibits our initial effort towards building a safe scene avoidance system for cleaning robots using unconventional sensors that can aid in avoiding harmful accidents in public places.
The rest of the article is structured as follows. Section 2 provides the related works. Section 3 presents an overview of the proposed sound-based scene avoidance framework. The network architecture is explained in Section 4. The experimental setup and data training are presented in Section 5. Section 6 exhibits the results of the proposed system. Finally, Section 7 concludes the results and future works.
2. Related Works
2.1. Floor Cleaning Robots
In recent years, the popularity of floor-cleaning robots in both industrial and domestic settings has grown due to their convenience, efficiency, and ability to save time and effort. Since 2002, Ref. [8] has already started to develop small floor-cleaning robots for household use. As time passes, the need for mobile floor cleaning robots in the house has become more and more necessary as the new generation becomes more involved in their work. In [9], it is mentioned that the development of independent robots for floor cleaning applications saves a significant amount of time in our daily routine. In addition, the cost of robot hardware is reduced, and cleaning modules are built on for specific tasks [10,11,12]. Besides the standard cleaning robots, Ref. [13] introduced a reconfigured flooring cleaning robot called hTetro which is able to transform into any of seven shapes (‘I’, ‘S’, ‘J’, ‘O’, ‘T’, ‘Z’, and ‘L’) to maximize floor coverage in narrow spaces between furniture. They can help improve the safety and productivity of a building by reducing the need for manual labor and letting workers focus on other tasks. They can also help keep a living or working space clean and healthy.
2.2. Obstacle Avoidance Frameworks for Robots
Obstacle avoidance plays an essential role in the navigation of cleaning robots, as the robot needs to sense and adapt to an unknown environment that requires a robust cognitive system. It allows the robot to navigate safely and efficiently through an environment [14]. To the present day, a number of obstacle avoidance sensors and algorithms have been implemented [15,16,17], and the performance and reliability of the cleaning robot have greatly improved. Besides that, Ref. [18] implement a dynamic movement primitive (DMP) framework to address how the robot reproduces the movement in the presence of an obstacle.
2.3. Sound-Based Event Detection and Localization
The classification and detection of audio events are gaining increasing attention in the scientific community. In certain situations, audio conveys more significant information than perception. In the context of audio retrieval, indexing, and multimedia event detection applications where audio is always used as a complementary source of information [19,20].
In the auditory system, the main functions are sound event detection (SED) and sound source localization (SSL). SSL focuses on finding the direction of a sound source. Research has been conducted for two decades to optimize SSL techniques and enhance their accuracy. SED is utilized to determine the time period of acoustic events and has been widely used in robotics [21]. SED is typically concerned with detecting the presence and boundaries of specific sound events in an audio stream, while SSL is concerned with determining the location of a sound source in the environment.
Both SED and SSL can be challenging tasks due to the complexity of the acoustic environment and the various factors that can affect sound propagation. There are various approaches to solving the SED and SSL problems, including machine learning-based methods, which involve training a model on a large dataset of annotated audio data; and signal processing-based methods, which involve analyzing the properties of the audio signal itself. The choice of approach will depend on the specific requirements of the application and the available resources.
3. Sound-Based Scene Avoidance Framework
This section provides an overview of the proposed sound-based scene avoidance framework. The main objective of the proposed framework is to detect a sound event that is a potentially hazardous region that needs to be avoided. Figure 1 illustrated a scenario where a cleaning robot is performing a task in an environment with a hazardous sound event location that needs to be avoided. The robot used in this study can capture sound events in the operating environment through its microphone array. The specification of the microphone was shown in Table 1. The desired sound event is locally identified using a classifier framework on the robot. With the recognized sound, the system can localize the sound event based on the robot’s current position, which can be used to generate an alternative coverage path. Figure 2 shows the overview of the proposed sound-based scene avoidance framework.
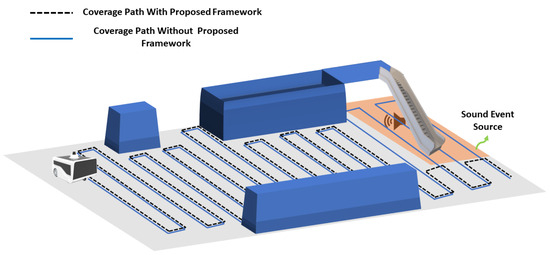
Figure 1.
Cleaning robot generating coverage path with and without sound source avoiding technique.

Table 1.
Microphone specification.
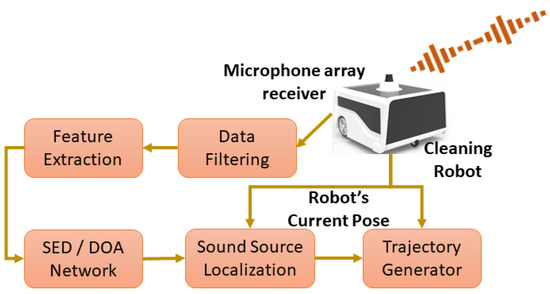
Figure 2.
Overview of the sound source detection and avoidance on the floor cleaning robot.
3.1. Cleaning Robot System
The BELUGA platform was developed as a standard differential drive robot with the dimension of 320 mm × 200 mm × 250 mm (LXBXH) shown in Figure 3. The robot is fixed with two BLDC (Brushless DC) motors, which act as driving motors, and one freely rotating caster wheel, which balances the locomotion. The robot is controlled using a velocity control scheme that receives the motor velocity feedback from the motor driver. The developed velocity control scheme runs in the intel core i7 processing industrial computer. The communication between the processing computer and the dc motor driver was established through the MODBUS-RTU protocol. All the necessary components were powered using a 24v DC lithium-ion battery with few voltage regulators wherever required. For autonomy purposes, we used 2D LiDAR, an RGBD camera, and IMU sensors. The 2D LiDAR used is SICK TIM 581, which acts as a primary sensor for the robot to perform slam. The Realsense D435i is the RGBD camera used to detect obstacles that are out of sight from the 2D lidar frame. The vector nav IMU sensor is used to measure the robot’s orientation in the global frame. The information from the 2D LiDAR, Realsense, and the IMU is fused together and filtered using the extended Kalman filter for precise localization of the beluga platform. Other than the primary sensor, the microphone array is used as a secondary sensor for the robot to detect the sound event around its environment. The microphone array is directly connected to the industrial PC through the jack port. The whole system architecture of the BELUGA robot is shown in Figure 4.
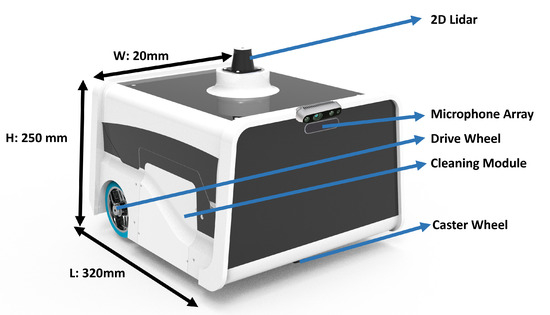
Figure 3.
Overview of the Cleaning Robot.
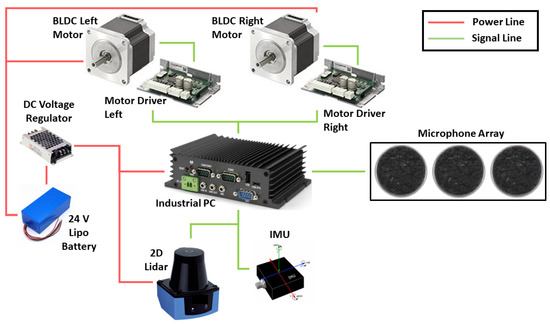
Figure 4.
System Architecture of the Cleaning Robot.
With the onboard sensors, the robot could perform autonomous navigation in a given environment with the help of ROS as middleware. ROS noetic was installed in the industrial PC, which acts as a middle platform that links various components and actuates the modules in the level of computing. On top of the ROS middleware, the trained sound event detection and localization model will be running parallelly on the same system. Once the location is identified by the model, the information is passed to the navigation system to generate the coverage path via the ROS bridge. The information on data preprocessing, path generation, sound event detection, and localization network are detailed in the following sections.
3.2. Data Acquisition and Feature Extraction
The sound data received from the microphone array is sent to the prepossessing stage, wherein the signals are filtered and features are extracted for further processing. One complex and critical step in sound event detection and localization is canceling the noise from the environment sound, which can affect the accuracy of classifying the received sound signal. In the developed system, the amplitude-based noise detection algorithm [22] is used to detect the noise in the sound signal. Since the objective of this study is to detect a very low escalator noise, it is critical to reduce the long-spectrum signals. To achieve such an ability, van der’s dimensionality reduction technique [23] has been used. Once the audio signals are smoothed, the signal is again enhanced to obtain a better feature. Spectrograms of the final audio signal have been generated, which act as features of the audio signal. These features are passed to the classifier deep learning model to classify the audio signal. The image-based classifier also shows promising results for the sound event detection frameworks. This paper uses the spectrogram image-based feature for training, detecting, and localizing the sound event.
3.3. Trajectory Generator
This section introduces the coverage path technique used by the robot to perform the area coverage. Moreover, the coverage path varies with respect to the identified sound event detection. A detailed explanation of the SED and DOA network is provided in Section 4.
Once the coordinates of the detected sound event source are generated from the network, the ROS transformation function automatically transforms it to a global location. The location is considered an obstacle in the global scenario. This global location is then passed to the trajectory generator to generate the new coverage path. The complete coverage path is a well-studied topic in the field of robotics. Several techniques are proposed in the literature to solve complete coverage path planning. Among those, iterative structural orientation ISO demonstrates significantly good performance in terms of efficient coverage, especially in dynamic situations. Since our scenario is more considered a dynamic environment, in this paper, we will be implementing ISO-based coverage path planning. ISO mostly uses the occupancy grid for generating the coverage path wherein the obstacles are represented in back color pixels. In our case, the detected sound source location is also considered an obstacle point. Since the received coordinate is a single point, an obstacle perimeter has been generated around the sound event source coordinate point. The dimensions of the perimeter are determined according to the sound source of interest. Since the objective of this study is to detect the escalator sound, we fixed the obstacle perimeter according to the dimensions of the escalator that is experimented with.
The ISO uses a beam of parallel straight lines within the occupancy map to generate the coverage path. The distance between each line ensures the full area coverage with the platform. When these lines cross on top of the obstacle pixels, joint lines were created between those parallel lines before and after the obstacle for performing the avoidance see Figure 5. In this paper, the obstacle areas of the grid map pixels are represented as value 1, and free spaces are assigned as value 0. With the above consideration, the coverage path can be generated by:
Here, i = 1, …, = 1, …, p, and represented as line slope,
Here, x = 1, …, = 1, …, q and represented as the slope angle,
Intercepts and are given as,
and are derived from,
The computation of and was calculated using,
The value is computed by undergoing iterative procedures. With that value, the path lines can be created. The map dimension determines the length of the line which is connected with smaller auxiliary lines. Once the obstacle layer is formed after detecting the sound source coordinates, the lines are split into two segments. Each segment again undergoes the auxiliary line generation function to establish the connection between them.
A map graph G is defined as,
E represents the vertices of each line node and the represents the edges inbetween two nodes,
where and are the number of main segments and the number of segments generated from ith main line, the generated path is passed to the robot controller to execute the path tracking that leads to complete area coverage. Each segment has two nodes A and B.

Figure 5.
Coverage Path Generation illustrating the parallel ad connecting lines (top) along with the segmentation part (bottom).
Figure 5.
Coverage Path Generation illustrating the parallel ad connecting lines (top) along with the segmentation part (bottom).

4. Sound Event Detection and Localization
The combined SED and DOA training was initially proposed by [7]. The developed system uses audio waveforms such as phase spectrogram and temporal magnitude data as input to the CRNN network. The total loss of this network was computed as a sum of DOAE loss and SED loss. Accordingly, the loss weight of the network is computed as an elemental trade-off between DOEA and SED loss. With that system as a reference, this paper uses a two-stage sound event detection and localization network to perform the floor cleaning robot task.
4.1. Feature Selection
When it comes to feature selection, it is critical to choose an appropriate feature in the audio signal to perform effectively and evaluate better. For better features, it is critical to determine what type of signal is used. For evaluation purposes, this paper chooses input signals in two distinct formats, which are microphone array signal or first-order of Ambisonics (FOA) signal [24]. FOA is a spacial encoding approach that was constructed as a decomposition of the spacial harmonic in the sound field. Usually, Ambisonics contains the information of the sound source direction [25]. Moreover, the higher order of Ambisonics can be related to the higher directional resolution. Since the network has two distinct objectives, the paper uses two types of input features Log mel spectrograms and GCC-PHAT, which have the phase difference in all connected microphone pairs. GCC is a common approach widely used to predict the DOA [26]. This scheme uses the lag time between the microphone array to estimate the direction of the sound source. The sound source location is calculated by inverse-FFT of the power spectrum. In order to eliminate the amplitude influences in the signal, the GCC uses the phase-transformation technique with only the phase. So this paper uses a combination of two features, spectrogram, and GCC-phat, to perform both SED and DOA.
4.2. Network Architecture
The developed network architecture is shown in Figure 6 and Figure 7, which consist of both the SED and DOA branch. Once the features are extracted, the shape is fed into the SED branch. C is the total feature maps, T indicates the bin size, and F represents the total units of delayed band of GCC-PHAT. The network was constructed with four groups of CNN layers (2D conv) with an average pooling of 2 × 2, which is also defined as the feature layer. Every 2D convs group was built with two sub 2D convs wherein a 3 × 3 receptive field, 1 × 1 stride, and 1 × 1 padding were stacked. The constructed conv has the ability to filter the features from the previous layer to learn the information between channels. In order to learn the frequency and local temporal information, the CNN layers are utilized, which eventually leads to understanding the event-level information. For every CNN layer, batch normalization is followed along with the ReLU activation. At the end of the CNN layer, the data transform as × T/16 × F/16, wherein represents output feature map counts from the last layer. The information is then passed to the pooling layer to minimize the shape of F. Then, the reshaped data with a shape T/16 × is passed to a bidirectional GRU. The output size of the GRU layer is continued as T/16 × N to send to a fully connected layer. Here, N is the different classes of the sound event. To maintain the output size with the size of T, a sigmoidal activation function is used. With an activation threshold, a SED prediction can be determined.
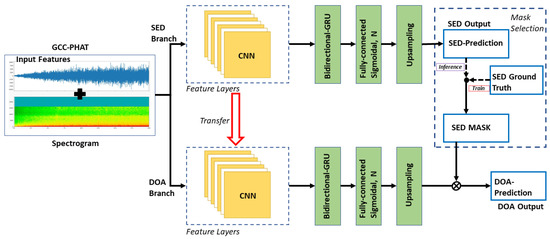
Figure 6.
The developed neural network with two branches wherein the SED branch is used to detect the sound event class, which is used to mask to infer the DOA branch that detects the sound event directional coordinates.
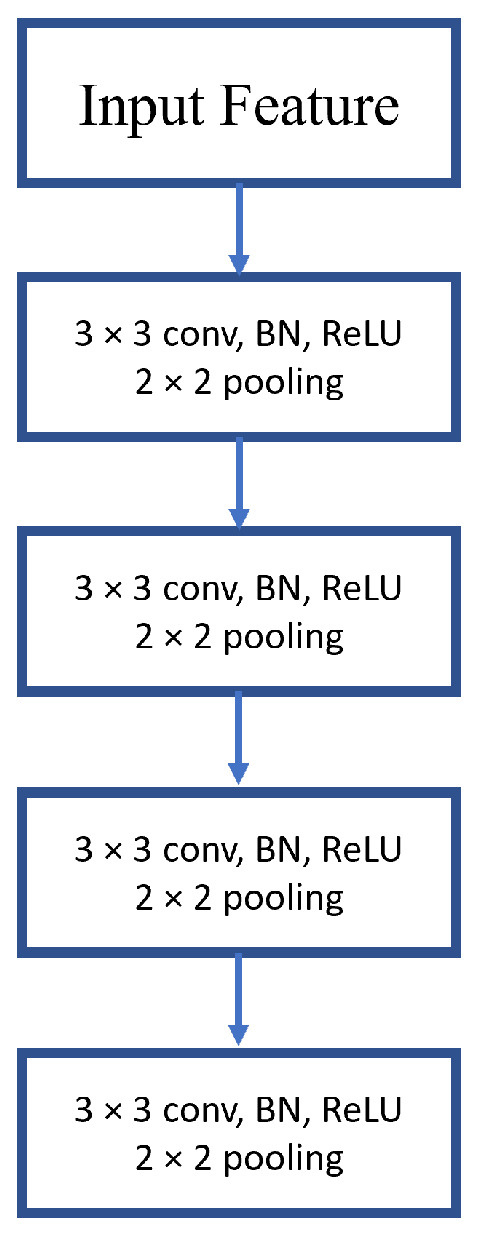
Figure 7.
CNN Layer Diagram.
Once the SED is trained, the DOA network will get trained. The CNN layers, which were used for SED training, are transferred to the DOA layer. From the fully connected layer in the DOA branch, azimuth and elevation angles are generated for N events. These values are masked with the SED ground truth to identify the corresponding active angles. Lastly, DOA regression loss is derived from the mean absolute error. While for inference, the SED prediction is first computed by the SED branch, which is utilized as an SED mask that leads to generating the DOA. The network was constructed with the objective of enhancing the single network representation wherein each branch focuses on a single task while the DOA aggregates the advantages contributed by the SED.
5. Experimental Setup and Data Training
The objective of this article is to detect the escalator using the microphone array and avoid it for a cleaning robot while performing the area coverage process. The developed sound-based event avoidance framework was evaluated with the BELUGA robotic system in two real-world scenarios. The first scenario is a semi-indoor environment where the escalator is present in an open space that has a large external noise. Whereas the second scenario is an indoor environment where the probability of external noise is limited. The experiments were conducted for all considered scenarios by deploying the robot in ascending and descending directions. In each considered scenario and direction, the robotic system was tested by placing it in three distinct positions that varied in increasing distance from the sound source. The evaluation process was split into three segments, where each segment tested the efficiency of the system’s sound source classification, localization, and avoidance capability. Figure 8 shows the selected scenarios and the robot starting points in each scenario. For this evaluation, other similar methods were compared with the developed system. The first method is the baseline method which is used in the Dcase 2019 task 3 [7] wherein both the SED and DOA are jointly trained. The second method is the SELDnet [27], which has a similar CNN architecture to detect and localize a sound event. DOAnet [28] is another method that is used to estimate the location of the sound event.
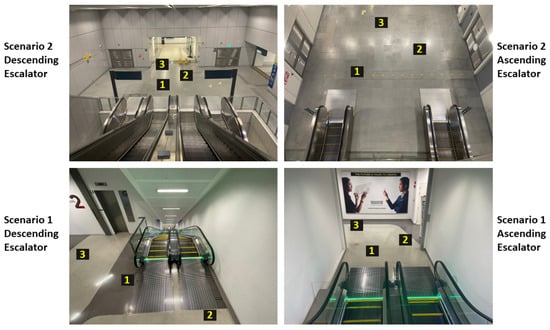
Figure 8.
The selected escalator scenarios: Scenario 1 is a semi-outdoor environment considering both descending (bottom left) and ascending (bottom right) directions; Scenario 2 is an indoor environment considering both ascending (top right) and descending (top left) directions.
5.1. Model Training
Hyper-parameters for audio processing are a sampling rate of 24 kHz, window length of 1024 samples, hop length of 300 samples (12.5 ms), Hann window, and 1024 FFT points. The training process was conducted in two ways: the first method was to train the model with the developmental data set which was available online, and the second method was to train the model with both developmental and evaluation data set, which is the customized data set. The customized data set was generated by physically recording the escalator sounds across areas. Since the training data was insufficient, we used indigenous data to improvise the model and reduce false detection. The data sets were prepared with reference to the TAU-NIGENS Spatial Sound Events 2020–2021 datasets, which were used in the DCASE2020–2021 challenge. The dataset that was used from the database was FSD50K [29]. The dataset consists of 350 and 150 one-minute audio clips for training which 70% of the data is included for training and 30% for testing.
5.2. Evaluation Metrics
Evaluation metrics are the next critical components to properly evaluating the system. Since we have two different networks to be evaluated, we used individual metrics for SED and DOA networks. For SED, the segment-based error rate () and the F-score (F) are computed in a second-time length.
wherein is the total number of true positives in the kth second of the data segment. Similarly, and the represent the false positive and the false negative of the kth second in the segment, respectively.
here, is the number of event classes, whereas represents the number of times that a class has been detected. However, some of the overlapping false positives and false negatives with the existing detected events are either considered as insertion and deletion .
When it comes to the evaluation metric of the DOA network, a DOA error has been calculated. From the DOA network, we receive the sound source event’s x, y, and z coordinates. The estimated coordinates of a detected sound source are represented as and the reference coordinates are represented as . with this values a central angle has been calculated as
where . With this, the DOA error can be computed as:
During the network training, an early stopping has been initiated with respect to the SELD score. In the developed network, the performance of the localization is highly dependent on the detection performance. Such reliance between the network branches is represented as a frame recall metric. As a consequence, the SELD score, which is comprised of the frame recall metric in addition to the SED metrics, can be seen to weigh the SED performance more than DOA.
5.3. Coverage Path Evaluation
The second phase evaluates the robot’s ability to maximize the area coverage and the system’s accuracy in covering the landing step by detecting the handrail. The maximum area covered by the robot was calculated by tracking the robot using an overhead camera to generate a coverage map while performing the area coverage on the staircase as mentioned in [13].
6. Results
6.1. Results from Scenario 1 Facing Descending Escalator
The experimental trials were started by placing the robot at respective starting points in each scenario. Since these trials were conducted in real time, the metrics were recorded on board. Then, the recorded coverage process from the overhead camera was post-processed to generate a track map, which reflects the efficacy of the sound source avoidance scheme. The same experiments were conducted with other algorithms and recorded relevant data in order to compare it with the proposed scheme. Table 2 provides the SED and DOA detection accuracy for all considered algorithms from distinct starting positions. From the table, it is clear that the proposed scheme performed significantly better in terms of detecting the sound event than other schemes from all starting points. The proposed scheme from starting point 3, which is the farthest from the sound event, performed much better than other methods compared to the other two close points. Figure 9 shows the DOA detection error in terms of the x-axis and y-axis between the developed method and the ground truth. From the figure, it is clear that the developed system can estimate the location of the sound event as close to the ground truth position. When it comes to area coverage performance, the robot avoided the sound event from all considered starting points with the proposed scheme. However, due to detection errors from starting point 3, the coverage path also covered the hazardous region around the escalator, as shown in Figure 10(S3). Whereas with other starting points where the localization errors were minimal, the coverage path only covered the safe regions around the escalator, as shown in Figure 10(S1 and S2).
Table 2.
Performance comparison between other similar methods and the proposed method in scenario-1 escalator descending direction.
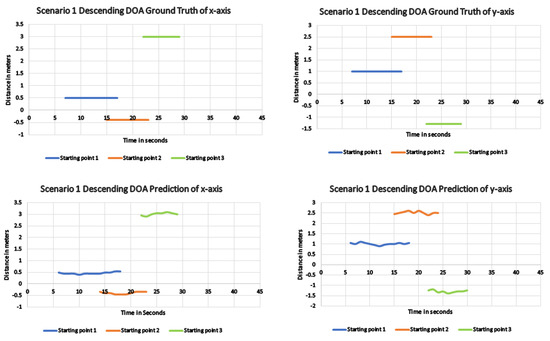
Figure 9.
DOA result for the proposed method showing the difference in the actual and predicted x, y coordinates of scenario 1 descending direction.
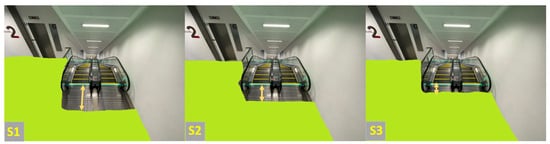
Figure 10.
Generated track map after each trail from various starting points (S1 starting point 1, S2 starting point 2, and S3 starting point 3) near escalator of scenario-1 descending direction wherein the green pixels represents the robot-covered region and yellow arrow represents the distance between the covered region and escalator’s first step.
6.2. Results from Scenario 1 Facing Ascending Escalator
Similar to the previous experimental trials, the robot was placed in respective starting points, and critical metrics were recorded on board for all considered algorithms. Table 3 shows the performance of each algorithm in executing the SED and DOA detection. Like the descending escalator, the developed algorithm performed significantly larger than the other considered algorithms from all starting points. In the ascending direction, since there was an escalator sound echo from the surroundings, the detection error value was slightly higher than the system performed while facing the descending escalator. The same applies to the DOA network, where the DOA error was a little higher than the experiments from the descending escalator, which also affects a bit of the x, y coordinate generation. Figure 11 shows the x, y coordinate comparison with the ground truth for all starting points from the ascending escalator where the values are not exactly following the reference due to sound echos. However, this slight overshoot of values compared to the reference values does not affect the robot coverage problem. Figure 12 shows the generated coverage map of the robot from the proposed technique wherein the robot safely avoided the escalator in all considered starting points. However, like in the descending escalator scenario, the robot covers are too close to the escalator step when it starts from starting point 3 then 1 and 2. Such hazardous coverage from starting point 3 occurred due to the more significant localization error in the DOA branch.
Table 3.
Performance comparison between other similar methods and the proposed method in scenario-1 escalator ascending direction.
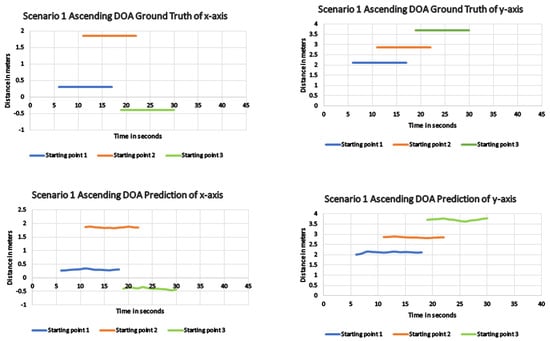
Figure 11.
DOA result for the proposed method showing the difference in the actual and predicted x, y coordinates of scenario 1 ascending direction.
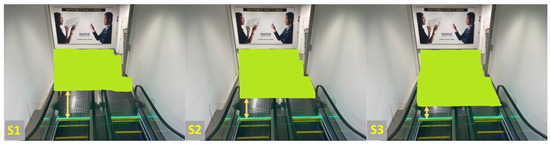
Figure 12.
Generated track map after each trail from various starting points (S1 starting point 1, S2 starting point 2, and S3 starting point 3) near escalator of scenario-1 descending direction wherein the green pixels represents the robot-covered region, and yellow arrow represents the distance between the covered region and escalator’s first step.
6.3. Results from Scenario 2 Facing Descending Escalator
In scenario 2, the robot was deployed in a closed environment, and the first trial was towards facing the descending escalator. The coverage area was minimized for this trial due to the larger coverage space. The robot was initially deployed to detect the SED and DOA of the escalator sound from various starting points. The metrics were recorded for each trail and various algorithms. Table 4 shows that the proposed method performed significantly better than other considered algorithms, even in the closed environment. Similar to the previous experiments, when the robot distance increases from the sound source, the SED detection error is considerably increased, which is also true with the developed system. With respect to the DOA error, when there is an increase in robot distance, there is a proportional increase in the error value which was replicated for all considered algorithms. Among those, the proposed method achieved a lesser DOA error value from all starting points. Figure 13 shows the comparison between the generated x and y coordinates and ground truth. The result shows that the system almost closely followed the reference coordinate from all starting points except from S3, which has a higher DOA error. When it comes to area coverage performance, the robot avoided the sound event source (escalator) from all considered starting points with the proposed scheme. However, due to detection errors from starting point 3, the coverage path also covered the hazardous region around the escalator, as shown in Figure 14(S3). Whereas with other starting points with a lesser localization error, the path only covered the safe regions around the escalator, as shown in Figure 14(s1 and S2).
Table 4.
Performance comparison between other similar methods and the proposed method in scenario-2 escalator descending direction.
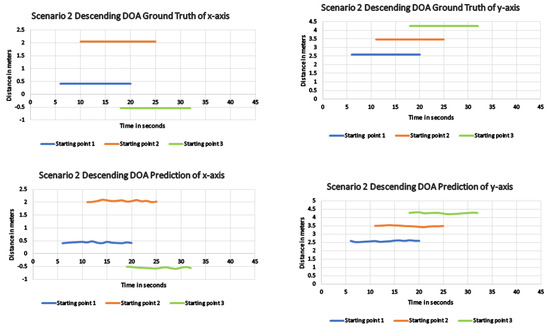
Figure 13.
DOA result for the proposed method showing the difference in the actual and predicted x, y coordinates of scenario 2 descending direction.
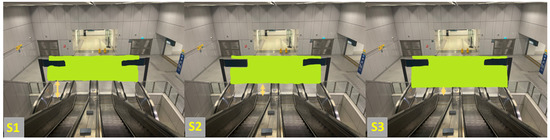
Figure 14.
Generated track map after each trail from various starting points (S1 starting point 1, S2 starting point 2, and S3 starting point 3) near escalator of scenario-2 descending direction wherein the green pixels represents the robot-covered region, and yellow arrow represents the distance between the covered region and escalator’s first step.
6.4. Results from Scenario 2 Facing Ascending Escalator
In the fourth trial, where the robot faces the ascending staircase of scenario 2, the robot was placed at a much higher distance. The trials were conducted similarly to the previous runs, and the metrics were recorded as same. Table 5 shows that even after increasing the distance, the developed system’s SED error rate is much lower compared to other methods. Within the proposed scheme, starting points 1 and 2 had lesser error values than starting point 3, similar to previous experiments. The same applies to the DOA error, where the proposed method performed much better than other methods, and starting point 3 has a higher error value than the other two starting points. The x, y coordinates comparison graph is shown in Figure 15 wherein from all starting points, the x, y values are closely following the reference value. Due to minor errors in generating the coordinates coverage path from starting point 3 is much closer to the escalators. Whereas from starting points 1 and 2, the coverage path only covers the safer region around the escalators as shown in Figure 16.
Table 5.
Performance comparison between other similar methods and the proposed method in scenario-2 escalator ascending direction.
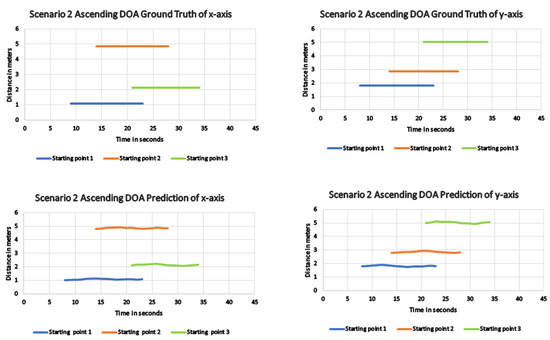
Figure 15.
DOA result for the proposed method showing the difference in the actual and predicted x, y coordinates of scenario 2 ascending direction.
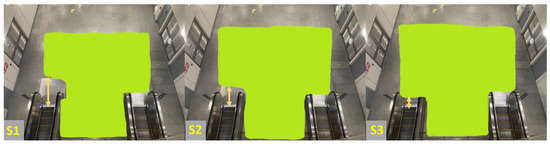
Figure 16.
Generated track map after each trail from various starting points (S1 starting point 1, S2 starting point 2, and S3 starting point 3) near escalator of scenario-2 ascending direction wherein the green pixels represent the robot-covered region, and yellow arrow represents the distance between the covered region and escalator’s first step.
From the experimental trials, it is clear that the proposed system demonstrated significantly superior performance in terms of sound event detection and localization than other similar methods. Moreover, the system can generate a safe area coverage path around the detected sound to perform the coverage task with a mobile robot. The work presented in this article exhibits our initial effort towards building an acoustic-based context-aware robotic system that can autonomously perform area coverage concerning the context around it in any commercial and public buildings.
7. Conclusions
This paper presented a context avoidance deep learning model based on acoustic signals. The developed system detects and classifies a sound event, localizes the source, and generates a coverage path that avoids the sound source to perform a safe operation. The paper introduces the robotic platform BELUGA to validate the proposed system, along with its system architecture that supports the scheme. Moreover, the paper describes the coverage path generation technique, which can dynamically change its path when the sound event is localized as an obstacle. The developed deep learning architecture has two branches, SED and DOA, which use a combination of spectrogram and GCC-phat, which can detect and localize sound events, respectively. As a case study, this paper examines the detection of escalator sounds in open and closed environments. There are a few metrics that were considered for the detection and localization network, which was systematically compared with other similar networks for evaluation. Moreover, a comparison graph was plotted between the generated x and y coordinate values and the reference values. The result shows that the proposed method demonstrated significantly exceptional performance in all considered scenarios and metrics than the other existing methods. Thus, it is evident that the proposed system has the ability to understand the environmental context using the acoustic information and safely loco-mote the robot platform to perform area coverage tasks accordingly. Since this work has only considered the escalator scenario as a case study, the effectiveness of the system needs to be further evaluated in another similar context. Furthermore, due to the low sound values from the escalator, there are a few miss classifications and errors in localizing the sound event, which need to be eradicated through implementing the following future works. (1) Optimizing the system’s SED detection accuracy for low sounds. (2) Testing along with the cleaning unit, which can provide excess sounds. (3) Evaluating the proposed system in a dynamic environment wherein the obstacles come in randomly. (4) Need to consider detecting another sound event context in an environment.
Author Contributions
Conceptualization, P.V., Y.J., R.E.M. and B.R.; Data curation, Y.J., P.V. and B.R.; Investigation, Y.J., Z.Y. and P.V.; Methodology, P.V., Z.Y. and B.R.; Project administration, B.R.; Software, B.R. and Y.J.; Supervision, R.E.M.; Writing—original draft, Y.J. and P.V.; Writing—review & editing, Y.J., P.V. and R.E.M. All authors have read and agreed to the published version of the manuscript.
Funding
This research is supported by the National Robotics Programme under its National Robotics Programme (NRP) BAU, Ermine III: Deployable Reconfigurable Robots, Award No. M22NBK0054.
Institutional Review Board Statement
Not applicable.
Informed Consent Statement
Not applicable.
Data Availability Statement
Not applicable.
Acknowledgments
Thanks to Thejus Pathmakumar from Singapore University of Technology and Design providing Audit-Robot BELUGA on the purpose of experiments.
Conflicts of Interest
The authors declare no conflict of interest.
Correction Statement
This article has been republished with a minor correction to the Funding statement. This change does not affect the scientific content of the article.
References
- Data Bridge Market Research. Cleaning Robot Market Expected to Reach $38,142.05 Million by 2029 with Product Type, Components, End-User, Top Players and Global Industry Analysis. 2022. Available online: https://www.databridgemarketresearch.com/press-release/global-cleaning-robot-market (accessed on 5 February 2023).
- Bozhinoski, D.; Di Ruscio, D.; Malavolta, I.; Pelliccione, P.; Crnkovic, I. Safety for mobile robotic systems: A systematic mapping study from a software engineering perspective. J. Syst. Softw. 2019, 151, 150–179. [Google Scholar] [CrossRef]
- Kolhatkar, C.; Wagle, K. Review of SLAM algorithms for indoor mobile robot with LIDAR and RGB-D camera technology. Innov. Electr. Electron. Eng. 2021, 661, 397–409. [Google Scholar]
- Sun, S.; Cioffi, G.; De Visser, C.; Scaramuzza, D. Autonomous quadrotor flight despite rotor failure with onboard vision sensors: Frames vs. events. IEEE Robot. Autom. Lett. 2021, 6, 580–587. [Google Scholar] [CrossRef]
- Chen, X.; Huang, J. Odor source localization algorithms on mobile robots: A review and future outlook. Robot. Auton. Syst. 2019, 112, 123–136. [Google Scholar] [CrossRef]
- Xia, X.; Togneri, R.; Sohel, F.; Zhao, Y.; Huang, D. A survey: Neural network-based deep learning for acoustic event detection. Circuits Syst. Signal Process. 2019, 38, 3433–3453. [Google Scholar] [CrossRef]
- Adavanne, S.; Politis, A.; Nikunen, J.; Virtanen, T. Sound event localization and detection of overlapping sources using convolutional recurrent neural networks. IEEE J. Sel. Top. Signal Process. 2018, 13, 34–48. [Google Scholar] [CrossRef]
- Oh, Y.J.; Watanabe, Y. Development of small robot for home floor cleaning. In Proceedings of the 41st SICE Annual Conference, SICE 2002, Osaka, Japan, 5–7 August 2002; Volume 5, pp. 3222–3223. [Google Scholar]
- Jain, M.; Rawat, P.S.; Morbale, J. Automatic floor cleaner. Int. Res. J. Eng. Technol. (IRJET) 2017, 4, 2395-0056. [Google Scholar]
- Anıl, E.; Doğan, H. Design and implementation of a cost effective vacuum cleaner robot. Turk. J. Eng. 2022, 6, 166–177. [Google Scholar]
- Hong, Y.; Sun, R.; Lin, R.; Yu, S.; Sun, L. Mopping module design and experiments of a multifunction floor cleaning robot. In Proceedings of the 11th World Congress on Intelligent Control and Automation, Shenyang, China, 29 June–4 July 2014; pp. 5097–5102. [Google Scholar]
- Ramalingam, B.; Yin, J.; Rajesh Elara, M.; Tamilselvam, Y.K.; Mohan Rayguru, M.; Muthugala, M.V.J.; Félix Gómez, B. A human support robot for the cleaning and maintenance of door handles using a deep-learning framework. Sensors 2020, 20, 3543. [Google Scholar] [CrossRef] [PubMed]
- Prabakaran, V.; Elara, M.R.; Pathmakumar, T.; Nansai, S. Floor cleaning robot with reconfigurable mechanism. Autom. Constr. 2018, 91, 155–165. [Google Scholar] [CrossRef]
- Milde, M.B.; Blum, H.; Dietmüller, A.; Sumislawska, D.; Conradt, J.; Indiveri, G.; Sandamirskaya, Y. Obstacle avoidance and target acquisition for robot navigation using a mixed signal analog/digital neuromorphic processing system. Front. Neurorobotics 2017, 11, 28. [Google Scholar] [CrossRef] [PubMed]
- Sasaki, T.; Enriquez, G.; Miwa, T.; Hashimoto, S. Adaptive path planning for cleaning robots considering dust distribution. J. Robot. Mechatronics 2018, 30, 5–14. [Google Scholar] [CrossRef]
- Zhao, Z.; Chen, W.; Peter, C.C.; Wu, X. A novel navigation system for indoor cleaning robot. In Proceedings of the 2016 IEEE International Conference on Robotics and Biomimetics (ROBIO), Qingdao, China, 3–7 December 2016; pp. 2159–2164. [Google Scholar]
- Dubey, S.; Chinnaaiah, M.; Kiran, C.S.; Priyanka, B.S.; Rao, P.P. An FPGA based service Robot for floor cleaning with autonomous navigation. In Proceedings of the 2016 International Conference on Research Advances in Integrated Navigation Systems (RAINS), Bangalore, India, 6–7 May 2016; pp. 1–6. [Google Scholar]
- Park, D.H.; Hoffmann, H.; Pastor, P.; Schaal, S. Movement reproduction and obstacle avoidance with dynamic movement primitives and potential fields. In Proceedings of the Humanoids 2008—8th IEEE-RAS International Conference on Humanoid Robots, Daejeon, Republic of Korea, 1–3 December 2008; pp. 91–98. [Google Scholar]
- Clavel, C.; Ehrette, T.; Richard, G. Events detection for an audio-based surveillance system. In Proceedings of the 2005 IEEE International Conference on Multimedia and Expo, Amsterdam, The Netherlands, 6 July 2005; pp. 1306–1309. [Google Scholar]
- Pfeiffer, S.; Fischer, S.; Effelsberg, W. Automatic audio content analysis. In Proceedings of the Fourth ACM International Conference on Multimedia, Boston, MA, USA, 18–22 November 1997; pp. 21–30. [Google Scholar]
- Desai, D.; Mehendale, N. A review on sound source localization systems. Arch. Comput. Methods Eng. 2022, 29, 1–12. [Google Scholar] [CrossRef]
- Zhang, H.; McLoughlin, I.; Song, Y. Robust sound event recognition using convolutional neural networks. In Proceedings of the 2015 IEEE International Conference on Acoustics, Speech and Signal Processing (ICASSP), South Brisbane, Australia, 19–24 April 2015; pp. 559–563. [Google Scholar]
- Van Der Maaten, L.; Postma, E.; Van den Herik, J. Dimensionality reduction: A comparative. J. Mach. Learn. Res. 2009, 10, 13. [Google Scholar]
- Adavanne, S.; Politis, A.; Virtanen, T. A multi-room reverberant dataset for sound event localization and detection. arXiv 2019, arXiv:1905.08546. [Google Scholar]
- Gerzon, M.A. Ambisonics in multichannel broadcasting and video. J. Audio Eng. Soc. 1985, 33, 859–871. [Google Scholar]
- Knapp, C.; Carter, G. The generalized correlation method for estimation of time delay. IEEE Trans. Acoust. Speech, Signal Process. 1976, 24, 320–327. [Google Scholar] [CrossRef]
- Adavanne, S.; Pertilä, P.; Virtanen, T. Sound event detection using spatial features and convolutional recurrent neural network. In Proceedings of the 2017 IEEE International Conference on Acoustics, Speech and Signal Processing (ICASSP), New Orleans, LA, USA, 5–9 March 2017; pp. 771–775. [Google Scholar]
- Adavanne, S.; Politis, A.; Virtanen, T. Direction of arrival estimation for multiple sound sources using convolutional recurrent neural network. In Proceedings of the 2018 26th European Signal Processing Conference (EUSIPCO), Rome, Italy, 3–7 September 2018; pp. 1462–1466. [Google Scholar]
- Fonseca, E.; Favory, X.; Pons, J.; Font, F.; Serra, X. Fsd50k: An open dataset of human-labeled sound events. IEEE/ACM Trans. Audio Speech Lang. Process. 2021, 30, 829–852. [Google Scholar] [CrossRef]


Disclaimer/Publisher’s Note: The statements, opinions and data contained in all publications are solely those of the individual author(s) and contributor(s) and not of MDPI and/or the editor(s). MDPI and/or the editor(s) disclaim responsibility for any injury to people or property resulting from any ideas, methods, instructions or products referred to in the content. |
© 2023 by the authors. Licensee MDPI, Basel, Switzerland. This article is an open access article distributed under the terms and conditions of the Creative Commons Attribution (CC BY) license (https://creativecommons.org/licenses/by/4.0/).