Abstract
The work in this paper helps study cardiac rhythms and the electrical activity of the heart for two of the most critical cardiac arrhythmias. Various consumer devices exist, but implementation of an appropriate device at a certain position on the body at a certain pressure point containing an enormous number of blood vessels and developing filtering techniques for the most accurate signal extraction from the heart is a challenging task. In this paper, we provide evidence of prediction and analysis of Atrial Fibrillation (AF) and Ventricular Fibrillation (VF). Long-term monitoring of diseases such as AF and VF occurrences is very important, as these will lead to occurrence of ischemic stroke, cardiac arrest and complete heart failure. The AF and VF signal classification accuracy are much higher when processed on a Graphics Processor Unit (GPU) than Central Processing Unit (CPU) or traditional Holter machines. The classifier COMMA-Z filter is applied to the highly-sensitive industry certified Bio PPG sensor placed at the earlobe and computed on GPU.
Keywords:
Graphics Processing Unit (GPU); proximity sensors; heart diseases; Atrial Fibrillation; Ventricular Fibrillation MSC:
68U01
1. Introduction
Measuring blood volume circulation variations is one of the most challenging and important tasks. This kind of task is called Photoplethysmography and, due to advancing technology and various sensing capabilities, is widely used in the most recent times. Devices with PPG technology are used for early screening of various heart diseases and related conditions [1]. There are many heart diseases, but Ventricular Fibrillation and Atrial Fibrillation are two of the most dangerous diseases that require thorough screening. In this paper, we will focus on these two widely-emerging and dangerous diseases. There are similar methods that predict Atrial Fibrillation without pulse detection, but noise, vibrations and various environmental conditions increase the uncertainty of screening or analyzing such diseases [2].
Studies show, during the acute stage of Myocardial Infarction over 5 years of observation, consistent signs of Ventricular Fibrillation and Atrial Fibrillation. During the phase of Myocardial Infarction, patients develop Ventricular Fibrillations or rapid Atrial Tachycardia, which may increase the risk of death in a short period of time [3]. Echocardiography was used for a patient with Myocardial Infarction but, sometimes, there is no evidence of the shunt detection during doppler echocardiography or during left ventriculography [4]. In 2005, France proposed, based on studies of 3670patients, to implant the implantable cardioverter-defibrillator into such patients, despite a low level of evidence [3].
Kaplan–Meier estimation was one of the methods used to develop a survival curve and one of the most famous methods used for prediction of survival curves over a period [5]. Sudden cardiac death may occur due to Myocardial Infarction along with Ventricular Fibrillation [6]. Left ventriculography was performed for close to 2000 patients who underwent angioplasty for acute Myocardial Infarction, but the survival rate was significantly lower for the baseline left ventricular ejection fraction, and the conclusion was that the baseline left ventricular function measured during the procedure was a strong predictor of early and late survival angioplasty [7]. Women have a lower tendency to undergo sudden heart attack, heart failure or atrial fibrillation due to the menstrual cycle hormones released by their bodies until a certain age [8]. Ventricular Fibrillation prediction can be performed using some tests and medicine, such as prophylactic lidocaine, based on the recommendation of the American Heart Association in 1996 [9]. The Photoplethysmography method was used to analyze and research, using ensemble empirical mode decomposition (EEMD). EEMD results in decomposition of a signal into intrinsic mode functions. These intrinsic mode functions, together with their power spectral densities (PSDs), of Photoplethysmogram (PPG) signals were used to analyze for Ventricular Fibrillation conditions [10].
There are various sensors that can be used to measure heart conditions passively, and one such method is to use a KardiaBand, which records a rhythm strip from an Apple Watch, and, when paired, the application detects Atrial Fibrillation. There has been at least one study to examine use of a smartwatch to discriminate between sinus rhythm and Atrial Fibrillation [11]. Most of the predictions using PPGs will always have an annotated ground truth; comparison using ECGs and these annotations are made using various rhythms such as sinus rhythm, Atrial Fibrillation and Ventricular Fibrillation. Prediction of these diseases in PPG and then applying pre-processing and removal of segments corresponding to motion artifacts is one of the common, and challenging, tasks used in methods of comparison. The methods of PPG signals, predicted using inter-beat interval-based features and wave-based features, include complexity measures that are computed using power spectral density [11].
Patients with pre-existing cardiovascular diseases seem to be at risk of death; for example, COVID-19 will induce arrhythmia, myocardial injury and acute coronary syndrome [12]. Coronavirus disease and hypertension, along with coronary artery diseases, are associated with high mortality rates [12]. Heart failure was one of the most observed complications of COVID-19, with a reported incidence of 24% in all patients and 49% in patients who died [13].
Based on estimations, 43% of life-threatening electrocardiogram (ECG) alarms issued by bedside monitors are false. Ventricular Fibrillation is one of the most-identified arrhythmias in cardiac arrest patients and the patients usually die within minutes if not treated immediately [14]. Various research works have used Photoplethysmography (PPG) and atrial blood pressure (ABP) for predicting these diseases [14]. These predictions are better and contain fewer ECG-related artifacts [14].
Cardiac arrhythmias contribute to a large number of casualties around the world every year. The monitors in hospitals also provide too many false alarms and bedside care ECGs are not very suitable for use as a wearable device, due their requirement of using electrodes [15]. Physionet datasets are widely used to detect different types of arrhythmias from patients such as Tachycardia, Bradycardia, Ventricular Tachycardia, Ventricular Fibrillation and Atrial Fibrillation [15]. There are various methods to detect PPG pulse and, based on the implemented research work here, one such method is to detect quality pulse index from every pulse and then the highest quality portion of the signal is later used for detection; this method also proves that PPG provides better results and shows a viable alternative to traditional ECG detection methods [15]. Any heart rhythm different from a normal sinus rhythm is called arrhythmia. This rhythm difference may be due to lower or faster heart rate, which may be due to Atrial and Ventricular Fibrillations, which are the most common ones [16]. Therefore, continuous monitoring is critical for patients with these conditions who are at a very high risk of cardiac events, and ECG-based devices are commonly used for monitoring. However, we know that ECG devices require electrodes and limbs for recording at the chest region and the chest-related ones are very uncomfortable for continuous monitoring over time. Therefore, PPG devices are becoming more popular, because they can be used at any comfortable pressure point—in this paper, we have used one to measure pulse at earlobe or fingertip—and they do not require an adhesive gel [16].
GPUs are widely replacing CPUs for various applications that require heterogeneous computing capabilities in the automotive, medical, industrial and aerospace fields. Today, the most widely-used speech recognition algorithm is implemented making use of highly-advanced computing-level techniques, using both CPUs and GPUs [17]. Today, Nvidia’s widely-used Jetson products have high-performance computing capabilities: the Jetson TX2 has 256 CUDA cores with the most powerful processor for AI and edge computing, while Nano is a small, yet powerful, computer with 128 CUDA cores. However, Xavier is the most powerful of all, with 512 CUDA cores and 64 Tensor Cores; it is used for AI/ML and is widely used in autonomous machines [18].
The Compute unified device architecture (CUDA) toolkit provides a high-performance environment for GPU-accelerated applications. CUDA is a parallel computing platform and programming model that enables developers to compute intensive applications using GPUs. CUDA is also widely used for signal processing software, along with a GPU, to process large amounts of astronomical data [19]. CUDA performance led to the new era of drug discovery with specific illustrations and methodologies that were applied to atomic and molecular scales; harnessing CUDA led to their discovery [20]. Studies show that high heart rate was associated with higher risk of cardiovascular events, which was found more strongly among men than women [21]. One of the most widely-used filtering techniques in the world, the moving average filter, is an averaging filter that helps solve many problems. To name a few, these techniques are used in sports, stock market analytics, astronomical data computation and weather analytics.
In this paper, implementation of a novel COMMA-Z classifier is a method that is used to compute heart data, using a PPG sensor which is industry certified. COMMA-Z, which refers to continuous median-moving average filter coupled with zero crossing detection algorithm, was applied to the high-performance proximity sensor’s raw heart rate data, which was extracted from earlobe and fingertip. In this research, CUDA architecture was implemented, along with a signal differentiation algorithm and depth first search algorithms, for Atrial and Ventricular Fibrillation predictions and analysis. The research was also used to develop studies for physicians based on previously-occurring health- or heart-related conditions.
The rest of the paper is organized as follows: Section 2 reviews related work of the research and discusses the techniques in the proposed system, Section 3 introduces the system design along with hardware and software module implementation within the system, the obtained results and analysis of the experiments are discussed in Section 4 and, finally, the paper is concluded in Section 5.
2. Related Work
Various algorithms and methods were used to predict and analyze Ventricular Fibrillation and Atrial Fibrillation but, to outperform such work, a highly-advanced sensor is required to collect precise sampling heart data. At Stanford University, heart abnormality was detected and modeled using a cluster of GPUs and then the historical EKG data of 30,000 patients were modeled, to understand what was happening with patients’ hearts [22]. Scientists from Stanford University were also using the KardiaBand embedded into an Apple Watch for heart data [23]. This Apple device is not medically approved to fully measure potential heart-related arrhythmias, but has certain potentials [24]. The proximity sensors in the Apple Watch always depend on the blood flow, and the muscular tensions which restrict the blood flow, leading to inaccurate readings [22]. Hence, using an Apple Watch or any wrist-related sensor might not make judicious predictions and diagnoses of heart abnormalities.
In this paper, the proposed highly-advanced sensors support Photoplethysmography to absorb blood volumetric changes. Photoplethysmography biosensor MAX30102 pulse oximetry was also used to detect heart rate and related conditions, along with KardiaBand Mobile data, to compare readings. These readings were also compared with an FDA-approved Single-Lead ECG monitoring device [16], but there is no existing work currently that uses a GPU and novel filter to compute heart data via earlobe. The computed heart data, along with our invented novel COMMA-Z filter and related high-performance proximity sensors, are used to showcase heart diseases such as Ventricular and Atrial Fibrillation for analysis and prediction using Photoplethysmography technology. The traditional moving average filter is widely applied but, in this paper, this method is used to implement the novel COMMA-Z filter. The novel COMMA-Z is a continuous median-moving average filter with zero cross detection algorithm; it is a parallel computing method implemented using thread blocks to provide optimized and excellent results. This method of implementation shows low performance on CPU because it requires more CPU cores for computing, as the algorithm and software were developed using parallelism architecture.
Based on the baseline left ventricular function, scientists have developed predictions for survival that are observed using the Photoplethysmography method [7]. This method can be used to detect variation of blood volume circulation after angioplasty more precisely at the earlobe due to the presence of more blood vessels, and it can be performed for a patient who has suffered from acute Myocardial Infarction. These observations may help study, predict and analyze the heart data outcome for any further medical diagnosis. The experimental section demonstrates the GPU, along with a COMMA-Z filter, heart data computation using both GPU and CPU.
Data computing, especially for an enormous amount of data, is really important to make any decision and to do so, a GPU should definitely be considered because, in one such example, t right coronary artery occlusion with reperfusion, bradycardia and hypertension occurs commonly in patients with proximal occlusion, and there is a chance that it might be arising from the right ventricle as well. Computing heart data using powerful processing, advanced sensors and filters would help understand situations such as these as well [25].
GPUs from Nvidia provide a Compute unified device architecture (CUDA) toolkit, which helps with high-performance parallel computing capabilities, and these GPU architectures are widely- and majorly-used in medical and automotive applications to perform enormous real-time computing, providing tremendous and unbelievable results. The most recent drug discovery also included CUDA performance architecture for COVID-19 that was applied to molecular and atomic scales [26]. A Myocardial Infarction phase consists of Atrial Fibrillation but also leads to Ventricular Fibrillation [3]; however, there can be instances of predicting it in early stages using sensors when placed at a certain position of the body where there is a high number of blood vessels. Based on the prediction and analysis, COVID-19 itself induces Myocardial Infarction, and coronary syndrome leads to Ventricular Fibrillation, which requires monitoring using a sensor-based system. As per cardiologists, a patient after angioplasty will have heart data variations and can be observed using bedside ECG machines. Such observations require the patient to be observed on an everyday basis, which can be possible using PPG at the earlobe. Based on a previous research paper [14], Photoplethysmography was used for prediction of various heart diseases because a certain percentage of ECG alarms was false. There are methods and mathematical implementations that showcase better results for PPG than ECG, but the PPG sensors are required to be carefully designed and developed using advanced filtering techniques. Photoplethysmography (PPG) optical data measurement method is a technology consisting of a light source and a photodiode used to measure volumetric blood circulation change [27].
The method in this paper uses the most advanced proximity sensor from Vishay Industries. This Vishay VCNL is a highly-advanced proximity sensor with best light reflections using a Kodak grey card, which is placed on the earlobe. The approach in ear section is possible because the heart always keeps the head section warmer in temperature when compared to other parts of the body and also, at the ear region, there are more blood vessels than anywhere in the body, which helps provide an enormous amount of heart data, as is required to predict and analyze any heart-related conditions [22,28]. Scientists and researchers are testing methods for heart data extraction and sensor placement. In this research and development work, after thorough discussions with medical professionals, it was finally proposed to place a Vishay PPG sensor on the earlobe for an enormous amount of heart rate data collection, and to compute those data using a GPU to predict and analyze dangerous and deadly cardiac arrythmias, such as Ventricular Fibrillation and Atrial Fibrillation, using COMMA-Z filter, along with a signal differentiation method and a DFS (depth first search algorithm) [29]. This allowed for understanding not only the deadly conditions, but also the patients’ heart data after undergoing certain heart surgeries.
The COMMA-Z filter was implemented and designed for a GPU to perform prediction and analysis studies, and this could not be possible without the Vishay VCNL high-power IRED advanced proximity sensor, which incorporated powerful photodiodes and amplifiers into one single CMOS process that consisted of high-sensing capabilities using green and red LED light reflections [30]. The proposed method in this paper is explained from the ground up, and prediction and analysis of heart disease are widely discussed and analyzed. Various clinical datasets were generated from real patients for heart data. The reason for choosing the GPU was to quicken the process without errors, in order to predict well in advance an arising heart condition. An overall true positive rate (TPR) of 98.95% was achieved with a true negative rate (TNR) of 14.78%, suggesting that PPG is a more viable option for arrhythmia detection than ECG if the PPG sensor is placed at the earlobe region. This overall rate is also due to GPU parallel computing using COMMA-Z filter, and related filtering techniques, and this rate would not be possible if there was only a CPU. To understand the occurrences of atrial and ventricular conditions, we have worked with top cardiologists from Beaumont Hospitals and have received their feedback and support. Atrial Fibrillation has chaotic signals with irregular RR intervals with varying rhythm, and the signal has no pattern, with a lot of jitters, as shown in Figure 1 [31]. Atrial rate varies between 300–700 beats per minute and ventricular is typically between 80–180 beats per minute. Ventricular Fibrillation leads to death and a person’s lifespan is lowered if this condition occurs. This condition shows a high heart rate of 150–500 beats per minute on the ventricular side with disorganized rhythms and the patient dies due to stroke or cardiac arrest, as shown in Figure 1 [32].
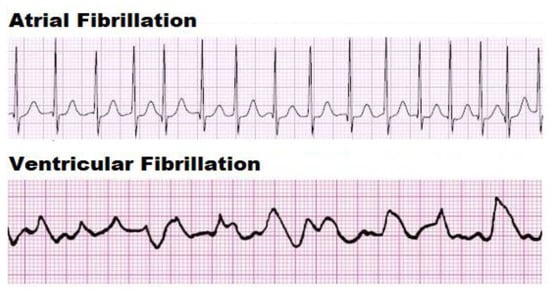
Figure 1.
Atrial and Ventricular ECG Signals [31,32].
The algorithm in this work is designed to consider various environmental conditions and surroundings for better performance and noise reduction. Experiments were conducted to show how the COMMA-Z filter behaves both for a CPU and GPU, using CUDA programming techniques while resting, standing, dancing and driving, both for fingertip and earlobe placement. Also, the data were provided to medical professionals to understand and assist in early detection and diagnosis of a few major cardiovascular illnesses such as Ventricular Fibrillation and Atrial Fibrillation, and to make predictions for any high risk of stroke and cardiac conditions.
3. Proposed System
GPU and CPU communicate via PCI bus and, to implement a best-performance design, CUDA-related programming techniques and methods should be thoroughly understood; any failure to do so leads to design failure and functionality failure. Herein, CUDA techniques were implemented for COMMA-Z filtering for best results. We have made sure that the experimental results were compared for both CPU and GPU.
The proposed system operation is defined in Figure 2: the PPG sensor is placed at the earlobe for this research work, since placement of this sensor at the wrist is more prone to artifacts for any kind of activity. For experimental results and comparison, sensors are placed both at the earlobe and fingertip. The CPU reads all the earlobe device sensor-based data and then loads all the data to the GPU. The raw sample data are divided into a number, N, of thread blocks for parallel processing, and later the GPU output offloads the results back to the CPU for any further computation. The target GPU comprises of the COMMA-Z implementation and related signal differentiation filter, along with DFS algorithm, for prediction of Ventricular and Atrial Fibrillation diseases. Detailed design and algorithm structure are discussed in the software and hardware section of this paper. The traditional moving average filtering techniques were demonstrated and implemented in our previous publications while comparing to Apple Watch, but this work showcases how a moving average filtering technique on a GPU was better than a traditional moving average filter on a CPU and Apple Watch [22], KardiaBand Mobile app or any other third-party device.
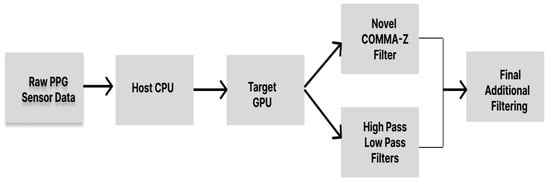
Figure 2.
Proposed System Design using GPU and COMMA-Z.
The Vishay VCNL sensor current and measurements/sec settings were automated based on the patient or user skin thickness by the algorithm only based on the collection of initial data. In this paper, based on the algorithm, we sent register commands to the earlobe device sensor for best predictions based on initial sample collection of raw data from the sensor. Hence, the sensor initially preset to default values and later set values accordingly based on the thickness of the skin, if required, for optimized GPU computing. Our daily computed results were predicted and analyzed for any arising conditions in the future. Measured ECG and PPG waveforms were totally different. PPG measured in the fingertip/wrist and earlobe are discussed in the methodology section of this paper.
The number of blood vessels in the earlobe is high compared to any place in the body, making it ideal, while the considered R-peaks for PPG at the fingertip/wrist require a higher current setting than at the ear when measuring raw heart data using green and red LED. Our skin color is due to melanin and melanin is a very good absorber of green light [33], meaning darker skin can absorb more light, but red light is also widely used in hospitals, especially for finger pulse oximetry devices. Red light is not well-absorbed by the skin; hence, it can travel more deeply into the body and sense multiple bed tissues, in which multiple signal variations and noise can help prioritize noise reduction and signal purification for more sensor accuracy [22]. In this paper, the red light at the earlobe was used from the earlobe device sensor to demonstrate the work. To finally conclude, the COMMA-Z filters, along with signal differentiation filter and DFS algorithm, were applied on a GPU using extremely accurate raw sensor data from the Vishay VCNL sensor placed at the earlobe, to output real-time computed heart data for medical professionals to compare, understand and predict any arising or existing heart-related conditions such as Ventricular and Atrial Fibrillation arrhythmias, to make assumptions for any high risk of stroke and to provide medical diagnosis after surgeries, including arising serious heart conditions. The data here in the paper were collected while a patient or user was resting, standing, walking and driving.
Methodology
In this section, various methods were used to compute raw data for Atrial and Ventricular Fibrillation using sensor implementation. The methodology used to predict heart rate was via the earlobe in this paper, but fingertip is also widely-used in hospitals. However, the varying signals and noise corrections can be applied widely in earlobe as well and then compared to the fingertip, due to there being more blood vessels in the earlobe and chosen red light penetration depth into the skin, allowing a multi-spectroscopy approach for better sensor accuracy [34]. The fingertip-measuring waveform and the earlobe-measuring waveform vary slightly: the fingertip waveform shows an R-peak with systolic and diastolic states, but the earlobe sensor shows the P-peak. The VCNL high-precision proximity sensor on the earlobe is a combination of a photodetector, VCNL ASIC and IRED. The IRED was a combination of both red and green light and, herein, we used red LED to perform experiments. The Kodak grey card reflective material was 18 percent better than the traditional reflective devices, which improved and enhanced the light throughput deeper into the skin, and absorbed it back more efficiently, as shown in Figure 3. Figure 3 depicts an earlobe with arteries and veins.
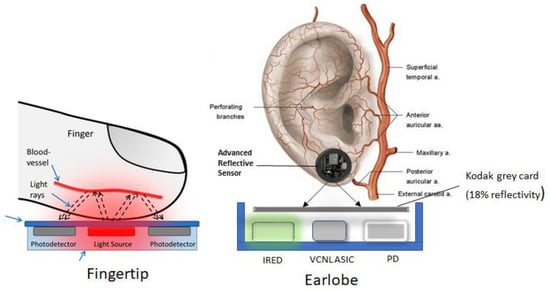
Figure 3.
Fingertip and Earlobe Sensor Placement and details.
Here, the external carotid was connected directly to the heart valves. The earlobe is one of the strongest pressure points, with very few artifacts when compared to the fingertip. To keep up with preliminary testing, the patient or the user wore the PPG sensor on the earlobe. The sensor data were collected based on the COMMA-Z classifier applied to GPU, which is discussed in the software design section, and the GPU-computed data were sent to medical professionals to monitor, predict and understand heart-related arrythmias and arising conditions. As shown in Figure 4, we observed the conditions in the ventricle and atrial areas of the heart for Ventricular and Atrial Fibrillation diseases. Both these conditions are considered dangerous and troublesome. These conditions should be well-understood and treated. Medically, various methods are used to diagnose these diseases, but early detections are challenging; relevant research is developed and discussed in this paper. To do this requires thorough understanding of the heart to develop the research work; the EKG Guy online cardiology course, conducted by surgeons and PubMed cardiovascular training group, was helpful for this [35].
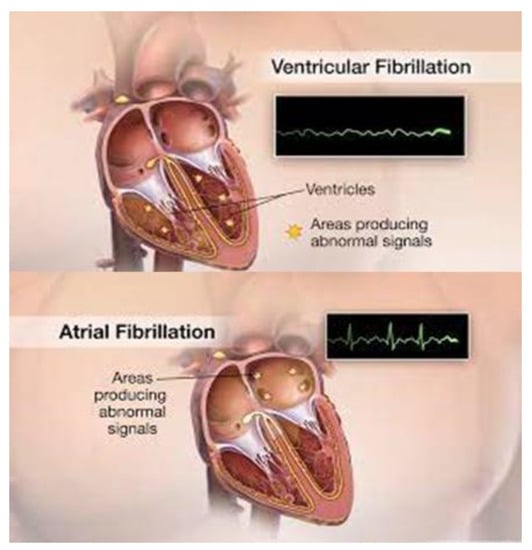
Figure 4.
Ventricular and Atrial Signals of the Heart [36].
Hence, before developing this excellent work, the main author and researcher attended classes and courses from the EKG Guy [35], which is a famous online medical course designed to train students to understand the heart and its related conditions, helping engineers to easily develop algorithms and apply filters for diseases such as Atrial and Ventricular Fibrillation arrythmias.
The COMMA-Z filter was applied, along with other filters, to predict and analyze Atrial Fibrillation, as shown in Figure 5, which also applies, similarly, to Ventricular Fibrillation prediction and analysis as well. Figure 5 shows real-time Atrial Fibrillation data from a male patient marked in red, compared to another patient of similar age who showed normal sinus rhythm (NSR), marked in blue. Both these subjects were 48-year-old male individuals. As shown in Figure 5, there are two signals, and both these signals represent filtered output after applying the novel COMMA-Z filter on a GPU, using Vishay PPG sensor data collected from the earlobe. When the subjects showed signs of cardiac condition, the signal was shown in red—which was the Atrial Fibrillation—and the signal in blue came from the computed normal sinus rhythm data with no cardiac conditions.
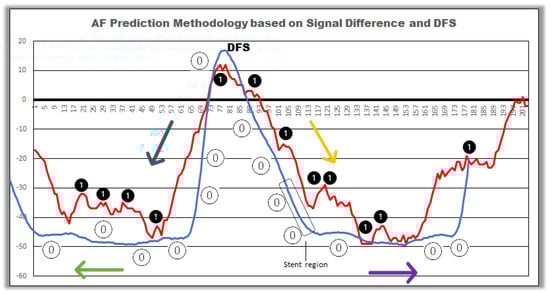
Figure 5.
Atrial Fibrillation Prediction using Signal Difference and DFS.
In this experimental method, both waveforms were put together with two different scenarios, which helped to develop the baseline and understand the Atrial Fibrillation prediction using signal differentiation and DFS algorithm. COMMA-Z is a continuous median-moving average filter applied with varying thread blocks on a GPU using 5-point average calculation and zero cross detection algorithm, initially using CUDA techniques. Hence, Figure 5 shows outstanding results from the novel filter but we had to implement a few more filters to develop the analysis and prediction, to satisfy the true positive values for Ventricular Fibrillation and Atrial Fibrillation on a GPU; the additional filters were the signal differentiation method and DFS method. The signal differentiation method was used to find the difference between the previous occurring data point and the next-occurring data point. These differences are shown as number 1 in Figure 5 for red signal and number 0 in Figure 5 for blue signal.
The Atrial Fibrillation red signal contains a chaotic signal with varying amplitude and highly irregular RR-intervals, with no P-wave; it is marked as number 1 based on the filters’ output. In the GPU kernel algorithm, if any occurring data point differences are more than a certain set threshold when compared to the normal sinus rhythm signal, then that data point is also marked as number 1, to show that there are various irregular jitters and unknown signals, and that there could be a possibility that the signal represents an Atrial Fibrillation condition. The signal difference is used to differentiate the data points in both the red and blue signal and then compare those signals for medical professionals for thorough analysis. After the signal differences and further applied depth first search algorithm, applied as a kernel on the GPU for both the signals, the colored arrow marks show how the left, right and bottom traversals’ data are fed to the DFS kernel, which is a node shown in Figure 5. From there, if the traversals predict at least number 1 in any direction in any part of the signal, then there is a percentage prediction from 45% to 98%, based on the occurrences of number 1 for Atrial Fibrillation prediction in red signal, while number 0 is always considered normal sinus rhythm, as shown in Figure 5. The signal difference and DFS algorithm help predict, analyze and understand the heart signal thoroughly, not only for arrythmias, but also for patients who have undergone surgeries such as stent and angioplasty because, based on discussion with surgeons, the signal waveform varies at the stent region for normal sinus rhythm as well, as represented in Figure 5.
4. System Design
In Figure 6, we observe the ear with veins and arteries; one of the main arteries is connected to the heart valves directly and, hence, the blood flow to the head region is very high and constant. Many theories, along with surgeons and doctors (as well as our research work), agree that the head is always warmest in the body and the heart pumps blood accordingly so that our ears are the warmest. As shown in Figure 6, the circular earlobe device, with sensor package placed on the earlobe, is a combination of a VCNL high-resolution sensor and a standalone microcontroller for establishing I2C and Wi-Fi communication. The sensor consists of a 3.3 V rechargeable coin cell battery, which is inbuilt. The circular device mounting is a proprietary design, and the initial development was performed using Devkits. The circular earlobe device sensor package consists of a Vishay VCNL high-resolution proximity sensor, along with a 32-bit microcontroller that has inbuilt Wi-Fi capabilities.
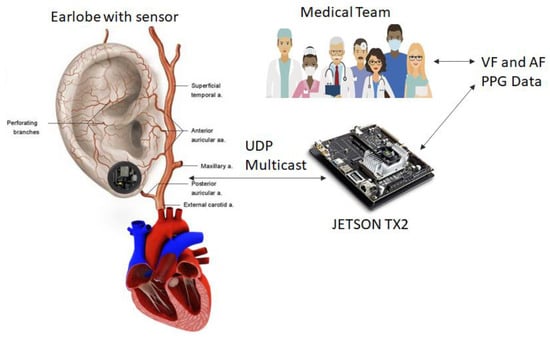
Figure 6.
System Design using Circular Earlobe sensor and Jetson Tx2.
The microcontroller sends register settings, commands and wakeup signal to the Vishay sensor and the sensor capabilities were already discussed in the methodology section, as shown in Figure 3. The circular earlobe device sensor is a combination of a microcontroller and a Vishay VCNL Bio sensor for measuring Photoplethysmography when placed at the earlobe. The heart blood volume circulation and reflected heart data, based on the earlobe settings, are preset to default by the microcontroller (including values such as the current and the measurements/sec) and this raw heart blood volume circulation and reflected data are sent to the Jetson Tx2. Once these data are received at the Jetson hardware via UDP multicast, the CPU collects the data and loads the data to the GPU memory via PCI Bus. Next, the GPU applies the COMMA-Z filters accordingly, based on the algorithm developed. Here, the raw values range from 0–65,535 and are based on the current and measurements/sec; every patient and user has the raw data values range within 0–65,535. If the CPU within the GPU collects raw heart data for some reason that predict 0 or out of range, then, most of the time, the sensor current settings will be automatically requested to be decreased based on the default settings, and the microcontroller on the circular earlobe device sensor resets the values accordingly. This technique is applied because of the skin thickness of the patient or user, which plays a major role in this paper. Once all values fall within 0–65,535, the process continues, and the GPU executes the COMMA-Z filter while applying signal differentiation and then, finally, DFS for arrythmia prediction and analysis for medical professionals.
Software coding for COMMA-Z filters and other related filters are discussed in the software section of this paper. The circular earlobe device with a sensor and a microcontroller has an inbuilt charging circuitry as well. The GPU-related thread blocks are calculated based on incoming real-time heart data and the kernels are applied accordingly for computation. Majorly, our computation was performed by optimizing the kernels using shared memory. Heterogenous computing is a combination of host and device integration of data via PCI bus. In this paper, the host was the CPU and the device was the GPU. We applied the raw data for both the CPU and GPU on a Jetson and compared these signals. The CPU always receives the data first and then sends them to its functions, simultaneously loading the data to the GPU kernels for computing. The COMMA-Z filter was designed as functions on CPU and kernels on GPU and the experimental section shows the final output results. Various experiments were conducted along with many use cases to understand environmental conditions, as we know that the circular earlobe device behaves and adapts to changing current and measurements/sec values while resting, walking, dancing and driving, based on the thickness of the skin of the user. The COMMA-Z filter applied using the CUDA technique is a challenging task that leads to tremendous results when applied on a GPU, predicting and analyzing arrythmias and conditions better and faster than any existing method or sensor on the market. The medical team will have access to the GPU-computed data. These data were compared to previous collections of the heart data and analyzed, as well, for any existing or occurring conditions, and for general comparisons for arising heart disease such as arrhythmia, tachycardia, bradycardia, sudden cardiac arrest, seizures and high risk of stroke. However, in this paper, we will focus only on Atrial and Ventricular Fibrillation arrythmias. The doctors can request different proximity and current, if required, via cloud to the circular earlobe device of the patient or the user via Wi-Fi. This feature is implemented here as well but we will not be demonstrating this feature, due to some limitations on development and scope of work.
4.1. Hardware Design
The circular earlobe device is a combination of both a VCNL high-precision proximity sensor and an ST microcontroller. The power consumption is 3.3 V and 100 mA–200 mA from both these devices. The circular earlobe device consists of two important components, as shown in Figure 3: the Vishay proximity high-reflective sensor and ST microcontroller. The ST microcontroller is connected to the Vishay proximity sensor via I2C bus and the microcontroller sets up the registers for the current and measurement/sec for the sensor and, also, activated the UDP connection for the Jetson TX2 hardware to send the raw heart data for computing. The circular earlobe device also has a feature to update the software via OTA. Currently, this feature is available and fully functional.
4.2. Software Design
The software section explains algorithm methodology followed in order to design the system interaction between the circular earlobe package sensor module and the Jetson Tx2 GPU. As discussed in the previous sections, the algorithm explains the methods of continuous moving average filters on a GPU. The first method implementation is at the ST microcontroller part of the earlobe device and, next, is the COMMA-Z filter implementation, along with signal differentiation filter and DFS algorithm, at the Jetson hardware to predict and analyze Ventricular and Atrial Fibrillation. As shown in Figure 7, the first method of development was implemented for the ST microcontroller to control the Vishay sensor while setting registers for current and measurements. In this paper, the simplest average filter has been used to implement the COMMA-Z filter:
where N is the window size and L is the data length.
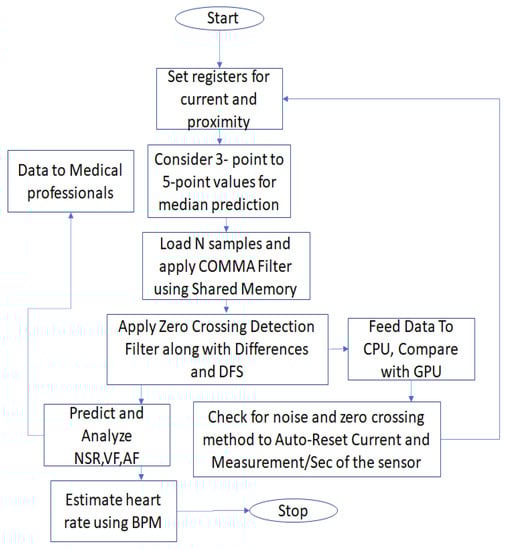
Figure 7.
Software Algorithm Flowchart.
The second method implementation is where the connection is established between the circular earlobe device and the Jetson Tx2 via UDP and, once the Jetson board CPU receives the first set of samples, the samples are fed to the GPU kernels using thread blocks for computing via PCI bus using shared memory. Here, the novel COMMA-Z filter is implemented along with signal differentiation and DFS. We implemented 4 kernels to achieve this computing algorithm. To discuss the COMMA-Z algorithm, the 5-point median filtering was applied to the first kernel of the GPU: the first kernel reads the raw values from the sensor continuously in real-time and finds a median in real-time recursively for a set of values and the next occurring set of values. This median filtering was designed from 3-point prediction until 12-point prediction but with more points, the smoother the signal becomes, and even the diastolic peak was not visible sometimes. Refer to Figure 8 for the diastolic peak. Hence, based on research, we found that 5-point was the best prediction point range for a set of 100–200 raw samples of raw heart data, noise and vibration data. In this kernel, the majority of noise and vibrations are removed.
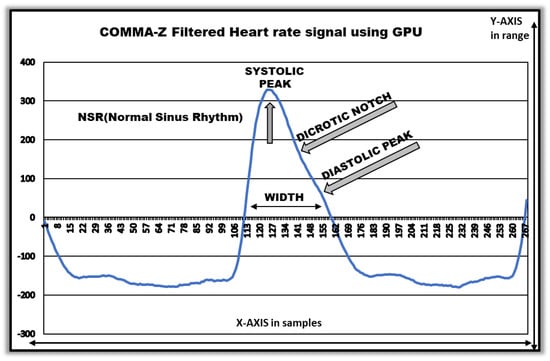
Figure 8.
GPU-Filtered Normal Sinus Rhythm.
Next, we perform the second kernel, which is the moving average to the existing median kernel output from the 5-point prediction values. This particular process can also be achieved using 5-point on a CPU but it does not compute well, when compared to the GPU, with such an enormous amount of data on a CPU, because on a CPU, we use loops to compute and store some values in an array and compute again, but for GPU, there are just thread blocks and computing that occur parallelly. We apply thread synchronization to make sure all the threads are computed. For the GPU, when we compared to the CPU, the benchmarking results showed that we achieved approximately 132.20 times faster and better results than the CPU; we discuss this more in the experimental section. The third kernel is the zero crossing detection algorithm, where the threshold presets values for the final signal from kernel 2. Finally, in the fourth kernel, we apply the data point difference for a signal outputted from the zero cross detection followed by DFS (depth first search algorithm) for prediction and analysis of Atrial Fibrillation and Ventricular Fibrillation. We conclude that the GPU is approximately 132.20 times faster and better when compared to the CPU or other existing devices on the market, such as Apple Watch and KardiaBand Mobile or any other third-party sensors. We computed all the kernels on a GPU while patient or user was resting, standing, walking, dancing and driving and, in this paper, we experimented with various methods and combinations to predict and understand these scenarios. Figure 7 shows the algorithm flowchart which includes all 4 kernels of the GPU.
5. Experiment and Analysis
While working with one of the top surgeons from Michigan, who is also one of the authors in this paper, the related outcome of these experiments was thoroughly communicated and experimented. In this paper, the raw data were processed with various filters, as discussed in the methodology section and system design section. The software algorithm developed for filtering was applied on both CPU and GPU and benchmarked accordingly for various use cases and conditions. As shown in Figure 8, the waveform clearly explains the content of the PPG signal. The signal waveform was a final output after applying the COMMA-Z algorithm. The systolic peak, dicrotic notch and diastolic peak are the most important occurrences of a PPG heart signal. All these occurrences on a signal are at both the earlobe and fingertip. The generated heart rate sample below is from a subject who was a 32-year-old male participant.
The computed data here represent a 5-point median moving average filter that is perfectly aligned to a traditional PPG signal. This below signal was obtained at 40 mA current with 16.625 measurements/sec. Figure 8 shows the NSR (normal sinus rhythm) signal and we used this to compare with other arrythmia conditions. This paper discusses the use cases when a person is resting, standing, walking, driving and dancing. As demonstrated in Figure 9, the male subject was 29 years old; we applied the same current and measurements as shown in the previous experiment and we observed that the signal was computed precisely for any incoming raw data from the fingertip with some amplitude and time/sec changes at y-axis and x-axis. We have conducted a combination of both fingertip and earlobe for various environmental conditions while changing current and measurements.
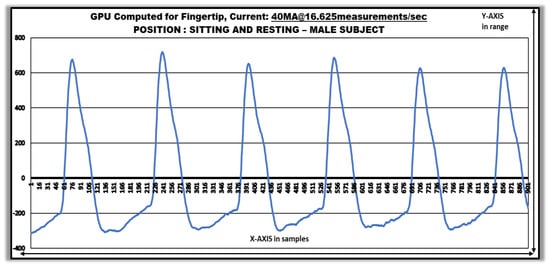
Figure 9.
GPU-Computed Data Using Fingertip: Observation Set A.
In Figure 10, we manually updated the current and measurements/sec accordingly for the sensors, via the OTA access to the circular earlobe device sensor, to observe the changes in the GPU computing at the fingertip, compared to the previously-participated 29-year-old male subject. We determined that the amplitude at the y-axis was not greater than 380 and had been reduced when compared to Figure 9, which was 700. Additionally, the width in Figure 10 was formed slightly better than Figure 9, showing better computation at the dicrotic peak. In Figure 11, we had an opportunity to compute GPU data for a male subject who was 35 years old, and we saw that while he was standing and walking, there were jitters and some added noise due to artifacts, which were later fixed by setting the current sensor values for less penetration of current to the skin, because the raw value in this situation was between 63,000–65,000, showing it was too high of a current. To all the use cases and to all the participants here, we have applied COMMA-Z to predict the results.
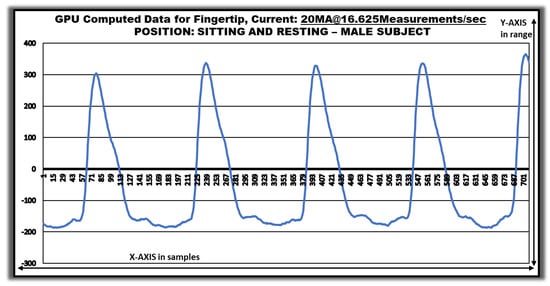
Figure 10.
GPU-Computed Data using Fingertip: Observation Set B.
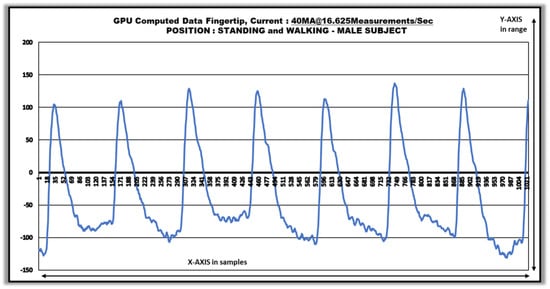
Figure 11.
GPU-Computed Data using Fingertip: Observation Set C.
Therefore, a solution for Figure 11 was to design Figure 12, where we reduced the current and increased the sampling rate measurements/sec and, finally, the results showed better output. In practice, this part will be performed by the CPU automatically if it observes a raw value out of range.
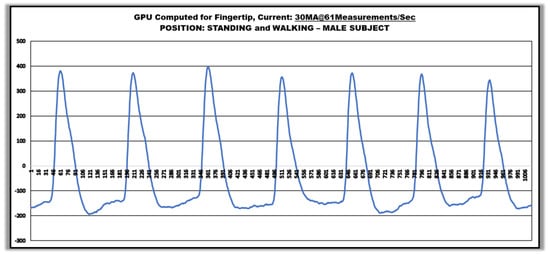
Figure 12.
GPU-Computed Data using Fingertip: Observation Set D.
We manually, via OTA to the sensor register, updated the current to 30 mA, performing 61 measurements/sec. We finally concluded that Figure 12 showed better results in computing the jitter noise and related artifacts while standing and walking. Thus, sometimes providing more samples will also be a disadvantage, as we might lose some necessary signals, such as stent placement, for a patient who might have undergone cardiac surgery and angioplasty. We have considered such scenarios while developing the algorithm.
Then, we asked the subject to dance, move and perform some activity. As shown in Figure 13, the amplitude and width of the signal were reduced because the subject was breathing faster when compared to walking and standing, and we could see how well the signal was computed without any noise and vibration. Here, we increased the measurements/sec to 250, providing an enormous amount of data to the GPU to perform better computation.
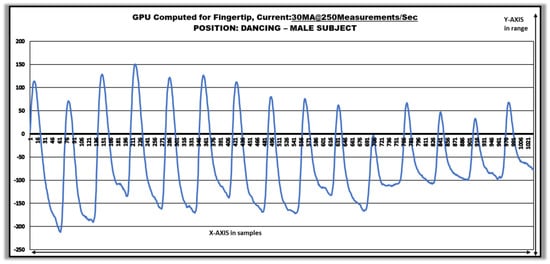
Figure 13.
GPU-Computed Data using Fingertip: Observation Set E.
By demonstrating these use cases and conditions, we were trying to filter noise and correlated environmental vibrations, which helped to develop a better continuous median-moving average filter on a GPU. In Figure 14, we applied a similar algorithm method to the earlobe, and this is the region highly recommended in this paper for prediction and analysis of Ventricular and Atrial Fibrillation.
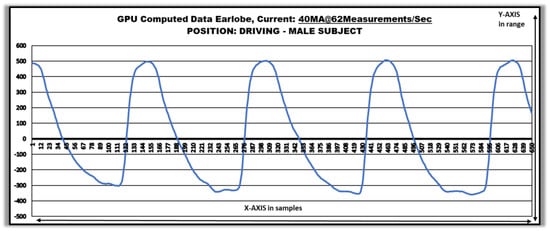
Figure 14.
GPU-Computed Data using Earlobe.
The participant was a male subject who was 41 years old, and this time we conducted this experiment while the participant was driving. We started recording and computing data while he was driving. Based on the current and measurements/sec, we could compare how well the data had been computed based on the width, dicrotic notch and peak, but irregular intervals and faster or slower atrial and ventricular rate could more easily be predicted than on a fingertip. The earlobe normal sinus rhythm was as shown in Figure 14. Figure 15 shows the GPU-computed Atrial Fibrillation data at the earlobe from a male subject who was a current patient. As our device required passive touch capabilities, it was easier and faster to collect data using the PPG technology to compute, and we have already discussed one of these signal predictions and analyses in the methodology section as to how we predicted the Atrial and Ventricular Fibrillation.
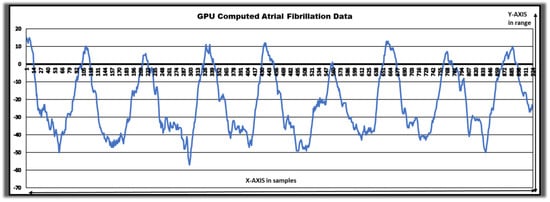
Figure 15.
GPU-Computed Atrial Fibrillation Data.
The signal was compared with the normal sinus rhythm and then we proceeded to apply signal differentiation and DFS kernel on the GPU after we received the COMMA-Z filtering. The signal description in Figure 15 clearly showed the prediction of atrial fibrillation. We also ran the similar functions used for a GPU on a CPU-only device and found that the computation and prediction were inadequate. We have more use cases that show how well CPU and GPU computed such data.
The Jetson Tx2 is a combination of CPU and GPU, connected via PCI bus, where we applied COMMA-Z filter to CPU as well for comparison. In Figure 16, we made sure that the same raw data from the earlobe device were being sent to the CPU on Jetson device, which is marked as series 1 in the figure, and GPU, which is marked as series 2. Here, speed did not come into picture because we wanted to compare how the novel COMMA-Z filter behaved on both CPU and GPU.
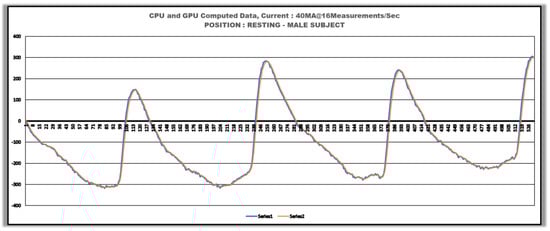
Figure 16.
GPU- and CPU-computed signals using Earlobe.
While benchmarking this work, we observed that the CPU had more noise and jitters, as well as unpredicted signal variation or some unknown spikes which did not compute very well with an enormous amount of data. However, GPU that does use the 5-point Median technique outperformed the CPU along with moving average and zero crossing algorithm kernels. When we zoomed into Figure 16, we observed the difference clearly, in that the prediction of signals may be showing improper computation for arrythmias if using a CPU or any third-party device on the market.
Finally, from Figure 16, we also understand that during acute Myocardial Infarction, or any arising conditions when a stent is placed, the observation of the signal with and without stent can clearly and thoroughly be observed on a GPU better than a CPU [4,7,25].
This observation will lead to solving many arising problems and helps find easy solutions for medical professionals. Any detections can easily be observed using the GPU-computed signal rather than using a CPU [4,7,25]. In Figure 17, we applied the raw data to the CPU and GPU simultaneously to see how fast the prediction and analysis were and also how clean the signals were; we concluded that the GPU was 132.20 times faster than the CPU. In Figure 17, we see that the GPU signal has already computed the raw data while the CPU is still computing. The major core reason for the time delay here is because of the 3-point and 5-point median filtering. The 3-point filtering is the best performance a CPU can obtain because, if it is more than 3-point (such as 5-point), then the loops have to store the array data repeatedly and move the window continuously, which will consume time while losing data based on environmental conditions or improper computation. Conversely, in GPU, the best performance can still reach up to 8-point but, for these scenarios, 5-point was the best method because the window moves continuously for all the threads in a block, synchronizing the threads. Nevertheless, the zero crossing algorithm behaves similarly for both CPU and GPU but the GPU again outperforms the CPU for signal differentiation and DFS for prediction of diseases and conditions. In Figure 18, we made use of the Physionet data available to show how a normal sinus rhythm and Ventricular Fibrillation look, because ventricular condition data cannot be collected from patients, since this situation is extreme and the person is under emergency care, due to their high heart rate and possibility they may soon die or end up in cardiac arrest. These signs and predictions in early stages can clearly be predicted using the GPU, COMMA-Z, signal differentiation and DFS algorithm, which similarly predict other diseases and conditions as well. The below signal is an ECG from Physionet but the behavior is similar for PPG because Ventricular Fibrillation has no rhythm and a chaotic signal with very high heart rate. The signal differentiation and DFS method can easily predict in real-time when computed on a GPU.
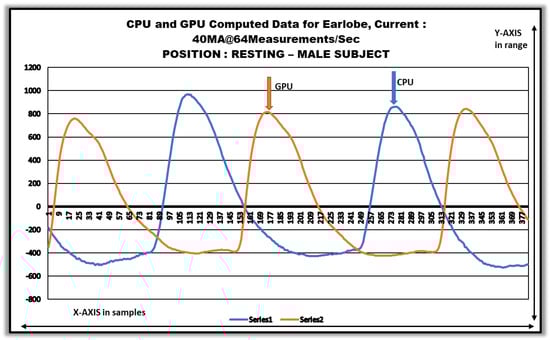
Figure 17.
Parallelly computed GPU and CPU data using Earlobe.
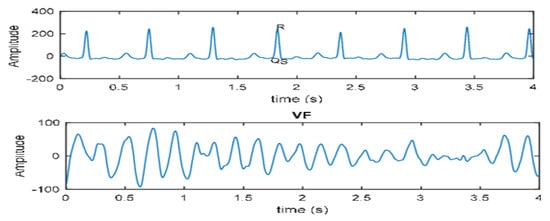
Figure 18.
Comparison of Ventricular and Normal sinus rhythm signals.
Figure 19 shows an experimental observation of squash players with the sensor attached to the earlobe while playing. As observed in Figure 20, Athlete 1 and 2 show tremendous changes in CPU and GPU data when zoomed in. The filtering techniques were conducted at similar speeds here but the GPU, in general, computed faster and more smoothly than the CPU. The zero crossing detection is clearly observed in Athlete 2 where some spikes do not satisfy the algorithm.
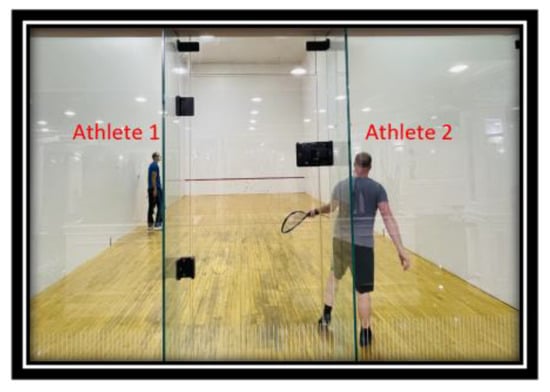
Figure 19.
Collecting Squash players Earlobe Data: Observation Set F.
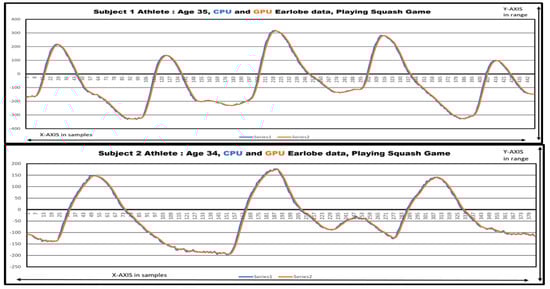
Figure 20.
Squash Players’ Earlobe data computed on a CPU and GPU while playing.
Figure 21 showcases the observations to demonstrate the atrial and ventricular data. The atrial data for a patient were discussed earlier but the computed ventricular data were placed alongside to show that the signs of RR intervals for ventricular do not exist, even with rapid and intense heartbeats from the heart. One such scenario is clearly observed in Figure 22, showing a sudden death situation in a few minutes.
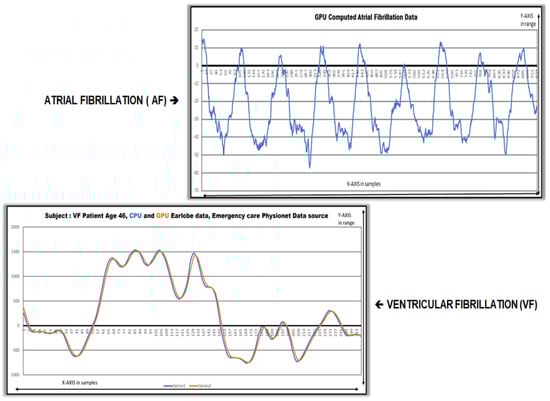
Figure 21.
Atrial and Ventricular Data in real-time.
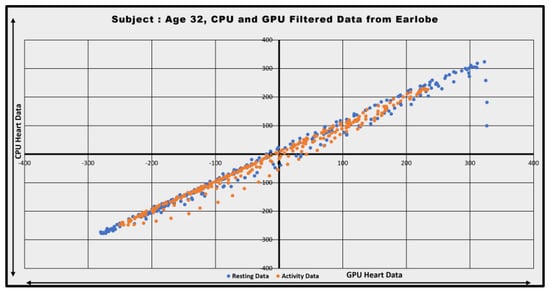
Figure 22.
Normal Sinus Rhythm representation for CPU and GPU.
Figure 22 represents the normal sinus rhythm occurrences computed both for a CPU and GPU and the data seems to be evenly spread from left ventricular to right ventricular region. While resting and performing some activity, the heart rate increase can be observed in orange color, showing increased heart rate. Similarly in Figure 23, the normal rhythm in blue and ventricular data in orange are observed. The ventricular data are widely spread with no rhythm. Meanwhile, the signal is rapidly moving around the left and right ventricular region, which clearly shows signs of critical heart conditions.
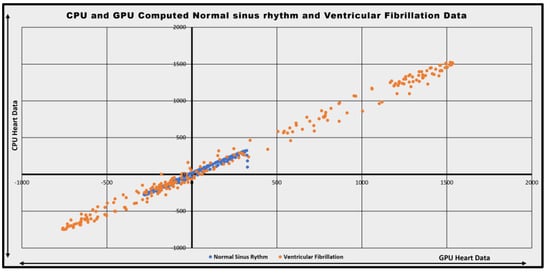
Figure 23.
Normal and Ventricular Fibrillation Representation.
6. Conclusions and Future Work
In this paper, to understand the electrical activity of the heart and its arrhythmias, we first introduced how Myocardial Infarction plays a vital role in the occurrences of Ventricular and Atrial Fibrillation, which are two of the most widely-occurring arrhythmias. To detect these arrhythmias, we designed a circular earlobe device that consists of a Vishay vocal sensor and a microcontroller placed at the earlobe. We discussed how GPU and CPU computed the raw heart data using novel COMMA-Z filter and developed some use cases and studies for heart data and arrythmias in the experimental section. The prediction was part of the studies and results are shown in the experimental section, computed using COMMA-Z, that outputs heart data as shown in the figures. All the figures shown are possible using only the COMMA-Z filter, CPU and GPU. In the methodology, system design and experimental sections, it is explained how data point signal differentiation and DFS algorithms were used to detect Atrial and Ventricular Fibrillation using COMMA-Z, and how these algorithms can also help understand patients who have undergone heart surgeries such as stent placement.
The GPU CUDA architecture and techniques helped compute heart data in a better and faster way than a CPU or any existing third-party device on the market for medical professionals. We also worked with top surgeons and took cardiology courses to understand the heart and its related conditions and diseases, which was very helpful while developing the entire concept from the ground up. The experimental results were also conducted on patients who participated to provide us heart data for GPU computing and research studies while resting, standing, walking, dancing and driving so that we could conclude with better results. The future work here is to feed the GPU-computed, -predicted and -analyzed heart data to an AI model and train the models accordingly on a GPU. The future work will also be to innovate similar methods from the ground up for other arrythmias using GPUs.
Author Contributions
G.S., S.A. and S.R.D.: Writing—original draft. All authors have read and agreed to the published version of the manuscript.
Funding
This research received no external funding.
Data Availability Statement
Not applicable.
Conflicts of Interest
The authors declare no conflict of interest.
References
- Pereira, T.; Tran, N.; Gadhoumi, K.; Pelter, M.M.; Do, D.H.; Lee, R.J.; Colorado, R.; Meisel, K.; Hu, X. Photoplethysmography based atrial fibrillation detection: A review. NPJ Digit. Med. 2020, 3, 3. [Google Scholar] [CrossRef] [PubMed]
- Väliaho, E.-S.; Kuoppa, P.; Lipponen, J.A.; Hartikainen, J.E.K.; Jäntti, H.; Rissanen, T.T.; Kolk, I.; Pohjantähti-Maaroos, H.; Castrén, M.; Halonen, J.; et al. Wrist Band Photoplethysmography Autocorrelation Analysis Enables Detection of Atrial Fibrillation Without Pulse Detection. Front. Physiol. 2021, 12, 654555. [Google Scholar] [CrossRef] [PubMed]
- Bougouin, W.; Marijon, E.; Puymirat, E.; Defaye, P.; Celermajer, D.S.; Le Heuzey, J.Y.; Boveda, S.; Kacet, S.; Mabo, P.; Barnay, C.; et al. FAST-MI Registry Investigators. Incidence of sudden cardiac death after ventricular fibrillation complicating acute myocardial infarction: A 5-year cause-of-death analysis of the FAST-MI 2005 registry. Eur. Heart J. 2013, 35, 116–122. [Google Scholar] [CrossRef] [PubMed]
- Dixon, S.R.; Legget, M.E.; Wong, S.P. Ventricular septal aneurysm: A complication of myocardial infarction. Echocardiography 2000, 17, 439–442. [Google Scholar] [CrossRef] [PubMed]
- Rich, J.T.; Neely, J.G.; Paniello, R.C.; Voelker, C.C.J.; Nussenbaum, B.; Wang, E.W. A practical guide to understanding Kaplan-Meier curves. Otolaryngol. Neck Surg. 2010, 143, 331–336. [Google Scholar] [CrossRef]
- Yow, A.G.; Rajasurya, V.; Sharma, S. Sudden Cardiac Death. [Updated 8 August 2022]. In StatPearls [Internet]; StatPearls Publishing: Treasure Island, UK, 2022. Available online: https://www.ncbi.nlm.nih.gov/books/NBK507854/ (accessed on 2 December 2022).
- Halkin, A.; Stone, G.W.; Dixon, S.R.; Grines, C.L.; Tcheng, J.E.; Cox, D.A.; Garcia, E.; Brodie, B.; Stuckey, T.D.; Mehran, R.; et al. Impact and Determinants of Left Ventricular Function in Patients Undergoing Primary Percutaneous Coronary Intervention in Acute Myocardial Infarction. Am. J. Cardiol. 2005, 96, 325–331. [Google Scholar] [CrossRef]
- Wang, E.T.; Cirillo, P.M.; Vittinghoff, E.; Bibbins-Domingo, K.; Cohn, B.A.; Cedars, M.I. Menstrual Irregularity and Cardiovascular Mortality. J. Clin. Endocrinol. Metab. 2011, 96, E114–E118. [Google Scholar] [CrossRef]
- Wyman, M.G.; Wyman, R.; Cannom, D.S.; Criley, J. Prevention of primary ventricular fibrillation in acute myocardial infarction with prophylactic lidocaine. Am. J. Cardiol. 2004, 94, 545–551. [Google Scholar] [CrossRef]
- Alonzo, L.M.B.; Co, H.S. Ensemble Empirical Mode Decomposition of Photoplethysmogram Signals for Assessment of Ventricular Fibrillation. In Proceedings of the 2018 IEEE 10th International Conference on Humanoid, Nanotechnology, Information Technology, Communication and Control, Environment and Management (HNICEM), Baguio City, Philippines, 29 November–2 December 2018; pp. 1–4. [Google Scholar] [CrossRef]
- Chon, K.H.; McManus, D.D. Detection of atrial fibrillation using a smartwatch. Nat. Rev. Cardiol. 2018, 15, 657–658. [Google Scholar] [CrossRef]
- Nishiga, M.; Wang, D.W.; Han, Y.; Lewis, D.B.; Wu, J.C. COVID-19 and cardiovascular disease: From basic mechanisms to clinical perspectives. Nat. Rev. Cardiol. 2020, 17, 543–558. [Google Scholar] [CrossRef]
- Chen, T.; Wu, D.I.; Chen, H.; Yan, W.; Yang, D.; Chen, G.; Ma, K.; Xu, D.; Yu, H.; Wang, H.; et al. Clinical characteristics of 113 deceased patients with coronavirus disease 2019: Retrospective study. BMJ 2020, 368, m1295. [Google Scholar] [CrossRef] [PubMed]
- Yanar, E.; Dogrusoz, Y.S. False Ventricular-Fibrillation/Flutter Alarm Reduction of Patient Monitoring Systems in Intensive Care Units. In Proceedings of the 2018 IEEE International Symposium on Medical Measurements and Applications (MeMeA), Rome, Italy, 11–13 June 2018; pp. 1–5. [Google Scholar] [CrossRef]
- Paradkar, N.; Chowdhury, S.R. Cardiac arrhythmia detection using photoplethysmography. In Proceedings of the 2017 39th Annual International Conference of the IEEE Engineering in Medicine and Biology Society (EMBC), Jeju, Republic of Korea, 11–15 July 2017; pp. 113–116. [Google Scholar] [CrossRef]
- Ahmed, Y.; Uddin, N.; Masud, S.M.; Imam, M.H. Design of an Arrhythmia Detection System Using Wearable PPG Sensor. In Proceedings of the 2019 IEEE International Conference on Biomedical Engineering, Computer and Information Technology for Health (BECITHCON), Dhaka, Bangladesh, 28–30 November 2019; pp. 73–76. [Google Scholar] [CrossRef]
- Kim, I.L.C. Methods for Hybrid GPU/CPU Data Processing. U.S. Patent US20150243285A1, 27 August 2015. [Google Scholar]
- Che, S.; Boyer, M.; Meng, J.; Tarjan, D.; Sheaffer, J.W.; Skadron, K. A performance study of general-purpose applications on graphics processors using CUDA. J. Parallel Distrib. Comput. 2008, 68, 1370–1380. [Google Scholar] [CrossRef]
- Armor, W. Enabling the SKA Radio Telescope to Explore the Universe, Nobel Prize: Inside HPC. 2019. Available online: https://developer.nvidia.com/blog/developer-spotlight-enabling-the-ska-radio-telescope-to-explore-the-universe/ (accessed on 2 December 2022).
- Aminpour, M.; Montemagno, C.; Tuszynski, J.A. An Overview of Molecular Modeling for Drug Discovery with Specific Illustrative Examples of Applications. Molecules 2019, 24, 1693. [Google Scholar] [CrossRef] [PubMed]
- Perret-Guillaume, C.; Joly, L.; Benetos, A. Heart Rate as a Risk Factor for Cardiovascular Disease. Prog. Cardiovasc. Dis. 2009, 52, 6–10. [Google Scholar] [CrossRef] [PubMed]
- Sinnapolu, G.; Alawneh, S. A Method of Filter Implementation Using Heterogeneous Computing System for Driver Health Monitoring; SAE Technical Paper; No. 2021-01-0103; SAE International: Warrendale, PA, USA, 2021. [Google Scholar] [CrossRef]
- Kontzer, T. Getting to the Heart of Arrhythmia with GPU-Powered AI. NVIDIA. Available online: https://blogs.nvidia.com/blog/2018/01/22/ai-heart-arrhythmia/ (accessed on 2 December 2022).
- Seshadri, D.R.; Bittel, B.; Browsky, D.; Houghtaling, P.; Drummond, C.K.; Desai, M.; Gillinov, A.M. Accuracy of the Apple Watch 4 to Measure Heart Rate in Patients With Atrial Fibrillation. IEEE J. Transl. Eng. Health Med. 2020, 8, 2700204. [Google Scholar] [CrossRef] [PubMed]
- Goldstein, J.A.; Lee, D.T.; Pica, M.C.; Dixon, S.R.; O’Neill, W.W. Patterns of coronary compromise leading to bradyarrhythmias and hypotension in inferior myocardial infarction. Coron. Artery Dis. 2005, 16, 265–274. [Google Scholar] [CrossRef]
- Fox, K.; Borer, J.S.; Camm, A.J.; Danchin, N.; Ferrari, R.; Lopez Sendon, J.L.; Steg, P.G.; Tardif, J.C.; Tavazzi, L.; Tendera, M.; et al. Resting heart rate in cardiovascular disease. J. Am. Coll. Cardiol. 2007, 50, 823–830. [Google Scholar] [CrossRef]
- Castaneda, D.; Esparza, A.; Ghamari, M.; Soltanpur, C.; Nazeran, H. A review on wearable photoplethysmography sensors and their potential future applications in health care. Int. J. Biosens. Bioelectron. 2018, 4, 195–202. [Google Scholar] [CrossRef]
- Mei, X.; Atturo, F.; Wadin, K.; Larsson, S.; Agrawal, S.; Ladak, H.M.; Li, H.; Rask-Andersen, H. Human inner ear blood supply revisited: The Uppsala collection of temporal bone—An international resource of education and collaboration. Upsala J. Med Sci. 2018, 123, 131–142. [Google Scholar] [CrossRef]
- Soman, J.; Kothapalli, K.; Narayanan, P.J. Some GPU algorithms for graph connected components and spanning tree. Parallel Process. Lett. 2010, 20, 325–339. [Google Scholar] [CrossRef]
- Kazanskiy, N.L.; Butt, M.A.; Khonina, S.N. Recent Advances in Wearable Optical Sensor Automation Powered by Battery versus Skin-like Battery-Free Devices for Personal Healthcare—A Review. Nanomaterials 2022, 12, 334. [Google Scholar] [CrossRef] [PubMed]
- AMR Institute. Identifying and Treating Atrial Fibrillation (AFib or AF). Available online: https://www.aclsonline.us/rhythms/atrial-fibrillation/ (accessed on 2 December 2022).
- American Medical Research Institute. Ventricular Fibrillation. Available online: https://www.aclsonline.us/rhythms/ventricular-fibrillation/ (accessed on 2 December 2022).
- Mehta, A.; Olsen, R.I.; Christman, D.S. Heart Rate and Blood Oxygen Monitoring System. U.S. Patent US20150011851A1, 13 November 2018. [Google Scholar]
- Bsxtechnologies, Red Light versus Green Light: The Future of Optical Sensing in Wearable Devices. 16 August 2016. Available online: https://medium.com/bsxtechnologies/red-light-versus-green-light-74fdd5fe7027 (accessed on 2 December 2022).
- EKG GUY. The Ultimate EKG Experience. Available online: https://www.ekgguy.com/ (accessed on 2 December 2022).
- Med Movie. Available online: https://medmovie.com/library_id/3255/topic/ahaw_0083a/ (accessed on 2 December 2022).


Disclaimer/Publisher’s Note: The statements, opinions and data contained in all publications are solely those of the individual author(s) and contributor(s) and not of MDPI and/or the editor(s). MDPI and/or the editor(s) disclaim responsibility for any injury to people or property resulting from any ideas, methods, instructions or products referred to in the content. |
© 2023 by the authors. Licensee MDPI, Basel, Switzerland. This article is an open access article distributed under the terms and conditions of the Creative Commons Attribution (CC BY) license (https://creativecommons.org/licenses/by/4.0/).