Abstract
Dam safety is an important basic part of national water network security. Building a dam deformation prediction model based on monitoring data is crucial to ensure dam safety. However, traditional statistical regression methods have shortcomings, such as a weak nonlinear fitting ability when constructing dam deformation monitoring and prediction models. The residual part of the statistical regression results usually contains parts that cannot be effectively explained by the linear regression method, that is usually highly variable and noisy. In this study, the phase space reconstruction method is used to smooth the residual term of the statistical regression model to eliminate noise interference. On this basis, an improved long short-term memory (LSTM) neural network is used to learn the nonlinearity contained in the residual term of the linear regression. Considering the impact of parameter selection on model performance, the gray wolf optimization (GWO) algorithm is used to determine the optimal parameters of the model for better performance. A high arch dam is used as a case study, with multiple measuring points used as research objects. The experimental results show that the phase space reconstruction can effectively smooth the high-frequency components in the residual term and remove noise interference. In addition, the GWO algorithm can effectively determine the hyperparameters of the LSTM network, thereby constructing a residual prediction model with high prediction accuracy. The combination of statistical models and deep learning prediction methods can effectively improve the model prediction performance while preserving the model interpretability and transparency.
MSC:
62P30
1. Introduction
There are 98,800 dams in China, that play a significant role in the distribution of water resources, and their functions, such as flood control, power generation, water supply, and navigation have effectively guaranteed the development of the country’s social economy [1]. Benefitting from the strong bearing capacity and anti-seepage performance of concrete dams, concrete dams have become one of the main water retaining structures of water conservancy projects [2,3]. Among the dams under construction or completed, concrete dams account for a relatively high proportion. According to statistics, concrete dams can be regarded as the first choice for dams taller than 60 m. The high dam and large reservoir projects built in recent years have brought many difficulties and challenges to the safe operation of concrete dams due to the ultra-high dam height, reservoir bank mountains, large storage capacity, and harsh service environment [4,5].
Among various monitoring projects of dams, deformation monitoring has the advantages of early measurement time, good stability, high accuracy, long duration, easy maintenance, and monitoring frequency, and provides reliable information for deformation behavior analysis [6,7]. More importantly, deformation, as the most intuitive physical quantity to characterize the operating behavior of concrete dams, can comprehensively reflect the change characteristics of the overall and local structural behavior of concrete dams [8]. Therefore, it has always been a research hotspot in the field of dam safety monitoring to study the characterization method and prediction model of the influencing factors of deformation.
A statistical model method, such as linear regression, is a classic method for dam deformation monitoring [9,10,11]. Benefitting from the intuitive modeling process and good interpretability of statistical methods, statistical methods have been widely used in the field of dam safety monitoring [12,13,14]. Its basic principle is to classify the influence factors of concrete dam deformation into three parts, including water pressure, temperature, and aging, and characterize these factors in the form of polynomials [15,16,17]. However, the linear regression method can only consider the linear relationship between different components of the input, and the fitting ability for nonlinear problems is weak. Dam deformation behavior that is not effectively explained by the statistical regression model is usually included in the residual term [18,19]. Therefore, it is necessary to study the interpretation of the residual term in combination with signal processing methods to provide an important reference for revealing the deformation behavior of the dam.
In recent years, with the rapid development of information technology, the application of artificial intelligence (AI) technologies in the field of dam safety monitoring to build a dam deformation prediction model have become a research hotspot [20,21,22,23]. Many scholars combine deep learning (DL) and machine learning (ML) methods to build dam deformation prediction models [24,25]. For example, Yuan et al. [5] proposed a dam deformation prediction model using the twin support vector regression (TSVR) and the measured air temperature. Ren et al. [26] developed an interpretable mixed attention mechanism long short-term memory method using the encoder-decoder architecture to predict dam displacements. Li et al. [20] proposed a novel distributed deformation prediction method by considering three constituent elements of dam displacement time series using the time series decomposition. However, the deep learning method can only make use of the strong nonlinear simulation ability, and there is little research on improving its interpretability. The weak interpretability of the deep learning model makes it often regarded as a black box model in many practical dam safety monitoring application scenarios, so it is difficult to thoroughly analyze the relationship between input and output.
To address these above-mentioned problems, this study proposes a deformation hybrid prediction method considering residual chaotic characteristics by combining statistical and DL-based methods. Specifically, a dam deformation trend prediction model is constructed combined with dam safety monitoring theory and a linear regression method. On this basis, the residual term is effectively smoothed by the phase space reconstruction (PSR) method, and the redundant noise is effectively suppressed and removed. Then, the gray wolf optimization (GWO) algorithm and the long short-term memory (LSTM ) neural network are combined to construct a prediction method for the residual term of the dam deformation. A high concrete arch dam was used as a case study, and three typical monitoring points of various dam sections were used to test the effectiveness of the model. A range of classical statistical and machine learning (ML)-based methods are used as comparative methods to evaluate model performance.
The rest of the paper is organized as follows: Section 2 introduces the basic theory of the proposed method, statistical monitoring, phase space reconstruction, improved LSTM, and a GWO optimization algorithm. Section 3 describes in detail the project and the deployed deformation monitoring system. Section 4 verifies the effectiveness of the proposed method with specific engineering examples. Finally, the conclusions and discussions are included in Section 5.
2. Materials and Methods
2.1. The Framework
Since the state quantity of the deformation measurement value comprehensively reflects the effect of the influence factor set on the deformation behavior of the concrete dam, it implies all of the variable information of the dynamic change. The influencing factors hidden in the original deformation sequence can extract more information that affects the deformation behavior of concrete dams. Therefore, the PSR denoising algorithm of the denoised deformation deviation sequence is carried out, and the reconstructed space is used as the input of the long short-term memory neural network model. The construction process is shown in Figure 1. The specific implementation steps are as follows.
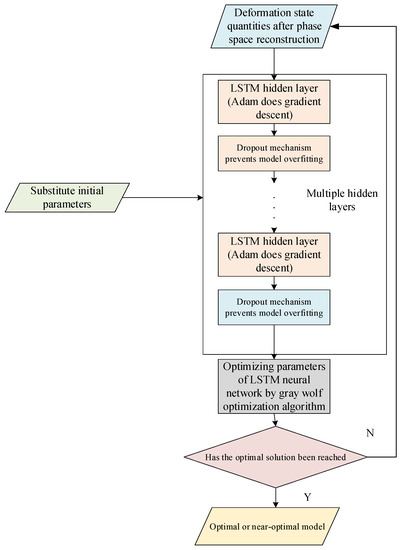
Figure 1.
The calculation process of the dam deformation prediction model.
Step 1: Selection of input and output of the long short-term memory neural network. The phase space reconstruction is carried out on the denoised deformation deviation sequence mentioned above, and the preprocessed deformation difference, such as phase space reconstruction, is used as the input of the LSTM network deformation prediction model, and the output is the denoised one;
Step 2: Initialization of the model parameters. The parameters of the Adam gradient optimization algorithm, GWO algorithm, dropout algorithm, and LSTM network layer are, respectively, initialized and assigned;
Step 3: Train the long-term and short-term memory neural network deformation deviation prediction model under a certain parameter combination. The Adam algorithm is used to solve the gradient and the dropout layer is embedded between the hidden layers to prevent overfitting of the neural network;
Step 4: Use the GWO algorithm to optimize the parameter combination in Step 3. The GWO algorithm is used as the outer loop of the deformation deviation prediction model to find the number of neural network unit layers and the number of nodes in each layer with the highest prediction accuracy, and dynamically save the optimal parameter combination in the optimization process.
Repeat the process similar to Step 3 and Step 4 until the search space of the entire parameter combination is searched, and save the final optimal or near-optimal parameter combination;
Step 5: Substitute the searched optimal parameter combination into the LSTM network model for deformation deviation prediction, and predict the deformation deviation value.
2.2. Dam Statistical Monitoring Model
The dam deformation behavior model driven by statistical models is a classic method of dam safety control. Among them, the hydraulic-seasonal-time (HST) method and its improved model are often utilized to build a statistical model of dam deformation monitoring. MLR is a commonly-used statistical technique that utilizes a linear relationship between a dependent variable (also known as effect size) and one or more independent variables (also known as environmental variables) to model. Specifically, the deformation of the dam can be expressed by the following equation.
where is the hydraulic pressure component of deformation; is the temperature component of deformation; is the aging component of deformation; is the difference between the theoretical calculation value of deformation and the monitoring value of deformation. The prediction error is caused by the influencing factors of the variable input, the lack of nonlinear ability of the statistical model obtained by regression, and the noise caused by external random interference.
where include prediction represents the errors caused by influencing factors that cannot be input as independent variables of the statistical model, represents the errors caused by the insufficient nonlinear ability of the statistical model obtained by regression, and represents the errors caused by external random disturbances.
For the problem of insufficient deformation influencing factor information, the residual of the deformation prediction model can be mapped from a low-dimensional space to a high-dimensional space through the method of phase space reconstruction, and the influencing factor information hidden in the original deformation sequence can be recovered for predicting the dam deformation behavior of concrete dams.
2.3. Phase Space Reconstruction
To solve the mapping of the one-dimensional deformation monitoring sequences to a high-dimensional phase space, the time delay reconstruction method is often used. The reconstruction method can realize the embedding of the one-dimensional deformation measurement sequence into the m-dimensional phase space, so as to restore the deformation influencing factor information hidden in the original deformation sequence.
where is the dimensional deformation state vector of the concrete dam measuring point deformation at the time; is the vector-valued function.
The one-dimensional time series is the deformation monitoring effect quantity of the concrete dam measuring point, and it is also the state quantity of the measuring point, which can be expressed as:
where is the quantitative value function; is the noise generated by the interference of various random factors in the monitoring process.
At that time , by extracting the previous deformation measurement value, the first vector of the dimensionally reconstructed phase space is obtained, the time interval and period are shifted to the right in turn, and the one-dimensional deformation measurement value sequence can be embedded into the m-dimensional phase space. The following expression is as follows.
where is the delay time; is the embedded dimension.
where the parameters are properly selected, the original space can be recovered.
As the service life of dams increases, the scale and dimensions of dam monitoring data continue to increase. To reduce the data scale, it is necessary to introduce the kernel component analysis method to reduce the data dimension [22]. Assuming that the projected new features have zero means, it can be denoted as follows
The covariance matrix of the projected features can be calculated by
The eigenvalues and eigenvectors can be given by
where ; denotes the eienvalues of variables; represents the coefficient of vector.
From the above-mentioned formulas, it can be inferred that
The kernel functions can be denoted as
The matrix notation can be denoted as
where and represent the N-dimensional column vector of . can be denoted as
Based on the above-mentioned formulas, the obtained kernel principal components can be calculated using
2.4. Improved LSTM Architecture
An LSTM neural network is a kind of DL-based method with a cyclic time structure. The LSTM neural network can selectively store, update, and transmit previous inputs in the hidden layer. Specifically, the LSTM architecture can mine information on deformation and influencing factors, achieving a similar memory function. LSTM can automatically mine and utilize the long-term and short-term correlations existing in deformation behavior, and fully consider the impact of historical deformation on current and future deformation behavior. Compared with traditional recurrent neural networks (RNN), it has the advantages of low complexity and fast calculation speed, that can well capture the nonlinear relationship between the effect sizes in the time series. Figure 2 shows the intuitive architecture diagram of the LSTM network with the self-attention mechanism.
where represents the activation function and its specific expression is , the value of is between 0 and 1, where “0” means that the historical information used for deformation deviation prediction is completely discarded, and “1” means that it is completely reserved; is the weight matrix; is the bias term.
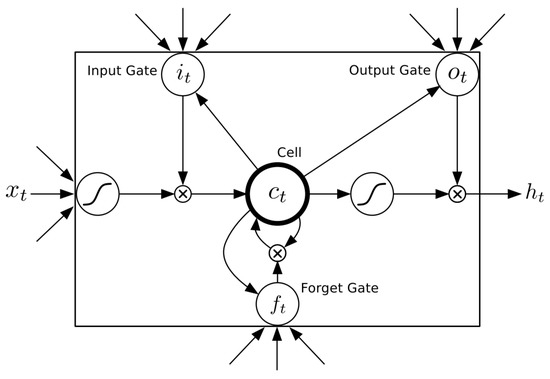
Figure 2.
The intuitive structure diagram of LSTM.
Upon selectively discarding the historical information of the last deformation deviation prediction, in order to update the information matrix used for this deformation deviation prediction, it is necessary to select the deformation deviation related information newly input this time and the deformation deviation prediction value of the previous model. Add new information to the historical information, this part of the information can be expressed as:
where and are the weight matrix; and are the bias terms. Its specific expression is as follows.
The prediction result of deformation deviation will also be passed to the next prediction as one of the input information, and the prediction result of this time needs to go through the output layer of the long short-term memory neural network to obtain the predicted value of deformation deviation. The long-term and short-term neural network prediction model of deformation behavior can be expressed in the form of an implicit function, namely
2.5. Improved GWO Optimization Strategy
The prediction accuracy of the LSTM network for deformation deviation is affected by the above gradient descent algorithm and generalization ability. However, the upper limit of accuracy depends on the selection of the number of network layers and neural units in the model. These parameters are determined by the initial manual assignment, that is highly subjective and contingent, and it is difficult to obtain the optimal prediction model. Compared with other algorithms, the GWO algorithm has the characteristics of a simple structure, few parameters to be adjusted, and easy implementation. The self-adaptive adjustable convergence factors and information feedback mechanisms of the GWO algorithms can achieve a balance between local optimization and global search [27,28,29]. To find the optimal number of layers and units of the long short-term memory neural network prediction model for deformation behavior, Figure 3 shows the combination of the GWO algorithm and the LSTM network to realize the automatic optimization of the number of layers and units in the deformation deviation prediction model. The location of the prey is identified and the schematic diagram of the hunting process is shown in Figure 4.
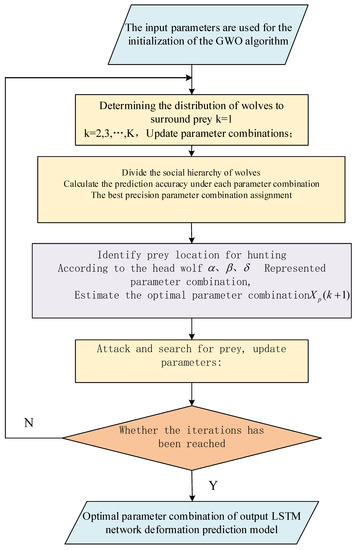
Figure 3.
GWO optimizes the process of LSTM.
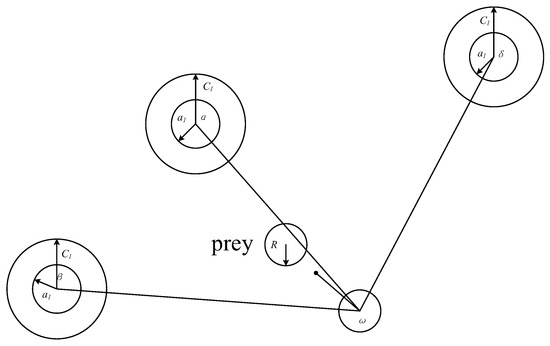
Figure 4.
Schematic diagram of the GWO algorithm.
3. Case Study
3.1. Project Description
The hydropower station is located in Panzhihua, Sichuan, China, 33 km away from the intersection of the Yalong River and Jinsha River. It is a large-scale hydroelectric power generation hub mainly for power generation. The reservoir controls the basin area of 116,400 km2, the normal thin water level is 1200 m, the lowest operating water level for power generation is 1155 m, the total storage capacity is 5.8 billion m3, and the effective storage capacity is 3.37 billion m3. It is a seasonal adjustment reservoir. The power station is equipped with six sets of 550,000 KW hydro-generator units, with a total installed capacity of 3.3 million kW, an average annual power generation of 17 billion kW h, and a guaranteed output of 1 million kW. It is the second-largest hydropower station in China in terms of installed capacity, and the overall top view is shown in Figure 5a. The vertical monitoring system for the dam is shown in Figure 5b.
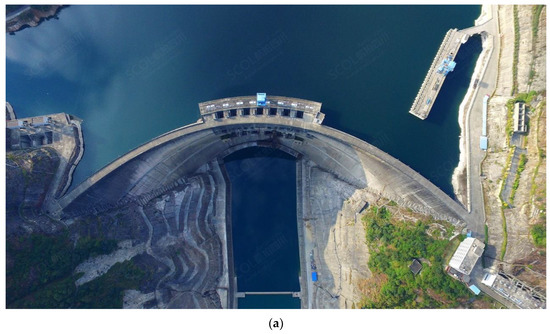
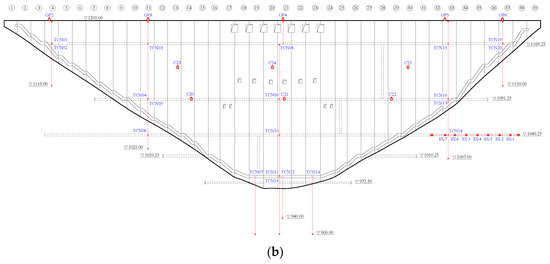
Figure 5.
The overview of the project. (a) The aerial view of the dam; (b) The vertical line monitoring system.
3.2. Prototypical Data Visualization and Analysis
In this study, three typical monitoring points, including TCN05, TCN08, and TCN15 are used for the study. Figure 6 shows the process lines of these three monitoring points. It can be seen from the figure that since the TCN08 measuring point is arranged at the arch crown beam, its deformation monitoring data value is significantly larger than that of the other two measuring points. This is due to the force characteristics of the arch dam itself.
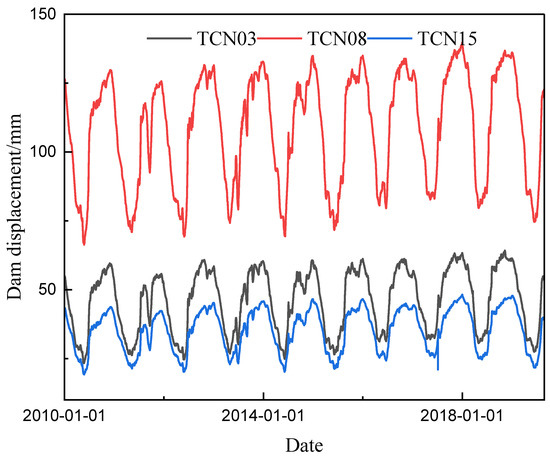
Figure 6.
The process line of three displacement monitoring points.
3.3. Evaluation Indicator
To comprehensively compare the predictive accuracy of the proposed method, three statistical indexes are introduced. These statistical indexes comprise the mean absolute error (MAE), mean square error (MSE), and the regression coefficients (R2). The equations of these indexes are written as
where denotes the sample size; and represents the measured dam deformation and calculated dam deformation, respectively.
4. Experimental Result Analysis
4.1. MLR Fitting Result
The dam deformation monitoring model and the linear regression method are the basis for constructing the residual correction mixed model. Figure 7 shows the MLR modeling result for three typical monitoring points, including TCN03, TCN08, and TCN15. It can be seen from the figure that the linear regression method can roughly fit the overall variation trend of the dam deformation, but it shows the limitation of insufficient fitting effect for the deformation changes in small details. In addition, it can also be seen that the residual term itself is highly volatile and contains more noise factors. Therefore, in the follow-up research, it is necessary to focus on the use of deep learning methods to mine residual feature information to build a deformation monitoring model with better accuracy.
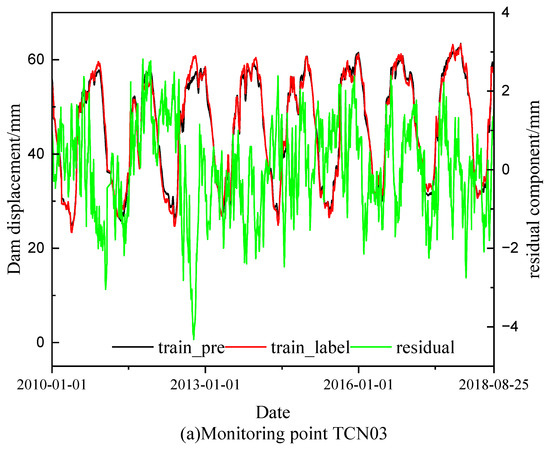
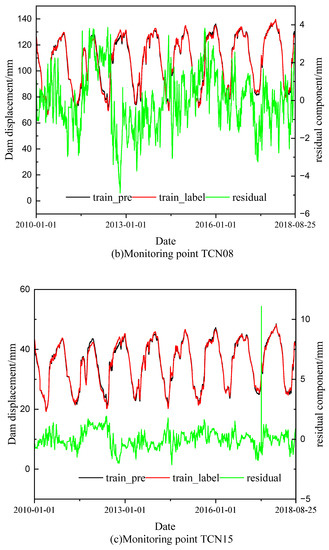
Figure 7.
Statistical regression and parametric hydrographs.
4.2. Residual Optimization and Reconstruction Result
The specific parameter range settings are shown in Table 1. The loss function of the model parameter optimization is to take the regression coefficient (R2). The basis for selecting the optimal hyperparameters is that the constructed model has the highest regression coefficient value on the validation set. Figure 8 shows the results of model parameter optimization by the GWO algorithm. It can be seen from this figure that after 100 iterations, the model reaches the optimal solution at 46, 92, and 27 iterations, respectively, and the corresponding regression correlation coefficient values are 0.94705, 0.96998, and 0.96933. The results of the optimized model parameters are shown in Table 2.

Table 1.
The value range of the optimization parameters.
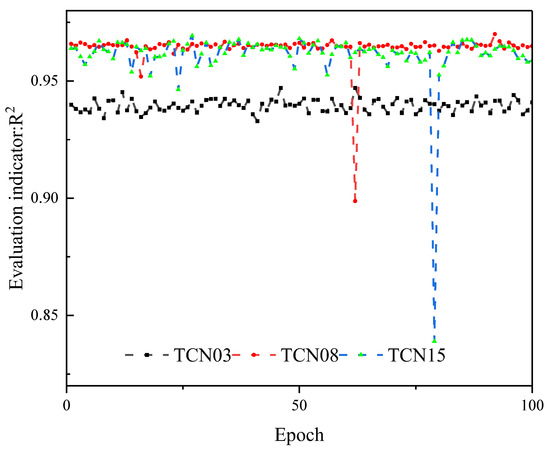
Figure 8.
The model parameter optimization process by GWO.
Table 2.
The model optimization results.
Figure 8 shows the model parameter optimization process. Figure 9 demonstrates the prediction results of the residual component of dam displacement for three monitoring points, including TCN03, TCN08, and TCN15 using the optimized LSTM network. It can be seen from the figure that the DL-based method can effectively fit the residual distribution law of the nonlinear phenomenon of the residual term. In addition, it can be seen from the figure that there are significant differences in the regularity of the residual distribution for different measuring points, which is mainly due to the different layout positions of the monitoring instruments, resulting in obvious differences in the physical quantities (deformation) monitored. It should be noted that for residual sequences with different types of distribution, DL-based techniques can effectively predict the distribution trends, which verifies the effectiveness of the DL techniques. In addition, it can be seen from the figure that for the TCN15 measurement points, there are some abnormal points in the residual data, and the proposed method will not be affected by them, which further illustrates the generalization performance of the model.
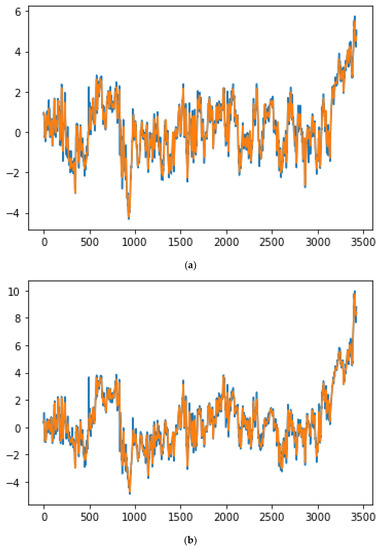
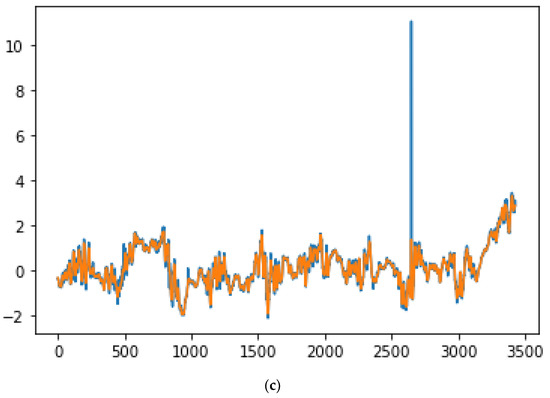
Figure 9.
The phase space reconstruction results of the residual terms. (a) Monitoring point TCN03; (b) Monitoring point TCN08; (c) Monitoring point TCN15. The blue line represents the instrument observations, and the orange line represents the model predictions.
4.3. Comparative Study
A series of state-of-the-art methods in the field of dam safety monitoring are used as comparative methods to evaluate the effectiveness of the developed method. Specifically, these benchmark methods comprise classic statistical regression methods—hydraulic-seasonal-time (HST) and various machine learning methods, including artificial neural network (ANN) [30], XGBoost [31], and support vector machine (SVM) [20]. These comparison methods also adopt the input factor models, i.e., the HST model. Their training and testing sets are divided in the same way as the proposed method to ensure fairness of validation.
Figure 10 demonstrates the schematic illustration of the prediction results of the proposed and the comparison methods for three monitoring points. It can be inferred from the figure that the proposed method achieves better prediction results than other comparison methods in different forms of deformation sequences, fully verifying the effectiveness of combining deep learning and statistical regression models. Table 3 demonstrates the comparative evaluation of forecast results of the proposed and comparison methods. It can be inferred from the table that the proposed method achieves better predictive performance in terms of all three indicators than the comparative methods.
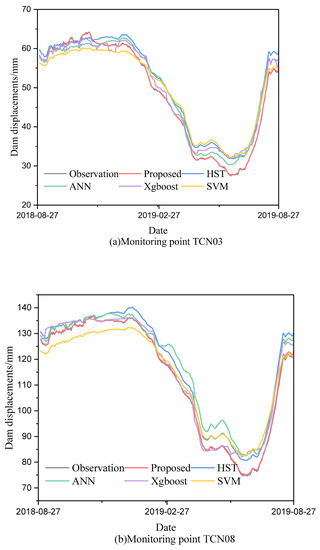
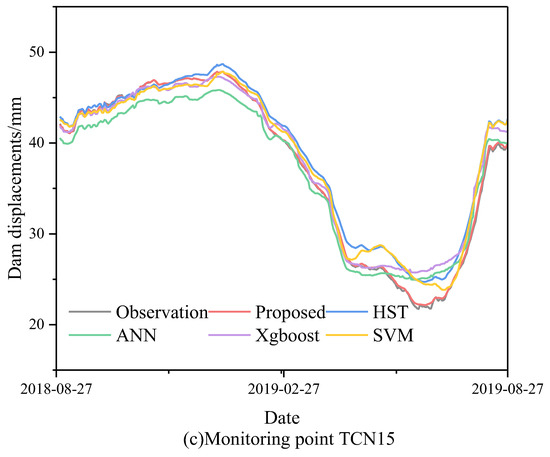
Figure 10.
Schematic illustration of the prediction results of the proposed and the comparison methods for three monitoring points.
Table 3.
Comparative evaluation of the forecast results of the proposed and comparison methods.
To further explore the effectiveness of the method, residual box plots are introduced to compare the predictive performance of different models. Figure 11 demonstrates the residual boxplot results of three monitoring points. It can be seen from the figure that the volatility of the proposed method in deformation prediction is significantly smaller than other comparison methods, and the distribution of residuals is more concentrated, indicating that the method has better deformation prediction performance.
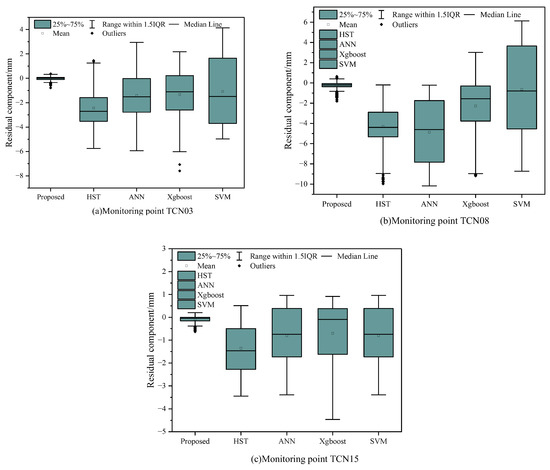
Figure 11.
Residual boxplot results of the three monitoring points.
5. Conclusions and Discussion
This study proposes a dam deformation hybrid prediction method by combining a statistical regression and deep learning methods. Specifically, the HST model combined with a multiple linear regression is used to construct an overall prediction method for dam deformation. Noise and high-frequency components in residual terms are smoothed by the PSR method. Next, the GWO algorithm is used to find and determine the optimal parameters of the LSTM network. A concrete arch dam that has been in operation for many years is used as a case study, and multiple measuring points in different sections of the dam are used to evaluate the validity of the model.
1. Based on the PSR theory, the selection of key parameters in the process of phase space reconstruction is explored, and the phase space of the deformation monitoring sequence of the single measuring point of the concrete dam is reconstructed. Based on the research on the information method of deformation influencing factors, a method for constructing the deformation deviation prediction model of a single measuring point is further proposed;
2. The characteristics of the LSTM neural network suitable for nonlinear time series problems are studied, and the optimization algorithms, such as gradient descent, model generalization ability, network layer number, and neuron node number optimization of the neural network are discussed. Furthermore, related optimization algorithms that are based on the phase space reconstruction theory serve to construct an LSTM network deformation deviation prediction model, and the validity of the model is verified through engineering examples.
However, some deficiencies and limitations require further elaboration. First of all, the object of this research is the concrete high arch dam, and similar research should be applied to various dam types, such as masonry, rockfill concrete, and earth-rock dam. Secondly, the horizontal deformation of the dam is only one of the important factors to control the safety and stability of the dam structure. In addition, the modeling of other effects, such as tangential deformation, leakage, crack opening, stress, and strain should also be considered [32,33,34]. In addition, probabilistic modeling should also be considered to assess dam safety and risk.
Author Contributions
Conceptualization, methodology, software, formal analysis, investigation, resources, writing, Y.Z.; data curation, M.X.; original draft preparation, K.Z.; funding acquisition, Z.L. All authors have read and agreed to the published version of the manuscript.
Funding
This work was supported by the National Key R&D Program of China (2022YFC3005401), China Postdoctoral Science Foundation (2022M720998), the Natural Science Foundation of Jiangsu Province (BK20220978), and Jiangsu Funding Program for Excellent Post-Doctoral Talent (2022ZB176).
Data Availability Statement
The data used to support the findings of this study are included within the article.
Conflicts of Interest
The authors declare no conflict of interest.
References
- Niu, X. The First Stage of the Middle-Line South-to-North Water-Transfer Project. Engineering 2022, 16, 21–28. [Google Scholar] [CrossRef]
- Su, H.; Li, X.; Yang, B.; Wen, Z. Wavelet Support Vector Machine-Based Prediction Model of Dam Deformation. Mech. Syst. Signal Process. 2018, 110, 412–427. [Google Scholar] [CrossRef]
- Su, H.; Wen, Z.; Zhang, S.; Tian, S. Method for Choosing the Optimal Resource in Back-Analysis for Multiple Material Parameters of a Dam and Its Foundation. J. Comput. Civ. Eng. 2016, 30, 04015060. [Google Scholar] [CrossRef]
- Gu, C.; Fu, X.; Shao, C.; Shi, Z.; Su, H. Application of Spatiotemporal Hybrid Model of Deformation in Safety Monitoring of High Arch Dams: A Case Study. Int. J. Environ. Res. Public Health 2020, 17, 319. [Google Scholar] [CrossRef]
- Yuan, D.; Gu, C.; Qin, X.; Shao, C.; He, J. Performance-Improved TSVR-Based DHM Model of Super High Arch Dams Using Measured Air Temperature. Eng. Struct. 2022, 250, 113400. [Google Scholar] [CrossRef]
- Chen, C.; Xiao, B.; Zhang, Y.; Zhu, Z. Automation in Construction Automatic Vision-Based Calculation of Excavator Earthmoving Productivity Using Zero-Shot Learning Activity Recognition. Autom. Constr. 2023, 146, 104702. [Google Scholar] [CrossRef]
- Zhu, Y.; Tang, H. Automatic Damage Detection and Diagnosis for Hydraulic Structures Using Drones and Artificial Intelligence Techniques. Remote Sens. 2023, 15, 615. [Google Scholar] [CrossRef]
- Zhu, Y.; Zhang, Z.; Gu, C.; Li, Y.; Zhang, K.; Xie, M. A Coupled Model for Dam Foundation Seepage Behavior Monitoring and Forecasting Based on Variational Mode Decomposition and Improved Temporal Convolutional Network. Struct. Control Health Monit. 2023, 2023, 3879096. [Google Scholar] [CrossRef]
- Shi, S.; Du, D.; Mercan, O.; Kalkan, E.; Wang, S. A Novel Unsupervised Real-Time Damage Detection Method for Structural Health Monitoring Using Machine Learning. Struct. Control Health Monit. 2022, 29, e3042. [Google Scholar] [CrossRef]
- Sony, S.; Laventure, S.; Sadhu, A. A Literature Review of Next-Generation Smart Sensing Technology in Structural Health Monitoring. Struct. Control Health Monit. 2019, 26, e2321. [Google Scholar] [CrossRef]
- Mata, J.; Tavares de Castro, A.; Sá da Costa, J. Constructing Statistical Models for Arch Dam Deformation. Struct. Control Health Monit. 2014, 21, 423–437. [Google Scholar] [CrossRef]
- Zheng, S.; Shao, C.; Gu, C.; Xu, Y. An Automatic Data Process Line Identification Method for Dam Safety Monitoring Data Outlier Detection. Struct. Control Health Monit. 2022, 29, e2948. [Google Scholar] [CrossRef]
- Li, Y.; Zhang, H.; Wen, L.; Shi, N. A Prediction Model for Deformation Behavior of Concrete Face Rockfill Dams Based on the Threshold Regression Method. Arab. J. Sci. Eng. 2021, 46, 5801–5816. [Google Scholar] [CrossRef]
- Bui, K.T.T.; Torres, J.F.; Gutiérrez-Avilés, D.; Nhu, V.H.; Bui, D.T.; Martínez-Álvarez, F. Deformation Forecasting of a Hydropower Dam by Hybridizing a Long Short-Term Memory Deep Learning Network with the Coronavirus Optimization Algorithm. Comput. Civ. Infrastruct. Eng. 2022, 37, 1368–1386. [Google Scholar] [CrossRef]
- Tatin, M.; Briffaut, M.; Dufour, F.; Simon, A.; Fabre, J.P. Statistical Modelling of Thermal Displacements for Concrete Dams: Influence of Water Temperature Profile and Dam Thickness Profile. Eng. Struct. 2018, 165, 63–75. [Google Scholar] [CrossRef]
- Dai, B.; Gu, C.; Zhao, E.; Qin, X. Statistical Model Optimized Random Forest Regression Model for Concrete Dam Deformation Monitoring. Struct. Control Health Monit. 2018, 25, e2170. [Google Scholar] [CrossRef]
- Shao, C.; Gu, C.; Yang, M.; Xu, Y.; Su, H. A Novel Model of Dam Displacement Based on Panel Data. Struct. Control Health Monit. 2018, 25, e2037. [Google Scholar] [CrossRef]
- Wei, B.; Yuan, D.; Li, H.; Xu, Z. Combination Forecast Model for Concrete Dam Displacement Considering Residual Correction. Struct. Health Monit. 2019, 18, 232–244. [Google Scholar] [CrossRef]
- Wei, B.; Liu, B.; Yuan, D.; Mao, Y.; Yao, S. Spatiotemporal Hybrid Model for Concrete Arch Dam Deformation Monitoring Considering Chaotic Effect of Residual Series. Eng. Struct. 2021, 228, 111488. [Google Scholar] [CrossRef]
- Li, M.; Shen, Y.; Ren, Q.; Li, H. A New Distributed Time Series Evolution Prediction Model for Dam Deformation Based on Constituent Elements. Adv. Eng. Inform. 2019, 39, 41–52. [Google Scholar] [CrossRef]
- Ren, Q.; Li, M.; Song, L.; Liu, H. An Optimized Combination Prediction Model for Concrete Dam Deformation Considering Quantitative Evaluation and Hysteresis Correction. Adv. Eng. Inform. 2020, 46, 101154. [Google Scholar] [CrossRef]
- Ren, Q.; Li, M.; Kong, T.; Ma, J. Multi-Sensor Real-Time Monitoring of Dam Behavior Using Self-Adaptive Online Sequential Learning. Autom. Constr. 2022, 140, 104365. [Google Scholar] [CrossRef]
- Xu, Y.; Zheng, D.; Shao, C.; Zheng, S.; Gu, H. Structural Modal Parameter Identification Method Based on the Delayed Transfer Rate Function under Periodic Excitations. Mathematics 2023, 11, 1019. [Google Scholar] [CrossRef]
- Pan, Y.; Zhang, L. Roles of Artificial Intelligence in Construction Engineering and Management: A Critical Review and Future Trends. Autom. Constr. 2021, 122, 103517. [Google Scholar] [CrossRef]
- Chen, B.; Huang, Z.-s.; Bao, T.-f.; Zhu, Z. Deformation Early-Warning Index for Heightened Gravity Dam during Impoundment Period. Water Sci. Eng. 2021, 14, 54–64. [Google Scholar] [CrossRef]
- Ren, Q.; Li, M.; Li, H.; Shen, Y. A Novel Deep Learning Prediction Model for Concrete Dam Displacements Using Interpretable Mixed Attention Mechanism. Adv. Eng. Inform. 2021, 50, 101407. [Google Scholar] [CrossRef]
- Şenel, F.A.; Gökçe, F.; Yüksel, A.S.; Yiğit, T. A Novel Hybrid PSO–GWO Algorithm for Optimization Problems. Eng. Comput. 2019, 35, 1359–1373. [Google Scholar] [CrossRef]
- Kaveh, A.; Zakian, P. Improved GWO Algorithm for Optimal Design of Truss Structures. Eng. Comput. 2018, 34, 685–707. [Google Scholar] [CrossRef]
- Al Thobiani, F.; Khatir, S.; Benaissa, B.; Ghandourah, E.; Mirjalili, S.; Abdel Wahab, M. A Hybrid PSO and Grey Wolf Optimization Algorithm for Static and Dynamic Crack Identification. Theor. Appl. Fract. Mech. 2022, 118, 103213. [Google Scholar] [CrossRef]
- Agatonovic-Kustrin, S.; Beresford, R. Basic Concepts of Artificial Neural Network (ANN) Modeling and Its Application in Pharmaceutical Research. J. Pharm. Biomed. Anal. 2000, 22, 717–727. [Google Scholar] [CrossRef]
- Osman, A.I.A.; Ahmed, A.N.; Chow, M.F.; Huang, Y.F.; El-Shafie, A. Extreme gradient boosting (Xgboost) model to predict the groundwater levels in Selangor Malaysia. Ain Shams Eng. J. 2021, 12, 1545–1556. [Google Scholar] [CrossRef]
- Zang, W.; Zheng, Y.; Zhang, Y.; Lin, X.; Li, Y.; Fernandez-Rodriguez, E. Numerical Investigation on a Diffuser-Augmented Horizontal Axis Tidal Stream Turbine with the Entropy Production Theory. Mathematics 2023, 11, 116. [Google Scholar] [CrossRef]
- Zhang, Z.; Zhang, Y.; Zheng, Y.; Fernandez-Rodriguez, E.; Zang, W.; Ji, R. Power fluctuation and wake characteristics of tidal stream turbine subjected to wave and current interaction. Energy 2023, 264, 126185. [Google Scholar] [CrossRef]
- Zhang, Y.; Zang, W.; Zheng, J.; Cappietti, L.; Zhang, J.; Zheng, Y.; Fernandez-Rodriguez, E. The influence of waves propagating with the current on the wake of a tidal stream turbine. Appl. Energy 2021, 290, 116729. [Google Scholar] [CrossRef]


Disclaimer/Publisher’s Note: The statements, opinions and data contained in all publications are solely those of the individual author(s) and contributor(s) and not of MDPI and/or the editor(s). MDPI and/or the editor(s) disclaim responsibility for any injury to people or property resulting from any ideas, methods, instructions or products referred to in the content. |
© 2023 by the authors. Licensee MDPI, Basel, Switzerland. This article is an open access article distributed under the terms and conditions of the Creative Commons Attribution (CC BY) license (https://creativecommons.org/licenses/by/4.0/).