Abstract
Because of the fast expansion of electric vehicles (EVs) in Saudi Arabia, a massive amount of energy will be needed to serve these vehicles. In addition, the transportation sector radiates a considerable amount of toxic gases in the form of SO2 and CO2. The national grid must supply a huge amount of electricity on a regular basis to meet the increasing power demands of EVs. This study thoroughly investigates the technical and economic benefits of an off-grid and grid-connected hybrid energy system with various configurations of a solar, wind turbine and battery energy storage system for the electric vehicle charging load in the Qassim region, Saudi Arabia. The goal is to decrease the cost of energy while reducing the chance of power outages in the system. This is achieved by using a new optimization algorithm called the modified salp swarm optimization algorithm (MSSOA), which is based on an evolutionary algorithm approach. MSSOA is an improved version of SSOA, which addresses its shortcomings. It has two search strategies to enhance its efficiency: first, it uses Levy flight distribution (LFD) to help individuals reach new positions faster, and second, it instructs individuals to spiral around the optimal solution, improving the exploitation phase. The MSSOA’s effectiveness is confirmed by comparing its results with those of the conventional salp swarm optimization algorithm and particle swarm optimization (PSO). According to simulation findings, MSSOA has excellent accuracy and robustness. In this region, the SPV/WT/BESS-based EV charging station is the optimal option for EV charging stations. The SPV/WT/BESS design has the lowest LCOE of all feasible configurations in the region under study. The optimum values for the LCOE and TNPC using MSSOA are USD 0.3697/kWh and USD 99,928.34, which are much lower than the optimized values for the LCOE (USD 0.4156) and TNPC (USD 1,12,671.75) using SSOA. Furthermore, a comprehensive techno–economic analysis of optimized hybrid systems is assessed by incorporating the grid-connected option. The grid connected system results in optimized values of the LCOE (USD 0.0732/kWh) and TNPC (USD 1,541,076). The impact of different grid purchase prices on the levelized cost of energy is also studied. Our results will assist the researchers to determine the best technique for the optimization of an optimal energy system.
Keywords:
artificial intelligence; optimization algorithm; renewable energy; electric vehicles; solar photovoltaic; wind turbine; energy storage system; evolutionary algorithm MSC:
68T20
1. Introduction
Saudi Arabia is among the fastest growing nations in the Middle East region. Its provincial capital, Riyadh, consumes a substantial amount of the country’s oil and natural gas [1]. Since the end of the twentieth century, rising carbon dioxide (CO2) emissions and volatile oil prices have prompted the government to focus on finding more environmentally-friendly, renewable energy sources (RES) and technological advances to counter the increased financial requirement of the country. The electricity demand of Saudi Arabia in 2021 was expected to be approximately 302 TWh, 13 TWh up from the preceding year. Numbers increased by approximately 194TWh between 1998 and 2021, peaking at more than 331 TWh in 2019 [2].
This section introduces diverse methods and analyses conducted all over the world to implement RES for charging EVs using various kinds of evolutionary algorithms (EA). Hierarchy-wise, EAs come under machine learning techniques, while both these techniques come under the umbrella of artificial intelligence (AI). Optimization is a fundamental aspect of all AI processes. This includes the optimization and refinement of training data with labels, as well as the iterative training and enhancement of models. The training of an AI model is an optimization problem, as the model is taught to execute a task in the most efficient manner. The refining and adjusting of model configurations are the most crucial aspect of AI optimization algorithms. Several countries have investigated installing RE systems to serve the charging demand of EVs. A synopsis of related research work considering the employment of EA is provided below.
Authors in [3] developed a strategy to regulate the flow of electrical power between RES and EVs in Egypt. The analysis presented positive outcomes in terms of electrical parameters. In [4], the assessment of the EV charging load is examined by performing a cost–benefit analysis and controlling the power flow of a multi-source power system. The charging system’s effectiveness is enhanced, and a better output is achieved, resulting in significant capital savings. A group of researchers from China [5] studied the use of a smart hybrid pole network powered by renewable energy sources to supply power to electric vehicles and streetlights. In [6], other researchers analyzed the optimal sizing of system components to meet the power needs of electric vehicles in remote regions such as Labuan Bajo, Indonesia. The study identified the best combination of energy system components for charging sites and developed an economic model that incorporates various cost-based objectives, such as operating costs and total net present cost (TNPC). Furthermore, researchers in [7] investigated priority charging for monitoring EV charging systems in park-and-ride areas using renewable energy sources and energy storage systems. The mixed-integer linear programming approach has been implemented to optimize the formulated problem, and the analysis indicated a huge decrease in the cost of the component. Furthermore, decision makers play critical roles in raising RES capacity for the charging of EVs. An energy management strategy is described for serving the EVs in companies in Turkey at the lowest possible cost using Monte Carlo simulations [8]. A smart charging approach for EVs is given to offset the detrimental effect of RES production variations. Firstly, a new uncertainty model based on set pair analysis is provided for the estimation of RES outputs, offering an alternative modelling approach for RES. Second, EVs are represented as demand responsive loads using stochastic dynamic pricing [9]. The outcomes of the presented research revealed that the energy demand of EVs can be fulfilled over a variety of time frames. An optimization framework for EV charging is provided that could meet charging requirements while also minimizing electricity prices [10]. The authors in [11] created a microgrid consisting of SPV, WT, BESS and DG to meet the electricity requirement of a village in the Uttarakhand state of India. The proposed study effectiveness is conducted by performing the viability analysis in terms of cost of energy using the differential algorithm (DE) which is part of the evolutionary algorithm. Authors in [12] proposed the ALISE concept, which aimed to increase EV adoption while lowering construction costs. A formal review was carried out with some strategies for handling the EV charging requirement [13]. The effectiveness of the discussed strategies is demonstrated by lowering system costs and improving power quality. The effect of integrating RES with EV charging systems was previously investigated using the Balmorel model [14]. Based on the findings of that study, load requirement could be fulfilled, CO2 emissions become reduced and system costs improved. In [15], authors looked into a varied perspective, concentrating on the use of tariff rates to coordinate EV aggregators. In [16], the author provides an ideal size and placement method for battery storage and solar generating with the intent of enhancing the power system’s reliability. The work in [17] focused on an energy management system for coordinating demand response and EV aggregators. The developed energy management strategy for charging EVs incorporates driving circumstances as well [18]. The authors of [19] mainly concentrated on a power system rescheduling methodology that took EVs and RES into account. On the other hand, in [20], the energy storage is considered alongside RES and EVs, with an emphasis on home energy management instead of the business world. A technical and financial evaluation for Pakistan is presented in [21]. The research work is focusing on the modeling of an energy system for rural areas using the HOMER tool incorporating RES without using the EVs. In [22], authors made a strategy for the allocation of EV charging stations integrated with capacitors in a 34-bus network. The optimal sizing of a parking lot is carried out using biogeography-based optimization (BBO). In [23], authors tried to present a cost-effective and technical alternative for rural electrification in an Indian village. The study also carried out a comparison analysis to demonstrate the impact of demand response on the LCOE, NPC and system size. According to the findings of these research studies, the grid-connected hybrid system generated the most financially feasible energy. On the other hand, a comprehensive review of the previous research indicated that implementing a wind turbine (WT) or a biomass/biogas digester/generator substantially increased the initial investment cost, which could constrain the effective execution of such projects from the standpoint of investors. However, it lessens the LCOE, making it more cost-effective for customers. The use of an evolutionary algorithm, i.e., social network optimization (SNO) is performed for antenna optimization [24].
In Turkey, the use of the HOMER software is done to evaluate 24 potential solutions for meeting energy needs through the design of off-grid solar photovoltaic (SPV) and fuel cell-powered energy systems, which are used to determine the technical as well as economic characteristics of the proposed system. In addition, hydrogen and battery units are used for energy storage to tailor multiple storage possibilities. Observations indicate that the cost of energy for a purely renewable-based system is higher than that for a grid-connected system and that battery storage is more viable than hydrogen storage [25]. The author suggested a sparrow search algorithm-based EVCS with an embedded wind power and energy storage capacity configuration model and corresponding operation strategy, which can more effectively determine the optimum capacity allocation, decrease the peak demand of EVCS, avert definite variations and acquire specific advantages [26]. In [27], using HOMER, the authors analyzed the possibility of the use of an SPV and diesel generator (DG)-based energy system in Malaysia and determined that the system might be employed to substitute or improve diesel generating units in faraway areas. The combination of SPV and WT-based energy systems has been suggested and deemed suitable to replace the existing diesel generating unit on a remote Hong Kong Island. This is a practical and cost-effective solution [28]. A new energy management strategy based on the BBO algorithm is discussed for the EVCS which integrates the Z source converter with medium voltage direct current grids. The evolutionary algorithm-based BBO is employed to optimize the hydrogen production as an objective function [29]. In another investigation, SPV, WT, DG and battery systems proved to be less expensive than exclusively green electricity systems with battery units [30]. A comprehensive study on the optimal placement of electric vehicle charging stations in the distribution network and transportation network is performed. Various meta-heuristics algorithms have been covered along with the objective functions, technical constraints, geographic conditions and demand response programs [31]. In [32], the authors examined the financial sustainability of an integrated energy system for a secluded town in Uttarakhand, India. The proposed system includes SPV, DG, biogas generators, a WT and the BESS in order to satisfy the area’s demand for electricity. The DE is employed to optimize the sizing of the energy system component and perform the cost analysis. The evaluation of hybrid solar photovoltaic (SPV) and diesel generator (DG) units’ battery and flywheel energy storage utilization regarding naturally occurring fuels and carbon dioxide emissions is conducted using the HOMER software [33]. The economic advantages of using flywheels as an alternative system to generate power and reduce energy expenses are also considered to determine the net present cost (NPC) as production and demand increase. The software HOMER is also used to calculate the charging power requirement for fast charging stations and construct numerous ones using renewable energy sources (RES) in existing distribution systems [34]. Energy generation in several locations in Nigeria is examined using various components such as SPV, wind turbines (WT) and DG, and the HOMER software is employed to assess the system’s sensitivity and performance. The study shows that the hybrid configuration of SPV, DG and a battery energy storage system (BESS) yields the best results [35]. In [36], an SPV and a DG with a battery as energy storage is turned on in northern Algeria, and the system’s performance is evaluated using a load-following strategy. Finally, to meet the electricity needs of an educational and research facility in Bhopal, India, a system based on an SPV, fuel cell and the BESS is investigated for its technological and financial feasibility [37].
Top of Form
Utilizing the SNO algorithm, an efficient planning method for a beam-scanning passive reflect array is evaluated [38]. The integration of SPV-based distributed generation and electric vehicle charging stations with the distribution network is investigated considering power loss and voltage profile issues [39]. The authors assessed the technological feasibility of installing an EV charging station in Qatar, which involves an SPV, WT, biogas generator and BESS. The HOMER tool is employed to find out the optimal configuration of the energy system component to fulfill the load demand of 50 EVs. The dynamic arrival and departure of EVs, technical restrictions and the various meteorological constraints of the proposed site are all considered [40]. The use of the modified meta-heuristic technique is done to serve the charging demand of EVs in three main cities of India, namely Madurai, Ahmedabad and New Delhi [41]. An economically viable option for generating electricity in areas where grid access is not feasible is proposed in the form of an energy system based on solar photovoltaic (SPV), a diesel generator (DG) and biomass [42]. The technical and financial feasibility of electric vehicle (EV) charging loads based on SPV and wind energy in five different climatic regions in the southern region of Tamil Nadu is also presented [43]. The suggested locations are selected to ensure that solar and wind energy intensities are complementary. Furthermore, a techno–economic and environmental assessment of an EV charging station installed in Rohini Sector-17, New Delhi, is carried out under different possible scenarios by minimizing energy cost and net present cost while adhering to technical constraints [44].The feasibility analysis of the SPV/WT/DG system with the BESS is investigated to satisfy the load requirement of 127 houses considered in 6 locations in Saudi Arabia, using the combined dispatch strategy [45].
Various evolutionary algorithms including DE, BBO, SNO, etc. to address the issue of a sizing problem have been discussed in the available research. As a result of their exceptional capacity to manage complex optimization problems, researchers are progressively examining such methods. Nevertheless, the efficacy of every approach may vary in respect to the precision and speed of convergence when implemented to the sizing optimization. Only a few current approaches have been compared to the novel ones offered in each research paper based on a review of the relevant literature. The superiority of a sizing technique over two or three other methods does not indicate that it is the most accurate method presented in the scientific literature. With a wide range of sizing strategies available, experts focusing on the sizing issue desire a durable, highly precise and fast-executing method. This is to achieve and develop economical and reliable electrical systems. The limitations associated with the abovementioned algorithms are that they are intricate in architecture, involve extensive control factors and become trapped in local optima. In addition, their inadequate exploitation and exploration capabilities prevent them from searching for the optimal solution over a broad search range. The proposed modified salp swarm algorithm (MSSOA) is designed to overcome the limitations of existing algorithms. The MSSOA utilizes two different searching strategies to improve its search capabilities. The first strategy involves employing Levy flight distribution (LFD), which enables individuals to quickly reach their new positions. Afterward, individuals are directed to spiral around the optimal solution to enhance the exploitation phase. The MSSOA is user-friendly, requires fewer steps, involves reduced parameter control and can provide satisfactory results.
The central emphasis of researchers is to formulate an appropriate energy management strategy for serving the EV charging load by utilizing RES. Nevertheless, an economic evaluation that discusses the power transfer to and from the distribution grid is one important issue that needs to be acknowledged. The large-scale deployment of EVs creates challenges and prospects for the hybrid energy system. This article describes a renewable energy-based system for the optimal designing of charging stations in the Qassim region, Saudi Arabia. The MSSOA has never been used to meet the EV load requirement using SPV, WT and the BESS. No previous study, to our knowledge, compares the execution of a single energy system in different types of sizing methods. As a result, the evaluation discussed here is an utmost needful resource for researchers who need to choose a method for their sizing problem.
This study’s unique contribution is that it explores the techno–economic feasibility of utilizing renewable energy sources (RES) to design EV charging loads in the Qassim region of Saudi Arabia, which has not been previously investigated. Additionally, the study utilizes the modified salp swarm algorithm to optimize the objective function in terms of total net present cost and levelized cost of energy while maintaining an acceptable level of power supply failure probability. The MSSOA algorithm is known for its effective exploration and exploitation abilities and quick convergence to the optimal solution, making the system innovative. After examining and assessing all comparable findings and their shortcomings, the key contribution of the conducted analysis is to include supplementary systems, such as the BESS and grid, with RES, such as an SPV and WT, for EV charging. The TNPC of the system is significantly reduced, while the LPSP is considered as a reliability constraint. Furthermore, the LCOE is taken under consideration to assess the reliability of a hybrid energy system. The proposed methodology is established based on data collected over a year of real-time solar irradiation and ambient temperature. The following are the main contributions of this article:
- The technical and economic aspects of hybrid systems installed in a commercial setting are investigated;
- To evaluate the techno–economic viability of an off-grid and grid-connected hybrid energy system;
- To determine the best design of an EV charging load considering the real data set and incorporating the physical, operational and economic characteristics of RES such as an SPV and WT;
- Two novel evolutionary algorithm-based methods, SSOA and MSSOA, are presented and applied for the sizing of the system component;
- The influence of energy exchange from and to the grid network on the LCOE is examined.
The remainder of this article is as follows: In Section 2, the renewable energy sources, demand profile and modelling of various system components are discussed. Section 3 provides a clarification of objective functions, operational limitations and energy management tactics. Section 4 discusses an in-depth review of the intended novel AI-based algorithm and its application for the design of the most effective charging strategy. Section 5 provides the significant observations and discussions. The policies and investment decisions made by Saudi Arabia government is given in Section 6. The concluding remarks are presented in Section 7.
2. Methodology
Saudi Arabia is making significant investments in environmentally-friendly vehicles [46]. Hybrid power frameworks can meet power needs for any kind of load at a minimal price. Hence, this research work is focused on developing a profitable, durable, feasible and eco-friendly energy system based on RES for serving the EV load demand in an automotive sector. Solar insolation, wind speed and EV load requirements are the system’s critical input data in this study, based on which an optimum solution output can be achieved. The proposed system is depicted schematically in Figure 1.
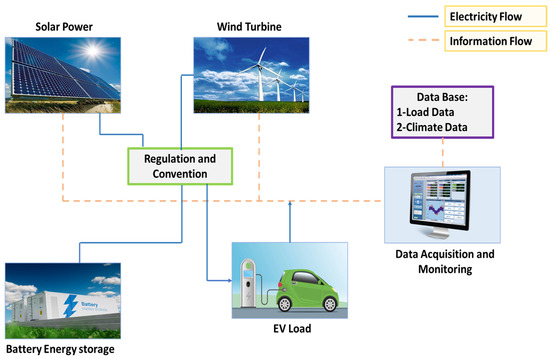
Figure 1.
Architecture of proposed hybrid energy system.
2.1. Description of Renewable Energy Sources
The location of interest in this research study is the Qassim region, Saudi Arabia as shown in Figure 2. This place has been chosen because it is a regional center with a variety of attractions such as shopping centers, sports fields, transit systems and resorts. The Qassim region is situated at 26.2078° N, 43.4837° E. The existing population of the Qassim region is believed to be more than 1.2 million people [46].

Figure 2.
Location of selected site on map. Red dot indicates the studied area and green arrow is pointing towards the studied area.
Furthermore, SPV is an excellent RES for this case study due to the pleasant climate of Saudi Arabia. As shown in Figure 3, the highest daily solar radiation (7.93 kWh/m2/day) occurred in June, while the lowest daily radiation (3.3 kWh/m2/day) occurred in December. This study also considered wind speed data. The maximum wind speed was registered in March (6.14 m/s), while the least wind speed was registered in September (5.28 m/s), as shown in Figure 4. Real time solar radiation and wind speed data of the Qassim region are used to calculate the output of an SPV and WT.
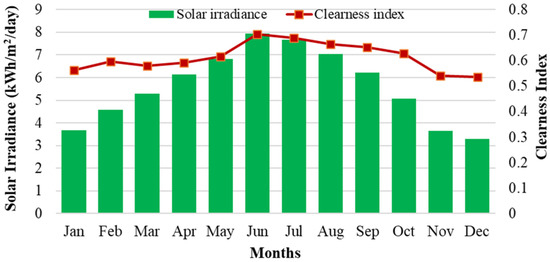
Figure 3.
Solar irradiance and clearness index of the selected location on monthly basis.
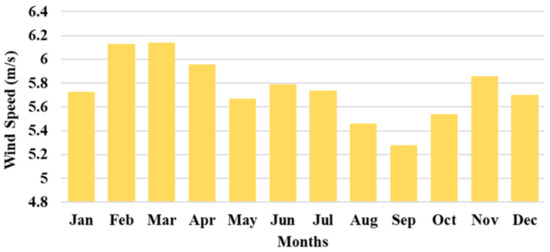
Figure 4.
Wind speed of the studied area on monthly basis.
2.2. EV Load Profile for Qassim Region, Saudi Arabia
The daily load profile of EV load in the Qassim region is depicted in Figure 5. The project is in a commercial center, and EV charging is considered as a load. The daily maximum power consumption for EV charging was 3155 kWh, with a peak of 451.57 kW. Table 1 presents the technical details of an EV charging load, which indicate that the majority of EV owners prefer to charge their vehicles during the daytime, particularly between 6:00 a.m. and 9:00 p.m., with the peak charging occurring between 3:00 p.m. and 5:00 p.m. Only a small number of EVs are charged during the nighttime.
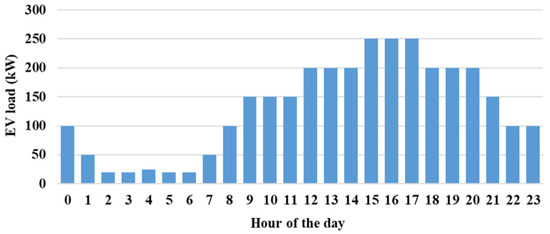
Figure 5.
Daily EV load profile in Qassim region, Saudi Arabia.

Table 1.
Technical information of EV load.
2.3. Modeling of Hybrid Energy System
This section describes the modeling of the different components of the energy system that will supply the charging requirements of EVs. The hybrid system of energy under consideration includes an SPV panel, WT, BESS and inverter. The battery is used to regulate the variability of renewable generation to improve the load reliability of the power supply.
2.3.1. SPV Array
Solar radiation is both the most common and the most powerful RE source on earth. It is relatively easy to implement and is economical in the distant regions of many countries. The SPV modules’ throughput sequence is frequently employed to determine the accuracy of an SPV system in relation to its maximum output. The panels of SPV are also beneficial to produce energy via capturing sunlight. A lesser percentage of the solar radiation which passes through the SPV panels is converted to electrical energy, while the remaining is transformed into heat. The quality of the SPV power output can be impacted due to a greater number of variables. The output power of an SPV is determined by the size of the panel, the daily solar incident on the panel surface, cell temperature and the geographical coordinates, using Equation (1):
where , represent the efficiency and surface area of SPV modules, respectively. Further, indicates the solar insolation received by the SPV panel, and signifies the cell temperature.
The cell temperature can be mathematically expressed as follows:
where is the ambient temperature.
The maximum output of an SPV panel can be mathematically represented as follows:
where , denote maximum voltage and maximum current output of a solar panel.
2.3.2. Wind Power Output
Wind energy is one of the most abundant and promising components of a hybrid renewable energy system when properly modelled and managed. The amount of electricity generated by a WT is determined by the region over which the wind traverses and the wind’s velocity. The power output of a WT can be computed as follows:
where V(τ) represents the wind speed at the desired height, and are the cut-in and cut-off speed, respectively, denotes the rated wind power and is the rated wind speed.
The speed of wind at different hours of a year can be defined by a curve known as probability density function, i.e., PDF. If a curve is plotted using varying wind speeds, the area under the curve between any two wind speeds provides the probability of the wind being between those two speeds.
where and are two arbitrary wind speeds and is the PDF of wind speed.
The Weibull probability function is the most relevant PDF in wind speed analysis. The Weibull probability function is the starting point for defining wind speed statistics, and its formulation is as follows:
where k denotes the shape parameter, c is the scale parameter and v is the wind speed.
Wind speed varies over the earth’s surface; for example, there are differing wind speeds over a calm sea and a forest. The difference is determined by the height at which wind speed is measured. The wind speed at a given height is computed as follows:
where is the speed of wind at height , is the speed of wind at height and denotes the friction coefficient.
The wind’s friction coefficient is determined by the terrain it passes across. The value of β is approximated to be 1/7 for a low roughness surface and well exposed site.
2.3.3. Battery Energy Storage System
The proper sizing of the BESS plays a crucial role in order to meet the load demand. To check on the charging/discharging battery state, one of the most important variables is the state of charge (SOC). As the hybrid model produces excess power, an overcharging of the battery is seen. The control system automatically stops the charging mechanism when the battery attains the maximum SOC, and here the control system goes down to the minimum value, i.e., SOC (min) for any further drain of battery, and then the system disables the load [47].
The SOC depends on the output power and EV load requirement. The battery plays a crucial role in energy management by power demand adjustment from the supply. When the power produced by a different component of the system exceeds the load demand, the extra power is fed to the BESS, and it starts charging. The charging behavior of the BESS at an instant τ can be mathematically modeled as in [47].
When RES cannot meet the power demand, the BESS is installed to supply the EV and begin discharging. The BESS can be discharged at an instant τ using Equation (10).
where stands for the SOC of the BESS at instant (), whereas indicates the SOC of the BESS at instant ; is the self-discharge rate of the battery, is bi-directional inverter efficiency, denotes the output of SPV modules, the output of a WT can be represented as and is the batteries’ efficiency which can be expressed using Equation (11):
where represents the charging efficiency of the battery whereas denotes the efficiency of the discharging of battery. An amount of 92.2 % is the round-trip efficiency of the BESS.
In the modelling of the battery, the charge/discharge is an important criterion which can be determined by the maximum charging current and elaborated by the given equation:
where denotes the maximum value of the current required by the BESS, denotes the voltage value of one battery unit and is the rated power of the BESS.
2.3.4. Bi-Directional Inverter Modeling
The transformation of dc power into ac power and vice versa can be performed by employing a bi-directional converter. SPV modules deliver dc power to EVs which are located at a parking lot. The bi-directional inverter output can be mathematically expressed as follows:
In this paper, the bi-directional inverter works at the efficiency of 95 %. The technical and economic data of different components of the system are mentioned in Table 2.
Table 2.
Technical and Economic Data for system component.
3. Technical and Economic Objectives
The main objective of this research work is to optimize the total net present cost (TNPC) and levelized cost of energy (LCOE), guaranteeing that the probability of power outage is kept within the allowable limits. For energy management, the load-following strategy is used. Using the suggested optimization technique, the optimum combination of SPV, WT and BESS units is determined. The objective function and technical constraints are coded in a MATLAB platform.
3.1. Total Net Present Cost (TNPC)
The TNPC depicts the overall cost of system components. It comprises expenses and revenues acquired during the life of the system. The costs associated with the system, including capital, replacement, operation and maintenance costs of each component, are included. The mathematical formula for the total net present cost (TNPC) is provided as follows:
where the total annual cost of the system can be represented by , accounts for the discount rate and project life is represented by .
where denotes interest rate and is the yearly inflation rate. In this article, is 10% and is 2%. The salvage value of the system component can be determined using Equation (17).
where is the salvage value, indicates the cost of replacement, stands for the remaining life after the project is completed and represents the lifespan of different system components.
3.2. Levelized Cost of Energy (LCOE)
The LCOE is considered to assess the economy of an integrated energy system. It may be defined as the ratio of total yearly cost to the total useful electricity generation which satisfies the load demand [48].
where denotes the total electricity generation.
The total annualized cost is the sum of the annualized capital cost (), annualized replacement cost () and annualized operation and maintenance cost () of each component of the energy system and can be given by Equation (19).
3.3. Technical Restrictions
To optimize the hybrid model, a compromise must be established between goal functions and constraints. This optimization technique is used to determine the optimal number of decision variables.
- The minimum and maximum number of decision variables are provided as follows:
- Equation (23) should be used to maintain the battery’s charging state. The amount of energy stored in the battery at any given time is limited by the maximum and minimum limits, which are as follows:
- The LPSP should be less than or equal to its maximum value for a reliable and robust system.
3.4. Energy Management System
The stochastic behavior of RES necessitates a self-adaptive energy management approach for the energy system, particularly when a reliable source of electricity is required to meet the time distribution of a connected load. Because the amount of electrical power production from RES is limited, it is difficult to immediately fulfil the ever-increasing load requirement. Furthermore, when the amount of electricity generated exceeds the demand, it is essential to dump the surplus electricity, thus protecting the batteries from overcharging. Therefore, establishing an appropriate charging framework is one of the primary criteria for designing the hybrid systems. In order to apply power management strategies, the simulation will consider the following cases:
Case 1: Renewable sources of electricity deliver adequate renewable power, and any surplus amount of power is provided to the BESS;
Case 2: The renewable sources produce enough power which satisfies the load requirement as well as completely charging the BESS. The extra power is supplied to a dump load;
Case 3: When the electrical energy supplied by RES is insufficient to fulfil the load requirement, the deficiency of electrical power is satisfied by the BESS;
Case 4: The sustainable energy produced is inadequate to supply the required load, the BESS is also exhausted and the system must be resized.
Figure 6 displays the energy management strategy for the proposed design of an EV charging load, which is based on SPV/WT/BESS.
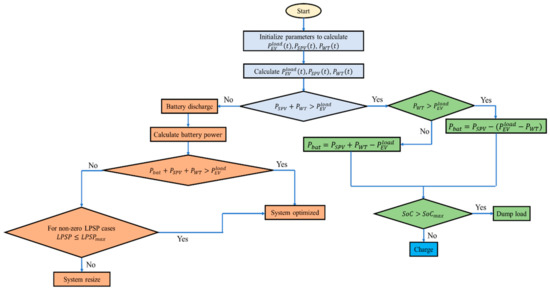
Figure 6.
Strategy for energy management in the SPV/WT/BESS-based system.
4. Application of MSSOA for the Sizing of System Component
This section presents a detailed explanation of the salp swarm optimization algorithm (SSOA) and its modified version (MSSOA). The SSOA is a robust meta-heuristic optimization method designed to tackle a wide range of problems, although it may be susceptible to local optima in certain situations and may experience stagnation issues. The MSSOA is developed to overcome these shortcomings of the SSOA. To enhance its search capabilities, the MSSOA employs two distinct seeking strategies. Firstly, it utilizes Levy flight distribution (LFD) to improve the seeking mechanism, allowing individuals to reach their new positions more efficiently. Secondly, individuals are directed to spiral around the optimal solution, improving the exploitation phase. The proposed MSSOA is then implemented for the SPV/WT/BESS system following the steps illustrated in Figure 7.
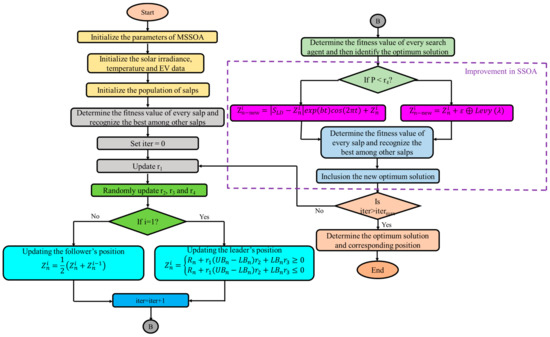
Figure 7.
The implementation of proposed MSSOA for the SPV/WT/BESS.
4.1. Salp Swarm Optimization Algorithm (SSOA)
Mirjalili introduced the salp swarm optimization algorithm (SSOA) in 2017, inspired by the foraging behavior of salp in the ocean [49]. The salp at the head of the chain guides the rest of the group. The location of salp is represented in an m-dimensional space where n is the number of variables for a specific problem. Therefore, the positions of all salp are stored in a two-dimensional matrix called z. The controlling expression for the SSOA is as follows:
where indicates the position of the leader and is the location of the target. Further, and denote the upper bound and lower bound in the dimension of the search space.
The plays a vital role in the SSA as it possesses a proper balance amongst exploration and exploitation capability. It can be represented in Equation (26):
where and denote the present iteration and maximum iterations, respectively.
The position of follower salps can be updated by incorporating Newton’s Second Law of Motion which can be expressed using Equation (27).
where and depict the position of follower salp in dimension, denotes the initial velocity and , where .
The computational time is determined by the number of iterations required to achieve optimal solution, and if the difference between iterations is equal to 1 and = 0, this equation can be modified as given below:
4.2. Modified Salp Swarm Optimization Algorithm (MSSOA)
The aim of the MSSOA is to overcome the limitations of the SSOA, which includes its inclination towards local optima and stagnation. The traditional SSOA can be improved by utilizing two search strategies, thereby enhancing its capabilities. The first modification involves the use of LFD to speed up the search process by allowing salps to explore new locations and break out of the cycle of inactivity. The second modification involves adjusting the positions of salps along a spiral path to reach the optimal solution. The first modification utilizes LFD, which can be defined as follows:
where represents the parameter which can be governed as follows:
where and may be expressed using Equation (31):
where denotes the standard gamma function. The second modification depends on relocating salps along the spiral path surrounding the optimal solution, as provided below:
where depicts the profile of a logarithmic spiral. The operator P is employed to balance the exploration and exploitation mechanisms using Equation (35).
In this equation, and correspond to the maximum and minimum limit of the operator , respectively. Ultimately, when P is small, the exploration capability of the MSSOA is enhanced through the utilization of LFD with Equation (27) to improve the searching process. On the other hand, an improvement in the exploitation mechanism can be performed using Equation (31) at the last iteration when the values of P are large.
5. Results and Discussion
This section deals with the implementation of the proposed MSSOA on the mathematical benchmark function for a validation purpose. After validation, the MSSOA is applied for the optimization of technical and economic objectives including the TNPC and LCOE for the optimal configuration.
5.1. Validation of MSSOA on Mathematical Benchmark Functions
This subsection examines the application of the MSSOA technique to conventional benchmark functions. Table 3 offers exhaustive explanations of various mathematical benchmark functions. The suggested optimization approach surpasses the SSOA in terms of maximum iterations and an optimum solution for 30 independent runs of 7 mathematical benchmark functions. The MSSOA sticks to a globally optimum solution without being trapped in a local optimal solution, leading to speedier convergence. The numerical outputs in terms of an optimal solution and number of iterations are shown in Table 4. The convergence curves of various benchmark functions using the MSSOA and SSOA are shown in Figure 8.
Table 3.
Mathematical benchmark functions.
Table 4.
Numerical results obtained using MSSOA and their comparison with SSOA.
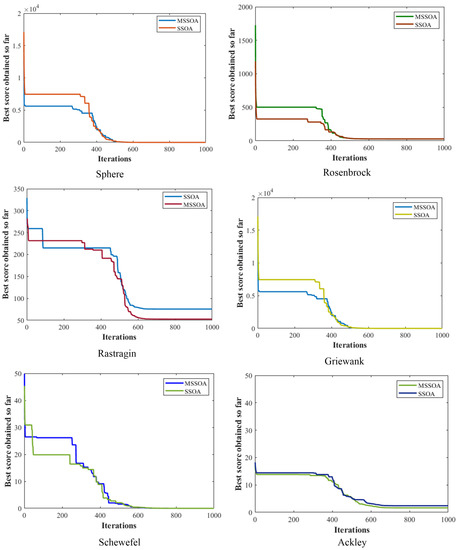
Figure 8.
Convergence curves of various benchmark functions using MSSOA.
The proposed algorithms MSSOA, SSOA and PSO are run 30 times, and their converging behavior towards the optimal solution is shown in Figure 9.
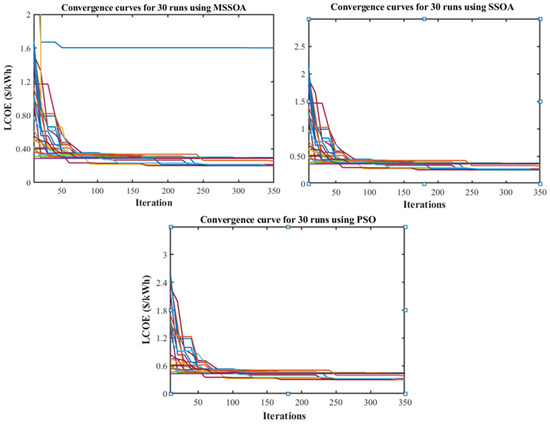
Figure 9.
Convergence curves of MSSOA, SSOA and PSO for 30 optimization runs. Each colored line represent optimization run.
This section explores various system component configurations aimed at meeting the EV load demand in the Qassim region, Saudi Arabia, using the proposed MSSOA technique. The configurations include SPV/BESS, WT/BESS and SPV/WT/BESS, and the primary objective is to achieve the optimal energy system design by optimizing the TNPC and LCOE. For each configuration, the objective functions, the number of decision variables such as SPV and WT units, battery capacity, converter output power, surplus electricity generated and the contribution of RES are evaluated. This study also compares the results obtained using the MSSOA with those obtained using the SSOA and PSO to demonstrate the former’s robustness. Moreover, the impact of energy purchase from the grid is analyzed, and the grid-connected renewable-based system is compared with the off-grid hybrid energy system. The research outcomes for different configurations are summarized in the next section. The aim of this section is to present the optimized numerical results obtained using the proposed MSSOA technique for various possible configurations of the system components to meet the EV load demand in the Qassim region, Saudi Arabia. Table 5 summarizes the results, indicating that the SPV/WT/BESS configuration has the lowest LCOE and TNPC values due to reduced capital, replacement and operation and maintenance costs. The MSSOA achieved an LCOE of USD 0.3697/kWh and a TNPC of USD 99,928.34, which is lower than those obtained by the SSOA (LCOE: USD 0.4156; TNPC: USD 1,12,671.75) and PSO (LCOE: USD 0.547/kWh; TNPC: USD 198,187.45). The optimized values of the system components and the tuned parameters used in the proposed algorithm are presented in Table 6. Figure 10 shows the TNPC and LCOE for various combinations of system components. Additionally, the MSSOA requires less computation time and fewer iterations to converge to an optimal solution compared to the SSOA and PSO. The converging patterns of the three algorithms are presented in Figure 11. The optimal system comprises 1125 SPV with 1 kW energy, 54 WT with 3 kW energy, 4376 battery units and a 213 kW bidirectional converter.
Table 5.
Analysis of optimized outcomes for charging stations in Qassim region, Saudi Arabia.
Table 6.
Tuned parameters of MSSOA algorithm.
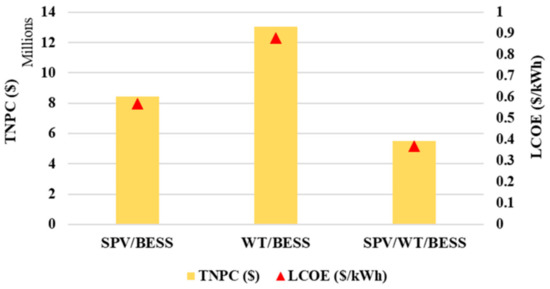
Figure 10.
Optimized value of TNPC and LCOE for different configurations.
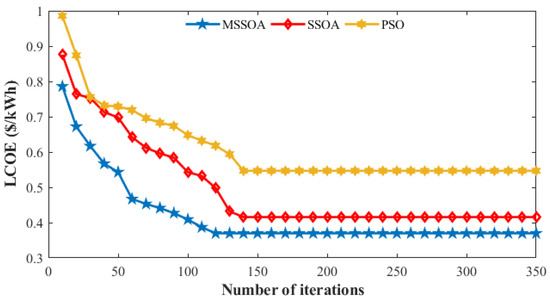
Figure 11.
Convergence curve of proposed MSSOA, SSOA and PSO.
5.2. Hourly Simulation Results
The electricity generated by various energy sources on an hourly basis for a three-day sample in the month of March (1 March to 3 March) is shown in Figure 12. In this specific site, it is assumed that the majority of the EV users prefer to supply their vehicles between 6:00 a.m. and 9:00 p.m. The most EV charging occurred between 3:00 p.m. and 5:00 p.m. There are very few EVs charging at night. In such circumstances, when the renewable power output surpasses the load demand, the surplus amount of electricity is fed to the battery energy storage, and the BESS discharges energy when the RES output is unable to meet the EV charging load. The output of the SPV and WT are represented by the blue dashed line and red dashed line, respectively. Wind energy is copious during the late night and early morning hours. In general, solar energy output is at its peak during the middle of the daylight period. The yellow dashed line illustrates the EV charging demand profile for the Qassim region of Saudi Arabia. The excess electrical energy is utilized to charge the BESS after meeting the load requirement. The top green dashed line is representing the SOC of the BESS and the amount of energy stored in the BESS. If there is enough extra power to fully charge the battery bank, the rest of the energy is supplied to the dump load. The output of the WT is converted to DC output with the help of a bi-directional inverter whose output is represented by the purple dashed line.
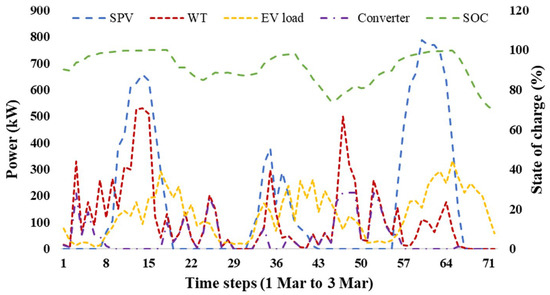
Figure 12.
Time series data of different energy components in an SPV/WT/BESS system.
The solar and wind output seemed to be adequate and able to meet the EV load demand. As a result, excessive power is generated in the afternoon. It is revealed that the excess energy was not fully transferred to the battery bank for several hours, even though its SOC had not arrived at the 100% level. This is due to the maximum possible charging rate and current of the chosen battery, as well as the batteries’ recent charging and discharging history, which is the basic principle of the kinetic battery model.
Throughout the simulation period, battery energy depletion may happen when the RES output is unable to meet demand, indicating that there are some energy deficits, which are represented as ‘unmet load’. When the maximum annual capacity shortage is assumed to be 0%, an extremely small unmet load of approximately 645 kWh/year (0.056% of the total load) was encountered during the simulation model year. The charging and discharging pattern of the BESS for three consecutive days of March (1 March to 3 March) is depicted in Figure 13.
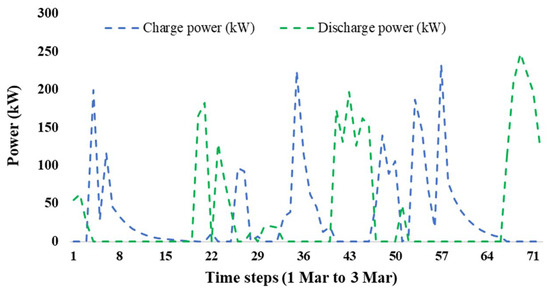
Figure 13.
Hourly charging and discharging power of the BESS.
5.3. Energy Flow Analysis
Even after having a higher SPV and WT power production, the power output of the bi-directional converter is comparatively much less in respect to the overall size of the system. In such a situation, the extra electricity produced is 1,868,903 kWh per year, which is 60.1% of total electricity production. The excess production of electricity, renewable power output and penetration of renewable sources for the time period of 1 March to 3 March on an hourly basis is shown in Figure 14. The energy production from different energy components on a monthly basis is depicted in Figure 15. It is noted that the SPV contribution is 59.6%, whereas the WT contributes 40.4% to the EV load satisfaction. Because of the consistent rainfall and clouds in the summer, electricity generation from the SPV module on a monthly basis is lower than in the winter.
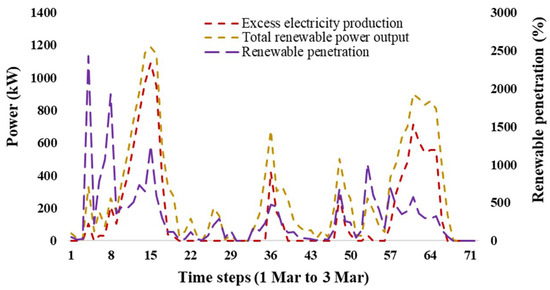
Figure 14.
Hourly production of excess electricity, renewable output and penetration in SPV/WT/BESS system.
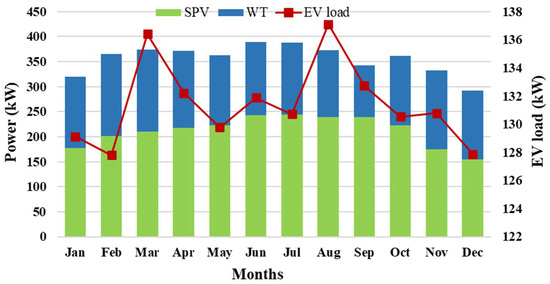
Figure 15.
Energy production by different system component on monthly basis in SPV/WT/BESS system.
5.4. Cost Breakdown
Figure 16 illustrates the cost breakdown for the different parts of three integrated energy systems: SPV/BESS, WT/BESS and SPV/WT/BESS. The most significant expenses are for the SPV and WT modules, which have high replacement costs. Despite the investment being less than the resource cost, the integrated system functions correctly and receives constant fiscal replenishment. All electricity needed to power EVs appears to come from renewable energy sources (RES), resulting in 100% RES utilization. The total net present cost (TNPC) for the SPV/WT/BESS system is USD 5,501,162.67, which is less than the TNPC for the SPV/BESS system (USD 8,458,369.88) and the TNPC for the WT/BESS system (USD 13,056,456.28).
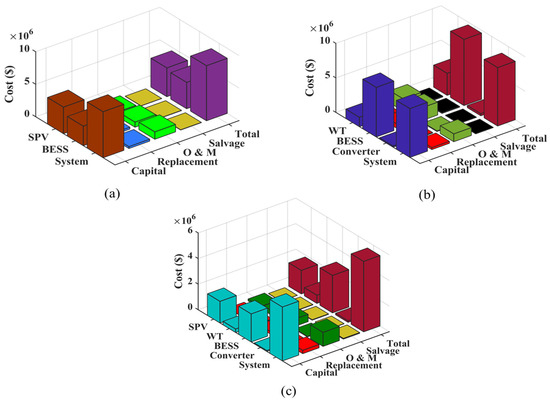
Figure 16.
Cost wise break up of different system components in (a) SPV/BESS system; (b) WT/BESS system; (c) SPV/WT/BESS system.
The cost of the battery bank in the SPV/WT/BESS system accounts for nearly 50% of the TNPC, with the capital cost making up approximately 61%. Therefore, the cost of the battery energy storage system (BESS) is the most critical factor in a standalone hybrid renewable system. The capital cost of the SPV array accounts for 70% of the TNPC, followed by the capital cost of the WT, which is responsible for approximately 6%, excluding operation and maintenance (O and M) and replacement costs. The converter is the least expensive component, comprising only 3% of the TNPC.
5.5. Grid Integration
This research also looks at the technological and economic impacts of renewable-based energy systems connected to the grid network. In this strategic plan, grid power is utilized to meet load demand when RES are inadequate to fulfil it. Excess energy is managed to sell to the grid, necessitating the small storage capacity while utilizing the huge quantity of excess energy dumped in hybrid energy options. In this context, a fixed unit energy purchase cost of USD 0.12/kWh is chosen, whereas a sell-back price of USD 0.08/kWh to the utility grid is considered.
5.5.1. Comparison of Grid-Connected and Off-Grid-Based Renewable Energy Systems
The grid-connected system has resulted in a lower LCOE (USD 0.07232/kWh) when equated with an off-grid system with an LCOE of USD 0.3697/kWh as shown in Table 7. When compared to a grid-connected system, the off-grid system requires more resources and the BESS. To illustrate, the off-grid hybrid energy system includes an SPV capacity of 1125 kW, WT capacity of 540 kW and 4376 battery units, whereas the grid-connected system necessitates an SPV capacity of 526 kW, WT capacity of 132 kW, 512,742 kWh/year of grid purchase and no BESS. Despite having a 526 kW SPV system and a 339-kW bi-directional converter, the grid-connected system requires the BESS and has insignificant resource costs due to its lower LCOE (USD 0.07232/kWh) compared to an off-grid energy system (USD 0.3697/kWh). The cost wise break up of the different components used in a grid-connected energy system is displayed in Figure 17. More relevantly, the excess energy in the grid-based energy system (109 kWh/year) is significantly less in comparison to the off-grid energy system (18,68,903 kWh/year). This is due to the fact that a significant amount of surplus power is sold to the grid and hence less devices are needed to satisfy the requirement in the absence of solar power.
Table 7.
Comparative analysis of grid and off-grid-based renewable energy systems.
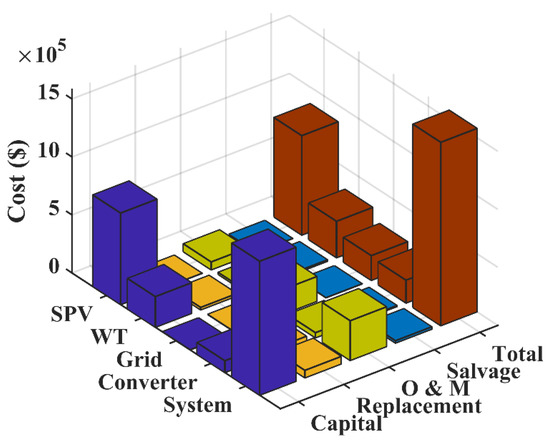
Figure 17.
Cost wise break up of a grid-connected renewable-based energy system.
According to Figure 18, the summertime, i.e., from June to September, necessitates a larger grid power purchase because of the increased demand. India, as a tropical country, has an approximately equivalent exposure to sunlight throughout the year. Although the summer months are predicted to produce more solar-powered energy, rainy days resulted in a lower monthly average solar power generation than the rest of the season. Solar meets approximately 53.7% of the energy demand, grid power meets 30.2% and the WT meets 16.1%. The time series data for different components of the grid-connected renewable-based energy system to meet the EV load requirement for the period of 1 March to 3 March are depicted in Figure 19. After analyzing the preceding results, it should be observed that a grid-connected system would be more beneficial considering the technical and financial parameters when compared to an off-grid energy system. The monthly power purchase and sale with the grid network is shown in Figure 20. It should be realized that grid power contributes significantly in the months of January and December due to the inadequate power obtained from RES. On the other hand, when RES generates enough of an amount of power predominantly in the month of July, a small amount of power is taken from the grid network.
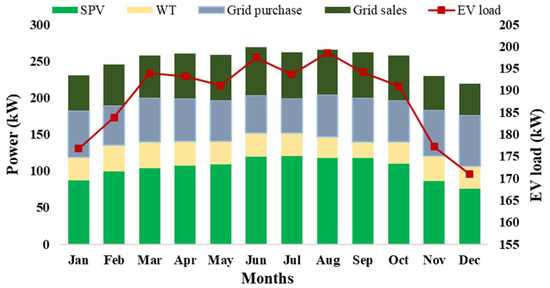
Figure 18.
Energy production by different system components on monthly basis in grid-connected SPV/WT system.
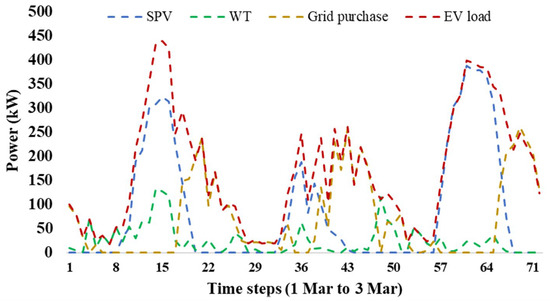
Figure 19.
Hourly share of energy system components to meet the EV load demand.
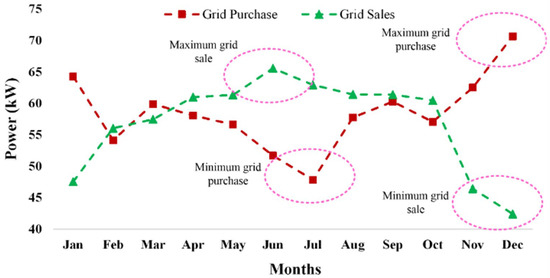
Figure 20.
Monthly purchase and sale of grid power.
5.5.2. Effect of Grid Energy Purchase on LCOE
This subsection examines the impact of power purchase from the grid and selling to the grid on the LCOE. When the power purchased and sold to the grid are the same, there would be 0% net grid purchase. As shown in Figure 21, the increase in the LCOE is more pronounced with increasing grid purchase than with increasing grid sell-back. As a result of an increase in grid contribution, the proportion of renewable energy decreases as the net grid purchase rises. The LCOE rises as more electricity is borrowed from the utility.
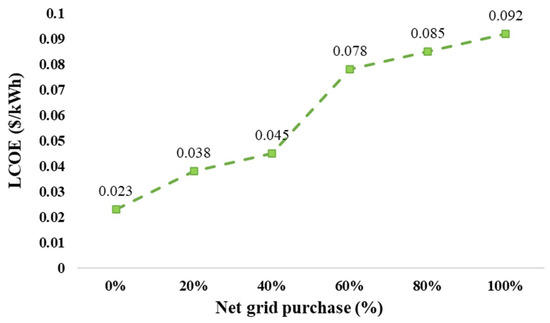
Figure 21.
Effect of energy purchase from grid on LCOE.
5.5.3. Number of SPV, WT and Batteries
The number of SPV, WT and batteries utilized in each configuration is portrayed in Figure 22. It is observed that the grid-connected energy system uses 526 SPV and 13 WT with a TNPC of USD 1,541,76 and operating cost of USD 29,887.89. In contrast, the off-grid-based energy system requires 1125 SPV, 54 WT and 4376 battery units comprising a TNPC of USD 5,501,162 and operating cost of USD 99,928.34. The grid-connected system requires a smaller number of the SPV and WT, and no energy storage is required. Hence, the TNPC of this system is significantly low as compared to the off-grid-based energy system.
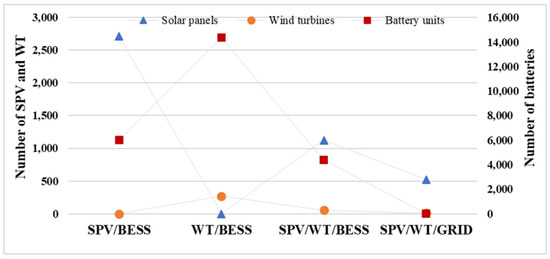
Figure 22.
Optimal sizing of system components in each configuration.
6. Policies and Investment Decision of EVs Charging Infrastructure Deployment in Saudi Arabia
As part of Saudi Vision 2030, Saudi Arabia has started an energy shift. Substantial modifications are occurring and challenging the status quo in accordance with this goal. One of these improvements is the implementation of the Saudi Corporate Fuel Efficiency (CAFE) standard, which seeks to increase the fuel economy of passenger cars in the Kingdom to 19 km/L by 2025. The CAFE standard’s primary objective is to minimize fuel usage and carbon emissions [50]. Such as it is with other transitional strategies, CAFE implementation will need time. Saudi Arabia might elect to install EVs in the Eastern area first, since gas-powered vehicles release far less carbon dioxide than liquid fuels. In the near future, when the fuel mix in the other countries develops to become more eco-friendly, aggressive EV deployment might occur in these regions. Yet, integrating EV adoption in the Eastern area with the establishment of the CAFE requirement might lead to larger reductions in carbon dioxide emissions.
The practice of charging consumers various prices at different times of the day, known as time-of-use pricing (TOUP), has been widespread in many nations even before the introduction of electric vehicles. Adopting TOUP is primarily motivated by the desire to reward users to move a part of their activities from peak to off-peak hours, so conserving peak-time power usage, cutting prices and relieving strain on the electrical infrastructure. TOUP may be configured to provide consumers with a benefit to charge their electric vehicles during periods when the marginal generator emits the least pollution [49]. In other nations, however, these objectives may not be compatible. In Saudi Arabia, the marginal generator in the Eastern area is always gas-fired, whereas those in the Western and Southern regions are always liquid-fired. Hence, in the latter locations, even if the EV owner switches the charging period to off-peak in response to the introduction of TOUP, it will not contribute to the reduction of carbon emissions; instead, it will encourage EV charging during off-peak hours to benefit the grid. TOUP in the Central area, particularly, has the capacity to cut emissions and minimize grid strain. TOUP rules must consider the fundamental pricing structure of the mix of energy supplies, while also considering the emission reduction objectives of the pricing scheme.
Backed by a surge in EV sales and targeted government efforts on a national and local scale, the market for EV charging infrastructure in Saudi Arabia is anticipated to expand at a rapid pace between 2023 and 2027. Initiatives in Saudi Arabia have targeted charging infrastructure; in November 2020, the Ministry of Municipal Rural Affairs and Housing (MOMRA) announced its aim to dedicate 5% of parking spots for EVs and construct EV charging stations in all carparks.
Private investment in EV charging infrastructure has increased in Saudi Arabia. Tawal and Electromin struck a strategic cooperation to improve charging facilities in Saudi Arabia in February 2023. Siemens has committed to provide Electomin with EV chargers for its planned construction of a charging network; it was revealed in November 2022.
7. Conclusions
The objective of this article was to examine both the technical and economic aspects of EV charging stations based on SPV/WT/BESS technology in the Qassim region of Saudi Arabia. The area taken under consideration has high potential for solar and wind energy. The use of a novel AI-based optimization technique was performed by including the solar radiation and wind speed of the studied location, and results were obtained considering various technological and economic features. The MSSOA was incorporated to mitigate the shortcomings of the conventional SSOA by making advancements in searching strategies using the Levy flight distribution. Furthermore, the MSSOA has an excellent capability to maintain equilibrium in the exploration and exploitation phase.
The main techno–economic optimization findings show that the SPV/WT/BESS-based EV charging station is the best solution for EV charging stations in this area. The SPV/WT/BESS configuration has the least LCOE among other possible configurations in the studied area. The values of the LCOE and TNPC attained using the MSSOA are USD 0.3697/kWh and USD 99,928.34, respectively, which are comparatively smaller than the LCOE (USD 0.4156) and TNPC (USD 1,12,671.75) as obtained by the SSOA. In the studied area, the highest monthly average electricity generated by PV arrays and WTs occurs in July and April, respectively, whereas the lowest monthly average electricity generated by PV arrays and WTs occur in December and August, respectively. The SPV/WT/BESS-based charging station design successfully satisfies the EV load demand in the area under study. Furthermore, this research also looks at the technological and economic impacts of renewable-based energy systems connected to the grid network. A fixed unit energy purchase cost of USD 0.12/kWh is chosen, whereas a fixed sell-back price of USD 0.08/kWh to the grid-connection is chosen. According to the analysis, the grid-connected energy system offers significant savings in costs over the SPV/WT/BESS-based EV charging station. The grid-connected system achieves the optimal LCOE (USD 0.0732/kWh) and TNPC (USD 1,541,076) values. In the grid-connected system, the number of SPV and WT units needed are 526 and 132, respectively, which is much less compared to the SPV/WT/BESS system. Furthermore, the hybrid energy system with an equal grid purchase and sell-back provides a cost-effective alternative.
Nevertheless, this current study has several limitations, such as the interpretation of its results based on several assumptions. In this study, both the amount of load and the number of EVs are tested under hypothetical conditions and on a small scale. It is problematic to establish an exact number of EVs presently on the road since much information must be required. In most instances, it is essential to make assumptions, and further study will be required soon.
In the future years, it is recommended that fast-charging stations be implemented to accommodate electric vehicles with larger battery capacities. Additionally, the number of charging stations within the charging infrastructure should be increased to reduce the maximum load re-charging periods and ensure uninterrupted charging operations. To ensure optimal battery performance, it is necessary to extend the charging duration throughout the day, which is essential for maintaining high efficiency and charge availability. In addition, further research is necessary to establish how the number of times a battery is charged and drained impacts the battery’s lifespan and operating expenses. Moreover, subsystem reliability statistics may be provided to create an accurate picture of the dependability of the whole system. In addition, the dependency on CO2 emissions and the safety and security of power system components may be included when assessing the system’s reliability. Given the activity-based behavior of EV drivers, a more standardized approach to designing charging infrastructure should be investigated. Using machine learning-based methodologies is one of the future research topics that must be solved to enhance the system’s reliability.
Author Contributions
Conceptualization, M.R.; Methodology, I.A. and M.R.; Software, M.B.; Validation, I.A. and M.B.; Investigation, M.A.; Resources, F.M.A.; Data curation, M.A. and F.M.A.; Writing—original draft, M.B.; Writing—review & editing, I.A., M.R. and F.M.A.; Supervision, M.R.; Funding acquisition, I.A. All authors have read and agreed to the published version of the manuscript.
Funding
This research work is funded by the Chair of Prince Faisal for Artificial Intelligence research (CPFAI) through project number QU-CPFAI-2-9-5.
Data Availability Statement
Data available on request.
Acknowledgments
The authors would like to thank the Chair of Prince Faisal for Artificial Intelligence research (CPFAI) for funding this research work through project number QU-CPFAI-2-9-5. Additionally, the authors would like to extend their appreciation to the Deputyship for Research & Innovation, Ministry of Education, and the Deanship of Scientific Research, Qassim University for their support for this research.
Conflicts of Interest
The authors declare no conflict of interest.
References
- Elshurafa, A.M.; Peerbocus, N. Electric vehicle deployment and carbon emissions in Saudi Arabia: A power system perspective. Electr. J. 2020, 33, 106774. [Google Scholar] [CrossRef]
- Electrical Energy Statistics. Available online: https://www.stats.gov.sa/en/1042 (accessed on 18 April 2023).
- Sayed, K.; Abo-Khalil, A.G.; Alghamdi, S. Optimum Resilient Operation and Control DC Microgrid Based Electric Vehicles Charging Station Powered by Renewable Energy Sources. Energies 2019, 12, 4240. [Google Scholar] [CrossRef]
- Abronzini, U.; Attaianese, C.; D’Arpino, M.; Di Monaco, M.; Genovese, A.; Pede, G.; Tomasso, G. Multi-source power converter system for EV charging station with integrated ESS. In Proceedings of the 2015 IEEE 1st International Forum on Research and Technologies for Society and Industry Leveraging a Better Tomorrow (RTSI), Torino, Italy, 16–18 September 2015; IEEE: Piscataway, NJ, USA, 2015; pp. 427–432. [Google Scholar]
- Yao, J.; Zhang, Y.; Yan, Z.; Li, L. A Group Approach of Smart Hybrid Poles with Renewable Energy, Street Lighting and EV Charging Based on DC Micro-Grid. Energies 2018, 11, 3445. [Google Scholar] [CrossRef]
- Nizam, M.; Wicaksono, F.X.R. Design and Optimization of Solar, Wind, and Distributed Energy Resource (DER) Hybrid Power Plant for Electric Vehicle (EV) Charging Station in Rural Area. In Proceedings of the 2018 5th International Conference on Electric Vehicular Technology (ICEVT), Surakarta, Indonesia, 30–31 October 2018; IEEE: Piscataway, NJ, USA, 2018; pp. 41–45. [Google Scholar]
- Takahashi, K.; Masrur, H.; Nakadomari, A.; Narayanan, K.; Takahashi, H.; Senjyu, T. Optimal Sizing of a Microgrid System with EV Charging Station in Park & Ride Facility. In Proceedings of the 2020 12th IEEE PES Asia-Pacific Power and Energy Engineering Conference (APPEEC), Nanjing, China, 20–23 September 2020; IEEE: Piscataway, NJ, USA, 2020; pp. 1–4. [Google Scholar]
- AKIL, M.; DOKUR, E.; BAYINDIR, R. Energy Management for EV Charging Based on Solar Energy in an Industrial Microgrid. In Proceedings of the 2020 9th International Conference on Renewable Energy Research and Application (ICRERA), Glasgow, UK, 27–30 September 2020; IEEE: Piscataway, NJ, USA, 2020; pp. 489–493. [Google Scholar]
- Gong, L.; Cao, W.; Liu, K.; Yu, Y.; Zhao, J. Demand responsive charging strategy of electric vehicles to mitigate the volatility of renewable energy sources. Renew. Energy 2020, 156, 665–676. [Google Scholar] [CrossRef]
- Zhou, Y.; Kumar, R.; Tang, S. Incentive-Based Distributed Scheduling of Electric Vehicle Charging Under Uncertainty. IEEE Trans. Power Syst. 2019, 34, 3–11. [Google Scholar] [CrossRef]
- Mustafa Kamal, M.; Asharaf, I.; Fernandez, E. Optimal renewable integrated rural energy planning for sustainable energy development. Sustain. Energy Technol. Assess. 2022, 53, 102581. [Google Scholar] [CrossRef]
- Novotny, V.; Dobes, J.; Hrabal, D. Implementing large scale electromobility infrastructure as a profitable virtual electricity storage plant: A case study, system ALISE. In Proceedings of the 2018 Smart City Symposium Prague (SCSP), Prague, Czech Republic, 26–27 May 2022; IEEE: Piscataway, NJ, USA, 2018; pp. 1–6. [Google Scholar]
- Ding, Z.; Teng, F.; Sarikprueck, P.; Hu, Z. Technical Review on Advanced Approaches for Electric Vehicle Charging Demand Management, Part II: Applications in Transportation System Coordination and Infrastructure Planning. IEEE Trans. Ind. Appl. 2020, 56, 5695–5703. [Google Scholar] [CrossRef]
- Gunkel, P.A.; Faust, F.J.; Skytte, K.; Bergaentzle, C. The Impact of EV Charging Schemes on the Nordic Energy System. In Proceedings of the 2019 16th International Conference on the European Energy Market (EEM), Ljubljana, Slovenia, 18–20 September 2019; IEEE: Piscataway, NJ, USA, 2019; pp. 1–7. [Google Scholar]
- Coria, G.E.; Sanchez, A.M.; Al-Sumaiti, A.S.; Rattá, G.A.; Rivera, S.R.; Romero, A.A. A Framework for Determining a Prediction-Of-Use Tariff Aimed at Coordinating Aggregators of Plug-In Electric Vehicles. Energies 2019, 12, 4487. [Google Scholar] [CrossRef]
- Zhang, B.; Dehghanian, P.; Kezunovic, M. Optimal Allocation of PV Generation and Battery Storage for Enhanced Resilience. IEEE Trans. Smart Grid 2019, 10, 535–545. [Google Scholar] [CrossRef]
- Harsh, P.; Das, D. Optimal coordination strategy of demand response and electric vehicle aggregators for the energy management of reconfigured grid-connected microgrid. Renew. Sustain. Energy Rev. 2022, 160, 112251. [Google Scholar] [CrossRef]
- Liu, C.; Liu, Y. Energy Management Strategy for Plug-In Hybrid Electric Vehicles Based on Driving Condition Recognition: A Review. Electronics 2022, 11, 342. [Google Scholar] [CrossRef]
- Zhao, S.; Li, K.; Yang, Z.; Xu, X.; Zhang, N. A new power system active rescheduling method considering the dispatchable plug-in electric vehicles and intermittent renewable energies. Appl. Energy 2022, 314, 118715. [Google Scholar] [CrossRef]
- Ouramdane, O.; Elbouchikhi, E.; Amirat, Y.; Le Gall, F.; Sedgh Gooya, E. Home Energy Management Considering Renewable Resources, Energy Storage, and an Electric Vehicle as a Backup. Energies 2022, 15, 2830. [Google Scholar] [CrossRef]
- Ali, F.; Ahmar, M.; Jiang, Y.; AlAhmad, M. A techno-economic assessment of hybrid energy systems in rural Pakistan. Energy 2021, 215, 119103. [Google Scholar] [CrossRef]
- Sachan, S.; Amini, M.H. Optimal allocation of EV charging spots along with capacitors in smart distribution network for congestion management. Int. Trans. Electr. Energy Syst. 2020, 30, 12507. [Google Scholar] [CrossRef]
- Kumar, J.; Suryakiran, B.V.; Verma, A.; Bhatti, T.S. Analysis of techno-economic viability with demand response strategy of a grid-connected microgrid model for enhanced rural electrification in Uttar Pradesh state, India. Energy 2019, 178, 176–185. [Google Scholar] [CrossRef]
- Niccolai, A.; Gonano, C.A.; Grimaccia, F.; Mussetta, M.; Zich, R.E. Population-adaptive SNO for antenna optimization. In Proceedings of the 2015 International Conference on Electromagnetics in Advanced Applications (ICEAA), Torino, Italy, 7–11 September 2015; IEEE: Piscataway, NJ, USA, 2015; pp. 1544–1547. [Google Scholar]
- Duman, A.C.; Güler, Ö. Techno-economic analysis of off-grid PV/wind/fuel cell hybrid system combinations with a comparison of regularly and seasonally occupied households. Sustain. Cities Soc. 2018, 42, 107–126. [Google Scholar] [CrossRef]
- Zhuang, Z.; Jin, T. Capacity Configuration and Control Strategy of EV Charging Station with Integrated Wind Power and Energy Storage Based on SSA. In Proceedings of the 2021 IEEE 5th Conference on Energy Internet and Energy System Integration (EI2), Taiyuan, China, 22–24 October 2021; IEEE: Piscataway, NJ, USA, 2021; pp. 4316–4322. [Google Scholar]
- Lau, K.Y.; Yousof, M.F.M.; Arshad, S.N.M.; Anwari, M.; Yatim, A.H.M. Performance analysis of hybrid photovoltaic/diesel energy system under Malaysian conditions. Energy 2010, 35, 3245–3255. [Google Scholar] [CrossRef]
- Ma, T.; Yang, H.; Lu, L. A feasibility study of a stand-alone hybrid solar–wind–battery system for a remote island. Appl. Energy 2014, 121, 149–158. [Google Scholar] [CrossRef]
- De Oliveira-Assis, L.; García-Triviño, P.; Soares-Ramos, E.P.P.; Sarrias-Mena, R.; García-Vázquez, C.A.; Ugalde-Loo, C.E.; Fernández-Ramírez, L.M. Optimal energy management system using biogeography based optimization for grid-connected MVDC microgrid with photovoltaic, hydrogen system, electric vehicles and Z-source converters. Energy Convers. Manag. 2021, 248, 114808. [Google Scholar] [CrossRef]
- Ma, T.; Yang, H.; Lu, L. Study on stand-alone power supply options for an isolated community. Int. J. Electr. Power Energy Syst. 2015, 65, 1–11. [Google Scholar] [CrossRef]
- Bilal, M.; Rizwan, M. Electric vehicles in a smart grid: A comprehensive survey on optimal location of charging station. IET Smart Grid 2020, 3, 267–279. [Google Scholar] [CrossRef]
- Kamal, M.M.; Ashraf, I.; Fernandez, E. Planning and optimization of microgrid for rural electrification with integration of renewable energy resources. J. Energy Storage 2022, 52, 104782. [Google Scholar] [CrossRef]
- Ramli, M.A.M.; Hiendro, A.; Twaha, S. Economic analysis of PV/diesel hybrid system with flywheel energy storage. Renew. Energy 2015, 78, 398–405. [Google Scholar] [CrossRef]
- Wu, Z.; Bhat, P.K.; Chen, B. Optimal Configuration of Extreme Fast Charging Stations Integrated with Energy Storage System and Photovoltaic Panels in Distribution Networks. Energies 2023, 16, 2385. [Google Scholar] [CrossRef]
- Olatomiwa, L.; Mekhilef, S.; Huda, A.S.N.; Ohunakin, O.S. Economic evaluation of hybrid energy systems for rural electrification in six geo-political zones of Nigeria. Renew. Energy 2015, 83, 435–446. [Google Scholar] [CrossRef]
- Rezzouk, H.; Mellit, A. Feasibility study and sensitivity analysis of a stand-alone photovoltaic–diesel–battery hybrid energy system in the north of Algeria. Renew. Sustain. Energy Rev. 2015, 43, 1134–1150. [Google Scholar] [CrossRef]
- Singh, A.; Baredar, P.; Gupta, B. Techno-economic feasibility analysis of hydrogen fuel cell and solar photovoltaic hybrid renewable energy system for academic research building. Energy Convers. Manag. 2017, 145, 398–414. [Google Scholar] [CrossRef]
- Niccolai, A.; Beccaria, M.; Zich, R.E.; Massaccesi, A.; Pirinoli, P. Social Network Optimization Based Procedure for Beam-Scanning Reflectarray Antenna Design. IEEE Open J. Antennas Propag. 2020, 1, 500–512. [Google Scholar] [CrossRef]
- Ahmad, F.; Ashraf, I.; Iqbal, A.; Marzband, M.; Khan, I. A novel AI approach for optimal deployment of EV fast charging station and reliability analysis with solar based DGs in distribution network. Energy Rep. 2022, 8, 11646–11660. [Google Scholar] [CrossRef]
- Wahedi, A.A.; Bicer, Y. Techno-economic assessment of a renewable energy-based electric vehicle fast-charging station in Qatar. In Computer Aided Chemical Engineering; Elsevier: Amsterdam, The Netherlands, 2021; Volume 50, pp. 1629–1634. [Google Scholar]
- Bilal, M.; Ahmad, F.; Rizwan, M. Techno-economic assessment of grid and renewable powered electric vehicle charging stations in India using a modified metaheuristic technique. Energy Convers. Manag. 2023, 284, 116995. [Google Scholar] [CrossRef]
- Rajbongshi, R.; Borgohain, D.; Mahapatra, S. Optimization of PV-biomass-diesel and grid base hybrid energy systems for rural electrification by using HOMER. Energy 2017, 126, 461–474. [Google Scholar] [CrossRef]
- Nishanthy, J.; Charles Raja, S.; Praveen, T.; Jeslin Drusila Nesamalar, J.; Venkatesh, P. Techno-economic analysis of a hybrid solar wind electric vehicle charging station in highway roads. Int. J. Energy Res. 2022, 46, 7883–7903. [Google Scholar] [CrossRef]
- Bilal, M.; Alsaidan, I.; Alaraj, M.; Almasoudi, F.M.; Rizwan, M. Techno-Economic and Environmental Analysis of Grid-Connected Electric Vehicle Charging Station Using AI-Based Algorithm. Mathematics 2022, 10, 924. [Google Scholar] [CrossRef]
- Al Garni, H.Z.; Abubakar Mas’ud, A.; Baseer, M.A.; Ramli, M.A.M. Techno-economic optimization and sensitivity analysis of a PV/Wind/diesel/battery system in Saudi Arabia using a combined dispatch strategy. Sustain. Energy Technol. Assess. 2022, 53, 102730. [Google Scholar] [CrossRef]
- GASTAT Statistical Database. Available online: https://database.stats.gov.sa/home/indicator/410 (accessed on 18 April 2023).
- Geleta, D.K.; Manshahia, M.S.; Vasant, P.; Banik, A. Grey wolf optimizer for optimal sizing of hybrid wind and solar renewable energy system. Comput. Intell. 2020, 38, 1133–1162. [Google Scholar] [CrossRef]
- Kamal, M.M.; Ashraf, I.; Fernandez, E. Sustainable electrification planning of rural microgrid using renewable resources and its environmental impact assessment. Environ. Sci. Pollut. Res. 2022, 29, 86376–86399. [Google Scholar] [CrossRef]
- Nilsson, A.; Stoll, P.; Brandt, N. Assessing the impact of real-time price visualization on residential electricity consumption, costs, and carbon emissions. Resour. Conserv. Recycl. 2017, 124, 152–161. [Google Scholar] [CrossRef]
- Zirogiannis, N.; Duncan, D.; Carley, S.; Siddiki, S.; Graham, J.D. The effect of CAFE standards on vehicle sales projections: A Total Cost of Ownership approach. Transp. Policy 2019, 75, 70–87. [Google Scholar] [CrossRef]


Disclaimer/Publisher’s Note: The statements, opinions and data contained in all publications are solely those of the individual author(s) and contributor(s) and not of MDPI and/or the editor(s). MDPI and/or the editor(s) disclaim responsibility for any injury to people or property resulting from any ideas, methods, instructions or products referred to in the content. |
© 2023 by the authors. Licensee MDPI, Basel, Switzerland. This article is an open access article distributed under the terms and conditions of the Creative Commons Attribution (CC BY) license (https://creativecommons.org/licenses/by/4.0/).