1. Introduction
The theoretical study of dynamics for spatially structured populations and biological communities as systems of populations coupled by migration (metapopulation or metacommunity) is a complex interdisciplinary problem. The study involves purely biological aspects of the search for the causes and mechanisms of the inhomogeneous distribution of individuals over an area. Another aspect is the purely mathematical issue of the theoretical study of the collective dynamics of the coupled nonlinear oscillators.
There are various approaches and models that describe the dynamics of such biological systems. A common method is based on the use of coupled map lattices. In this approach, a local population or a subpopulation in a single small habitat (site) can maintain its population size for a long time with sustainable, periodic, or complex dynamical behavior. Coupling between subpopulations located far enough somehow synchronizes their dynamics. In this case, the structure of the local population without migratio is completely determined by a single map (a discrete time model). A one-dimensional model, such as a logistic map, a Ricker model, or a Beverton–Holt model, can describe the local dynamics of populations with non-overlapping generations [
1,
2,
3,
4,
5]. If the local population has an age structure (overlapping generations), then the local dynamics are described by a two- or more dimensional map [
6,
7,
8,
9,
10]. A local structure, involving interspecific interactions, often arises for the study of metacommunitie, that is, ecological communities of predator–prey or host–parasite systems coupled by migration [
11,
12,
13,
14,
15,
16,
17,
18,
19].
The coupling between local populations describes the migration or resettlement of individuals to neighboring sites (local coupling)—not only to neighboring, but also to quite distant, sites (non-local coupling). Resettlement for populations with non-overlapping generations always directly changes the population size in the current reproductive season. However, in the case of overlapping generations, the age-structured populations can realize migration through different generations. For example, only individuals of a certain age class can migrate. As a result, a momentary state of one local age-structured population will completely change the sizes of all coupled subpopulations but with a certain delay depending on the number of generations. The resettlement of individuals can be an instantaneous or prolonged process, so individuals (emigrants) that leave their native patch in the current reproductive season will join a new site and will be indistinguishable from local ones only after a few seasons. Such types of migration correlate with dissipative and inertial (reactive) couplings between nonlinear oscillators or their combination [
20,
21]. Sufficient researchers show that different coupling types between nonlinear oscillators sometimes lead to fundamentally different dynamic regimes with various ratios of synchronous and non-synchronous regimes [
21,
22].
The coupling strength or migrant flow rate from a single local population obviously changes with distance to other sites and corresponds to the diffusion of individuals. This idea is in contrast to “classical” coupled maps lattices, where this aspect is not often considered. Many researchers are considering the nonlinear function of the migration rate between patches on population density [
23] or on the distance between patches [
24,
25] by analogy with the diffusion of chemical or biological agents. The nonlinearity of the migration function implies that the intensity of the migration flow does not just fall as the distance between the sites increases but falls with some acceleration. With this function, for neighboring sites, and adjacent to them, the falling in the coupling strength is minimal, and for more distant ones, the coupling strength is plummeting. When moving across the area, individuals experience resistance to their resettlement by analogy with the diffusion of chemical agents. As a result, individuals predominantly reach neighboring sites and only a small number of individuals reach more distant subpopulations.
Considering some of the above facts, the article considers an approach to construction and the study of a mathematical model for a two-age-structured population inhabiting a 2D area (structured metapopulation) with discrete time and space, and nonlinear coupling.
To study the different coupling functions between local populations, we develop ideas outlined in the following articles [
7,
23,
24,
25]. We consider a situation in which individuals of different generations interact with one another and disperse over a long distance in a certain way. This phenomenon is simulated using various functions of coupling strength on distances between farther subpopulations. To analyze the conditions for the formation of various spatio-temporal structures (patterns), we rely on results and methodologies for studying dissipative structures observed in systems of nonlocally coupled nonlinear oscillators of various types [
1,
12,
15,
16,
26,
27,
28,
29,
30,
31,
32,
33,
34,
35,
36,
37,
38,
39,
40,
41,
42,
43,
44].
In the cited papers, researchers were interested in the causes of synchronization and desynchronization of many coupled oscillators, leading, in particular, to cluster synchronization, as well as the consequences of synchronization for real population systems. Using a simple model of metapopulation dynamics, it is shown that the complete synchronization of the dynamics of coupled populations is an alarming symptom [
29,
30]. They showed that a catastrophic decline in population abundance in only one patch increases the risk of global extinction, precisely in the case of completely synchronous dynamics [
30]. On the other hand, for the systems of two symmetrically coupled identical populations with non-overlapping generations, it was shown that the transition from in-phase fluctuations (complete synchronization) to out-of-phase oscillations globally stabilizes the dynamics due to the expansion of the attraction basins of out-of-phase regimes [
1,
4,
28,
45]. However, this happens with a weak coupling, and for a strong coupling, only complete synchronization is possible. The coupling strength here correlates with the distance between subpopulations: neighboring sites are strongly interconnected and intensively exchange migrants, while distant sites are weakly connected. Thus, we describe the nonlinear function of the migration.
For many small mammals (voles, lemmings, hares, etc.), researchers still observe the phase synchronization of cycles in different patches of a vast area [
46,
47,
48]. With this type of synchronization, the sequence of oscillation peaks of the population abundance coincides from one part of the time series to another, and not the absolute values of the abundance [
49]. Theoretical studies of populations coupled by migration show that phase synchronization, like out-of-phase dynamics, can also maintain the sustainability of the entire population system but leads to a traveling wave in space, especially for the complex (chaotic) dynamics of local populations [
50]. In addition, there is the geographical gradient in the structure of the dynamics of the Fennoscandian bank vole population (
Clethrionomys glareolus), which consists in the transition from non-cyclical dynamics in the southern regions to cycles with a period equal to 2, 3, 5, and longer in the north [
46]. With such a transition, there is a change in the coherence of rodent’s dynamics (phase synchronization), as well as predators that feed on them (foxes, arctic foxes, and birds) in distant sites [
47,
48]. With such a transition, as the period of the cycle increases, fluctuations in vole and predator populations become more synchronous (in phase) at sufficiently large distances in the north and less synchronous in the south. In other words, for the fairly distant, indirectly coupled populations, the phase synchronization occurs, and the adjacent populations, which intensively exchange migrants, are not synchronous.
Moreover, there are other types of synchronization of the dynamics of coupled oscillators (populations): lag synchronization [
51,
52], fixed-time synchronization [
53], generalized synchronization [
54], cluster synchronization [
55,
56], etc. Each of them corresponds to different aspects of the consistency of the collective dynamics of coupled non-linear oscillators.
In this paper, we consider the full synchronization of all of the coupled subpopulations, which corresponds to a homogeneous spatial distribution, as well as phase and cluster synchronization, which corresponds to various dissipative structures and complex spatial patterns with coherent dynamics in the model with discrete space and time. In these models, cluster synchronization, standing and traveling waves, chimera and solitary states, etc, present typical types of spatio-temporal dynamics. The appearance of such spatial patterns for the model of the age-structured metapopulation is interesting. However, a local two-aged-structured population (its model, i.e., a 2D nonlinear map) demonstrates, by itself, complex dynamical behavior. For example, a multiplicity of evolution or multistability of dynamic regimes occurs as follows: different initial population sizes lead to fundamentally different types of dynamics [
57,
58,
59,
60,
61]. As a result, spatio-temporal dynamics are also multistable. Therefore, this paper focuses on the conditions leading to fundamentally various types of dynamics with multiple periods at different points in the 2D area.
2. Population Dynamics Model with Age Structure and Simple Migration
without Diffusion
In a simple case, a 2D habitat (area) of some abundant species of animals may cover a 2D rectangular uniform lattice with
s cols and
k rows. The node of lattice, site, or patch is populated by a local group of individuals (as it is called a subpopulation). We number these sites by using double indexing
, where
i is a row number (
) and
j is a column number (
). To describe the dynamics of each subpopulation without migratory interactions, we will use a discrete time model of a two-age-structured population [
9,
62]:
where
and
are the relative population size or density of younger (immature) and adult (mature) individuals in iteration
t, respectively. Equation (
1) describe a situation in which the number of immature individuals non-linearly depends on the number of both age classes and corresponds to the density-dependent regulation of birth. The exponent describes this behavior in the first equation. At the same time, the adult age class consists of adult individuals who are last-season survivors (with proportion
) as well as mature individuals who moved from the younger class to the adult class (due to the survival of juveniles with intensity
). Parameter
in the first equation is the maximum birth rate (reproductive potential), and parameter
determines the relative influence of the younger class on the density-dependent regulation of birth.
In general, the presented model (
1) was designed to describe the dynamics of the population size of species with a short life cycle, especially small mammals or fast-growing insects. The general form of the model was successfully used to describe the dynamics of the mouse-like rodent population of bank vole (
Myodes glareolus) [
61]. We will not completely list the results of the cited papers but list the main mathematical facts. The 2D map (
1) has a unique nonzero fixed point that loses stability through the period doubling bifurcation or through the formation of the limit invariant curve (torus) [
62,
63]. However, more importantly, the model (
1) demonstrates multistability in a wide range of demographic parameters [
9]. For example, the stable stationary dynamics (in the stability domain) or the cycle with a period equal to 3 are formed depending on initial numbers
and
. A phase plane is divided into attraction basins of these regimes. Each of the two regimes, in a certain way, loses stability, and two coexisting attractors are formed. As a result, the stable fixed point coexists with chaotic dynamics (
Figure 1a), the stable periodic point coexists with the chaotic dynamics (
Figure 1b), or two various chaotic regimes are present (
Figure 1c).
Let us first consider the long-range interactions between identical two-age populations as a linear non-local coupling between 2D nonlinear maps.
We note that the coupling, migration, or resettlement of individuals between neighboring patches can be local when only adjacent sites are coupled or global when each patch is coupled to all others or long-range (non-local) when a local population is coupled to small number of populations from a certain neighborhood. The patch with number is neighboring the patch with number if they are located from each other no further than P sites or they are in the neighborhood of radius P, that is, the following inequality holds: , , where the sign is the distance (norm) between double indices and . The possible resettlement directions of individuals and the shape of the neighborhood depend on the choice of this norm.
Based on the above definition, let us consider the following types of long-range interactions or migrations between single subpopulations described by system (
1).
Suppose that at the end of reproductive season, the number of surviving adult individuals from each subpopulation is equal to and simultaneously disperses to other patches lying in the neighborhood of radius P. Parameter is the migration rate or the coupling strength. Denote by S the number of patches in this neighborhood ( if ). With linear resettlement without dissipations or “price”, individuals who left their native patch (emigrants) replenish S neighbors in equal shares and in full. Here, we will neglect possible mortality during displacement. The number of individuals reaching each patch (immigrants) is equal to . The number S depends on the size and shape of the neighborhood that determines the direction of possible resettlement from the local population with the number . For other populations with other numbers , neighborhoods of the same shape and size with the same value of S exist. We can define the neighborhood as a square (the so-called Moore neighborhood with ), a rhombus (the so-called von Neumann neighborhood with ), or a circle ().
Assume that the movements between adjacent nodes of the rectangular lattice are possible directly along its faces and in different diagonal directions between opposite nodes regardless of the neighborhood shape. For example, if , then the th subpopulation is coupled with , , , and , as well as with , , , and . If , then it is coupled with all of the subpopulations that fall into this square, rhombus, or round domain.
Given the above assumptions, we will use the following mathematical model of the spatio-temporal dynamics of coupled two-age-structured subpopulations living in the rectangular area with sizes
s to
k (
):
where
m is the coupling strength (
) and
P is the radius of coupling (
). In system (
2), the function
M determines a neighborhood. The value of
M is nonzero if the patch with the number
falls into the neighborhood of
; otherwise, it is equal to zero. For example,
for a square neighborhood,
for a rhombus, and
for a circular neighborhood (
is a Heaviside step function). However, the circular domain needs some rounding because of the discrete space. As a result, the neighborhood is the polygon.
The system of Equation (
2) is written simply for some analytical studies. However, we redefine the function
M by the following condition:
, if
and
simultaneously. Then, the number of neighbors
S can be defined as the number of events when the redefined function
M under the double sum sign is nonzero, that is,
with additional condition
. The last term (double sum) of the second equation of (
2) is equal to the difference between the number of individuals inhabiting the
th patch (immigrants) and the number of those who left this patch (emigrants).
In order to eliminate the boundary effect, we present the area as a 2D torus. For this, we assume that the first row of the lattice of system (
2) is coupled with the last one, and the first column is coupled with the last one, that is, each subpopulation with the number
is coupled with
and
with
, where
,
;
s and
k are the sizes of the 2D area. This distribution scheme is well known as the periodic boundary conditions and is easily formalized as the function equal to the periodic remainder after the division of the indices
g and
h by the area sizes
s and
k, that is, we use the mapping
and
under the double summation sign.
According to ecologists, a habitat is seldom described by a torus but is widely used by mathematicians. For instance, this scenario is used to simulate spatio-temporal dynamics for continuous space (reaction–diffusion equations) [
13,
17,
19] and for discrete space (ensembles of nonlinear oscillators) [
2,
12,
14,
18,
31,
32]. This range description is especially used in cellular automata and individual-based models [
64,
65]. Traditionally, the periodic boundary conditions are used to simulate the spatio-temporal dynamics of populations in a small area of a huge habitat if the modeling of an entire habitat is technically difficult. For example, complexity is attributed to the heterogeneous environmental conditions throughout a habitat but approximately equal conditions in a small part of the habitat. Periodic boundaries fill the knowledge gaps in the states of a population outside a simulated area. Here, we assume that the population dynamics in the considered 2D area are “repeated” or “reflected” in unaccounted neighboring areas and depend on its states. Thus, this effect is comparable with the influence of this area on itself. As a result, the periodic boundary conditions do not lead to the edge effect at the border of the simulated area. However, this effect is still possible in central parts of the simulated area in cases of complex spatial patterns due to a large difference in population densities in neighboring sites.
3. Examples of Spatio-Temporal Dynamics
Let us consider some solutions of system (
2) for the square area of 2500 sites (
= 50) and for the neighborhoods of various shapes (square, rhombus, and circle). We fix the following values of demographic parameters:
,
,
, and
, corresponding to the situation presented in
Figure 1b. Two coexisting dynamical regimes exist for such values: oscillations with a period equal to 4 (the result of two period doubling bifurcations of a fixed point, designated as
) and chaotic dynamics (the result of the bifurcation of the periodic point of period 3, designated as
). The chaotic regime corresponds to the positive largest Lyapunov exponent (
). This means that two potential limit regimes (states) of the local two-aged-structured population exist depending on the initial conditions (the initial population sizes
,
). In a system of coupled populations, these potential states can be synchronized in various ways and usually lead to different multistable scenarios of spatio-temporal dynamics (patterns).
We wonder if the coexistence of two or more spatial clusters of coherent dynamics with fundamentally different types of fluctuations is possible. For example, a periodic regime exists in the first, and chaotic dynamics exist in the second (frozen random pattern). However, what is more interesting is the spatio-temporal periodic regimes when there are several clusters whose elements fluctuate with non-multiple periods. Similar spatial regimes are well known for systems of coupled bistable oscillators: a ring of FitzHumo–Nagumo oscillators [
39] or cubic maps [
42,
44]. In these models, two clusters exist under certain conditions: the first cluster corresponds to the first potential state of the bistable oscillator and the second to another state. We found [
10] the similar spatio-temporal regimes of model (
2) for the 1D area (
,
), and we expect to find a similar regime for the 2D area (
,
).
To begin with, we considered the spatio-temporal regimes of system (
2) at special initial conditions corresponding to a homogeneous distribution of individuals over the area. For example, with
,
, the system (
2) for any form of neighborhood generates the fully synchronous oscillations of all subpopulations with a period equal to 4. We perturbed the population size in one or more subpopulations and analyzed the spatio-temporal structure corresponding to an inhomogeneous distribution.
We make a remark before showing the main results.
Figure 2,
Figure 3 and
Figure 4 show the spatio-temporal dynamics in three different ways. The first method is a 3D graph of the population size of each subpopulation at a fixed point in time
t depending on their spatial coordinates
(a so-called a snapshot) or its flat version (the second columns of
Figure 2). The color codes the population size of each subpopulation (the legend is shown in the right). Second is a spatio-temporal profile showing a 1D slice of a space–time regime along a selected direction in the area (the third columns of
Figure 2). These profiles show the spatial distribution of the number of the mature individuals
at different points in time, depending on one selected spatial coordinate (index
j is fixed and
i is changing, or vice versa). The distribution of the immature individuals
repeats the distribution of the mature individuals. The values of
t should be large enough, usually from 10,000 to 10,100, but such large values of
t are necessary only for discarding all transients and ensuring that the observed asymptotic spatial structures are structurally stable and do not change in time. As a result, each
t corresponds to a separate graph (the number of adult individuals depending on spatial coordinates
). If we observe the last 100 iterations (
t = 10,000…10,100) of population matrices and there are only 2 different population distributions observed on the graph, then the dynamics are periodic with a period equal to 2, as shown in the last column of
Figure 2b. The intersection point of the graphs shows that the oscillations are different to the right and the left of this point; for example, fluctuations are out-of-phase. If the population distributions overlap for each
t, then the oscillations are completely synchronous. In general, the spatio-temporal profiles have long become a traditional method of representing the spatio-temporal dynamics of coupled nonlinear oscillators [
24,
27,
33]. These profiles show the dynamics of an individual oscillator and a character of collective behavior, both in space and time. For example, they easily specify the groups or clusters of synchronous elements, traveling waves, chimera states, and solitary states.
Figure 2 shows snapshots in time of the population distribution patterns after a perturbation to location
on the lattice, where the initial population is homogeneous with
,
except for
, 13, or 14. Here, and further in the text, we consider the last 100 iterations of the model (
2) after discarding all transients, i.e.,
t = 10,000…10,100. In this example, the strength and radius of coupling is large enough, namely, at
and
. In terms of metapopulation, the perturbation of its homogeneous distribution can be considered as adding or removing a certain number of adult individuals to one of its subpopulations (in one patch). These influences can equally shift the population size to the attraction basin of another dynamics regime (
Figure 1). Given that we presented the 2D area as a torus, the location of a perturbed subpopulation will not matter for a fixed size of added or removed individuals. In all cases, it will form the similar spatial structures that differ only in the location on the area.
A strong single perturbation (burst) of one subpopulation spreads quickly and, as a rule, amplifies fluctuations of subpopulations from a certain neighborhood, where the period and amplitude of oscillations is increasing significantly (
Figure 2). The spread rate of this perturbation depends on the radius and strength of coupling and on the magnitude of the initial burst. Here, we can specify the minimum impact on a single population that leads to this type of spatio-temporal dynamic:
. Moreover, if several subpopulations are simultaneously affected, then this threshold value drops significantly.
The two groups or clusters of synchronous elements are easy to show in these naive examples (
Figure 2 and
Figure 3). Their spatial shapes and sizes partially repeat the character of neighborhoods in each example (square, rhombus, and circle). The first cluster includes the subpopulations that were not affected by the initial burst, and they did not qualitatively change their dynamics. Synchronous oscillations with a period equal to 4 exist in this cluster. The second cluster includes the subpopulations with a completely different type of oscillation. For the rhomboid neighborhood, the subpopulations in the center of the area fluctuate with the large finite period that is not divisible by 4 (
Figure 2c). For square and round neighborhoods, the fluctuations differ only in the phases in different clusters (
Figure 2a,b). In addition, the subpopulation with the number
, which perturbs an initially homogeneous distribution, is significantly different from the others in all of the examples, is incoherent to its neighbors, and continues to demonstrate a single burst called a solitary state. This state is the peak of the population size shown in
Figure 2a for a cycle neighborhood. Synchronizing this subpopulation with neighbors is possible with a significant increase in the magnitude of the initial perturbation or an increase in the number of perturbed subpopulations. For example, a twofold increase in the initial perturbation leads to the synchronization of the subpopulation with the number
and the formation of a cluster with several of its neighbors but not with all of those neighbors from the neighborhood of radius
P. However, if we increase the perturbation by a factor of 2.5, then the solitary state in the center will reappear (
Figure 3a). For the round and rhomboid neighborhood, this small cluster is located around the
th element in the middle of a big one with radius
P. We can see this phenomenon in the center of a snapshot in
Figure 3b,c. This small cluster contains nearly synchronous elements with more regular dynamics than a large cluster, showing chaotic incoherent dynamics. The subpopulations on the periphery are still synchronous (coherent).
These simple and unrealistic examples suggest the following scenario. In a system of two-age-structured populations coupled by migration under certain conditions, a transition occurs from an initially full synchronous dynamical behavior (a homogeneous metapopulation) to cluster synchronization or completely non-synchronous collective behavior (a heterogeneous metapopulation). In the first step of this transition, the dynamics are based on one multistable state of a single population (4-cycle). In the second step, the dynamics may further include other multistable states (chaotic dynamics) or a combination of various potential states (regular and chaotic).
In all of the aforementioned examples, the view and the size of the formed clusters are mostly determined by the type of the chosen neighborhood and its radius. In the case of the circular neighborhood, the cluster is always a circle (polygon due to discrete space) with a clear boundary between groups of subpopulations with different types of collective dynamical behavior (full synchronization, incoherent, or spatial chaos). The square and rhomboid neighborhoods do not always correlate with the view of resulting clusters, which often include the several groups with deliberate regular shapes. For example,
Figure 2c shows the pattern with square and diamond-shaped clusters in each other, which occur for the rhomboid neighborhood. In the case of the square neighborhood,
Figure 3b shows the pattern with clusters similar to the intersection of a circle, a square, and a rhombus. Such exotic spatial structures, at first glance, can be explained by the selected special initial conditions (the perturbation of a single population). However, this phenomenon is related to the following circumstances.
In model (
2) with any of the listed neighborhoods, the coupling strength between all of the single subpopulations is the same. Thus, the emigrants from the
th patch replenish any subpopulations from this neighborhood in equal proportions. As a result, adjacent patches, located no further than one site apart, will be replenished with the same number of individuals as those of the patches located far enough away. However, at the border of a neighborhood, the number of emigrants drops sharply to zero without any transitional states and is not substantively correct. As such, the migration flow has no resistance during displacement without dissipation, and individuals have a certain barrier that cannot be overcome in one reproductive season. As a result, subpopulations from a vicinity of a perturbed subpopulation, as a rule, are synchronized due to the equal coupling strength between them all. Therefore, the shape of clusters repeats the shape of the selected neighborhood, more or less, and its size is exactly equal to coupling radius
P.
4. Model of Population Dynamics with Migration by Type of Dissipation
To eliminate such unrealistic behavior, we define a neighborhood of a single population in a general case. Let the total fraction of leaving individuals (emigrants) from the
th site be equal to
m (
), and the percentage of individuals coming in the
th site decreases as the distance between them increases. We assume that the migrant flow has resistance and corresponds to the diffusion of individuals. Several simple functions describe this apparently nonlinear coupling. For example, the hyperbolic or exponential function for a 1D area (
,
) has the form:
In general, the additional condition is as follows:
, if
. The parameter
specifies the degree of weakening of the coupling strength from distance [
24,
25]. The value of
c is the normalization factor (similar to
S in the model (
2)) and is calculated to ensure the equality between the number of individuals who left the
ith site and the individuals who came to the
gth site. In the 1D case, the following equality holds:
then
for the hyperbolic and the exponential coupling function, respectively. No mortality during migration happens when we use these functions, as well as in model (
2). Consequently, the number of emigrants is equal to the number of immigrants. The mortality during the resettlement can be described by:
However, we limited ourselves to the case without migration dispersal and implied that mortality during migration is implicitly included in the total mortality, that is,
Let us consider the function in the form of Gaussian kernel [
66,
67] with a flat vertex and an inflection point. In the 2D case, its form is
The value of
c is equal to:
From the properties of the coupling function (
3), it follows that the value of
decreases faster for distant subpopulations than for subpopulations adjacent to the
th site, in contrast with the hyperbolic or exponential function. Thus, for any
m, the values of function (
3) are significantly less than
for sites located farther than
P from the
th site. Further, we will neglect the low values of
and assume that the subpopulations are uncoupled if they are separated from one another farther than
P. Given the symmetry of the Gaussian curve, the resettlement of individuals from the
th subpopulation is possible in the circular neighborhood of radius
P with blurred boundaries. This fact allows us to consider the parameter
P directly as the coupling radius for this neighborhood. The value of
c can be calculated only once as the sum of
for elements that fall into a circle of fixed radius
P and any point
to reduce computational time.
Based on the above assumptions, model (
2) is transformed to:
where function
M, with the additional condition:
, is necessary to discard the small values of
. In system (
4), the coefficient
m is taken out of the sum sign and function
. The normalization factor
c turns out to be a constant; does not depend on the coordinates
; and, for the fixed value of
P, can be found once using the formula
To exclude the boundary behavior in models (
4) and (
5), we use the periodic boundary condition, that is, mapping
and
, the same as in system (
2).
5. Spatio-Temporal Dynamics with Migration by Type of Dissipation
Let us consider the spatio-temporal regimes of the models (
4) and (
5) that are formed at different perturbations of the homogeneous distribution in metapopulation.
Figure 4 shows that for function (
3), the circular cluster is formed. However, the cluster size is always smaller than the coupling radius
P; this is because of the coupling strength that decreases with the distance from the initially perturbed subpopulation with coordinates
that perturb all of the subpopulations. In addition, the coupling strength drop leads to the fact that the rather distant coupled subpopulations (in the neighborhood of radius
P) are asynchronous and have different periods or phases of oscillations. For example,
Figure 4a shows that the cluster of transitional dynamics arises around the central cluster of chaotic coherent dynamics (designated as
) and the single solitary state (designated as
S). The solitary state is in place of the perturbed subpopulation. A group of transitional dynamics lies between the cluster of the fully synchronous regular dynamics (designated as 4) and the chaotic cluster
; this group is the ring of synchronous subpopulations with quasiperiodic dynamics (designated as
Q). For a simple unrealistic neighborhood (circle, square, or rhombus), such collective dynamical behavior is not possible, and a clear boundary always exists between the clusters.
The twofold increase in the initial perturbation leads to the synchronization of few subpopulations (
Figure 4b) compared with that in the weak perturbation (
Figure 4a). Here, cluster
arises in addition to cluster
. Moreover, the initially perturbed subpopulation is completely synchronous with neighbors that form the cluster
. Therefore, no solitary state exists. However, in this case, the collective dynamic of group
becomes less synchronous, and closer to spatio-temporal chaos (
on the right part of
Figure 4b).
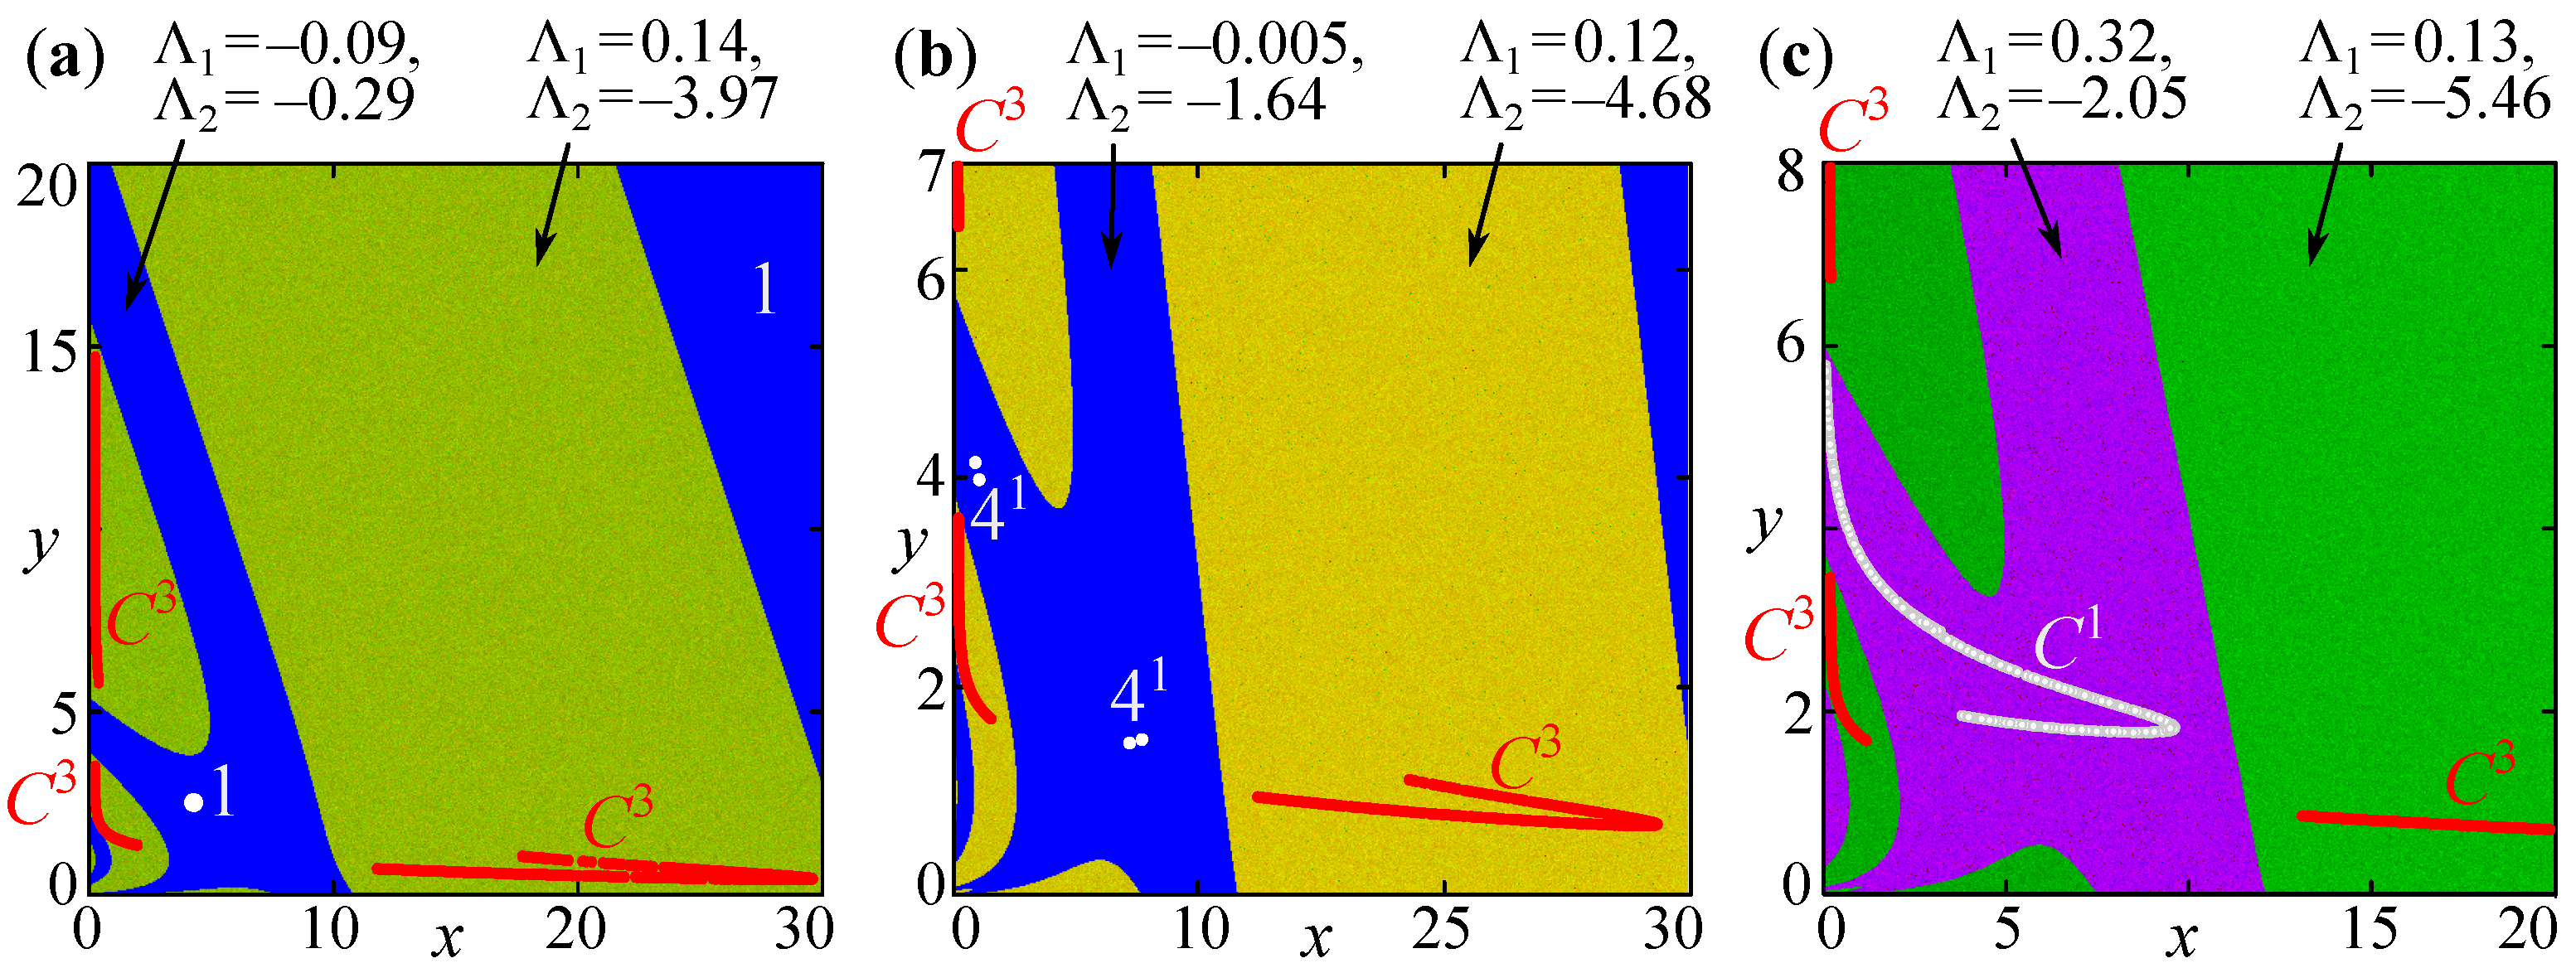
This type of collective behavior indicates that the population dynamics in different sites are absolutely irregular in time and space. Several methods can detect spatio-temporal chaos. Spatio-temporal chaos can be detected using several methods. For example, the number of positive Lyapunov exponents shows the degree of chaotization but does not show the relative position of chaotic oscillators on the lattice. Several positive exponents do not imply that the cluster appears with spatio-temporal chaos because the locations of such chaotic subpopulations are sufficiently far apart. Another method is the spatial return maps, showing how the dynamic of all oscillators or certain parts repeats itself after one moment of discrete time. If we found a rectangular cloud of scattered points on the map, then we can make an assertion about spatio-temporal chaos for all of the oscillators. We used a basic idea of this visual method and constructed similar maps not for different points of time but for different points of space at any time. As a result, we plotted the phase portraits for the pairs of oscillators as shown on the right side in
Figure 4b. These portraits show the mutual dynamics of some subpopulations from one cluster (usually pairs include immediate neighbors). If the points on the portrait are close to the diagonal line (where abscissa
u is equal to ordinate
v) or to the transverse direction (where
,
), the dynamics of the selected pair of oscillators are synchronous or coherent. If the points densely fill one or more of the rectangular 2D clouds, the dynamics of these subpopulations will be irregular and unrelated and correspond to spatio-temporal chaos for a separate group of oscillators. For example, the points of pair
from cluster
form the small cloud elongated along the diagonal line (
Figure 5d). At
, the points
from
fill the five 2D domains (
Figure 4b). In cluster designation, the superscript is the number of such clouds and corresponds to the number of attractor components. In this example, we have the hyperchaotic attractor because of several positive Lyapunov exponents. In
Figure 5, the letter
C stands for chaos “in time dynamic”, and number 4 stands for the synchronous stable periodic dynamic with a period equal to 4.
Figure 4 shows the spatio-temporal structures of models (
4) and (
5) combining the dynamic properties of the two above examples. To this end, we simultaneously perturbed two subpopulations with different strengths and with the same parameters as before:
,
,
,
,
,
, and
. As a result,
Figure 5 shows the pattern, including the dynamic properties of both, and contains new collective dynamical behavior.
Figure 5 shows that against the background of synchronous dynamics (cluster 4), two clusters arise around subpopulations with the coordinates
and
. These clusters merge and form the group of intersecting clusters after a series of transients (
Figure 5a,b). This group looks like a tilted nesting doll and includes at least four clusters with different types of population fluctuations. The letter
Q stands for transition dynamics (not only quasiperiodicity) between clusters with varying degrees of synchronization, namely, between the cluster with full synchronization, denoted as 4, and cluster
. This cluster contains the almost synchronous (coherent) fluctuations of a population size close to a 10-cycle. As a result, on the phase portrait there are ten small clouds of scattered points, pinned to the diagonal line (
Figure 5d). Finally, the cluster of solitary states arises between clusters
C and
, denoted as
S.
These simple examples demonstrate that, under certain conditions, the dynamics of two-aged-structured subpopulations exhibit various fluctuations at different points in space. This collective behavior occurs although they are all identical, and the displacement is possible in any direction; the coupling is long-range but non-global, and the area is homogeneous. Each of the detected types of subpopulation dynamics was observed for the model (
1) as one of its multistable regimes. Then, the main cause for the coexistence of various fluctuations in different patches is perturbations of initial conditions that push the sizes of different subpopulations in the attraction basins of the different regimes. As a result, the spatio-temporal dynamic is also multistable and combines the cluster synchronization of periodic fluctuations, the chaotic synchronization, the regime close to space–time chaos, and transition states such as the quasiperiodic dynamics.
6. Complex Spatial Structures under Random Initial Conditions
The next problem is how spatial structures change while simultaneously perturbing a large number of subpopulations by irregular impacts. We are interested in estimating the thresholds of impacts leading to the homogeneous or opposite inhomogeneous spatial distribution of a metapopulation or to cluster synchronization when various clusters show different types of dynamics (periodic and chaotic). Generally, we can describe the irregular initial impacts as the simultaneous removing or adding of individuals at random. Additionally, the magnitude of impact or perturbation is random.
Similar to past examples, we assume that the younger age class is initially homogeneous, with a size
at any point in space. Meanwhile, the initially adult age class has random population sizes at every site with the number
. Such initial conditions can be simply obtained using the generator of uniform distribution random variables of the form
, where
and
are the minimum (bias factor) and maximum initial size of adult individuals and
is a scale factor. To exclude the possible repeatability of results caused by a poor-quality random generator, we used the counter-based random number generator [
68].
Under these random initial conditions, the spatial structures and dynamics of individual elements are still determined by the shape of the subpopulation neighborhoods in models (
2) or (
4) and (
5). Such initial conditions rarely lead to highly symmetrical patterns, as shown in previous examples. The square and diamond-shaped neighborhood leads to angular patterns with many random kinks. However, the patterns with smooth and symmetrical outlines, such as spots or stripes of different locations and sizes, are possible only for the circular neighborhood in model (
2) or the neighborhood by function (
3), and for a strong strength and radius of coupling (
Figure 6 and
Figure 7).
The random initial conditions cause the spatial structures with many solitary states. Predictably, the location of solitary states is also random but does not correlate with the initial distribution. Under certain conditions, full or cluster synchronization of the population dynamics occurs in the neighborhood of a solitary state. The dynamics of these clusters can be a chaotic or periodic, corresponding to a possible multistable regime in model (
1). As a result, the cluster of solitary states has a larger amplitude of oscillations than surrounding subpopulations with another dynamic type. These clusters may define a typical pattern of space–time dynamics. However, a completely different situation is possible when clusters are based on only one of the alternative multistable states. This phenomenon occurs for a small bias and a scale factor of uniformly distributed random initial conditions, as well as for a different ratio of parameters that determines the influence of younger age class on the density-dependent regulation of birth. For example,
Figure 6a shows the pattern with concentric circles and only oscillations with a period equal to 3 for
. However, with the same parameters but a considerably large range of random initial conditions, we observe several types of dynamics of the local population in the models (
4) and (
5).
Figure 6b shows that the solitary states and the small clusters have the chaotic synchronization close to the 3-cycle and by strong bursts (
), whereas the surrounding subpopulations with weak fluctuations show irregular dynamics in time and space (
).
The patterns shown in
Figure 6 and
Figure 7 are usually possible for strong coupling. When the coupling strength or radius is reduced, these spatial structures quickly collapse, and the spatio-temporal regimes include many incoherent oscillations with various periods and amplitudes of subpopulation fluctuations. Given that we use a generator of random initial conditions, the space–time dynamics are multistable so that one set of random initial conditions leads to the “pure” regular patterns, but for another set, the dynamics are irregular and contain many solitary states. However, it is more important that the probability of regular patterns decreases with a drop in coupling strength or radius. Therefore, the patterns from
Figure 6 and
Figure 7 formed most often (in more than half of the cases) and were structurally stable with the parameters of random initial conditions shown in the figures. The only change in those examples was the location and size of clusters for different sets of initial conditions with the same bias and scale factor.
However, the character of the individual and collective dynamics, and the type of the most frequent spatial structures determined by the values of demographic parameters and by the magnitude of initial perturbations, depend on the parameters
and
. We previously studied a similar property for model (
2) with a 1D habitat (
,
) [
10]. In case of the 2D habitat in this work (
,
) with
and a large magnitude of random initial conditions, models (
4) and (
5) produce space–time regimes that combine several types of single population dynamics. These regimes are clusters of almost synchronous (
) oscillations in the form of small cells or spots surrounded by subpopulations with coherent dynamics (
), as well as many solitary states that introduce noise in regular patterns, where
and
are the result of 5- and 4-cycle bifurcations. The decrease in the magnitude of random initial conditions leads to the following changes in the spots: they will increase in size, their shape will become distorted, and the dynamics will become more diverse in terms of clusters. For example,
Figure 6d shows that thin borders (
and
) from 1 to 5 patches exist between clusters with a large amplitude (
) and weak fluctuations (4-cycle). On these borders, the population sizes are approximately equal, and the dynamics are synchronous, whereas in the center, the population fluctuations (
) strongly decrease. In the first case (
Figure 6c), the spatial dynamics of each group of clusters appears independent in time (incoherent). However, the population size slightly increases at the cluster boundaries. For example, after the population density declines in cluster
, the population density increases in group
and vice versa. In the second case, the dynamics in different patches are less coupled, as follows. The perturbation from the central cluster
extends to the boundary subpopulations from clusters
and
and dissipates through the transitional spatial dynamics of
and
and the interference of waves with the background synchronous 4-cycles (
Figure 6d).
The spatial structures for the sufficiently small scale and bias factor of the random initial conditions (
) are as simple as possible, except for complete synchronization. Patterns arise with a few of the spots or stripes represented by the almost coherent dynamics of subpopulations throughout the area and a few solitary states.
Figure 7 shows the examples of such patterns, which are the most typical for models (
4) and (
5) because we found them in over than 90% of numerical experiments given initial conditions and coupling parameters. It is interesting to follow how the sizes and shapes of the spots change.
Figure 7a–c show when the coupling parameters change, the spots crush into parts, or vice versa, and several spots merge, stretch into stripes, or become curved (
Figure 7d,e).
Under the considered initial conditions (
), the dynamics in spots or stripes are usually based on only one of the possible multistable states of the single population (model (
1)). These dynamics are the oscillations close to the 4-cycles, i.e., we find four clouds of scattered points in the phase portrait or the spatial return map. Another multistable state of model (
1) corresponds to the appearance of solitary states whose fluctuations are close to 3-cycle (3 clouds) with a large amplitude (see
Figure 1).
Figure 7 shows that for a strong coupling, the number of the solitary states
is small, but a decrease in the coupling strength or radius leads to an increase in their number (populations with a burst of size). They often begin to synchronize and form clusters (
Figure 7e). The spatio-temporal dynamics again contain two or more types of clusters (in
Figure 7e, they are labeled as
, 4, and
Q) similar to the above cases of the large scale and bias factor of random initial conditions or special non-random initial conditions. A study of many initial conditions (for a pair of coupling parameters
P and
m we generated 100 sets of
) showed the following results. Despite the spots or stripes or the homogeneous distribution of subpopulations in the pattern (these events are equally probable), the subpopulations with a single burst (solitary state) were registered in 99% of cases.
7. Conclusions
In this paper, we propose a mathematical model of the spatial dynamics of two-age-structured populations coupled by migration (age-structured metapopulation). The model is the non-locally coupled 2D map lattice, where the map is the discrete time model of the population dynamics, and the coupling is the long-range migration described by the nonlinear function of subpopulation coordinates. The main feature of the long-range migration is that individual displacement from each subpopulation is possible only in the subpopulations from a certain neighborhood and the migrant flow rate decreases with increasing distance between them.
Note that the proposed dynamic model has certain limitations imposed on the simulated population. First, we consider a rapidly growing population that seeks to fill the entire available area as densely as possible in all directions. Second, we assume that the resources in each patch are sufficient for further reproduction and migration. As a result, due to long-range resettlement, individuals from a single site will quickly disperse throughout the entire area in a relatively short time. Third, the fact of moving does not depend on whether there are enough resources in the new site. Individuals migrate “blindly” without knowledge of their destination, and density-dependent factors will limit the birth rate if the site is overpopulated. This population behavior is typical for a few species, which use the all available resources most efficiently and are limited by the population densities.
We found that in the spatio-temporal dynamic of the model, the most regular spatial structures (patterns), except for the homogeneous distribution (complete synchronous), include the groups or clusters of subpopulations with synchronous (coherent) fluctuations appearing during the spatial synchronization of the initially perturbed subpopulations with absolutely inhomogeneous random distribution. For the 2D range, the shape and size of clusters, to a certain extent, repeat the shape and size of the neighborhood where there is a frequent exchange of migrants. As a result, the clusters appear as cells, spots, or stripes. In terms of population dynamics, the spots correspond to the synchronization of the dynamics of relatively close subpopulations in a certain round neighborhood. The stripes stretched across the entire area point to the fact that the spots line up and merge. Thus, the fairly distanced subpopulations synchronize with each other in some directions, i.e., the stripes can be considered as certain migration routes with the most intense flow of individuals. Regardless of the cluster shape, the spots or stripes form the groups that are indistinguishable from local populations. We found that the spots evolve by increasing in number, accompanied by a decrease in the size or merging several spots and forming a stripe. Afterward, the stripes twist and become spirals, concentric rings, or mosaic patterns.
It surprised us that under certain conditions in such metapopulations, the oscillations in the subpopulation from adjacent clusters differ not only in phase, when the dynamics of all of the subpopulations are coherent, but in amplitudes and periods of oscillations when clusters are asynchronous. The nonlinear coupling function describes the more strongly coupled subpopulations in the center of spot than those on the border. Therefore, the degree of synchronization in the spot usually falls when moving from the center to the edge of cluster. As a result, the spot often includes the subpopulations with different magnitudes of oscillations and is surrounded by the single asynchronous populations. These states are known as amplitude and phase chimeras [
16,
39,
43]. The type of dynamics in clusters, in a certain way, corresponds to the multistable regimes of the single two-age-structured population (a 2D nonlinear map). For example, one cluster fluctuates with a period equal to 4, another may exhibit chaotic oscillations, or periods of clusters oscillations are not multiple to each other, or clusters with transitional types of dynamics combine different dynamical regimes.
However, random perturbations in population size can lead to a solitary state. This state has a burst or outbreak in population size of single subpopulations and by a random location [
40,
41,
44], in contrast to the chimera state confined to clusters with regular location. Such states most likely appeared because of the multistability of the local population and the high sensitivity to small perturbations in initial conditions. However, a chimera state is a kind of transitional phase from coherent to incoherent dynamics accompanied by the appearance of single non-synchronous oscillators, which crush clusters into smaller pieces [
34,
37,
38,
44]. Solitary states appear spontaneously even for a strong coupling. For a weaker coupling, their number grows, and they are increasingly synchronized with each other, forming clusters of solitary states. The solitary states perfectly correspond to the term “epidemics” or “outbreak of mass reproduction” of insect-pest, for example. Like solitary states, during this environmental phenomenon, there is a sudden increase in the sizes of single subpopulations and a subsequent sharp decline in their numbers, whereas surrounding populations are sustainable [
69,
70]. Meanwhile, the solitary state in one patch is coherent with an outbreak in others, which tells us how to predict such a phenomenon.
The direction of further study can proceed in several ways. First, by modifying the model, aimed at eliminating the noted limitations. For example, it is logical to include in the coupling function the dependence on the densities of receiving sites, additionally to the distance dependency. As a result, some direction of migration will appear during resettlement, which could lead to interesting spatio-temporal effects. Second, it is necessary to develop methods for studying the spatio-temporal dynamics and types of patterns under the variation of demographic and coupling parameters. We have briefly shown one of these methods in the last paper section. It explores the analysis of the probability of the formation of one or another type of spatio-temporal dynamic under random initial conditions. This requires the calculation of various quantitative indexes of the collective dynamics (synchronization error, spatial autocorrelation function, order parameter, etc.). Third, an analytical study of diffusion-driven instability (Turing–Hopf bifurcation), successfully applying for systems of coupled two-dimensional maps [
31,
32], will significantly supplement the simulation results. As a result, it is possible to predict the type of spatio-temporal dynamic and analyze the reasons for the heterogeneous spatial distribution in population systems.


