Article

Risk Evaluation of Elevators Based on Fuzzy Theory and Machine Learning Algorithms

1
School of Resources and Safety Engineering, Central South University, Changsha 410083, China
2
School of Mathematics and Statistics, Qinghai Normal University, Xining 810016, China
*
Author to whom correspondence should be addressed.
Mathematics 2024, 12(1), 113; https://doi.org/10.3390/math12010113
Submission received: 29 November 2023 / Revised: 24 December 2023 / Accepted: 27 December 2023 / Published: 28 December 2023

Abstract

:
Elevators have become an integral part of modern buildings, and technological advances have enabled the monitoring of their operational status through sensor technology. In response to the development of the elevator industry and the need for practical elevator operation risk evaluation, this paper proposes an elevator risk evaluation method based on fuzzy theory and machine learning methods. The method begins by establishing an elevator operation risk evaluation index system. The traditional fuzzy comprehensive evaluation method is then employed to evaluate the risk levels of the 50 elevators studied. The collected index data and labels (fuzzy comprehensive evaluation results) are used as inputs to train the support vector machine (SVM) model. To optimize the SVM model, the maximum information coefficient method, enhanced by the correlation-based feature selection (MIC-CFS) method, is employed to select features for the index input to the SVM model. The improved gray wolf algorithm (IGWO) method optimizes the SVM. Finally, the model’s performance is verified using new index data. The experimental results demonstrate that introducing machine learning methods for elevator risk evaluation saves time and effort while providing good accuracy compared to the traditional expert evaluation method. The optimization of the SVM model by IGWO and feature selection by the MIC-CFS method results in a more concise SVM model that converges faster during training, exhibits better stability, and achieves higher accuracy.

1. Introduction

Rapid economic development has led to a growing concern about elevators. In recent years, the demand for elevators has constantly increased, with the number increasing from 359.85 million in 2014 to 964.46 million in 2022 in China, as illustrated in Figure 1 [1]. Elevators, as a modern architectural feature, provide convenience and happiness to residents but also pose a threat to public safety during operation. According to statistics from the General Administration of Quality Supervision, Inspection and Quarantine of the People’s Republic of China (AQSIQ), 391 elevator accidents occurred between 2014 and 2021, resulting in an average of 31.11 deaths per year [1]. The occurrence of elevator accidents and accompanying casualties has harmed the development of the economy and social order. Therefore, adopting methods to predict the risks during elevator operations is imperative to minimize the damage from accidents.
Numerous studies have been conducted in elevator risk assessment, focusing on three main areas: (1) Evaluation methods for qualitative or quantitative safety assessment of elevator risks. (2) Early warning and diagnosis of elevator failures. (3) Elevator dispatch management risks. Furthermore, most of these studies on qualitative or quantitative evaluation methods of elevator risk have primarily focused on risk evaluation methods that rely on expert knowledge to assess elevator risk. Early elevator risk evaluations primarily considered the structure of the elevator system. Kolowrocki (2001) calculated the safe operation value of the elevator by analyzing and studying the components of each system of the elevator machine and deriving the reliability function, which ultimately determines the risk interval for the safe operation of the elevator [2]. Bennetts et al. (2005) developed a new elevator force model and simulated the elevator load-bearing system, resulting in a series of assessments of the overall risk of elevators [3]. Yost et al. (2006) suggested that both the initial parameters of the elevator design and the users’ needs should be considered in the elevator evaluation process to maximize elevator performance [4]. Aneziris et al. (2008) introduced the method of quantitative analysis to the evaluation level of elevator safety accidents to develop a suitable evaluation model accordingly [5].
Scholars have introduced the application of fuzzy mathematics in elevator evaluation due to the complexity of elevator systems. Zhang et al. (2018) developed an evaluation index system to assess equipment reliability from multiple perspectives, including people, management, equipment, and the environment. They constructed an improved TOPSIS evaluation model that combined gray number theory with the TOPSIS method [6]. By combining material element theory and other methods, Sun et al. (2020) proposed a scalable fuzzy integrated evaluation model for elevator safety [7]. Gholami et al. (2022) utilized fuzzy hierarchical analysis to evaluate different maintenance methods as a decision-making reference for selecting the best elevator maintenance strategy [8]. Niu et al. (2022) proposed a combined weighting method with the maximum deviation sum of squares as the optimization objective to evaluate the operational performance of elevators by monitoring their operational signals [9]. These studies aim to eliminate subjective arbitrariness or reduce the time and resources required for evaluation by human experts. However, in the current industry, there is a lack of uniform evaluation standards and diverse evaluation methods. Additionally, experienced evaluation experts cannot meet the increasing demand for elevator evaluation.
With the advancement of computer technology, scholars have introduced machine learning methods into the risk evaluation of complex industrial systems, providing new insights to address the current challenges in elevator risk evaluation. Zhang et al. (2009) investigated the risk evaluation of elevators using F-AHP and EBP neural networks, leading to an improvement in the speed of evaluation and accuracy of results [10]. Guo et al. (2019) proposed a machine-learning-based evaluation method for elevator safety management by considering the importance and impact of each factor affecting elevator safety, utilizing table analysis and fuzzy mathematical theory [11]. Yu et al. (2020) combined big data technology with deep learning technology, proposed a method of elevator fault monitoring based on the Spark platform, and constructed an elevator fault warning model. This research enables real-time effective monitoring of the elevator operation status and fault type determination [12]. Chai et al. (2021) proposed a non-intrusive artificial intelligence (AI)-based diagnostic system that employs a Multivariate Long- and Short-Term Memory Fully Convolutional Network (MLSTM-FCN) to learn and analyze measurement signals from a non-intrusive inspection system of an elevator. This system can effectively detect faults and predict potential failures [13]. However, the research on machine learning applied to elevator risk evaluation is still relatively limited, with a focus on elevator fault diagnosis and a lack of an evaluation method for the overall risk of elevators. Therefore, establishing a reasonable, scientific, and simple evaluation system based on data collected by sensors and designing a risk evaluation method that meets the requirements of the IoT era in order to efficiently and accurately evaluate the operational risk of elevators has become an urgent problem to be solved.
The remainder of this paper is structured as follows: Section 2 delves into the initial development of a system of indicators for assessing elevator hazards. Section 3 details the labeling process for training data through a fuzzy, comprehensive assessment of 50 elevators. In Section 4, we demonstrate the utilization of collected data to train an SVM model and optimize it using the IGWO and the MIC-CFS. Finally, we summarize the model outcomes and discuss their correlation to reality and the method’s limitations.

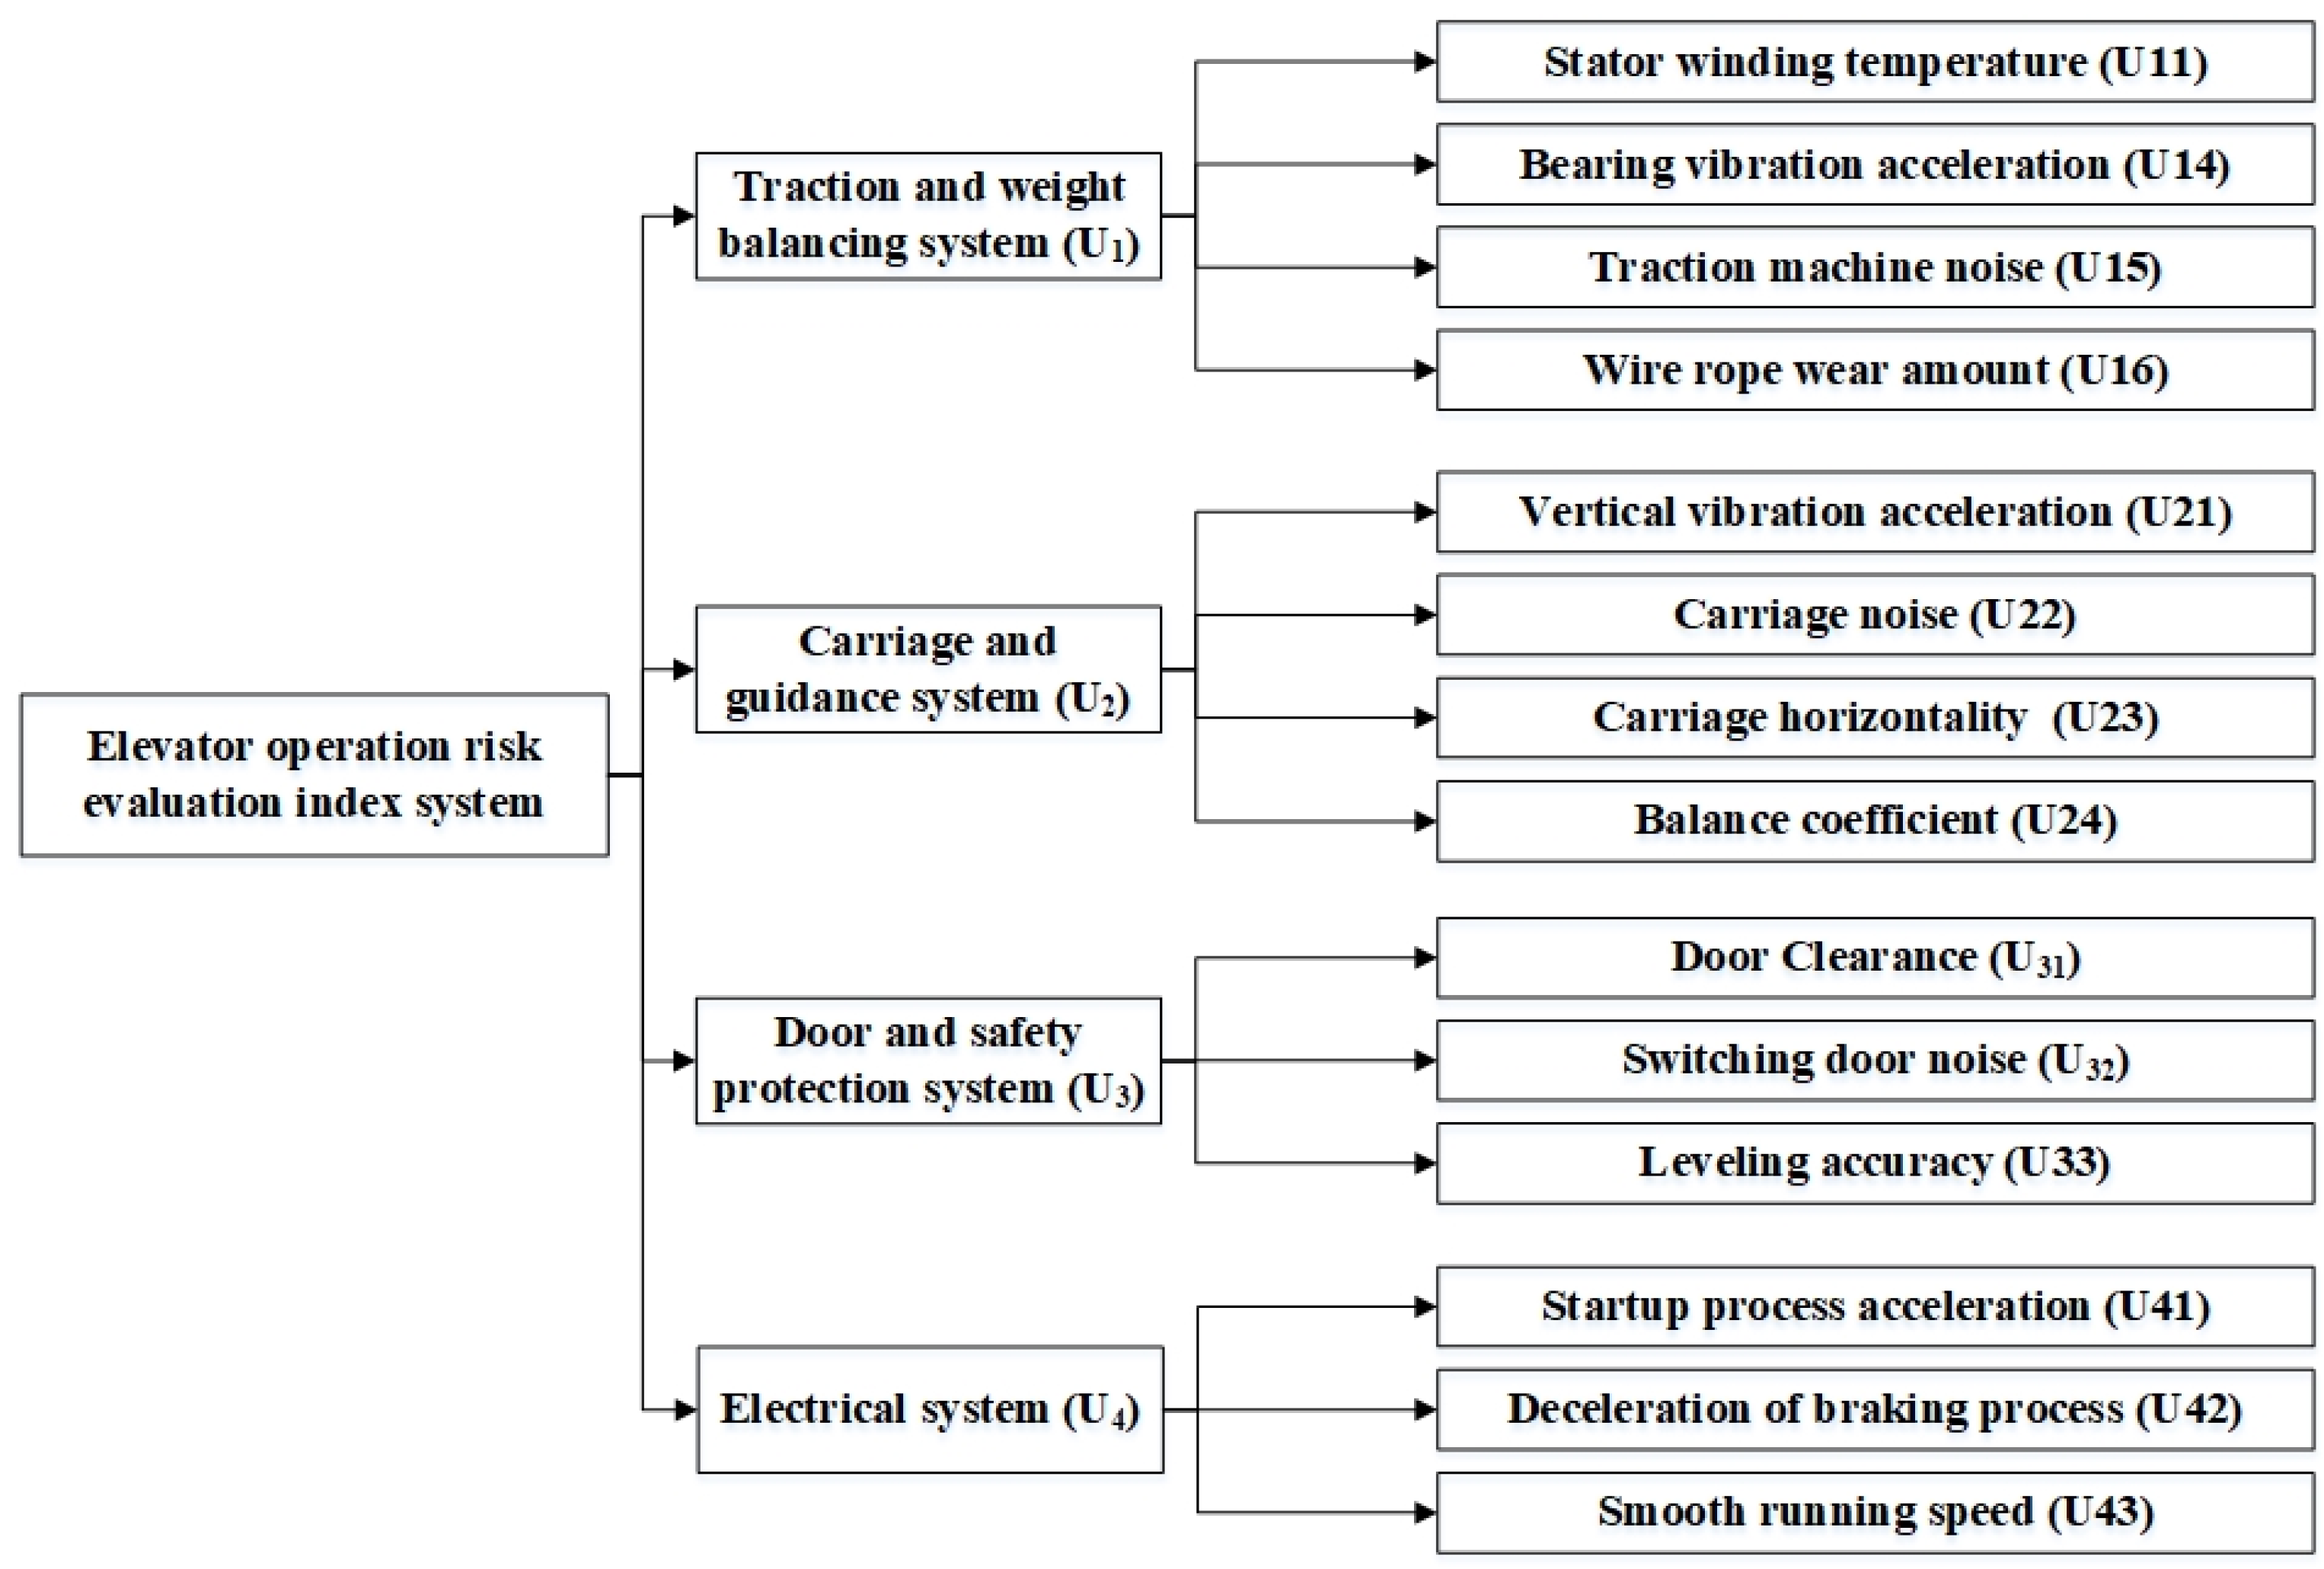
2. Elevator Operation Risk Evaluation Index System

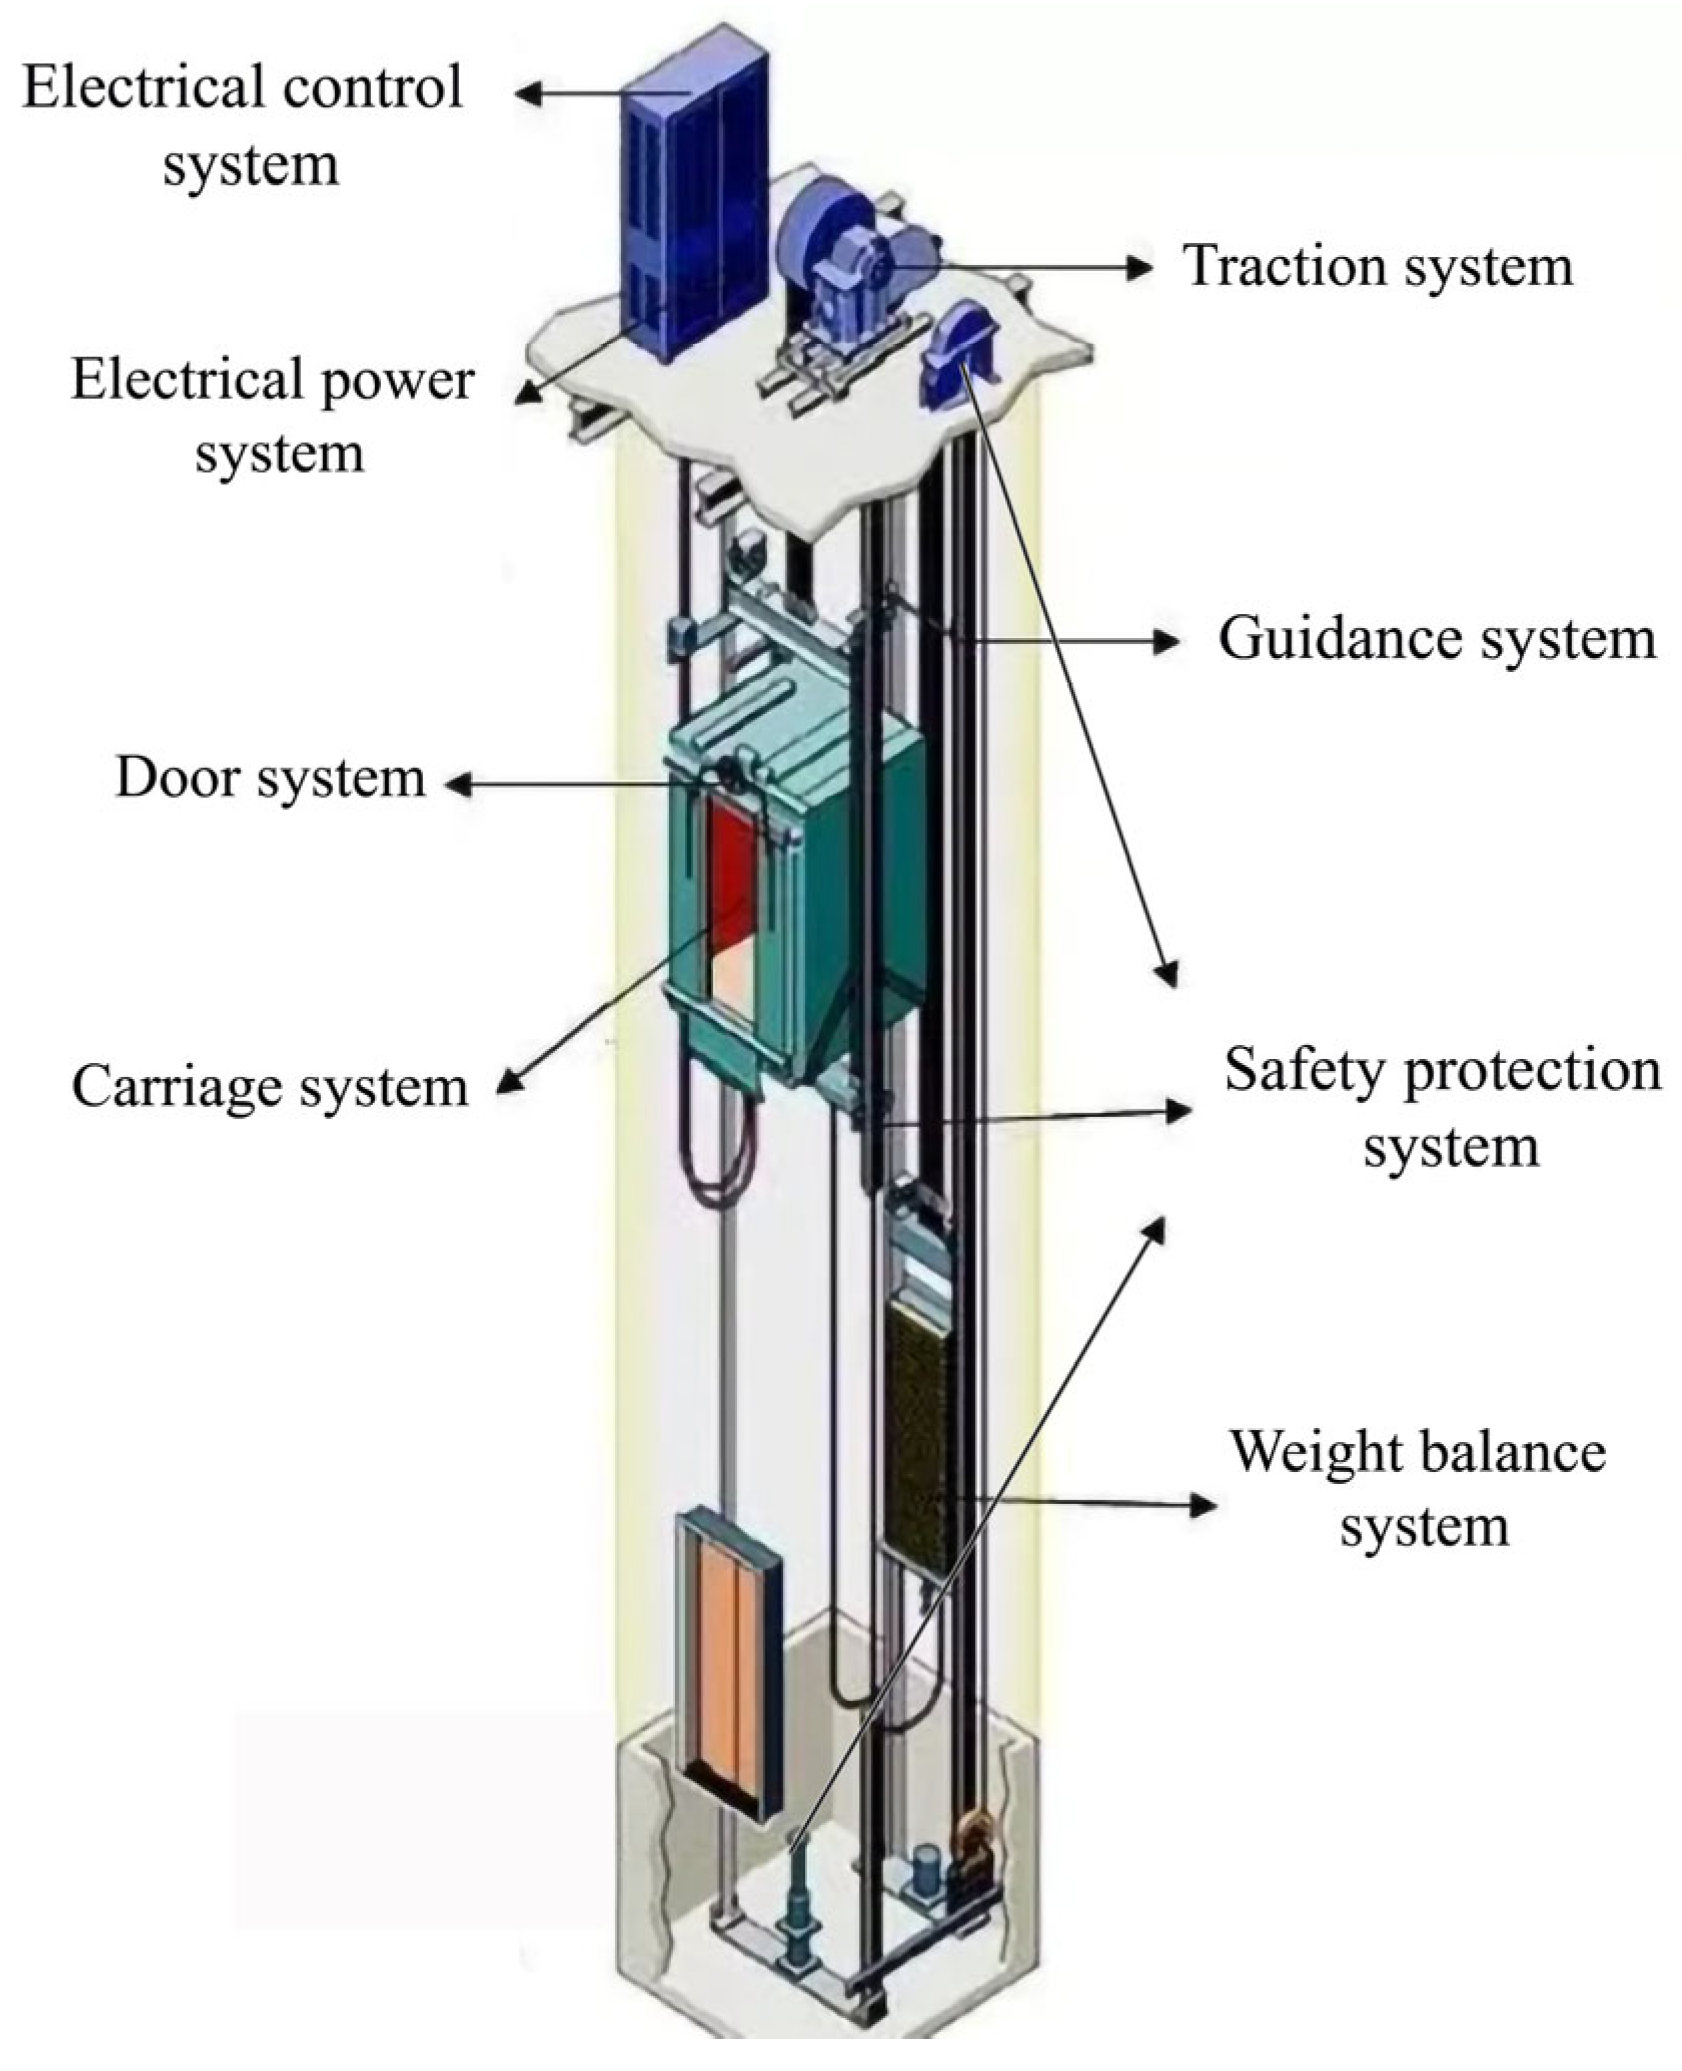
2.1. The Structure of Elevator

Figure 2 illustrates the structure of a traction elevator. Its operational principle involves controlling the reducer via the control system to regulate the torque generated between the traction sheave and the wire rope, thereby powering the elevator and enabling it to move vertically. The elevator comprises eight sub-systems, each functioning independently yet cooperatively to ensure safe and reliable operation.

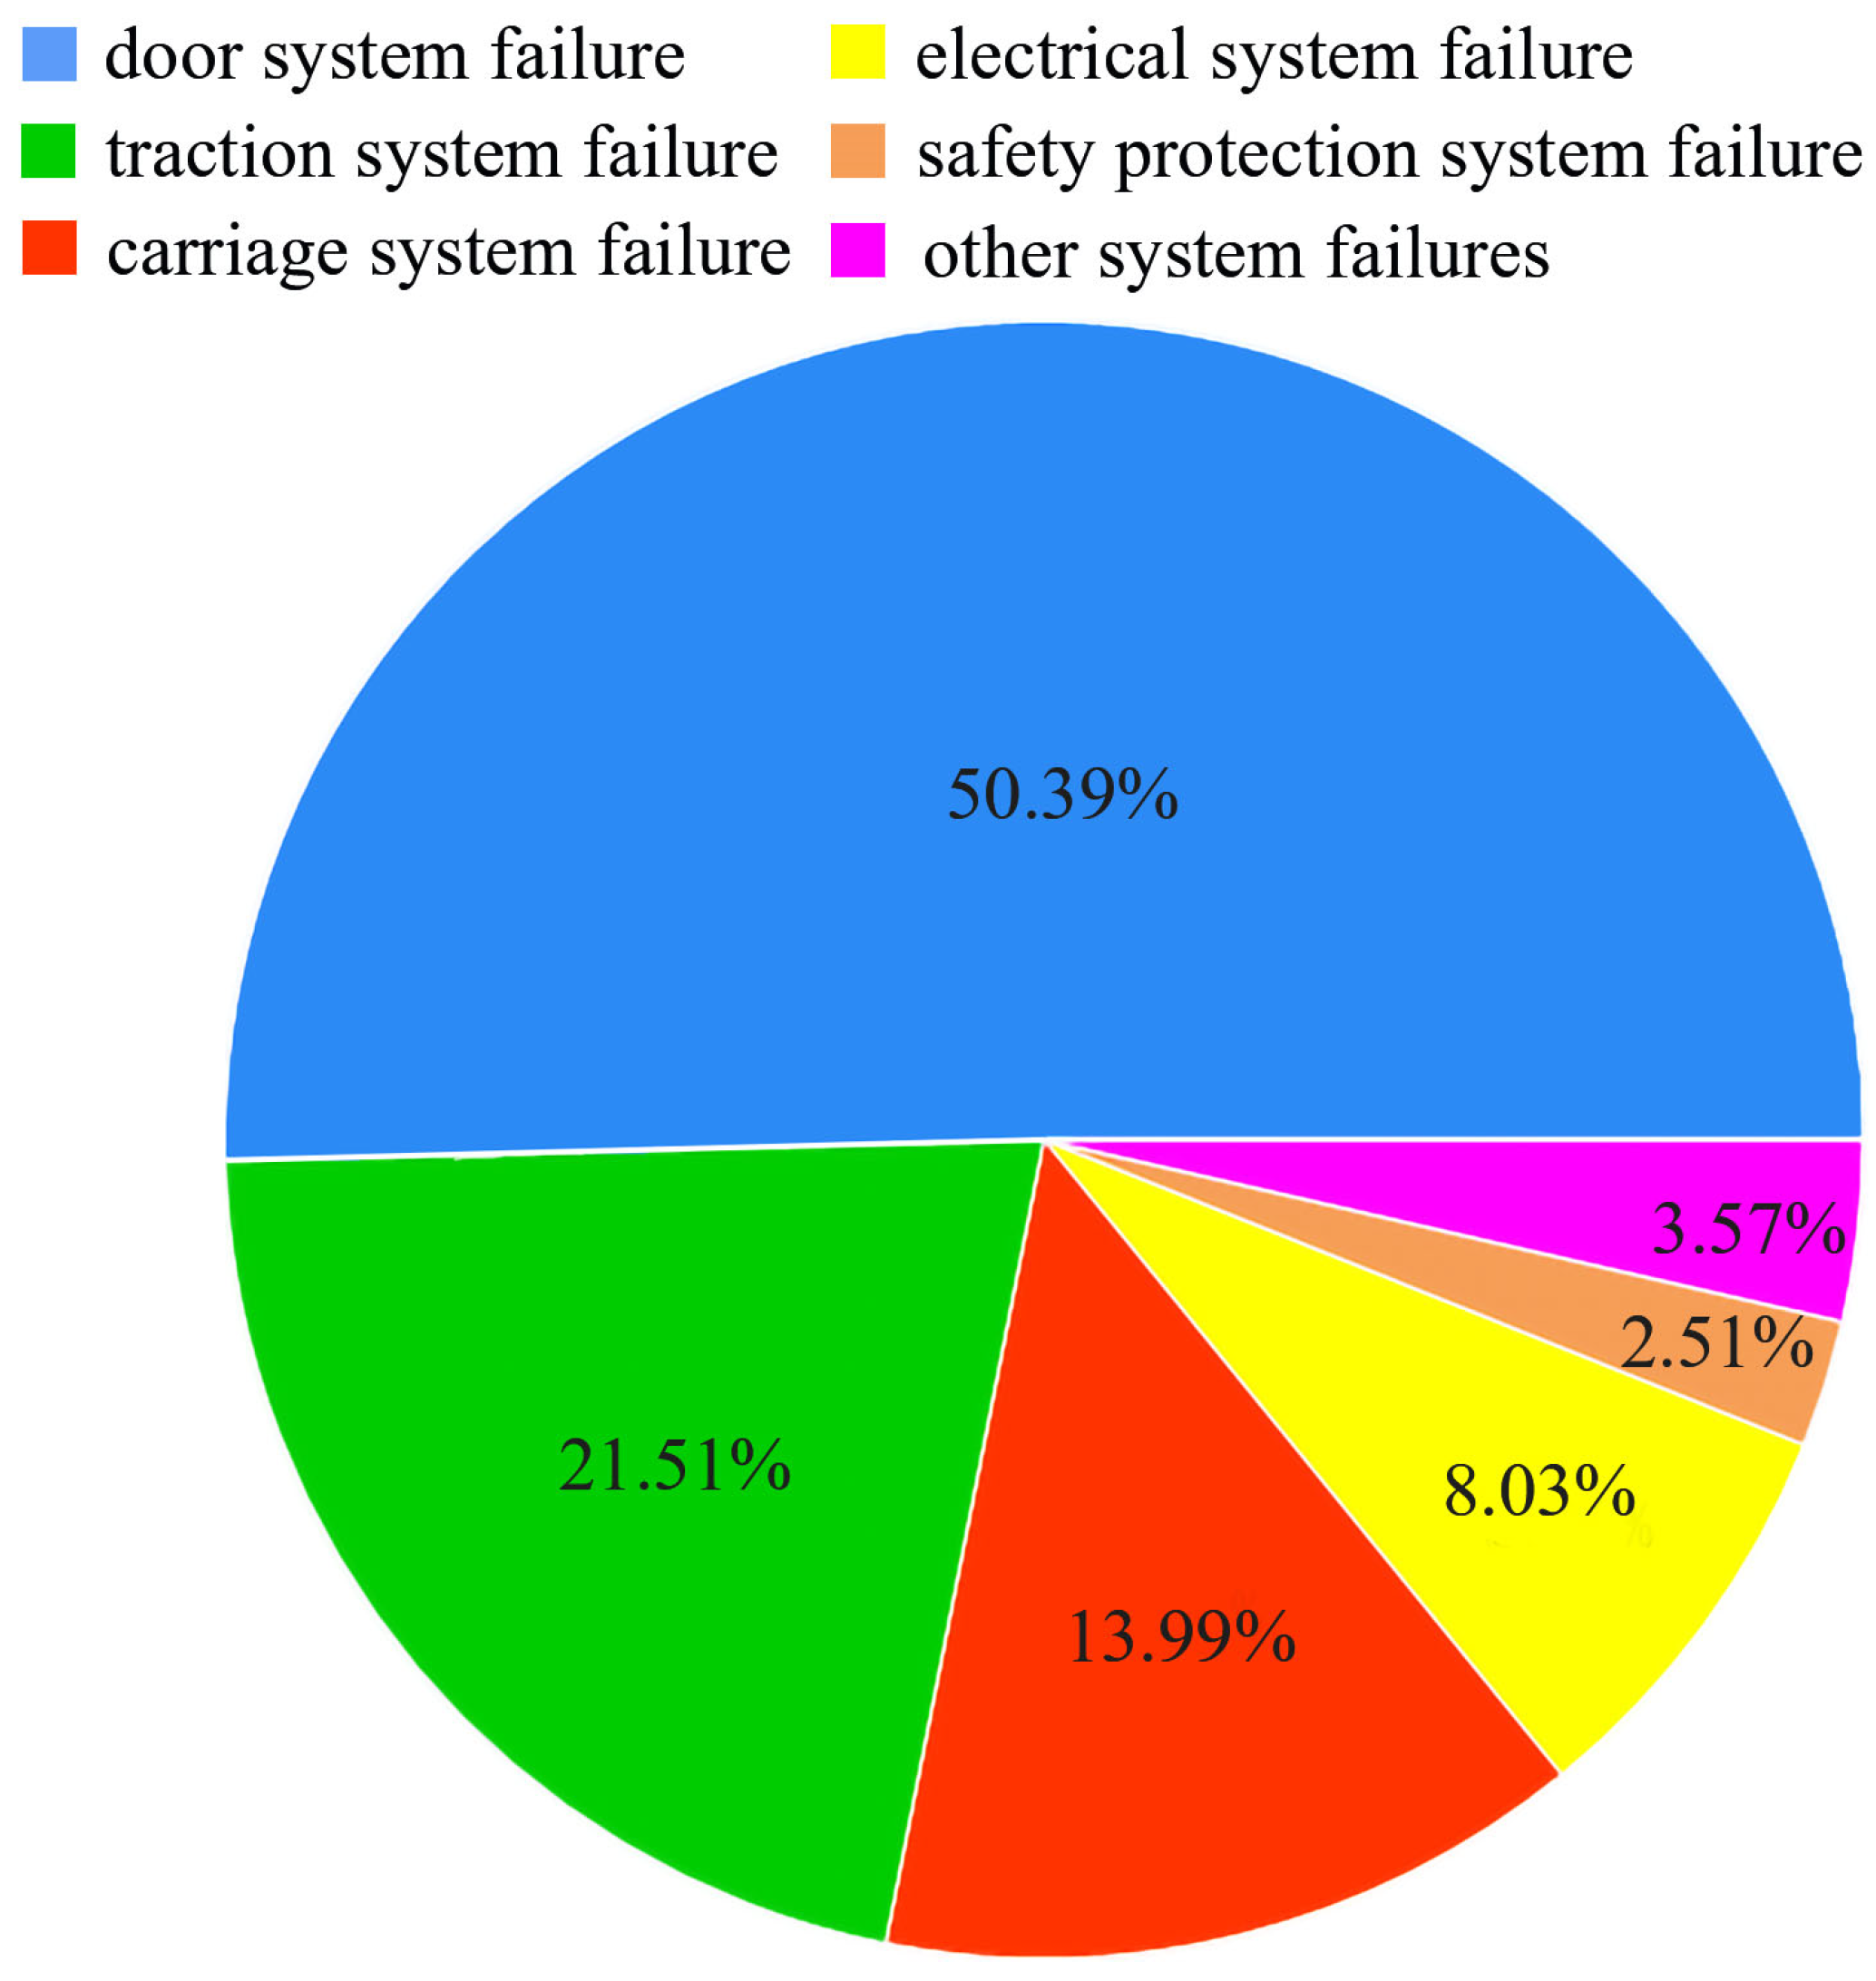
2.2. Statistical Analysis of Elevator Failures

The 96366 Elevator Emergency Disposal Center conducted a statistical analysis of elevator failures in Changsha, Hunan, China, in 2019. A total of 7075 elevator failures were recorded, with the fault location classification illustrated in Figure 3.
Statistics indicate that the primary categories of elevator failures encompass door system faults, traction system faults, carriage system faults, and electrical system faults, which merit particular attention.

2.3. Analysis of Elevator Failure Mechanisms

2.3.1. Traction System and Weight Balance System

The function of the traction system is to provide power for the elevator carriage, which is comprised of a steel wire rope, traction machine, reversed sheave, and guide wheel. The function of the weight balance system is to keep the weight difference between the counterweight and the carriage within an appropriate range across different states, primarily consisting of the counterweight, accompanying cable, and weight compensation device. As the traction and weight balance systems are directly connected, they are analyzed as a single unit for failure mechanisms. Combined with fault statistics, system failures mainly occur in the traction machine and wire rope. The primary failure causes are analyzed as follows:
(1)
High vibration of the traction machine. The vibration intensity is excessively high, which can easily result in the loosening of traction machine bolts. This, in turn, causes the worm shaft and motor axis to deviate from their intended alignment, leading to asynchronous motion during the traction machine’s startup or shutdown. This asynchronous motion manifests as a shaking of the traction machine while in operation, ultimately resulting in the emergence of faults.
(2)
The temperature of the traction machine is excessively high. During operation, an abnormal increase in the temperature of the traction machine may result in the expansion of the main machine’s gear, causing a change in the eccentric distance. Meanwhile, as the temperature rises, the lubricating oil inside the traction machine undergoes chemical changes, leading to decreased concentration. This harms the traction machine and increases the friction, further intensifying heat generation.
(3)
Noise abnormalities in traction machines. The occurrence of noise anomalies in traction machines is often attributed to various factors. One significant factor is the wear or deformation of the traction machine or gearbox bearings. Additionally, changes in gear size can also contribute to noise anomalies.
(4)
Abnormal shaking of the carriage. An axial movement of the worm shaft of the traction motor leads to a coaxially over-difference between the knuckle diameter and aperture. This radial shift, in turn, causes the carriage to shake.
(5)
Wire rope wears seriously. The prolonged operation of an elevator results in significant wire rope wear, which is further compounded by the weight difference between the two sides of the guide wheel. This wear may lead to wire rope fracture if it exceeds acceptable limits.
Through the above analysis, it is evident that the primary signs of failure within the traction system and weight balance system include vibrations within the traction machine, an excessively high temperature of the traction machine, excessive noise emissions from the traction machine, abnormal shaking of the carriage, and severe wear of the wire rope. Therefore, these factors should be considered when selecting elevator risk evaluation indexes.

2.3.2. Carriage System and Guidance System

The elevator carriage, a component for loading people or goods, primarily comprises the carriage frame, carriage wall, carriage top, and carriage door. The elevator guidance system, composed of guide rails and shoes, enables the carriage to execute smooth up-and-down movements along the guide rails. Since the guidance system is closely connected with the carriage system, they are analyzed as an integrated unit for failure mechanisms. The primary causes of failure are as follows:
(1)
The elevator carriage noise is serious. During the operational process, if the guide shoe wear exceeds the standard, it will expand the working gap. This, in turn, leads to intense friction between the metal piece of the shoe head and the guide rail, generating a noticeable noise. Additionally, if the bolt securing the anti-rope wheel becomes loose, it causes the deep groove to vibrate excessively. This augmented movement intensifies the wear on the bearings and, in extreme cases, may result in a broken shaft. Throughout this process, there is a distinct and audible noise.
(2)
The elevator carriage shakes abnormally. If the guide shoe wear exceeds the standard, it can expand the working gap, resulting in abnormal shaking of the carriage during operation. Additionally, deviations in the guide system’s verticality, spacing, and integration from the specified tolerances can cause changes in the horizontality of the carriage floor, ultimately generating vibrations.
(3)
The acceleration of the elevator’s up-and-down movement is unacceptably high. If there is an issue with the balance coefficient of the elevator, such as a lighter counterweight, it can result in a significant feeling of weightlessness for passengers when the fully loaded carriage is moving downward. Conversely, a heavier counterweight can lead to a significant feeling of being overweight when the elevator is ascending, creating an uncomfortable and potentially unsafe experience for passengers.
Through the above analysis, it is evident that the primary signs of failure within the carriage system and guidance system are the acceleration of vibration in both the vertical and horizontal directions of the carriage, the noise emitted by the carriage, the balance coefficient, and the horizontality of the carriage (measuring the degree of tilt). Therefore, these factors should be considered when selecting elevator risk evaluation indexes.

2.3.3. Door System and Safety Protection System

The door system, composed primarily of carriage doors and hall doors, is designed to ensure the safety of passengers and goods. The carriage door is installed on the elevator carriage, and the hall door is located at the entrance of the docked floor. The elevator’s safety protection system incorporates components such as the speed limiter, safety clamp, buffer, electrical interlocking device for the carriage door lock, and alarm device. Both the safety protection system and the door system are essential in ensuring passenger safety during elevator operation or malfunction, and they are analyzed as integrated units for the failure mechanism. The primary causes of failure are as follows:
(1)
The elevator door gap is vast, resulting in the lock hook being misaligned and not fully engaging the door lock contact when the elevator is closed. Alternatively, the nut may become loose during the closing of the door, leading to a failure of the lock head and nut to mate securely. This condition causes the lock head to protrude and engage the floor prematurely, leading to an elevator malfunction.
(2)
An abnormal noise is emitted when the elevator opens and closes the door. This noise is attributed to an elevator automatic closing device malfunction or an abnormality in the wire rope, resulting in excessive tension. Additionally, severe wear on the door slider can produce friction or impact sounds.
Through the above analysis, it is evident that the factors related to the failure of such systems include door clearance, opening and closing noise, and leveling accuracy (the vertical height difference between the floor plane of the carriage and the architectural flooring). Therefore, these factors should be considered when selecting the elevator risk evaluation indexes.

2.3.4. Electrical Control System and Electrical Power Systems

The elevator’s electrical control system regulates the entire operational process of the elevator. The electrical power system, consisting primarily of a traction machine, speed feedback device, and speed adjustment device, controls the elevator’s operational speed. These two systems combine to form the electrical system of the elevator, and thus, they are analyzed as an integrated unit for the failure mechanism. The primary causes of failure are analyzed as follows:
(1)
Long-term service of the elevator can result in the aging of electrical components, the accumulation of moisture within internal parts due to failed sealing measures, and broken line insulation layers, all of which can contribute to short-circuit faults within the electrical system.
(2)
The malfunction of safety devices in the electrical system, such as the safety circuit and safety interlocking circuit, prevents the elevator from operating correctly.
(3)
The relays and contactors within the electrical control cabinet are short-circuited, resulting in the disconnection of the electrical system.
Given that most of the faults within the electrical system originate from internal components, traditional detection methods cannot comprehensively evaluate their status. However, these internal component issues will indirectly manifest through observable characteristics such as elevator acceleration, deceleration during startup and shutdown, and consistent speed during operation. Therefore, these factors should be integrated into the evaluation index for assessing elevator operation risk.

2.4. Elevator Operation Risk Evaluation Index System

Using mathematical statistics and elevator failure mechanism analysis, combined with the research content of experts in the field [14,15], the initial establishment of the elevator operation risk evaluation index system is presented in Table 1.

3. Fuzzy Integrated Evaluation

3.1. Security Level Classification

Combining the ALARP principle and experience from other fields [16,17], the elevator status level is categorized into five levels, labeled using digital representations for ease of calculation, as shown in Table 2.
Based on the classification of elevator safety levels, following national standards and existing literature, the indicators are categorized into five safety levels, as shown in Table 3 below.

3.2. Determination of Index Weights

The evaluation indexes selected in this paper involve multiple systems, and the importance of each system varies. The weights of each index cannot be given directly. This paper employed a combination of subjective and objective assignment methods to determine the index weights more accurately. Considering the interconnection of elevator indicators, the CRITIC method was used as an objective assignment, while the hierarchical analysis method was used as a subjective assignment [18]. The distance function was also introduced to align the weight values obtained from the two methods with their corresponding assignment coefficients, ensuring a more reasonably combined assignment. After calculating the subjective and objective weights, the distance function formula calculated the distribution coefficients. The subjective weight distribution coefficient α was calculated to be 0.5965, while the objective weight distribution coefficient β was calculated to be 0.4035. These coefficients were then used to calculate the combination weights ω, as shown in Table 4.

3.3. Fuzzy Integrated Evaluation Method

The fuzzy comprehensive evaluation method has long been a prominent approach for risk evaluation, specifically designed for dealing with fuzzy issues in a multi-attribute decision-making setting. This method primarily entails the calculation of evaluation indices and the establishment of evaluation-level affiliations. This paper adopts a multi-level variable fuzzy comprehensive evaluation method, detailed as follows:
(1)
Interval matrix. In this paper, the safety evaluation of the traction elevator, which comprises four central systems, defines the set of indexes as x 1 , x 2 , , x 4 . Subsequently, the indicator matrix is
X = x 11 x 12 x 13 x 14 x 21 x 22 x 23 x 24 . . . x m 1 . . . x m 2 . . . x m 3 . . . x m 4
where m is the number of indicators.
The risk evaluation level of elevators in this paper comprises five levels. Each level is associated with a corresponding standard interval matrix, which is detailed as follows:
I a b = a 11 , b 11 a 12 , b 12 a 15 , b 15 a 21 , b 21 a 22 , b 22 a 25 , b 25 a m 1 , b m 1 a m 2 , b m 2 a m 5 , b m 5 = a i h , b i h
where the a i h , b i h are divided concerning the division of each index risk level, and the attraction domain matrix is
I c d = c 11 , d 11 c 12 , d 12 c 15 , d 15 c 21 , d 21 c 22 , d 22 c 25 , d 25 c m 1 , d m 1 c m 2 , d m 2 c m 5 , d m 5 = c i h , d i h
(2)
Relative affiliation. Considering that there are three superior levels and two inferior levels in the security level classification, the affiliation degrees for each level are calculated separately using the following formula:
μ A x i h = 0.5 1 + x i a i h M i h a i h x i a i h , M i h μ A x i h = 0.5 1 x i a i h c i h a i h x i c i h , a i h μ A x i h = 0.5 1 + x i b i h M i h b i h x i M i h , b i h μ A x i h = 0.5 1 x i b i l d i h b i h x i b i h , d i h
M i h varies with the risk level and can be determined using the following formula:
M i h = a i 1 h = 1 a i h + b i h / 2 1 < h < k b i k h = k
where h [ 1,5 ] .
(3)
Calculating the integrated affiliation and evaluation level. The integrated affiliation corresponding to the risk level is calculated as follows:
u h = 1 + i = 1 m ω i 1 μ A x i h p i = 1 m ω i μ A x i h p α / p 1
where h 1,5 , and ω i is the calculated combined weights, and in this paper α and β are taken to be 1.
Therefore, the integrated affiliation matrix is U = u h , and normalized to obtain U. Finally, the risk evaluation level is determined based on the principle of maximum affiliation.
Screening elevator data with complete evaluation indexes from the elevator operation status inspection data collected on site by the Hunan Provincial Institute of Special Equipment Inspection and Testing, the risk level of these elevators is calculated by the fuzzy comprehensive evaluation method according to the evaluation index system and weights of the indexes established in the previous section. In order to maintain a balanced dataset, 50 elevators are selected from the dataset, with ten elevators in each of the five risk levels. The determined elevator risk level is used as a label along with the corresponding index data as input of SVM for supervised learning.

4. Results Fuzzy Integrated Evaluation

SVM, proposed in the 1990s by Vapnik et al. [19], is a machine learning theory that has been applied in various fields. It is primarily designed to deal with minor sample problems and nonlinear classification problems. Compared to other machine learning methods, the SVM demonstrates faster convergence speed and relatively high stability and accuracy for minor sample problems [20]. The essence of the elevator’s risk evaluation is to classify the operational status of elevators. In machine learning, linear or nonlinear relationships between data can introduce redundancy, leading to increased computational effort and reduced accuracy. Therefore, feature processing is an integral part of machine learning. In general, feature processing includes two methods: feature extraction and feature selection [21,22]. Feature extraction transforms multi-dimensional data into statistically meaningful content without realistic meaning by mathematical means. This can make it challenging to interpret the extracted features without realistic meaning, and some data may be lost during the extraction process due to its complexity, as in the case of PCA dimensionality reduction. Feature selection involves analyzing features with mathematical means or machine learning to eliminate redundant and non-essential features. In the field of elevators, the physical meaning of indicators (analogous to features in machine learning) is crucial. Therefore, this paper employs feature selection methods from machine learning to optimize elevator indicator data [23]. The classification performance of SVM, in terms of both results and speed, is closely related to the kernel function and its parameters σ and penalty factor C. Therefore, it is imperative to employ optimization algorithms for optimization.

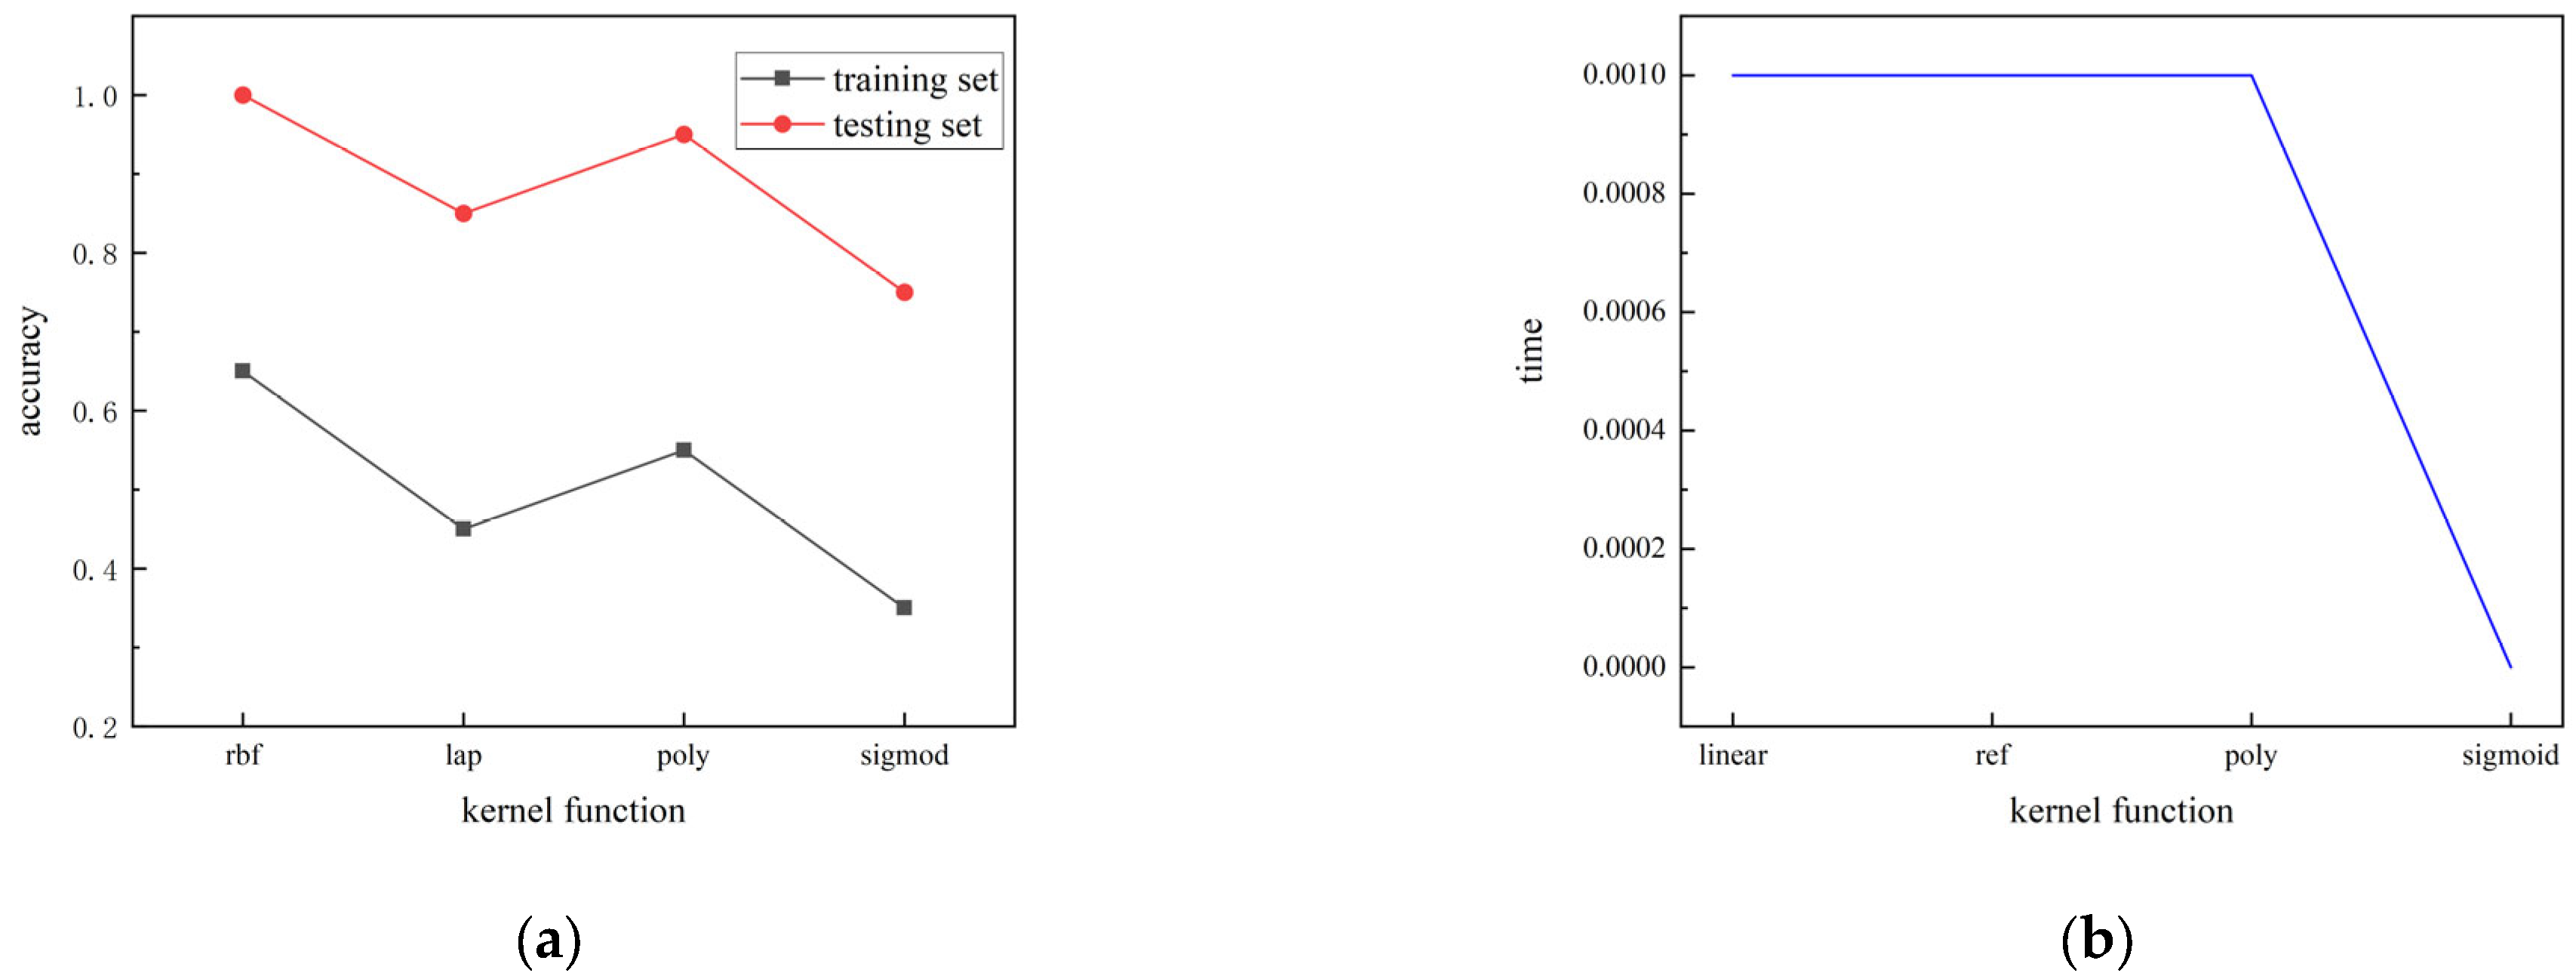
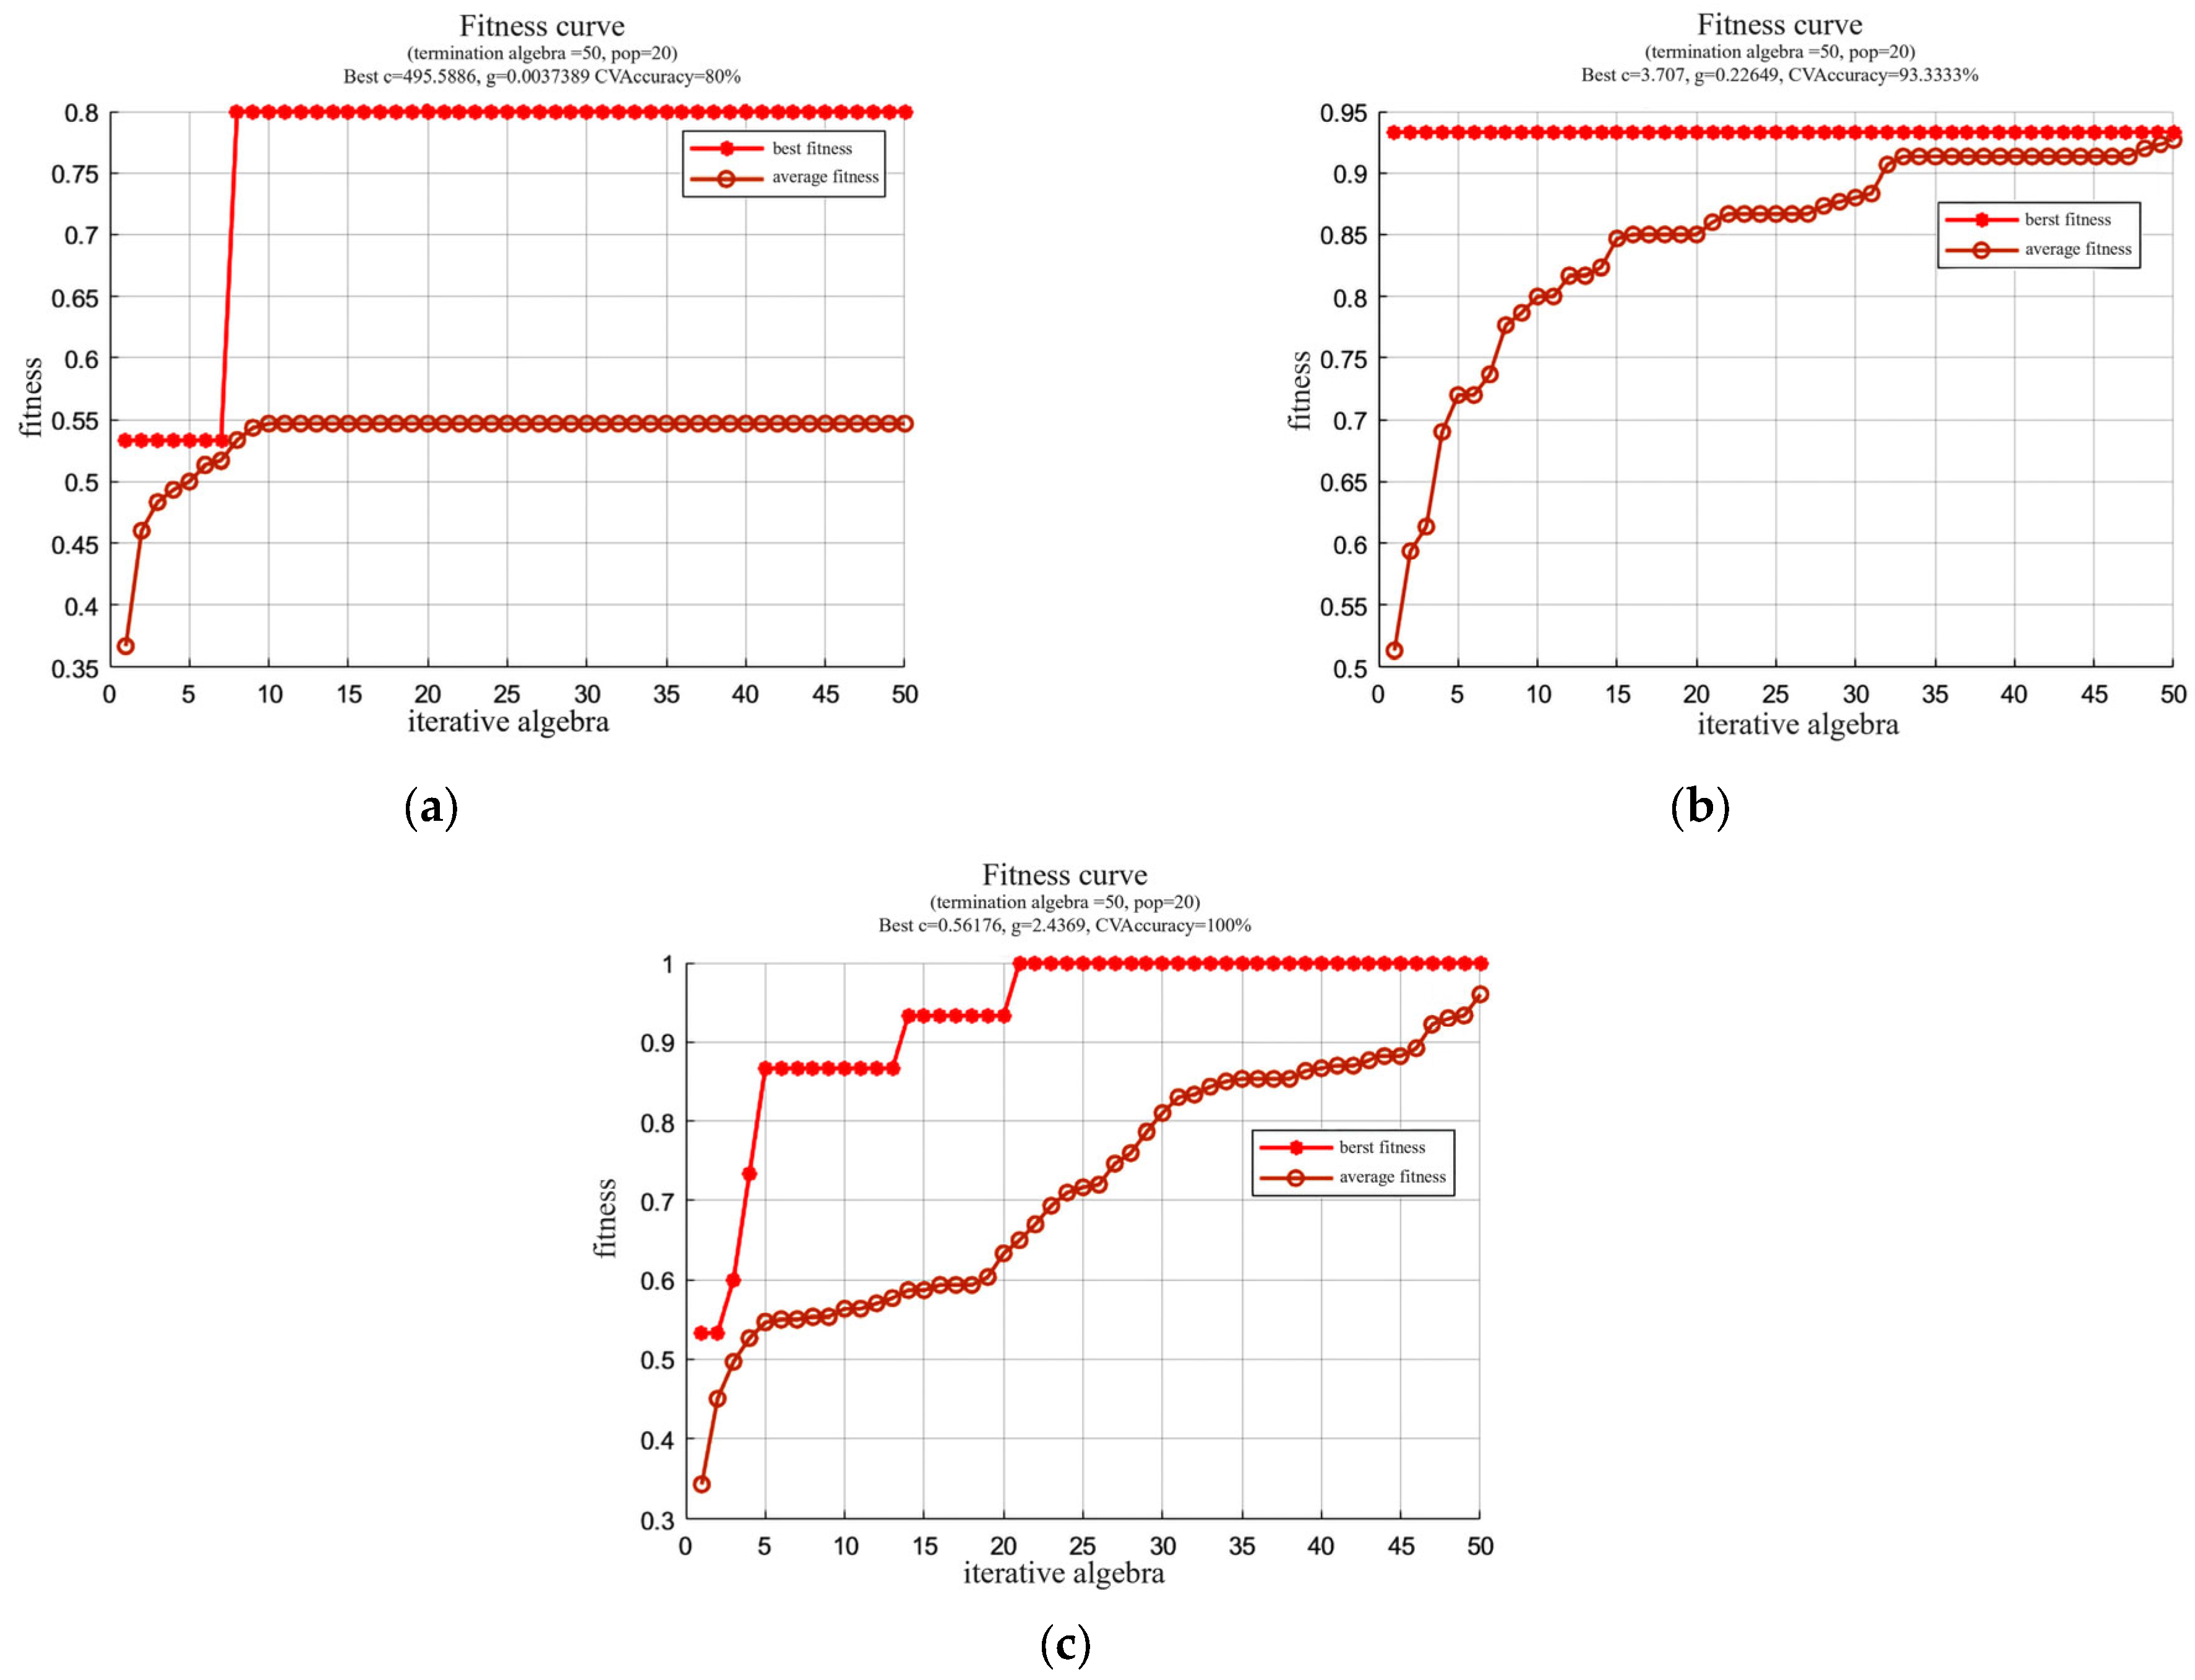
4.1. Kernel Function Selection

Different kernel functions are necessary for addressing specific problems. This paper uses cross-validation to evaluate the Radial Basis Function (RBF), Sigmoid, polynomial, and Laplace kernel functions. The kernel function with the most minor computational error is selected as the final choice. For validation, a simple SVM model was built to detect different kernel functions’ accuracy and time performance. The dataset contains 50 sets of elevator evaluation index data, of which ten sets are used as the test set and 40 sets as the training set. The results are shown in Figure 4.
The results presented in Figure 4 demonstrate that the RBF exhibits significant advantages in terms of accuracy when utilized in SVM. Therefore, this paper finally uses RBF as the kernel function of SVM in the subsequent study.

4.2. Optimization of the Evaluation System

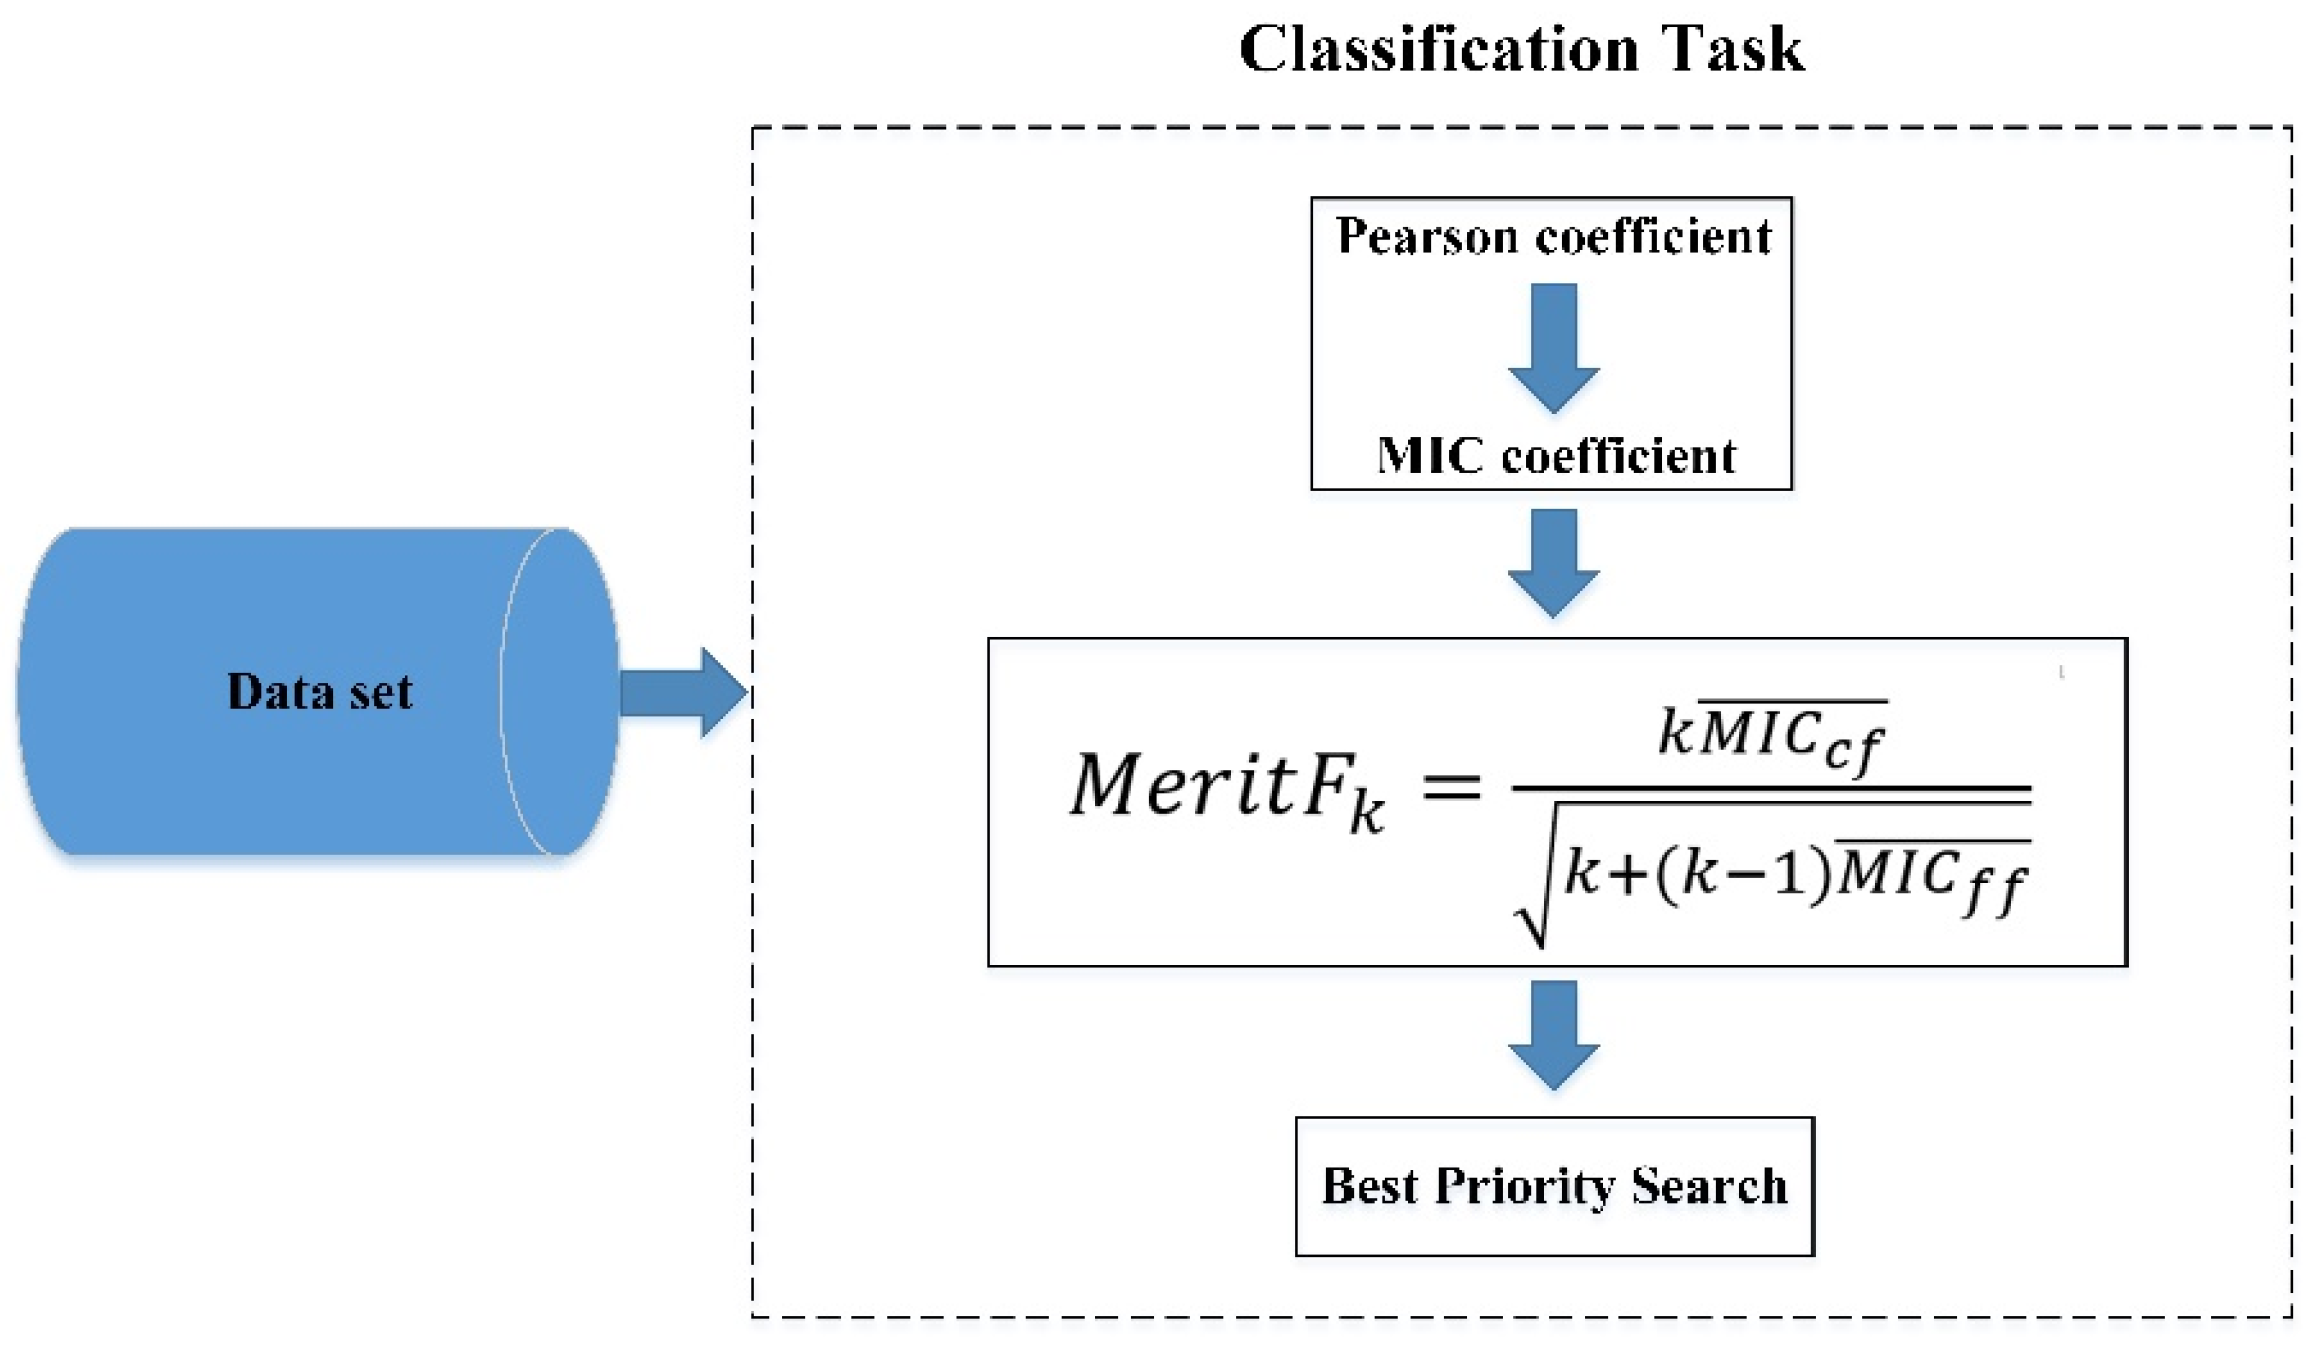
4.2.1. MIC-CFS Method

The CFS algorithm [24,25] is a selection method that emphasizes the consideration of both feature redundancy and their connection to both features and results. When utilizing CFS to determine the optimal feature subset, the average correlation coefficient between feature subset indicators is calculated. For classification problems, the Pearson correlation coefficient is generally used. However, it should be noted that the Pearson coefficient can only assess linear relationships between indicators and is unsuitable for quantifying nonlinear relationships. The evaluation system established in this paper has multiple indicators and may encompass both linear and nonlinear data. Therefore, it is unsuitable to continue using the Pearson correlation coefficient method [26]. The MIC method can measure complex relationships among data while possessing lower complexity and higher robustness [27,28,29,30,31,32]. Therefore, this paper proposes integrating the MIC method with the traditional CFS method to measure nonlinear relationships among indicators accurately. This integration aims to achieve better results in identifying the optimal feature subset facing nonlinear relationships.
In the dataset D = ( F 1 , F 2 , F 3 , F k , C ) , the M e r i t of the feature subset is improved using the MIC method, which is calculated as follows:
M e r i t F k = k M I C c f ¯ k + ( k 1 ) M I C f f ¯
where M I C c f ¯ is the average of the MIC correlation coefficient values between the feature and category C in the requested feature subset F k , and M I C f f ¯ is the average of the MIC correlation coefficient values between feature and feature in the requested feature subset F k , and M e r i t F k is the value of the requested feature subset F k , ‘ k ’ represents the number of features in the requested feature subset F k , and ‘C’ represents the category of dataset D. The flowchart for the MIC-CFS calculation is shown in Figure 5.

4.2.2. Feature Selection Results

The correlation coefficient value between two indicators is calculated using the MIC method, indicating the correlation strength. When the MIC value exceeds 0.8, it indicates a strong correlation between the indicators, thus warranting the utilization of the CFS method for selecting the subset of indicators. The calculations show that the MIC values for stator winding temperature, three currents, and three voltages are above 0.8, while the MIC value between vertical and horizontal vibration acceleration is 0.86. These high correlations suggest the need to perform CFS calculations for the traction and weight balance system and the carriage system to select the preferred subset of indicators. The calculated Merit values are sorted and visualized, and the results are shown in Figure 6. As observed, the maximum Merit in the traction and weight balance system is 0.375, and the optimal subset of indicators is {stator winding temperature, bearing vibration acceleration, traction machine noise, wire rope wear amount}. In the carriage and guidance system, the maximum Merit is 0.269, and the optimal subset of indicators is {vertical vibration acceleration, carriage noise, carriage horizontality, balance coefficient}.
The optimized indicator system resulting from the feature selection of the indicator set using the MIC-CFS method is shown in Figure 7.

4.2.3. Validation of Optimization Effect

The MIC-CFS method is used to identify indicators with strong correlations. However, its potential negative feedback effect on the results remains uncertain. Considering the impact on the safety evaluation results after the selection of the indicators of the two systems, it is assumed that the indicator set before selection is U 17 * = ( U 11 , U 12 . . . , U 32 . . . U 44 ), and the post-selection indicator set is U 14 * = ( U 11 , U 14 , U 15 , U 16 , U 21 , U 22 , U 23 , U 24 , U 31 , U 32 , U 33 , U 41 , U 42 , U 43 ). To compare the superiority of indicator selection, we utilize U 17 * and U 14 * , along with indicator set U 8 * (random contains 8 indexes) and the indicator set U 11 * (random contains 11 indexes) as inputs for machine learning in SVM. To mitigate the influence of randomness, we repeat this process 20 times for each indicator set. The results are shown in the following Table 5.
As Table 5 demonstrates, using the indicator set resulting from the MIC-CFS method as input for SVM leads to a significant improvement in the average accuracy of the evaluation outcomes compared to the pre-selection indicator set. Moreover, the output results obtained with the post-selection indicator set demonstrate a greater level of stability across the 20 operations. Therefore, it is evident that the MIC-CFS method for indicator selection has a certain superiority.

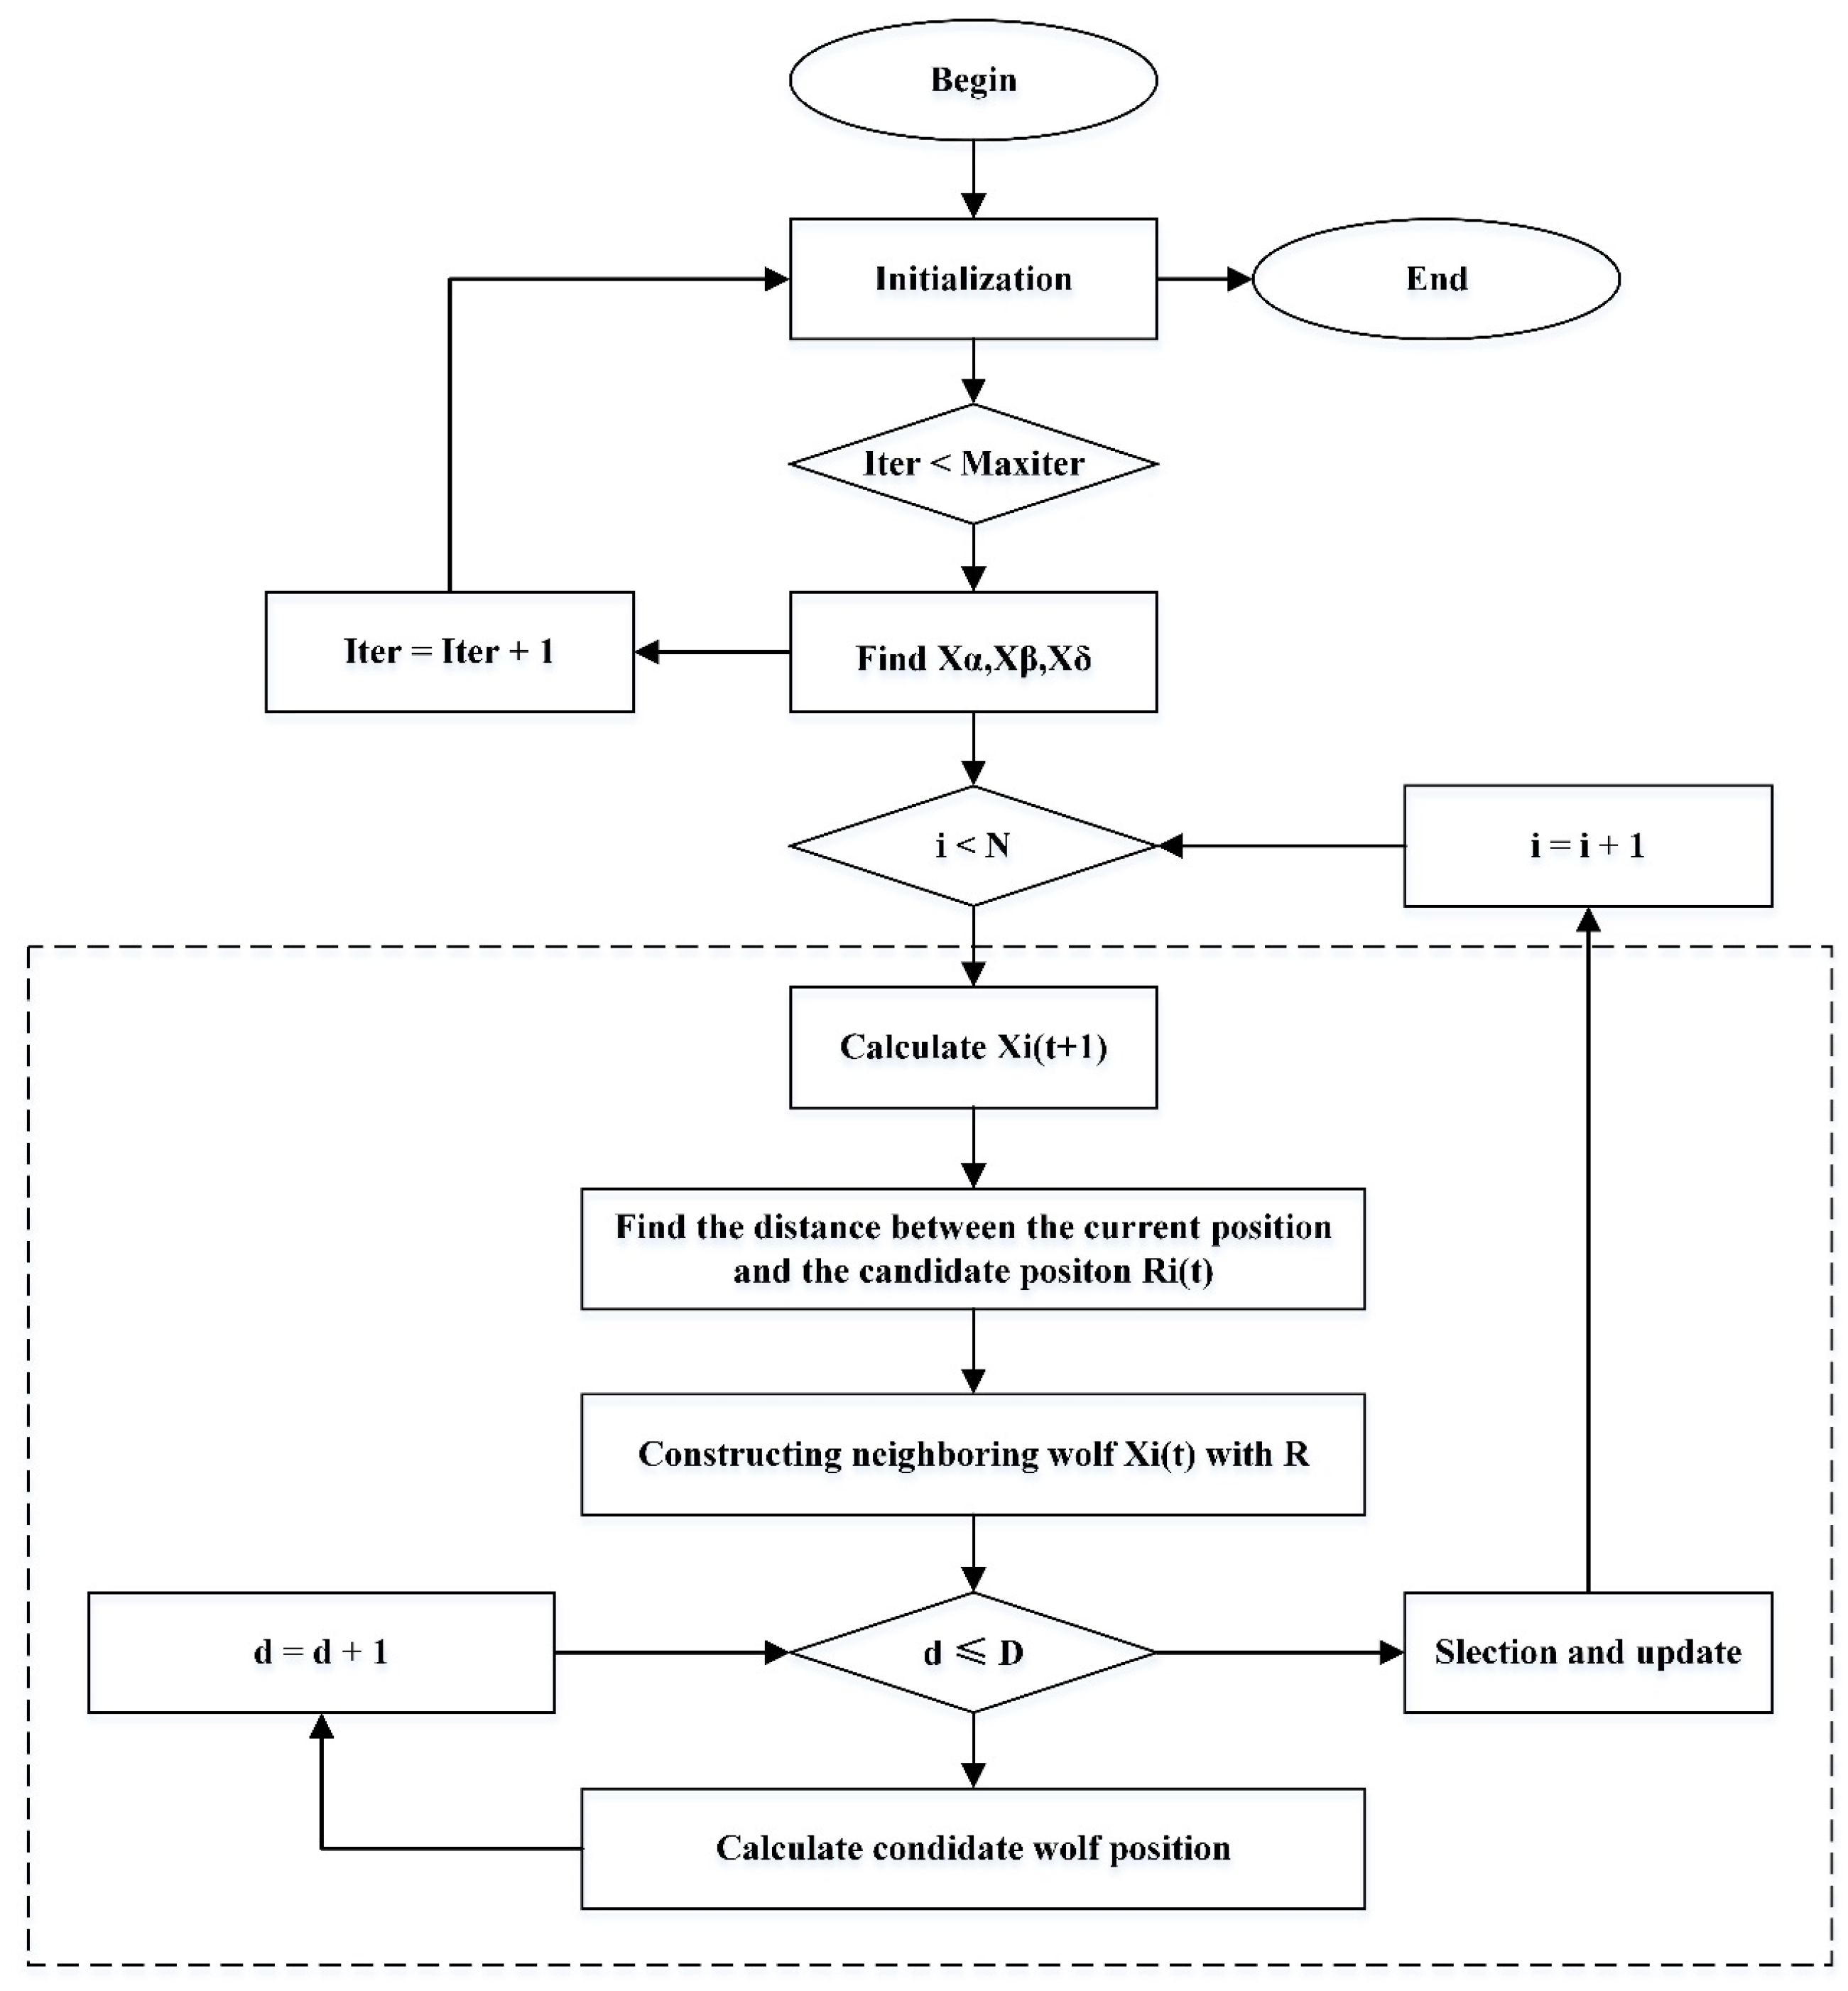
4.3. SVM Optimization Algorithm

After selecting the appropriate kernel function, it is essential to optimize the SVM parameters, namely the penalty factor C and parameters σ, to enhance the classification’s accuracy and efficiency. The penalty factor C reflects the tolerance of the error, and any deviation from an optimal value of C can negatively impact the model’s generalization ability. The kernel function parameter inherent to the RBF function determines the data distribution after mapping to the new feature space. Its value is negatively correlated with the number of support vectors, influencing the speed of training and prediction. The optimization of these parameters is based on natural observations by numerous scholars. Mirjalili et al. (2014) proposed a new population intelligence optimization algorithm, the GWO algorithm [33]. Subsequent research has integrated GWO with various algorithmic models, including multiple kernel extreme learning machines (MKELMs), support vector machines (SVMs), random forest (RF), the sine cosine algorithm (SCA), and others, for classification and prediction tasks in engineering practice. These studies have demonstrated that, compared to other optimization algorithms, GWO optimization exhibits superior convergence, fewer parameters, more straightforward operation, and superior performance [34,35,36,37].
In the traditional GWO algorithm, α, β, and δ guide ω wolves towards the optimal solution in the search space. However, the reduction of ‘a’ (constriction factor) in the GWO algorithm is achieved by linear decay, and when A < 1 (convergence coefficient vector), it may fall into a locally optimal solution. Additionally, as the number of iterations increases, the population diversity decreases continuously, leading to the same issue of falling into a local optimal solution. To solve these two problems, the IGWO is proposed [38,39,40,41,42,43,44,45,46]. In this paper, the dimensional learning-based hunting (DLH) search strategy is used to improve the performance of GWO.
As shown in Figure 8, the IGWO consists of three primary phases: initialization, movement, and selection.
(1)
Initialization phase: N wolves are randomly distributed within a predefined range [ l i , u j ] of the search space, shown as
X i j = l j + r a n d d j 0,1 × u j l j , i 1 , N , j 1 , D
where D represents the dimension, the position of the i-th wolf during the t-th iteration is X i ( t ) = { X i 1 , X i 2 , . . . , X i D } . The whole wolf pack is represented by a matrix with N rows and D columns.
(2)
Movement phase: The IGWO is guided by a DLH search strategy. In this method, the calculated gray wolf candidate position X i G W O ( t + 1 ) is initially obtained through the traditional GWO search strategy. Subsequently, the DLH search strategy is used to calculate an additional candidate’s position X i D L H , d ( t + 1 ) . In the DLH search strategy, the Euclidean distance R i ( t ) between the current grey wolf location X i G W O ( t + 1 ) and the additional candidate location X i D L H , d ( t + 1 ) is calculated as
R i ( t ) = X i ( t ) X i G W O ( t + 1 )
And the neighbor N i ( t ) of X i ( t ) is formed by the following:
N i ( t ) = { X j ( t ) D i ( X i ( t ) , X j ( t ) ) R i ( t ) }
where D i is the Euclidean distance between X i ( t ) and X j ( t ) .
Once the neighborhoods of X i ( t ) are constructed, multi-neighborhood learning depends on the following:
X i D L H , d ( t + 1 ) = X i , d ( t ) + r a n d × ( X n , d ( t ) - X r , d ( t ) )
where the d-th dimension of X i D L H , d ( t + 1 ) is computed by using the d-th dimension of a randomly selected neighbor X n , d ( t ) from N i ( t ) and a randomly selected wolf X r , d ( t ) from the pack.
(3)
Selection phase: The optimal candidate is selected by comparing the fitness of two candidates X i D L H , d ( t + 1 ) and X i G W O ( t + 1 ) , shown as
X i ( t + 1 ) = X i G W O ( t + 1 ) , i f   f ( X i G W O ) < f ( X i D L H , d ) ) X i D L H , d ( t + 1 )       o t h e r w i s e
If the selected optimal candidate X i ( t + 1 ) has a fitness value less than that of X i ( t ), then the position of X i ( t ) is updated. After one iteration of this process, the number of iterations is increased by one until the preset maximum number of iterations is reached.

4.4. Experimental Validation

The specific implementation process is shown in Figure 9. After establishing a suitable risk evaluation index system for the elevator, the data from these evaluation indexes are used as the input of the SVM, and the risk levels calculated by the fuzzy comprehensive evaluation method serve as the corresponding labels. The dataset comprises ten sets of samples for each of the five risk levels, and the dataset is divided into a training set and a test set in a 7:3 ratio. This partitioning aims to verify the accuracy of the SVM improved by different methods.
In this paper, the risk evaluation of elevators is carried out using the IGWO-SVM method. To verify the superiority of the IGWO-SVM algorithm for elevator risk evaluation, we compare it with three algorithms: unoptimized GWO-SVM, DE-SVM, and the SVM without parameter optimization.

4.5. Evaluation Results

The test results of the test set are shown in Figure 10. Firstly, it is observed that the error rate of the no-parameter optimization group significantly exceeds that of the other three parametric groups. This suggests that parameter optimization plays a crucial role in enhancing the model’s classification accuracy. Secondly, the computation time of the three parameter optimization groups is roughly the same, and the results show that GWO optimization outperforms DE regarding classification accuracy. This could be attributed to the fact that, for low-dimensional nonlinear problems, GWO optimization employs a population-based optimization algorithm that enables more efficient search and optimization of model parameters. Conversely, stochasticity may influence DE optimization, leading to less efficient search processes. Finally, it is worth noting that IGWO-SVM can reach 100% accuracy, which indicates that IGWO optimization has significant advantages in enhancing classification accuracy in elevator risk assessment.
The fitness curves can reflect the effect of parameter tuning on the performance of the algorithms, and the fitness curves of the three algorithms are shown in Figure 11. With an increase in the number of iterations, it is observed that for DE-SVM, the difference between the best adaptation value and the average adaptation value stabilizes from the initial gradual shrinkage. However, this substantial difference indicates that DE-SVM’s optimization search is inefficient, and the algorithm model becomes trapped in local convergence, leading to poor evaluation results. Comparing the GWO-SVM and IGWO adaptation curves, it can be found that the best adaptation value of GWO-SVM stabilizes from the outset. Nevertheless, its best adaptation value does not change as the average adaptation value increases, indicating early convergence that may prevent it from escaping local optima, thus impeding improvement in evaluation accuracy. For IGWO-SVM, the best fitness curve exhibits three jumps, indicating at least three jumps out of local convergence during the parameter search process. Additionally, the difference between the best and average fitness values gradually decreases, indicating that the model’s performance is gradually improving. It can be concluded that IGWO-SVM enhances the model’s convergence speed and classification accuracy compared to the other two parameter optimization methods. Moreover, it effectively prevents convergence to local optima, ensuring high accuracy and reliability in risk assessments for traction elevators.
Meanwhile, to avoid the chance of the experiment, the three algorithmic models were run 20 times consecutively, and the results are shown in Figure 12. The minimum, average, and maximum classification accuracies of IGWO-SVM are significantly higher than those of the other two methods. IGWO-SVM achieved a 100% frequency of 11 times with an average accuracy of 98.33%. This further confirms the high accuracy and reliability of IGWO-SVM and its superior performance in elevator risk evaluation.

5. Conclusions

Given the increasing popularity of elevators today and the occurrence of elevator accidents, this paper reviews the current research on elevator operation risk evaluation methods. It is observed that the current mainstream still relies on expert judgment, which is subjective and time-consuming, and faces the trend that experienced experts cannot meet the actual demand for an increasing number of elevators. With the development of computer science and technology, machine learning methods can improve the accuracy of elevator operation risk evaluation based on the analysis of collected data. However, there is limited research on this evaluation method for elevators. This paper has done much work precisely for such a research purpose, and the conclusions from the experimental results can be summarized as follows:
(1)
Applying the MIC-CFS method for feature selection in risk evaluation index systems with solid correlation reduces the number of model input parameters and leads to faster training convergence and higher, more stable accuracy. These findings emphasize the potential of the MIC-CFS approach to enhance the performance of machine learning models in nonlinear risk assessment tasks.
(2)
For the elevator operation risk evaluation model established in this paper, the accuracy of using RBF as the kernel function of SVM has apparent advantages. The parametrization of the SVM model is a crucial step, and implementing the IGWO algorithm yields optimal results. Notably, this approach effectively circumvents the risk of converging to local optima and exhibits superior accuracy and stability compared to other optimization algorithms.
This paper provides a novel approach for elevator risk evaluation, yet further advancements are still possible. Advanced techniques such as random forests or decision trees could enhance accuracy in future works. Additionally, exploring different optimization algorithms for machine learning model improvement represents a valuable direction for future research. However, there are still some shortcomings in this paper. Labeling training data depends on expert judgment, which can introduce subjectivity and potential bias into the analysis. Addressing this limitation is crucial, as inaccuracies in expert judgment can render the trained machine-learning model meaningless. Future research should investigate new labeling methods or verify the accuracy of expert judgment to mitigate this shortcoming. It is also recognized that, due to the small training dataset, the generalizability of the proposed IGWO-SVM model remains unclear. To enhance the model’s applicability for daily elevator risk assessments, future improvements should focus on analyzing extensive datasets by utilizing artificial intelligence and big data analytics techniques.

Author Contributions

Conceptualization, W.P. and Y.X.; methodology, W.P.; software, Y.X.; validation, Y.X. and W.G.; formal analysis, Y.X. and W.G.; investigation, Y.X.; resources, W.P. and Y.X.; data curation, Y.X.; writing—original draft preparation, Y.X.; writing—review and editing, W.P., W.G. and H.S.; visualization, Y.X.; supervision, H.S.; project administration, W.P.; funding acquisition, W.P. All authors have read and agreed to the published version of the manuscript.

Funding

This research was funded by the State Administration for Market Regulation, grant number 2022MK090.

Data Availability Statement

To ensure ethical considerations, we have adhered to strict data privacy protocols and obtained informed consent from all participants. The data supporting this study’s findings are included and will be available from the corresponding author upon reasonable request.

Acknowledgments

The authors sincerely thank the State Administration for Market Regulation and those who participated in the questionnaire.

Conflicts of Interest

The authors declare no conflicts of interest.

References

  1. AQSIQ. Notice from the General Administration of Market Supervision on the Safety Situation of Special Equipment in the Country. Available online: https://gkml.samr.gov.cn/nsjg/tzsbj/202204/t20220419_341377.html (accessed on 27 October 2023).
  2. Kolowrocki, K. Asymptotic approach to reliability evaluation of rope transportation system. Reliab. Eng. Syst. Saf. 2001, 71, 57–64. [Google Scholar] [CrossRef]
  3. Bennetts, I.D.; Moinuddin, K.A.M.; Goh, C.C.; Thomas, I.R. Testing and factors relevant to the evaluation of the structural adequacy of steel members within fire-resistant elevator shafts. Fire Saf. J. 2005, 40, 698–727. [Google Scholar] [CrossRef]
  4. Yost, G.R.; Rothenfluh, T.R. Configuring elevator systems. Int. J. Hum.-Comput. Stud. 1996, 44, 521–568. [Google Scholar] [CrossRef]
  5. Aneziris, O.N.; Papazoglou, I.A.; Baksteen, H.; Mud, M.; Ale, B.J.; Bellamy, L.J.; Hale, A.R.; Bloemhoff, A.; Post, J.; Oh, J. Quantified risk assessment for fall from height. Saf. Sci. 2008, 46, 198–220. [Google Scholar] [CrossRef]
  6. Zhang, J.; Zhao, X.; Liu, C.; Wang, W. Reliability Evolution of Elevators Based on the Rough Set and the Improved TOPSIS Method. Math. Probl. Eng. 2018, 2018, 4784965. [Google Scholar] [CrossRef]
  7. Sun, S.; Shi, Z.; Li, Q. Safety Evaluation Model of Intelligent Elevator Cloud Management Platform. In Proceedings of the Communications, Signal Processing, and Systems; Springer: Singapore, 2020; pp. 1126–1132. [Google Scholar] [CrossRef]
  8. Gholami, J.; Razavi, A.; Ghaffarpour, R. Decision-making regarding the best maintenance strategy for electrical equipment of buildings based on fuzzy analytic hierarchy process; case study: Elevator. J. Qual. Maint. Eng. 2022, 28, 653–667. [Google Scholar] [CrossRef]
  9. Niu, D.; Guo, L.; Zhao, W.; Li, H. Operation performance evaluation of elevators based on condition monitoring and combination weighting method. Measurement 2022, 194, 111091. [Google Scholar] [CrossRef]
  10. Zhang, G.; Qiu, C.; Qian, X.; Huang, S. Application of fuzzy hierarchical analysis and artificial neural network models in elevator wind risk assessment. Control. Theory Appl. 2009, 26, 931–933. [Google Scholar]
  11. Guo, B.; Zhang, L.; Li, Y. Research on the path of residents’ willingness to upgrade by installing elevators in old residential quarters based on safety precautions. Saf. Sci. 2019, 118, 389–396. [Google Scholar] [CrossRef]
  12. Yu, J.; Hu, B. Influence of the combination of big data technology on the Spark platform with deep learning on elevator safety monitoring efficiency. PLoS ONE 2020, 15, e0234824. [Google Scholar] [CrossRef]
  13. Chai, S.; Li, X.I.; Jia, Y.; He, Y.; Yip, C.H.; Cheung, K.K.; Wang, M. A Non-Intrusive Deep Learning Based Diagnosis System for Elevators. IEEE Access 2021, 9, 20993–21003. [Google Scholar] [CrossRef]
  14. Wan, L.; Zhang, G.; Tao, J. Lift safety assessment based on AHP-CRITIC. J. Saf. Environ. 2017, 17, 1696–1700. [Google Scholar] [CrossRef]
  15. Zhang, G.; Wan, L.; Huang, Y. Fuzzy integrated assessment of elevator operational reliability based on cloud model. J. Saf. Sci. Technol. 2016, 12, 175–179. [Google Scholar] [CrossRef]
  16. Tao, T.; Xin, K.; Lv, C.; Liu, S. Evaluation of drinking water quality in a water supply distribution network based on Grey correlation analysis. J. Water Supply Res. Technol.-Aqua 2011, 60, 448–458. [Google Scholar] [CrossRef]
  17. Lin, Z.; Wang, S. Classification of fire safety levels in road tunnels based on risk analysis. Fire Sci. Technol. 2010, 29, 394–398. [Google Scholar] [CrossRef]
  18. Zhang, X. Application of AHP-Fuzzy Comprehensive Evaluation Method in Safety Evaluation of Elevator Use Management System. J. Saf. Environ. 2011, 11, 236–239. [Google Scholar] [CrossRef]
  19. Vapnik, V.N. An overview of statistical learning theory. IEEE Trans. Neural Netw. 1999, 10, 988–999. [Google Scholar] [CrossRef]
  20. Catoni, O. Statistical learning theory and stochastic optimization. In Statistical Learning Theory and Stochastic Optimization: Ecole D’ete De Probabilities De Saint-Flour Xxxi 2001; Picard, J., Ed.; Lecture Notes in Mathematics; Springer Science & Business Media: Berlin, Germany, 2004; Volume 1851. [Google Scholar]
  21. Cai, J.; Luo, J.; Wang, S.; Yang, S. Feature selection in machine learning: A new perspective. Neurocomputing 2018, 300, 70–79. [Google Scholar] [CrossRef]
  22. Zhou, P.; Hu, X.; Li, P.; Wu, X. OFS-Density: A novel online streaming feature selection method. Pattern Recognit. 2019, 86, 48–61. [Google Scholar] [CrossRef]
  23. Liu, J.; Lin, Y.; Lin, M.; Wu, S.; Zhang, J. Feature selection based on quality of information. Neurocomputing 2017, 225, 11–22. [Google Scholar] [CrossRef]
  24. Hall, M.A. Correlation-Based Feature Selection for Machine Learning. Doctoral Dissertation, The University of Waikato, Hamilton, New Zealand, 1999. [Google Scholar]
  25. Senliol, B.; Gulgezen, G.; Yu, L.; Cataltepe, Z. Fast Correlation Based Filter (FCBF) with a different search strategy. In Proceedings of the 2008 23rd International Symposium on Computer and Information Sciences, Istanbul, Turkey, 27–29 October 2008; pp. 1–4. [Google Scholar]
  26. Pearson, K.; Henrici, O.M.F.E. VII. Mathematical contributions to the theory of evolution.—III. Regression, heredity, and panmixia. Philos. Trans. R. Soc. London. Ser. A Contain. Pap. A Math. Or Phys. Character 1997, 187, 253–318. [Google Scholar] [CrossRef]
  27. Gábor, J.S.; Maria, L.R.; Nail, K.B. Measuring and testing dependence by correlation of distances. Ann. Stat. 2007, 35, 2769–2794. [Google Scholar] [CrossRef]
  28. Reshef, D.N.; Reshef, Y.A.; Finucane, H.K.; Grossman, S.R.; McVean, G.; Turnbaugh, P.J.; Lander, E.S.; Mitzenmacher, M.; Sabeti, P.C. Detecting Novel Associations in Large Data Sets. Science 2011, 334, 1518–1524. [Google Scholar] [CrossRef] [PubMed]
  29. Sun, G.; Li, J.; Dai, J.; Song, Z.; Lang, F. Feature selection for IoT based on maximal information coefficient. Future Gener. Comput. Syst. 2018, 89, 606–616. [Google Scholar] [CrossRef]
  30. Kinney, J.B.; Atwal, G.S. Equitability, mutual information, and the maximal information coefficient. Proc. Natl. Acad. Sci. USA 2014, 111, 3354–3359. [Google Scholar] [CrossRef] [PubMed]
  31. Wang, P.; Zhang, S. Maximum information coefficient based correlation analysis method for delay data. Electron. Meas. Technol. 2015, 38, 112–115. [Google Scholar] [CrossRef]
  32. Wang, J.; Xie, M.; Yang, L.; Tang, Z.; Yang, Z. A study on cloud type recognition based on improved mRMR feature selection. Meteorol. Sci. Technol. 2013, 41, 803–808. [Google Scholar] [CrossRef]
  33. Mirjalili, S.; Mirjalili, S.M.; Lewis, A. Grey Wolf Optimizer. Adv. Eng. Softw. 2014, 69, 46–61. [Google Scholar] [CrossRef]
  34. Li, T.; Qian, Z.; He, T. Short-Term Load Forecasting with Improved CEEMDAN and GWO-Based Multiple Kernel ELM. Complexity 2020, 2020, 1209547. [Google Scholar] [CrossRef]
  35. Zhou, J.; Huang, S.; Zhou, T.; Armaghani, D.J.; Qiu, Y. Employing a genetic algorithm and grey wolf optimizer for optimizing RF models to evaluate soil liquefaction potential. Artif. Intell. Rev. 2022, 55, 5673–5705. [Google Scholar] [CrossRef]
  36. Lu, S.; Li, M.; Luo, N.; He, W.; He, X.; Gan, C.; Deng, R. Lithology Logging Recognition Technology Based on GWO-SVM Algorithm. Math. Probl. Eng. 2022, 2022, 1640096. [Google Scholar] [CrossRef]
  37. Gupta, S.; Deep, K.; Moayedi, H.; Foong, L.K.; Assad, A. Sine cosine grey wolf optimizer to solve engineering design problems. Eng. Comput. 2021, 37, 3123–3149. [Google Scholar] [CrossRef]
  38. Faris, H.; Aljarah, I.; Alqatawna, J. Optimizing Feedforward neural networks using Krill Herd algorithm for E-mail spam detection. In Proceedings of the 2015 IEEE Jordan Conference on Applied Electrical Engineering and Computing Technologies (AEECT), Amman, Jordan, 3–5 November 2015; pp. 1–5. [Google Scholar]
  39. Faris, H.; Mafarja, M.M.; Heidari, A.A.; Aljarah, I.; Al-Zoubi, A.M.; Mirjalili, S.; Fujita, H. An efficient binary Salp Swarm Algorithm with crossover scheme for feature selection problems. Knowl.-Based Syst. 2018, 154, 43–67. [Google Scholar] [CrossRef]
  40. Nadimi-Shahraki, M.H.; Taghian, S.; Mirjalili, S. An improved grey wolf optimizer for solving engineering problems. Expert Syst. Appl. 2021, 166, 113917. [Google Scholar] [CrossRef]
  41. Xu, L.; Yu, X.; Gulliver, T.A. Intelligent Outage Probability Prediction for Mobile IoT Networks Based on an IGWO-Elman Neural Network. IEEE Trans. Veh. Technol. 2021, 70, 1365–1375. [Google Scholar] [CrossRef]
  42. Xiong, K.; Yue, C.; Liu, D. Fault diagnosis of SVM analog circuits based on IGWO algorithm optimization. Microelectron. Comput. 2019, 36, 16–21. [Google Scholar] [CrossRef]
  43. Guo, Z.; Liu, R.; Gong, C.; Zhao, L. An improved study based on the Grey Wolf algorithm. Appl. Res. Comput. 2017, 34, 3603–3606, 3610. [Google Scholar] [CrossRef]
  44. Wang, Z.; Xie, H.; Hu, Z.; Li, D.; Wang, J.; Liang, W. Node coverage optimization algorithm for wireless sensor networks based on improved grey wolf optimizer. J. Algorithms Comput. Technol. 2019, 13, 1748302619889498. [Google Scholar] [CrossRef]
  45. Cai, Z.; Gu, J.; Luo, J.; Zhang, Q.; Chen, H.; Pan, Z.; Li, Y.; Li, C. Evolving an optimal kernel extreme learning machine by using an enhanced grey wolf optimization strategy. Expert Syst. Appl. 2019, 138, 112814. [Google Scholar] [CrossRef]
  46. Du, R.; Yang, C.; Pu, Y. Non-intrusive load monitoring method based on steady-state features and IGWO-FCM fuzzy clustering. Electr. Meas. Instrum. 2021, 58, 152–157. [Google Scholar] [CrossRef]
Figure 1. Change in the number of elevators in China from 2014 to 2022.
Mathematics 12 00113 g001
Figure 2. System architecture diagram of the traction elevator.
Mathematics 12 00113 g002
Figure 3. Fault-type scaling diagram.
Mathematics 12 00113 g003
Figure 4. Comparison results for different kernel functions: (a) accuracy; (b) training time.
Mathematics 12 00113 g004
Figure 5. The flow chart of MIC-CFS.
Mathematics 12 00113 g005
Figure 6. Merit value plumb line plot: (a) Traction and weight balancing system; (b) carriage and guidance system.
Mathematics 12 00113 g006
Figure 7. Elevator risk evaluation index system.
Mathematics 12 00113 g007
Figure 8. IGWO flow chart.
Mathematics 12 00113 g008
Figure 9. SVM training process.
Mathematics 12 00113 g009
Figure 10. The average evaluation error rate.
Mathematics 12 00113 g010
Figure 11. Adaptation curves: (a) DE-SVM; (b) GWO-SVM; (c) IGWO-SVM.
Mathematics 12 00113 g011
Figure 12. Accuracy of the three optimization methods.
Mathematics 12 00113 g012
Table 1. Evaluation indexes for elevators.
Sub-SystemIndex
Traction and weight balance system (U1)Stator winding temperature (U11)
Tri-voltage (U12)
Tri-current (U13)
Bearing vibration acceleration (U14)
Traction machine noise (U15)
Wire rope wear amount (U16)
Carriage and guidance system (U2)Vertical vibration acceleration (U21)
Carriage noise (U22)
Carriage horizontality (U23)
Balance coefficient (U24)
Horizontal vibration acceleration (U25)
Door and safety protection system (U3)Door clearance (U31)
Switching door noise (U32)
Leveling accuracy (U33)
Electrical system (U4)Startup process acceleration (U41)
Deceleration of braking process (U42)
Smooth running speed (U43)
Table 2. Elevator risk level classification and interpretation.
Risk LevelEvaluation LanguageEvaluation DefinitionTags
IHigh securityExcellent elevator index and safe operation1
IIModerate SecurityElevator indicators are within the acceptable range and at a lower limit2
IIILow securityElevator indicators are within the acceptable range but at an upper limit risk3
IVDangerousElevator indicators have exceeded the acceptable range, and the elevator is at risk4
VVery dangerousElevator indicators are seriously deviating from the safe zone, and the elevator is in grave danger5
Table 3. Classification of the risk level of each indicator.
IndicatorsHigh
Security I
Moderate
Security II
Low Security IIIDangerous
IV
Very Dangerous
V
Stator winding temperature (U11/°C)50–5757–6464–7171–7878–85
Tri-voltage (U12/V)380–386386–398398–410410–422422–434
Tri-current (U13/A)30.0–31.531.5–34.534.5–37.537.5–40.540.5–43.5
Bearing vibration acceleration (U14/ m m s 2 )0.40–0.530.53–0.660.66–0.790.79–0.920.92–1.05
Traction machine
noise (U15/dB)
35–4040–4545–5050–5555–60
Wire rope wear amount (U16/mm)0–0.20.2–0.40.4–0.60.6–0.80.8–1.0
Vertical vibration acceleration (U21/ m s 2 )0.15–0.200.20–0.250.25–0.300.30–0.350.35–0.50
Carriage noise (U22/dB)35–4040–4545–5050–5555–60
Carriage horizontality (U23/mm)0–0.250.25–0.500.50–0.750.75–1.01.0–1.25
Balance coefficient (U24)0.455–0.4700.470–0.4850.485–0.4900.490–0.5050.505–0.520
Horizontal vibration acceleration (U25 / m s 2 )0.10–0.150.15–0.200.20–0.250.25–0.300.30–0.40
Door clearance (U31/mm) 3.0–3.63.6–4.24.2–4.84.8–5.45.4–6.0
Switching door noise (U32/dB)30–3838–4646–5454–6262–70
Leveling accuracy (U33/mm)5–99–1313–1717–2121–25
Startup process acceleration (U41/ m s 2 )0.92–1.051.05–1.181.18–1.311.31–1.441.44–1.57
Deceleration of braking process (U42/ m s 2 )0.27–0.400.40–0.530.53–0.660.66–0.790.79–0.92
Smooth running speed (U43/ m s 1 )1.36–1.581.58–1.821.82–1.971.97–2.212.21–2.45
Table 4. Combination weight values.
Sub-SystemSecondary Indicators Weights   ω i
Traction and weight balance system (U1)Stator winding temperature (U11)0.0621
Tri-voltage (U12)0.0418
Tri-current (U13)0.0737
Bearing vibration acceleration (U14)0.0690
Traction machine noise (U15)0.0366
Wire rope wear amount (U16)0.0393
Carriage and guidance system (U2)Vertical vibration acceleration (U21)0.0367
Carriage noise (U22)0.0360
Carriage horizontality (U23)0.0564
Balance coefficient (U24)0.0503
Horizontal vibration acceleration (U25)0.0282
Door and safety protection system (U3)Door clearance (U31)0.0677
Switching door noise (U32)0.0635
Leveling accuracy (U33)0.0375
Electrical system (U4)Startup process acceleration (U41)0.1690
Deceleration of braking process (U42)0.0786
Smooth running speed (U43)0.0530
Table 5. Accuracy of evaluation with different indicator sets.
Indicator SetHighest AccuracyMinimum AccuracyAverage Accuracy
U 17 * 73.33%60%66.68%
U 14 * 73.33%66.67%68.69%
U 8 * 33.33%023.31%
U 11 * 46.67%26.67%35%
Disclaimer/Publisher’s Note: The statements, opinions and data contained in all publications are solely those of the individual author(s) and contributor(s) and not of MDPI and/or the editor(s). MDPI and/or the editor(s) disclaim responsibility for any injury to people or property resulting from any ideas, methods, instructions or products referred to in the content.

