Article

Dynamic Evolution of Coal Pore-Fracture Structure and Its Fractal Characteristics under the Action of Salty Solution

1
School of Resource & Environment and Safety Engineering, University of South China, Hengyang 421001, China
2
School of Civil and Resource Engineering, University of Science and Technology Beijing, Beijing 100083, China
*
Author to whom correspondence should be addressed.
Mathematics 2024, 12(1), 72; https://doi.org/10.3390/math12010072
Submission received: 30 November 2023 / Revised: 16 December 2023 / Accepted: 20 December 2023 / Published: 25 December 2023

Abstract

:
The instability and failure of coal pillars is one of the important factors leading to the catastrophic consequences of coal mine goaf collapse. Coal mine water has the characteristics of high salinity. Long-term mine water erosion can easily deform the coal pillar structure, eventually leading to instability and damage. This study carried out tests on coal samples soaked in salt solutions with different concentrations, and the nuclear magnetic resonance (NMR) method was used to obtain the dynamic evolution of the pore-fracture structure of coal. On the basis of fractal theory, the changes in fractal dimension of pore structure during the soaking process were discussed. The damage variable based on the pore fractal dimension was defined and the evolution relationship between the damage variable and immersion time was characterized. The findings demonstrated that the porosity change rate has an exponentially increasing relationship with the immersion time, and with the increasement of concentration of salt solution, the porosity change rate also shows increasing trends. The number of seepage pores and total pores increased with the immersion time. While, with the extension of soaking time, the number of adsorption pores first increased and then decreased. The connectivity between pores was enhanced. The relationship between the fractal dimension and the immersion time is linearly decreasing. The damage variable showed an increasing trend with the immersion time. As the concentration of salt solution increased, the damage of coal increased. The research results are of great significance for rationally evaluating the stability of coal pillars and ensuring the safe operation of underground engineering.

1. Introduction

During the underground mining process of coal mines, the coal pillars are reserved in the goaf area as the main load-bearing structure. When a mine is closed, groundwater flows into the goaf and gradually floods the underground structure. Mine water is characterized by high salinity and is rich in Cl and SO42− plasma components [1,2]. The coal pillars reserved in the goaf have been exposed to the environment of concentrated salt mine water for a long time. Under the long-term erosion of mine water, coal pillars are prone to water softening, including chemical erosion, dissolution, and expansion. The number of internal pores and fractures increases and the structure undergoes severe deformation, leading to instability of the coal pillar and ultimately causing disasters of surface subsidence. Change in the pore-fracture structure is an important reason for the instability and failure of coal pillars. Therefore, it is necessary to carry out quantitative analysis of the time-dependent changes in the internal pore-fracture structure of coal under the action of salt solution, which is of great significance for evaluating the stability of underground coal pillars.
When exposed to mine water for a long time, the hydrochemical reaction will change the mineral composition and matrix structure of coal, causing changes in physical properties, which eventually bring great uncertainty to the safety and stability of the coal pillar. Previous studies [3,4,5,6,7,8,9,10] indicated that the physical and mechanical properties of rock materials not only depend on their own characteristics such as mineral composition and pore-fracture network, but are also affected by external factors. Among them, the action of hydrochemicals has a significant impact on the physical properties and mechanical strength of rocks. Extensive research on water-coal interactions has been carried out [11,12,13,14,15,16,17,18,19]. Under the action of water immersion, soluble organic matter and inorganic matter in coal will dissolve in water, causing certain physical and chemical changes. The redistribution of chemical elements and changes in microstructure will ultimately lead to differences in coal properties. Ai et al. [11] carried out water saturation tests on coal and the mechanism of water on the microstructure of coal was analyzed by means of NMR, SEM, and XRD. It was found that the porosity gradually increases with soaking time. Liu et al. [14] found that the increase in water content intensifies the pore alteration of the ultrasonic stimulated coal, and the change in pore structure promoted the diffusion of gas in the pore-fracture channel. Yao et al. [18] studied the spatiotemporal distribution of water content and the crack expansion characteristics in coal before and after water immersion. The results of NMR test showed that the water content in the coal increases exponentially with the soaking time, and the presence of water promotes the development and expansion of pores. Wang et al. [19] demonstrated that the presence of water significantly changed the permeability characteristics of coal and the permeability of saturated water coal was two orders of magnitude lower than that of dry coal. When the chemical solution interacts with the coal, complex physical and chemical reactions occur within the coal matrix, which significantly change the properties of the coal. Previous researchers have elucidated that the porosity, permeability, and dissolution degree of mineral components of coal increase with the prolongation of chemical corrosion time [20,21,22,23,24,25,26]. The physical and mechanical properties of underground coal pillars change significantly under the action of concentrated salt mine water. However, there are few reports on the evolution characteristics of the internal pore-fracture structure of coal under the action of salt solution.
Coal is a complex heterogeneous and anisotropic porous rock. In addition to small pores, there are also complex discontinuities or joint networks inside the coal. The pores or fissures are filled with different mineral particles. When the water or chemical solution flows into the coal matrix, a series of physical and chemical effects will occur on the mineral composition and pore structure. The physical and chemical interaction changes the microstructure of coal matrix, which eventually affects the macroscopic properties. The damage evolution at micro scale is of great significance for understanding the deformation and failure mechanism of large-scale rock. With the development of science and technology, testing methods such as X-ray computed tomography (CT) [27], nuclear magnetic resonance (NMR) [28], scanning electron microscopy (SEM) [29], mercury intrusion [30], and nitrogen adsorption [31] have been used to characterize the microstructure of rocks. Among them, NMR is widely used because of its short test period, no damage to the primary pore structure, and large pore size test range. Many scholars have studied the evolution of coal pore structure and its fractal characteristics under different external factors by using NMR method. Zhou et al. [32] quantitatively analyzed the fractal characteristics of pore-fracture structure of low-rank coal by using nuclear magnetic resonance technology and established a permeability model based on the pore fractal. Liu et al. [33] used NMR to obtain the changes in pore structure and permeability of coal under different water pressure conditions, and built a fractal permeability model of coal. It is confirmed that the internal pore structure of water injected coal is complex and it has fractal characteristics. Chen et al. [34] quantitatively analyzed the dynamic changing characteristics of the pore structure in coal under the effect of stress. It found that when the confining pressure increased, the pore structure was compacted, and the fractal characteristics of the seepage space gradually became significant. Lei et al. [35] carried out a study on the fractal characteristics of low-rank coal under the action of liquid nitrogen freeze-thaw cycle and quantitatively evaluated the complexity of coal pore structure. It indicated that the fractal dimension of seepage pores and open pores was negatively correlated with the number of freeze-thaw cycles. The pore structure of coal has fractal characteristics, and it is more complicated and inhomogeneous than that of other types of rocks such as sandstone, carbonate and shale [36]. The above research reveals the complexity of evolution of coal pore structure under the action of different external factors, but there are few studies on the fractal characteristics of coal pore structure under the action of salt solution and the relationship between pore fractal and the coal damage.
This paper aims to study the damage effect of salt solution immersion on the pore-fracture structure of coal. The coal samples were immersed in salt solutions of different concentrations, and then NMR measurements were carried out on the coal samples immersed in salt solutions for different times. The relationship between the porosity change rate and immersion time and salt solution concentration was discussed. The evolution characteristics of pore size and the number of different types of pores were analyzed. After that the fractal dimensions of pore spaces were calculated using fractal theory. The relationship between fractal dimension and immersion time and porosity was discussed. Damage variables based on pore fractal dimension were defined, and the evolution of damage variables with immersion time under the action of salt solutions was discussed. Finally, the damage mechanism of coal under the action of salt solutions was analyzed. The results of this study are helpful to quantitatively characterize the change in pore structure in coal pillar under the action of concentrated salt mine water, which is of great significance for stability research of coal pillar in underground mine.

2. Materials and Methods

2.1. Coal Sample Preparation

The coal selected for the experiment were taken from Ningdong mining area, China. In order to analyze the mineral composition of the raw coal, the retrieved coal was firstly ground into a powder of about 200 mesh by a grinder. The elements contained in the coal were detected by X-ray fluorescence spectrometer, and X-ray diffraction analysis was further carried out based on the measured element content. The inorganic components of coal are kaolinite, quartz and siderite, whose contents are 51.3%, 41.9%, and 6.8%, respectively (as shown in Figure 1).
The coal blocks retrieved from the site were wrapped in plastic wrap and transported to the laboratory for processing. First, a rock coring machine was used to drill a cylindrical coal sample with a diameter of 50 mm, and then the rock cutting machine was applied to cut the core into a sample with a height of 100 mm, and finally the upper and lower end faces of the sample were polished smooth with sandpaper to form a standard cylindrical specimen with a specification of Φ50 × 100 mm. According to the ISRM rock preparation standard, the unevenness of the two end faces should not exceed 0.02 mm. The parallelism of the end faces should not exceed 0.005 mm. The verticality of the shaft should not exceed 0.001° and the surrounding is smooth. In order to ensure the relative uniformity of samples used in the test, the coal samples were drilled from the same block.

2.2. Salt Solution Preparation and Test Procedures

Mine water is usually weakly acidic or alkaline, mostly containing Na+, K+, Cl, and SO42− plasma components, which has the characteristics of high salinity. The ion composition of mine water from Ningdong mining area was determined in laboratory. The chemical test results showed that the main ion components of the mine water are Na+, SO42−, and Cl and the calculated concentration ratio is about 5:1:3. Therefore, the cation in the salt solution in this study is Na+ and the anion are SO42− and Cl. The concentration ratio of ion in salt solution is the same as that in mine water. An experimental study on the time-dependent evolution of pore and fracture structure of coal under action of salt solution immersion with different concentrations was carried out. Meanwhile, coal samples soaked in distilled water were prepared as a control group. Under the natural condition, the physical and chemical action of mine water on coal is a slow process. Due to the limitation of test time, the means of increasing the acidity and alkalinity of salt solution and increasing the concentration of ions in solution were adopted to accelerate the physical and chemical action of salt solution on coal samples. The pH value of the prepared salt solution is 1, and the concentrations of the salt solution are 0.1 mol/L, 0.5 mol/L, and 1 mol/L. The volume of solution in each immersion group was 10 L. The experiments were carried out at normal temperature and pressure. The pretest showed [37] that the quality of coal samples tends to be stable after soaking for about 30 days, so the soaking period was 30 days.
After the processing of the samples, the longitudinal wave velocity of the coal samples was tested first. The longitudinal wave velocity range of the samples was 1.8 km/s–2.0 km/s. The samples with large differences were excluded, and the remaining samples were immersed in distilled water and salt solution with different concentration, respectively. After soaking for 1 day, 3 days, 5 days, 7 days, 10 days, 15 days, 20 days, and 30 days, the coal samples were taken for NMR test. The MesoMR23-060H-I low-field NMR instrument produced by Suzhou Niumag Electronic Technology Co., Ltd. (Suzhou, China) was used for NMR test. The parameters of NMR were set to RF signal center frequency (SF) of 21 MHz, echo spacing (TE) of 0.2 ms, repeat sampling interval time (TW) of 1000 ms, sampling starting point (RFD) of 0.25 ms, and echo numbers of 2000. The experimental process and equipment are shown in Figure 2.

2.3. The NMR Theory

Nuclear magnetic resonance (NMR) has been widely used as a new technique to detect micro-structures such as rock pores and fractures, which has the advantages of fast, non-destructive and simple operation. Low field NMR mainly uses hydrogen proton in pore water as the signal source for detection. When water is injected into the pores, the relaxation time and initial magnetization vector of the different sizes pores can be obtained through the special CPMG sequence. The distribution curve of the transverse relaxation time (T2) of the pore structure can be obtained through the inversion of the hydrogen ion attenuation signal. For fluid in rocks pores, there are three different relaxation mechanisms, and when these three actions exist simultaneously, the relaxation time T2 of water in the pores can be expressed as:
1 T 2 = 1 T 2 S + 1 T 2 B + 1 T 2 D = ρ S V p o r e + 3 T k 298 η + D γ G T E 2 12
where T2S is the surface relaxation time of the pore fluid; T2B is the volume relaxation time of the fluid; T2D is the relaxation time of pore fluid caused by gradient magnetic field diffusion; ρ is the T2 relaxation strength of the particle surface; (S/V)pore is the ratio of pore surface area to fluid volume; Tk is the Kelvin temperature; η is the liquid viscosity; G is the field intensity gradient; and TE is the echo interval.
According to Formula (1), the free relaxation time is mainly affected by the fluid characteristics, and its value is negligible compared with the surface relaxation time. The diffusion relaxation time is affected by field gradient and echo interval. For coal, the values of G and TE are small, so the diffusion relaxation time can be ignored. Therefore, Formula (1) can be simplified as:
1 T 2 ρ S V p o r e = F S ρ / r
where FS is the pore shape parameter, and the shape parameters of fracture, tubular pore and spherical pore are 1, 2, and 3, respectively; and r is the pore size.
According to Formula (2), the relaxation time T2 is proportional to the pore size. The internal pore size distribution, pore number, connectivity and other parameters of the tested sample can be obtained from the T2 spectra.

3. Results

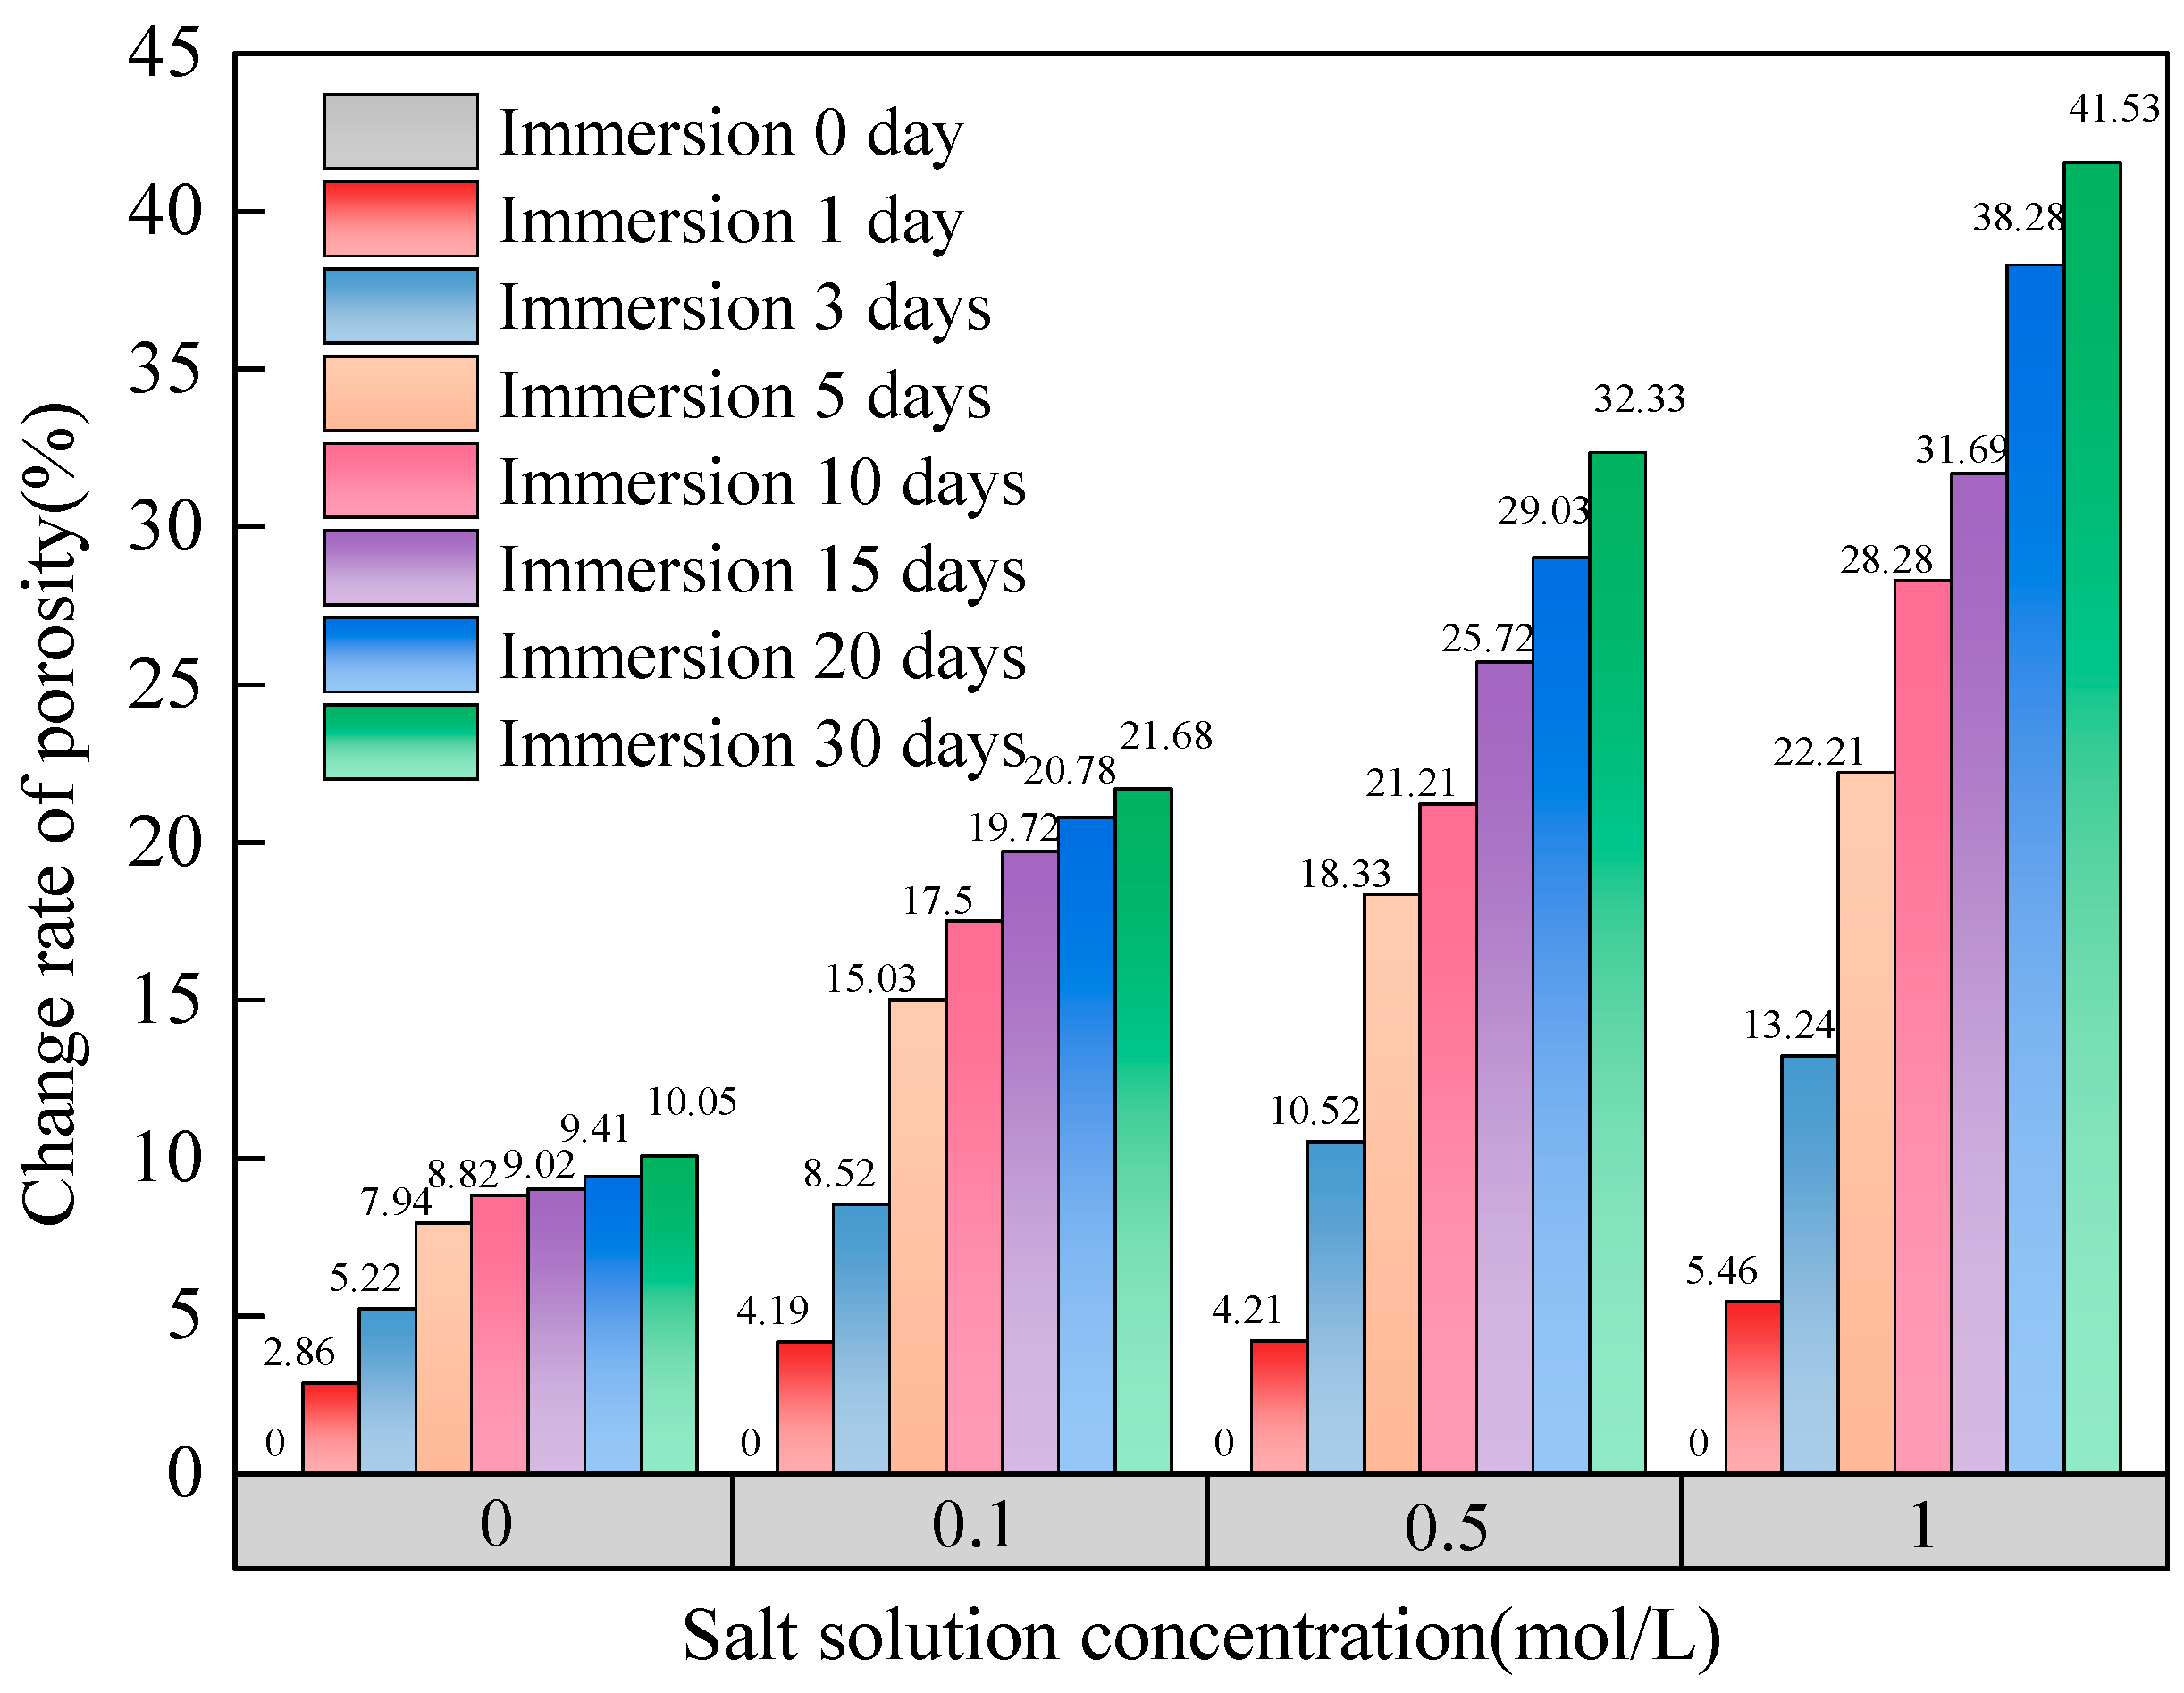
3.1. Time-Dependent Changes in Porosity

Coal porosity is an important parameter to characterize the degree of development of internal defects, which is defined as the ratio of the volume of defects such as pores and fractures to the volume of coal sample. In order to analyze the degree of change in the coal porosity under the action of salt solution immersion, the porosity change rate Δφp was defined to characterize the evolution of the coal porosity. The expression is as follows:
Δ φ p = φ p t φ p 0 φ p 0 × 100 %
where φp0 is the porosity of coal before immersion; and φpt is the porosity of coal after immersion t days.
The porosity and porosity change rate of coal obtained from the NMR test under the action of salt solution are shown in Table 1.
Table 1 shows that the porosity of coal samples increases with the increasing immersion time. In the initial state, the porosity of coal samples in distilled water, 0.1 mol/L, 0.5 mol/L, and 1 mol/L salt solution is 20.29%, 19.83%, 16.64%, and 19.41%, respectively. After 30 days of immersion, φp and Δφp of the corresponding coal samples are 22.33% and 10.054%, 24.13% and 21.684%, 22.02% and 32.332%, 27.47% and 41.525%, respectively. There are some differences in the coal porosity at the initial state, which is caused by the number and distribution of the primary pores in different coal samples. After 30 days of immersion, the porosity change rate of coal samples soaked in 1 mol/L salt solution is the highest. The Δφp increases with the increase in salt solution concentration. It indicated that the effect of high concentration salt solution can promote the expansion of primary pores and the initiation of new fractures, which eventually lead to a relatively large growth rate of total pore volume in the coal matrix.
The porosity change rate of coal samples varies with immersion time and salt solution concentration are shown in Figure 3 and Figure 4. Under different immersion time and salt solution concentration, there are different changing rules between the porosity change rate and soaking variables. There was an exponential correlation between the porosity change rate and immersion time (Table 2). When the concentration of salt solution is constant, the longer the soaking time, the greater the change in porosity. While there is a linear correlation between the porosity change rate and the salt solution concentration (Table 3). With the same immersion time, the porosity change rate shows an increasing trend with the increase in salt solution concentration. Under the action of salt solution, pore expansion, crack widening, penetration and extension eventually lead to the increase in porosity, thus aggravating the deterioration of macro-properties of coal samples.

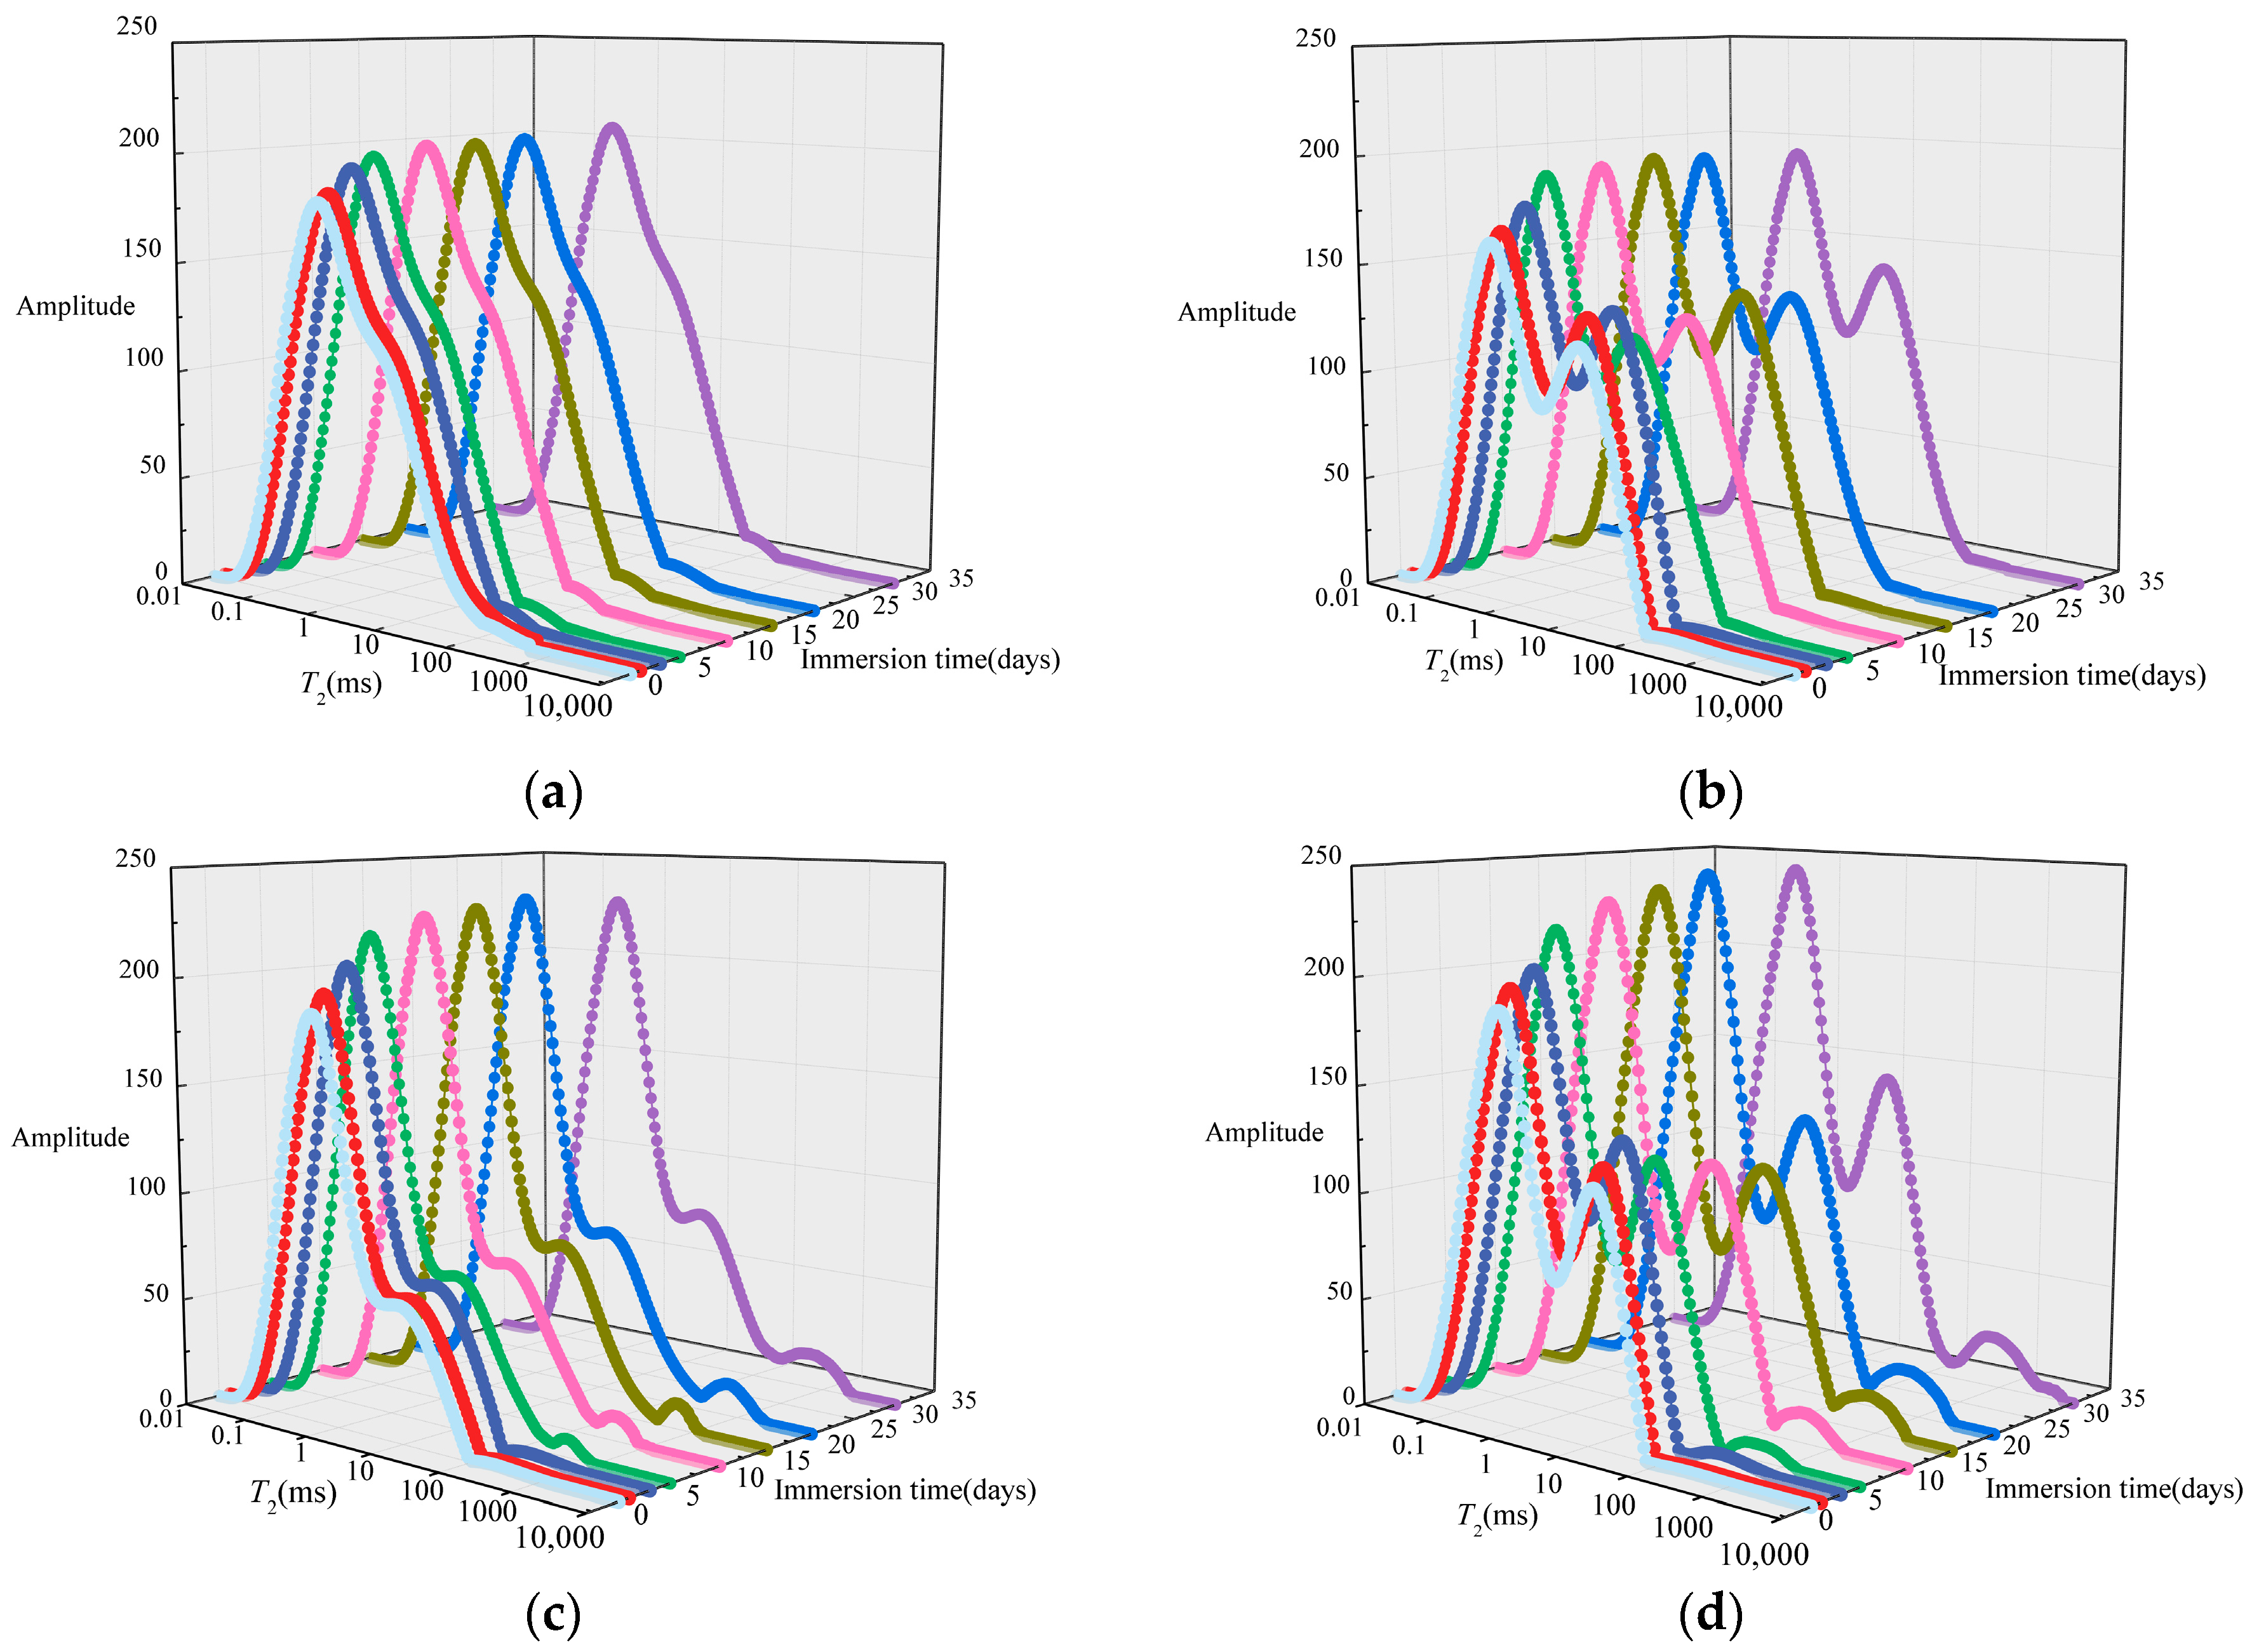
3.2. Evolution of Pore-Fracture Structure

3.2.1. Evolution Characteristics of Pore Size

It can be seen from Formula (2) that the T2 spectra obtained from NMR can better reflect the characteristics of the internal pore structure in coal sample. The pore size is positively correlated with the transverse relaxation time T2. Large pore sizes correspond to larger T2 values, and conversely, small pore sizes correspond to smaller T2 values. The size of the amplitude of the T2 spectrum represents number of pores corresponding to a particular size, that is, the smaller the amplitude, the smaller the number of pores, and vice versa. The T2 spectra of coal samples soaked by distilled water and salt solutions are shown in Figure 5. It can be seen from Figure 5 that the transverse relaxation time (T2) is divided into three relaxation peaks in the attenuation range. Since the attenuation constant is proportional to the pore size, the three relaxation peaks from left to right correspond to micropores (pore size < 100 nm), mesopore (100 nm < 10,000 nm), macropores or fractures (pore size > 10,000 nm). Research indicated that the pore structure can be classified according to the pore size based on the T2 curve [38]. In this study, two points T2 = 2.5 ms and T2 = 50 ms were used to classify the pore structure. Areas with T2 values less than 2.5 ms correspond to small pores, areas with T2 values between 2.5 ms and 50 ms correspond to medium pores and areas with T2 values greater than 50 ms correspond to large pores or fractures. Among them, the small pores are defined as the adsorption pore. The middle pores and the large pores are defined as the seepage pore, which is the channel for fluid to move freely.
By observing the T2 spectra of coal samples, it can be found that the amplitude of the first peak is the largest, followed by the second peak, and the amplitude of the third peak is the lowest, indicating that the number of small pores in coal matrix is large and well-developed, and the number of large pores is small and poorly developed. For the same sample, with the increase in soaking time, the amplitude of three relaxation peaks is significantly enhanced. The location of the relaxation peak is related to the pore size, and the amplitude of the peak is related to the number of corresponding pores. The increase in the T2 spectra amplitude indicates that the number of pores in the coal matrix increases with the prolongation of soaking time, while the transverse relaxation time range becomes wider, indicating that pores with smaller or larger sizes have been generated. By comparing the T2 spectra of samples soaked in distilled water and salt solution of different concentrations, it can be seen that the number of pores and fractures in coal increased after salt solution immersion, and the number of large pores in coal treated with high concentration increased the most. With the increase in soaking time, the originally isolated peaks gradually connected, indicating that the connectivity between pores of different sizes was enhanced, and salt solution immersion promoted the opening of closed pores, which accelerating the connection between pores and fractures.

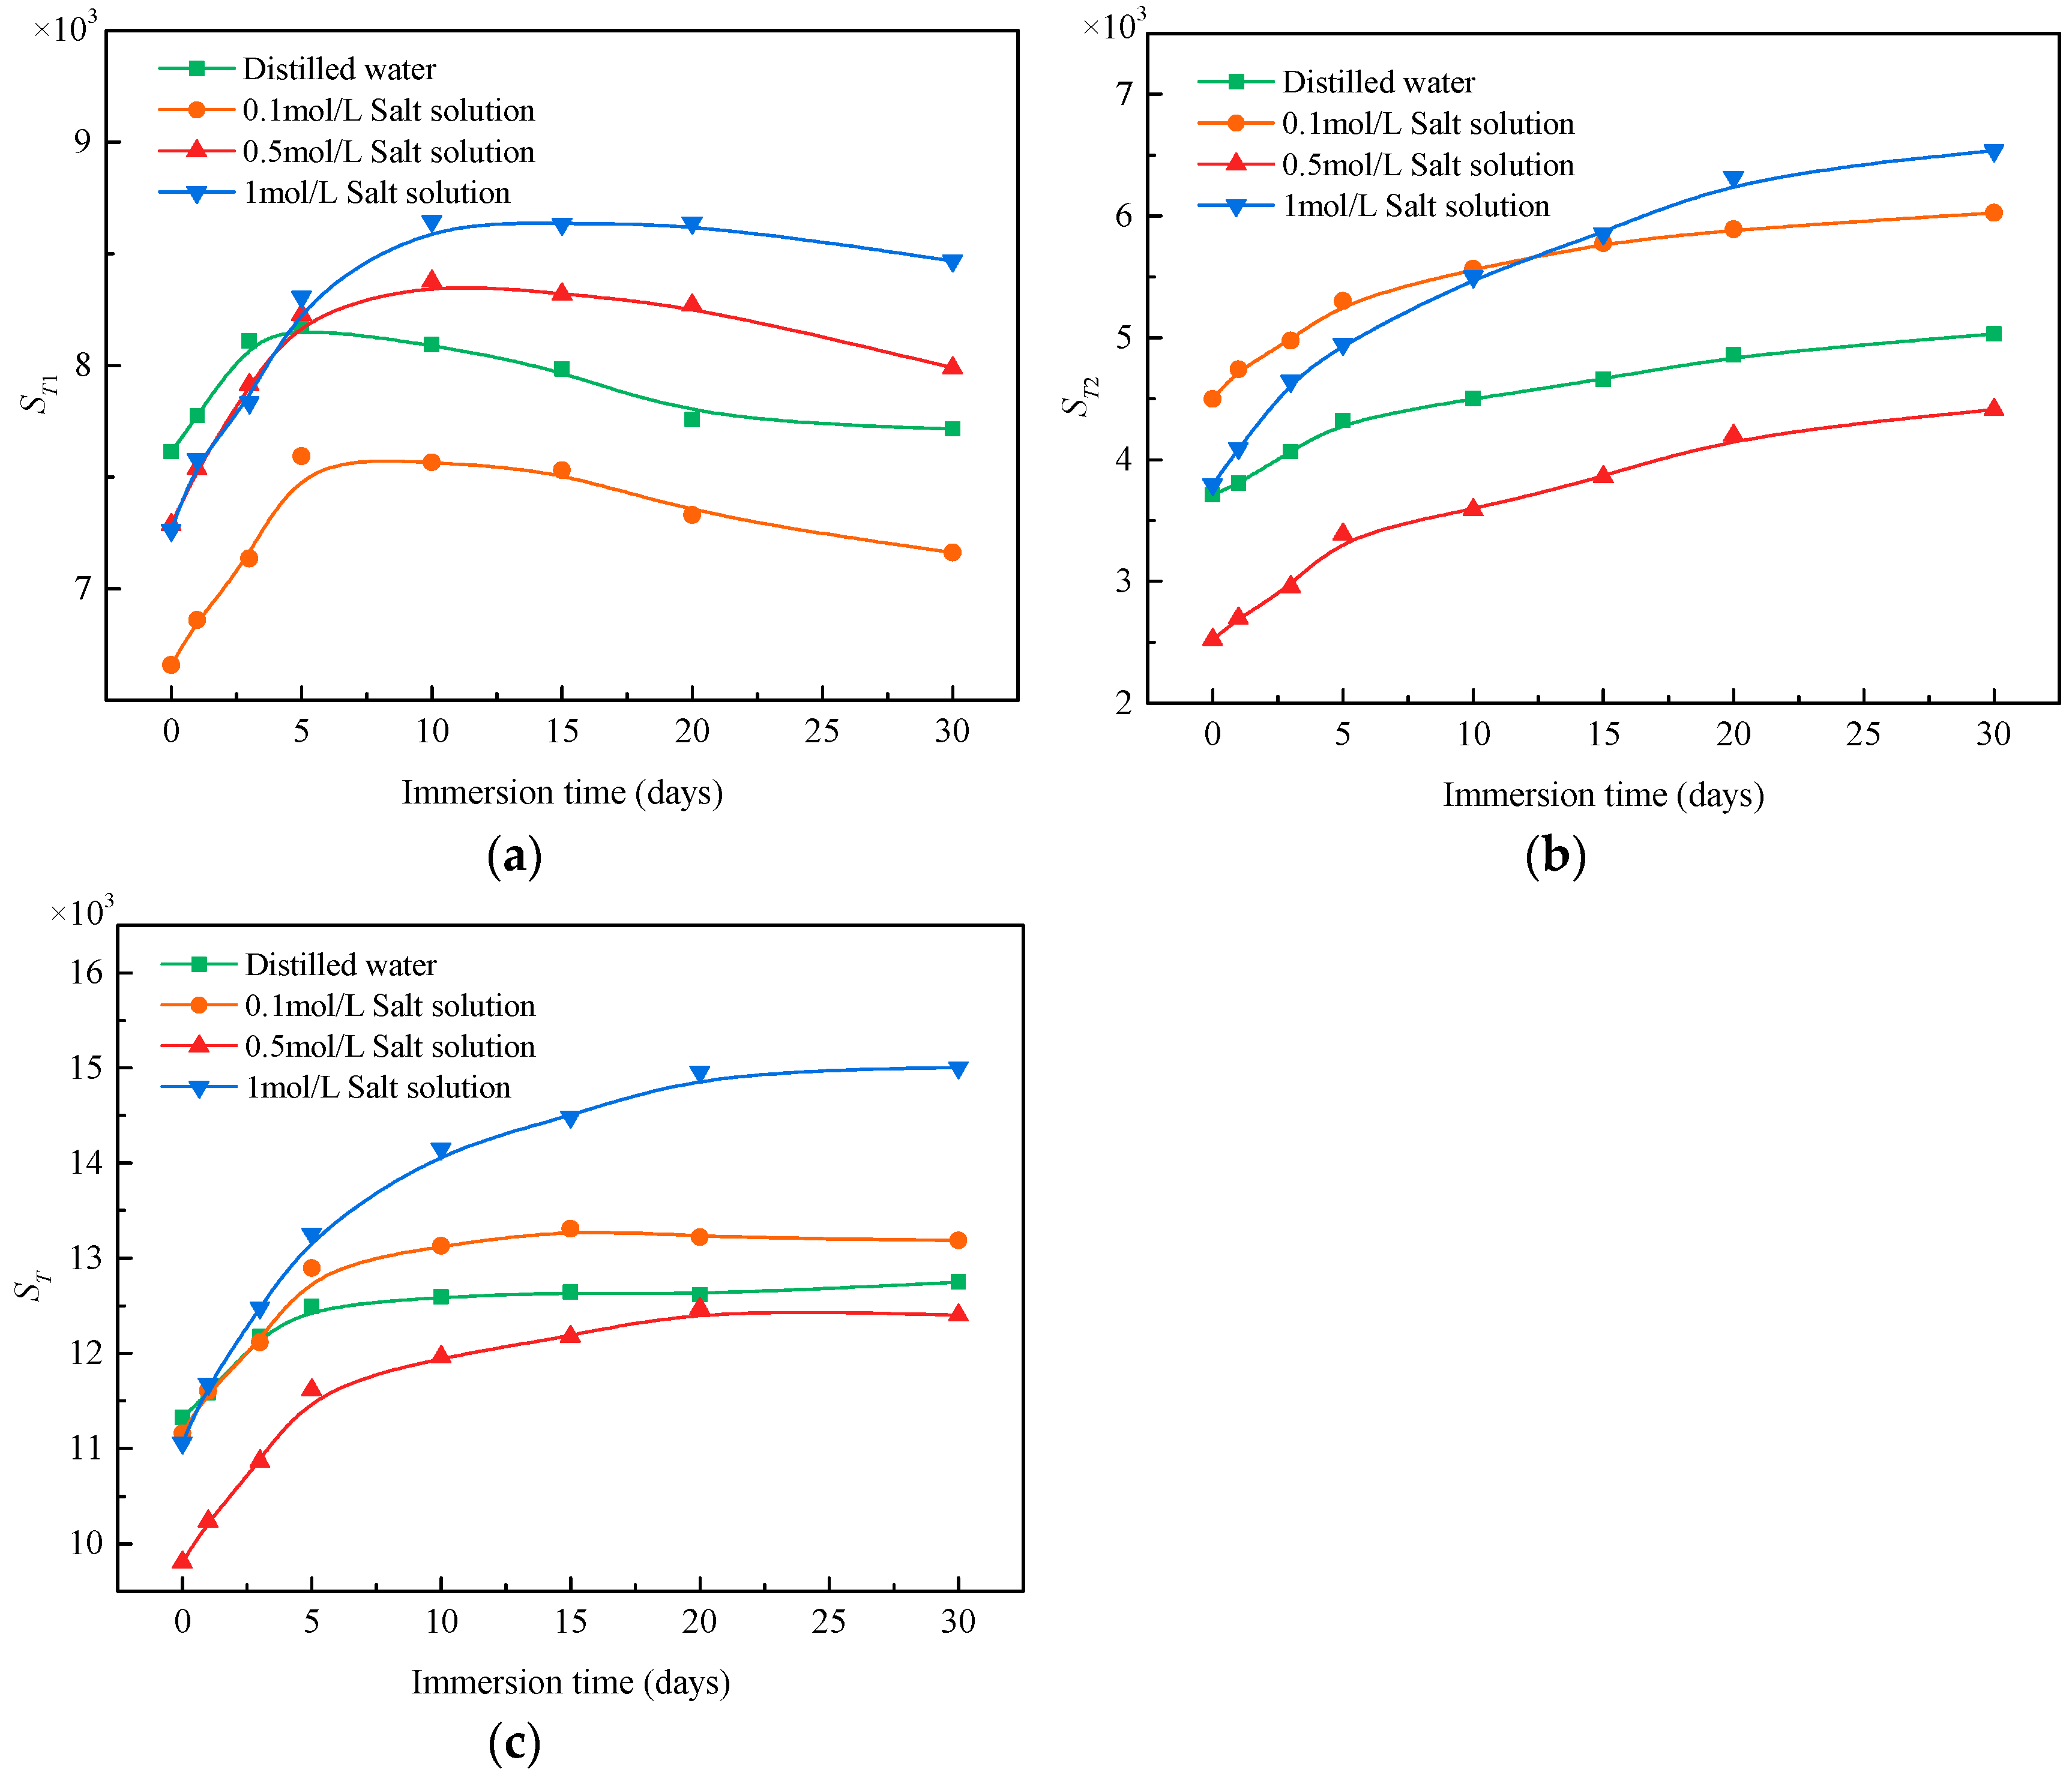
3.2.2. Variation in Pore Number

Under the physical and chemical action of salt solution, the minerals inside the coal sample are dissolved and softened, resulting in the change in pore structure. The increasing number of pores and fractures aggravated the damage of coal samples. The area of T2 spectra obtained by NMR reflects the number of pores with different size [24]. The sum of the amplitude of the T2 spectra under different relaxation times is defined as the area of the T2 spectra. The number of total pores (ST) is the total area of the T2 spectra. The number of adsorption pores (ST1) is the curve area with T2 value less than 2.5 ms, and the number of seepage pores (ST2) is the curve area with T2 value greater than 2.5 ms.
The relationship berween immersion time and the number of different types of pores in coal under the action of distilled water and salt solutions are shown in Figure 6. In general, the number of different types of pores increased to different degrees after 30 days of immersion in distilled water and salt solution. After soaking for 30 days, the number of adsorption pores in distilled water, 0.1 mol/L salt solution, 0.5 mol/L salt solution and 1 mol/L salt solution increased by 1.34%, 7.56%, 9.65%, and 16.62%, respectively. The number of seepage holes increased by 35.66%, 34.03%, 75.03%, and 72.27%, respectively. The total pore number increased by 12.59%, 18.23%, 26.45%, and 35.72%, respectively. The number of seepage pores and total pores increased with soaking time. However, the number of adsorption pores increased first and then decreased with soaking time. The main reason for this phenomenon is that the small pores are gradually connected to form larger pores in the late stage of immersion. The pore structure in the coal matrix provides storage space for water immersion. Under the same saturated water condition, the amount of water entering the coal matrix is affected by pore parameters such as pore number and pore connectivity. There are relatively many mineral particles in the coal with small degree of dissolution, which affects the openness of pore space and the saturation degree of pore water. The seepage space contains large pores and fractures. The increase in the number of seepage pores means the increase in large pores or cracks, which is the main reason for the weakening of coal properties.

4. Discussion

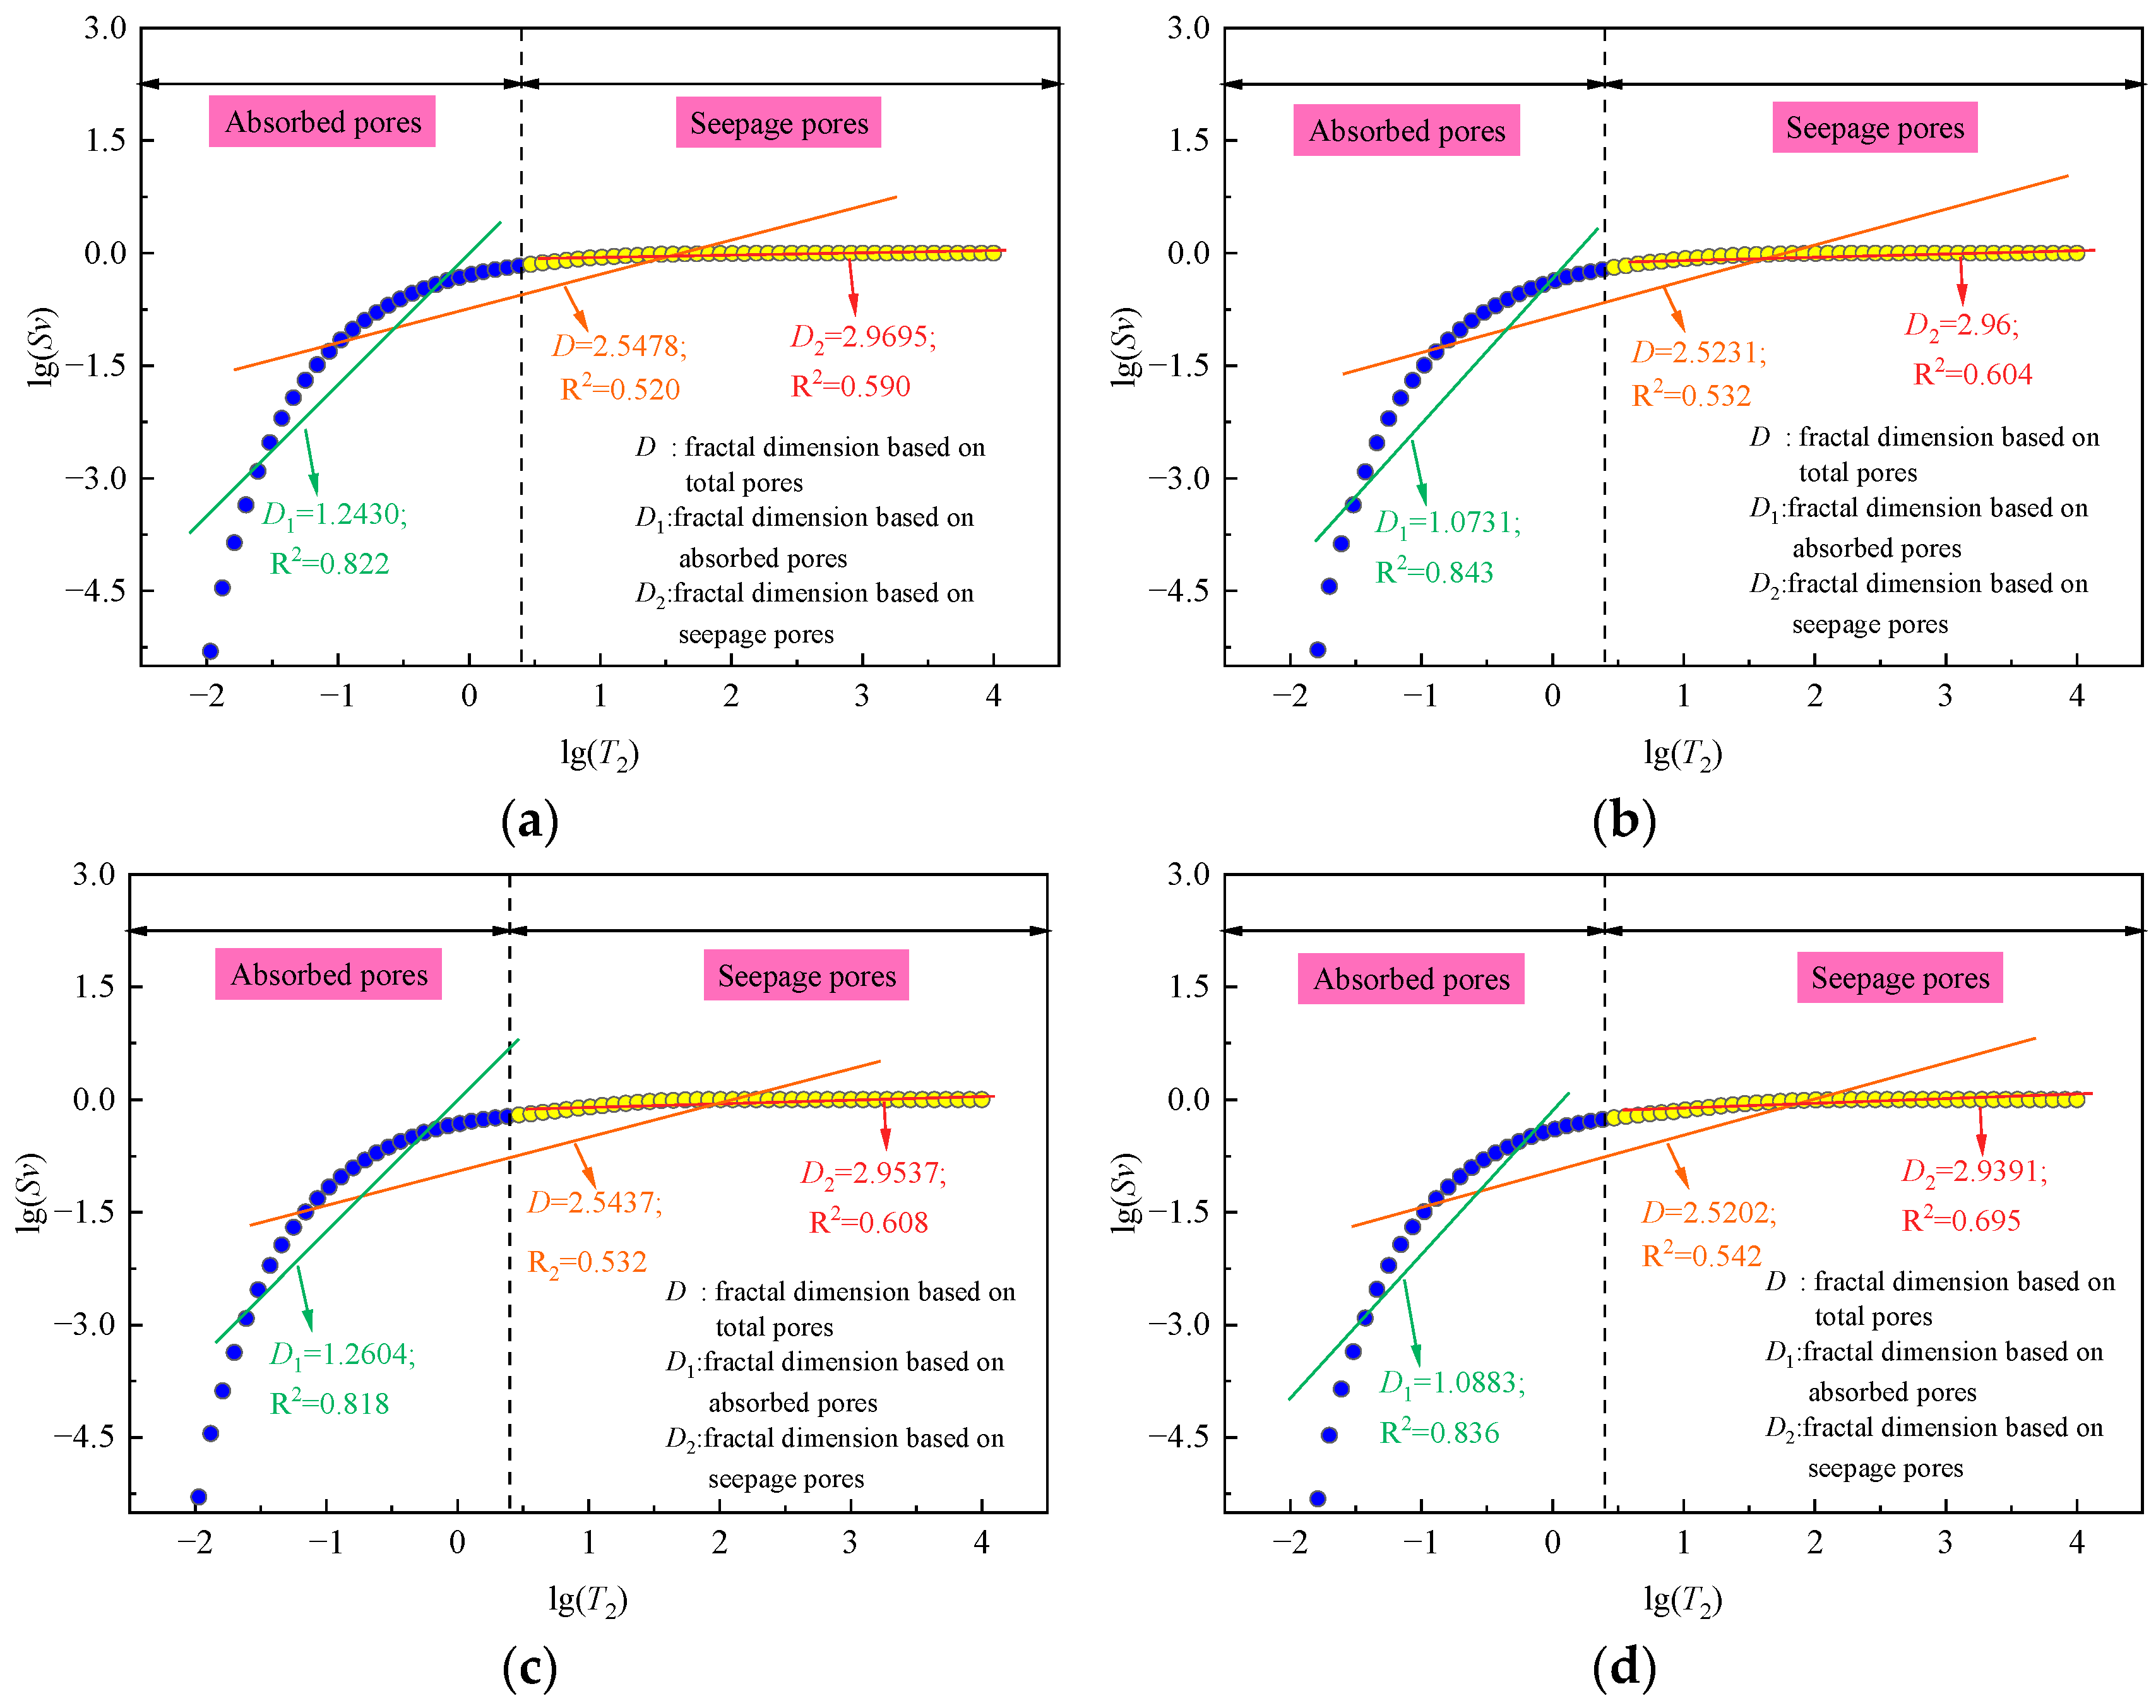
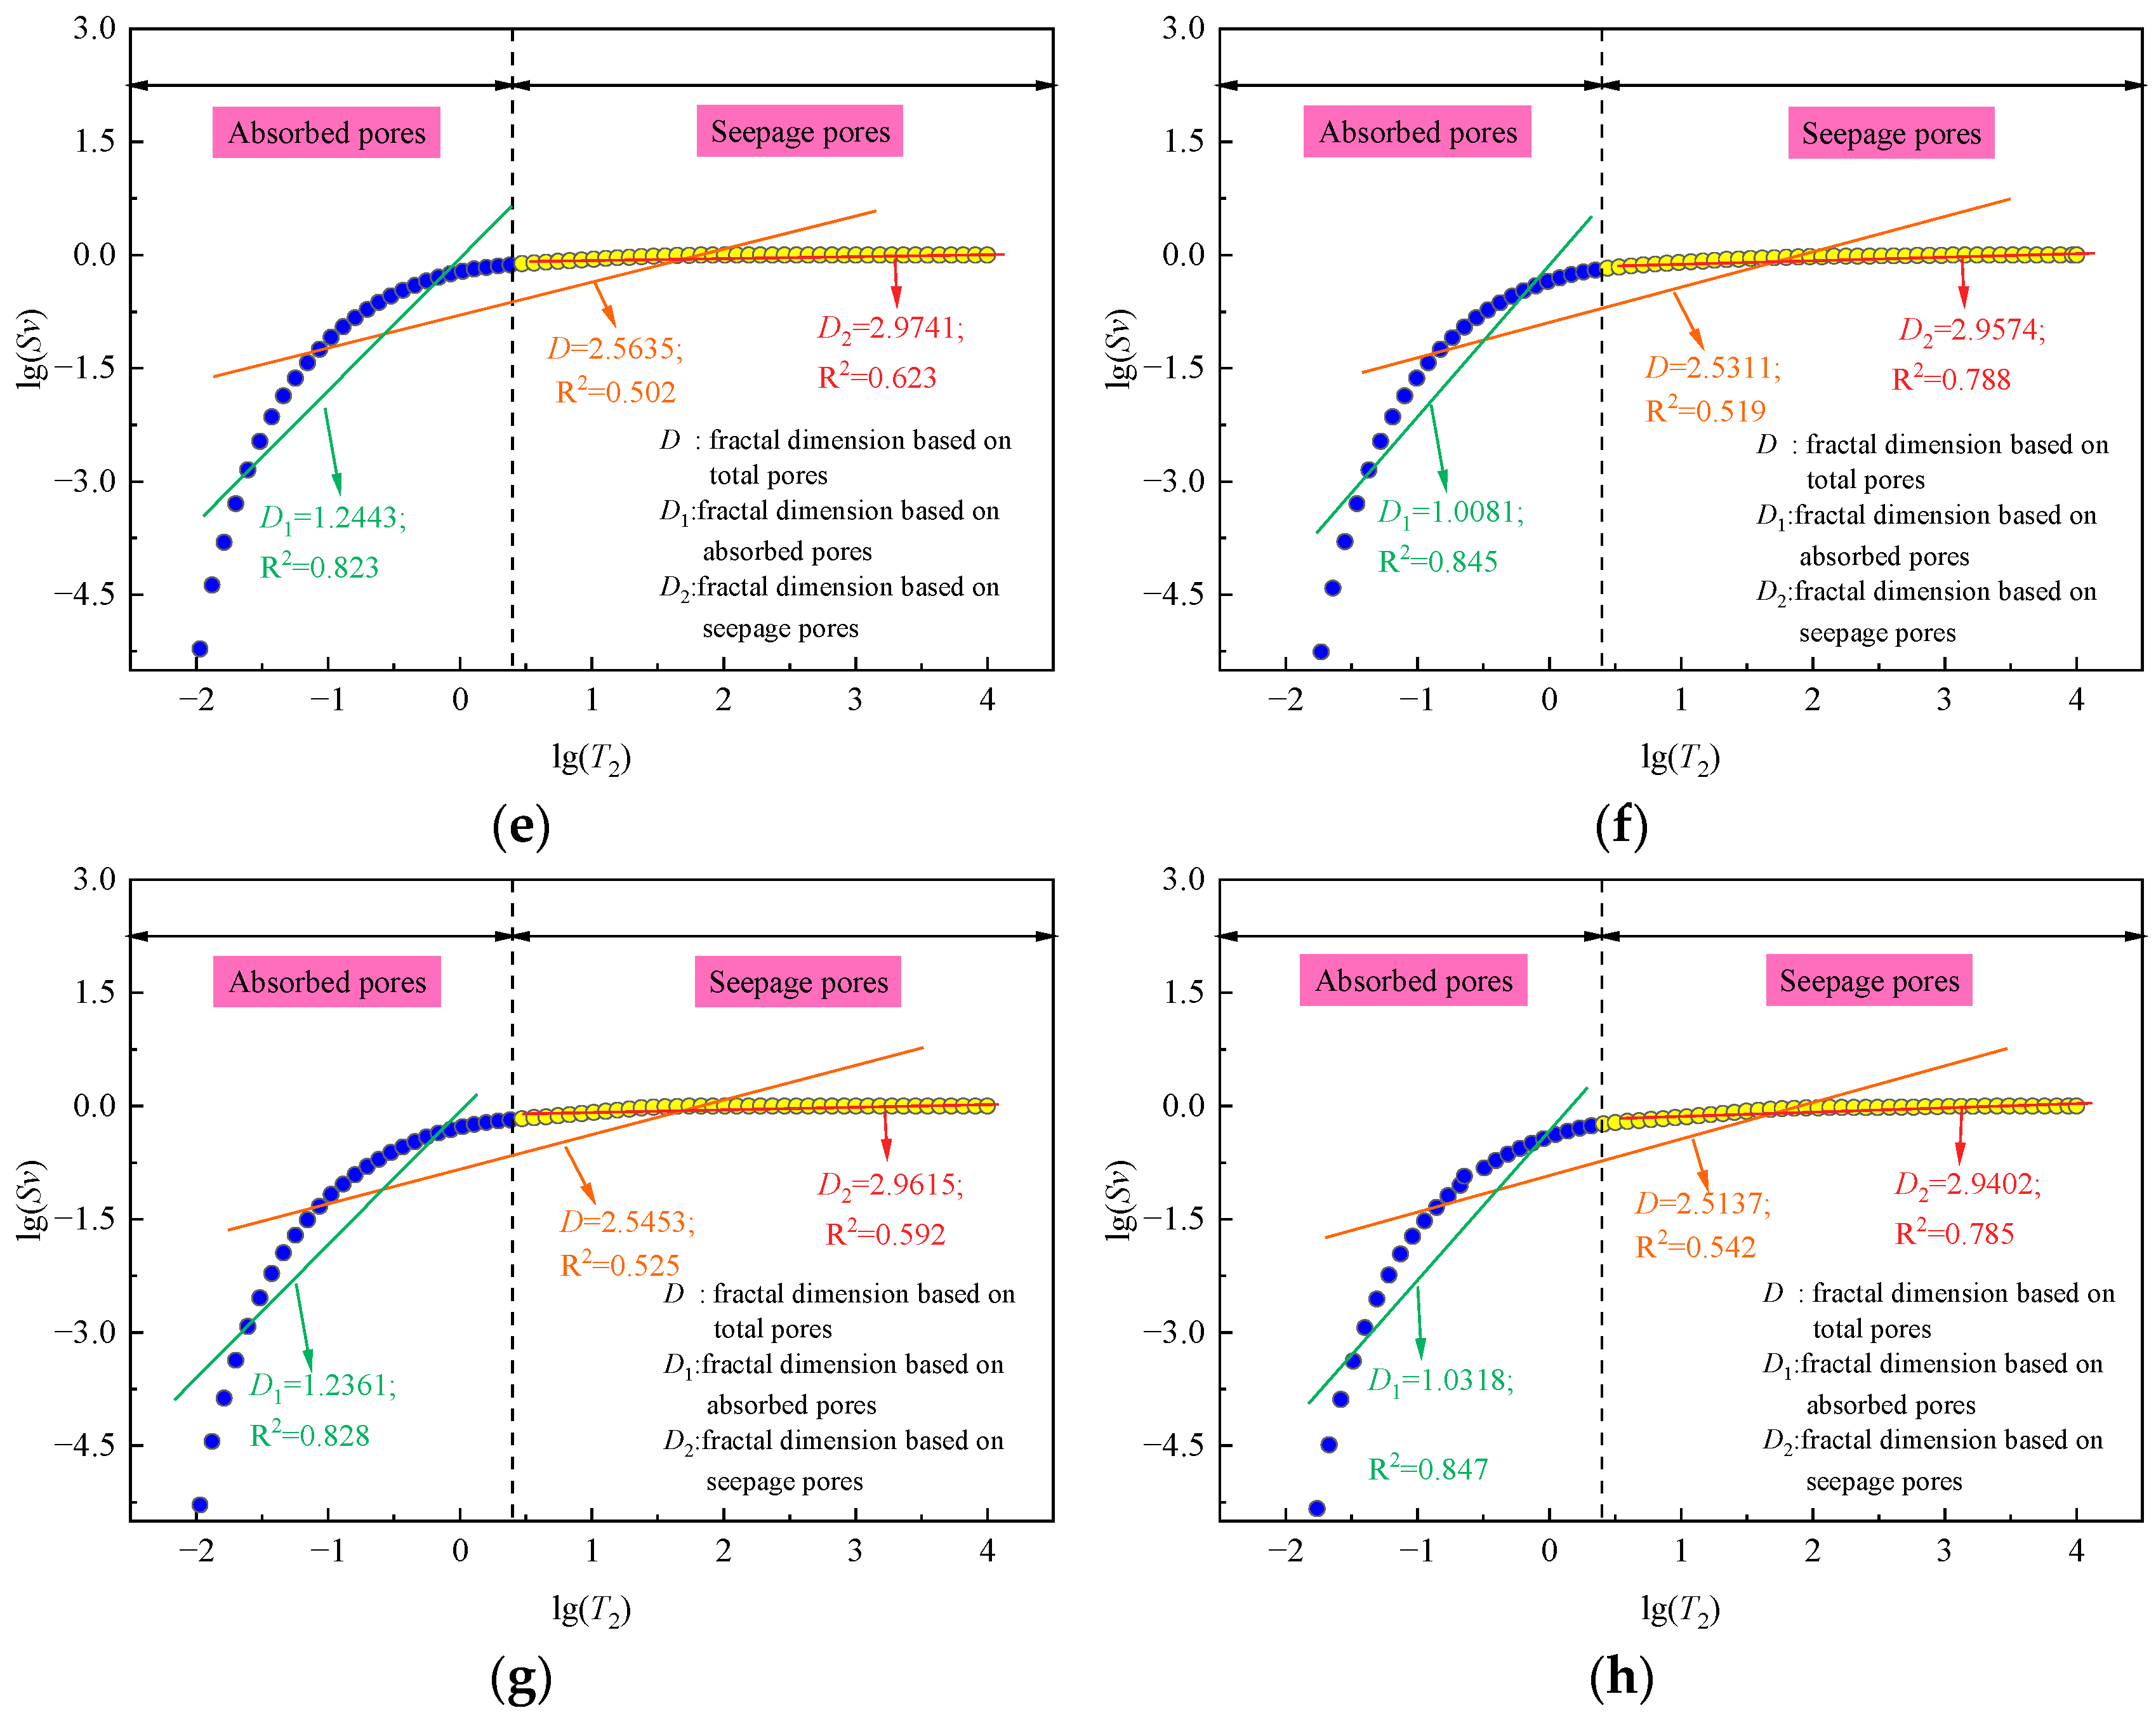
4.1. Fractal Characteristics

According to the fractal theory [39,40], if the pore structure in the coal sample follows the fractal law, the relationship between the pores number and the radius is the following power function:
N > r = r r max P r d r = a r D
where rmax is the maximum pore radius of coal; P(r) is the probability density function of the pore size distribution; a is the proportional coefficient; and D is the fractal dimension of the pore structure.
The expression of the probability density function can be obtained by derivation of Formula (4):
P r = d N r d r = D a r D 1
The cumulative pore volume with a pore radius less than r can be expressed as:
V < r = r min r P r V 0 d r
where V0 is the volume of a single pore, r3 for square pores and 4πr3/3 for spherical pores, and rmin is the minimum pore radius.
It can be obtained by integrating Formula (5) into Formula (6):
V < r = a r 3 D r min 3 D
Then the total pore volume inside the coal sample is:
V < r max = a r max 3 D r min 3 D
The pore volume fraction with pore radius less than r in the coal sample is
S v = V < r V < r max = r 3 D r min 3 D r max 3 D r min 3 D
Since the minimum pore radius (rmin) is much smaller than the maximum pore radius (rmax), Formula (9) can be simplified as
S v = r 3 D r max 3 D
In NMR theory, the transverse relaxation time T2 can be expressed as:
1 T 2 = 1 T 2 B + ρ S V + 1 T 2 D
where T2B is the volume relaxation time of the fluid; S is the surface area of the pore; V is the pore volume; ρ is the T2 relaxation strength of the particle surface; and T2D is the relaxation time of pore fluid caused by gradient magnetic field diffusion.
Usually, T2B is between 2 and 3 s, which is much larger than T2. In addition, when the magnetic field is uniform (the corresponding magnetic field strength is very low) and the echo time is short enough, T2D can also be ignored. Therefore, the Formula (11) can be simplified as:
1 T 2 = ρ S V = F s ρ r
where Fs is the geometric parameter related to the pore shape, for spherical pores, Fs = 3, for cylindrical pores, and Fs = 2; r is the pore radius.
Substituting Formula (12) into Formula (10)
S v = T 2 T 2 max 3 D
where Sv is the percentage of the cumulative pore volume with transverse relaxation time less than T2 in the total pore volume.
Taking the logarithm of both sides of Formula (13), a fractal theoretical model characterized by the value of T2 can be obtained:
lg S v = 3 D lg T 2 + D 3 lg T 2 max
According to Formula (14), the linear relationship between lg(Sv) and lg(T2) indicates that the pore structure has fractal characteristics. By fitting the experimental data, the linear relationship between lg(Sv) and lg(T2) was obtained as Formula (15).
lg S v = a lg T 2 + b
The expression of fractal dimension can be obtained by Formula (16):
D = 3 a
Figure 7 and Table 4 show the fractal dimension characteristics of coal sample calculated based on T2 spectra. The logarithmic relationship between Sv and T2 can be divided into two sections. As mentioned above, with T2 = 2.5 ms as the node, the pores in coal sample are divided into adsorption pores and seepage pores. The fractal dimensions based on adsorption pore and seepage pore were calculated in the left and right sections of T2 = 2.5 ms.
According to the fractal theory, it is meaningful that the fractal dimension of coal pore structure is between 2 and 3. The fractal dimension based on adsorption pores is less than 2, so it does not meet the fractal characteristics, and it will not be discussed in this paper. The fractal dimension based on the total pores ranges from 2.51 to 2.57, and the fractal dimension of seepage pores ranges from 2.93 to 2.98, which shows fractal characteristics. The linear fitting correlation coefficient based on the fractal dimension of the seepage pore (0.59–0.788) is larger than that based on the total pore (0.502–0.542), indicating that the pore distribution of the seepage pore has more obvious fractal characteristics.
The fractal dimension of the pore reflects the complexity of the structure, and the higher the fractal dimension, the stronger the anisotropy and more complex of the pore structure, and vice versa. Figure 8 reveals that the fractal dimension of pore structure of coal sample is related to immersion parameter. The fractal dimension is negatively correlated with the immersion time. The longer the immersion time, the lower the fractal dimension of pores. Under the same immersion time, the fractal dimension of pore structure of coal samples immersed in salt solution decreases faster than that immersed in distilled water. It shows that the damage effect of salt solution immersion on coal sample is greater than that of distilled water.

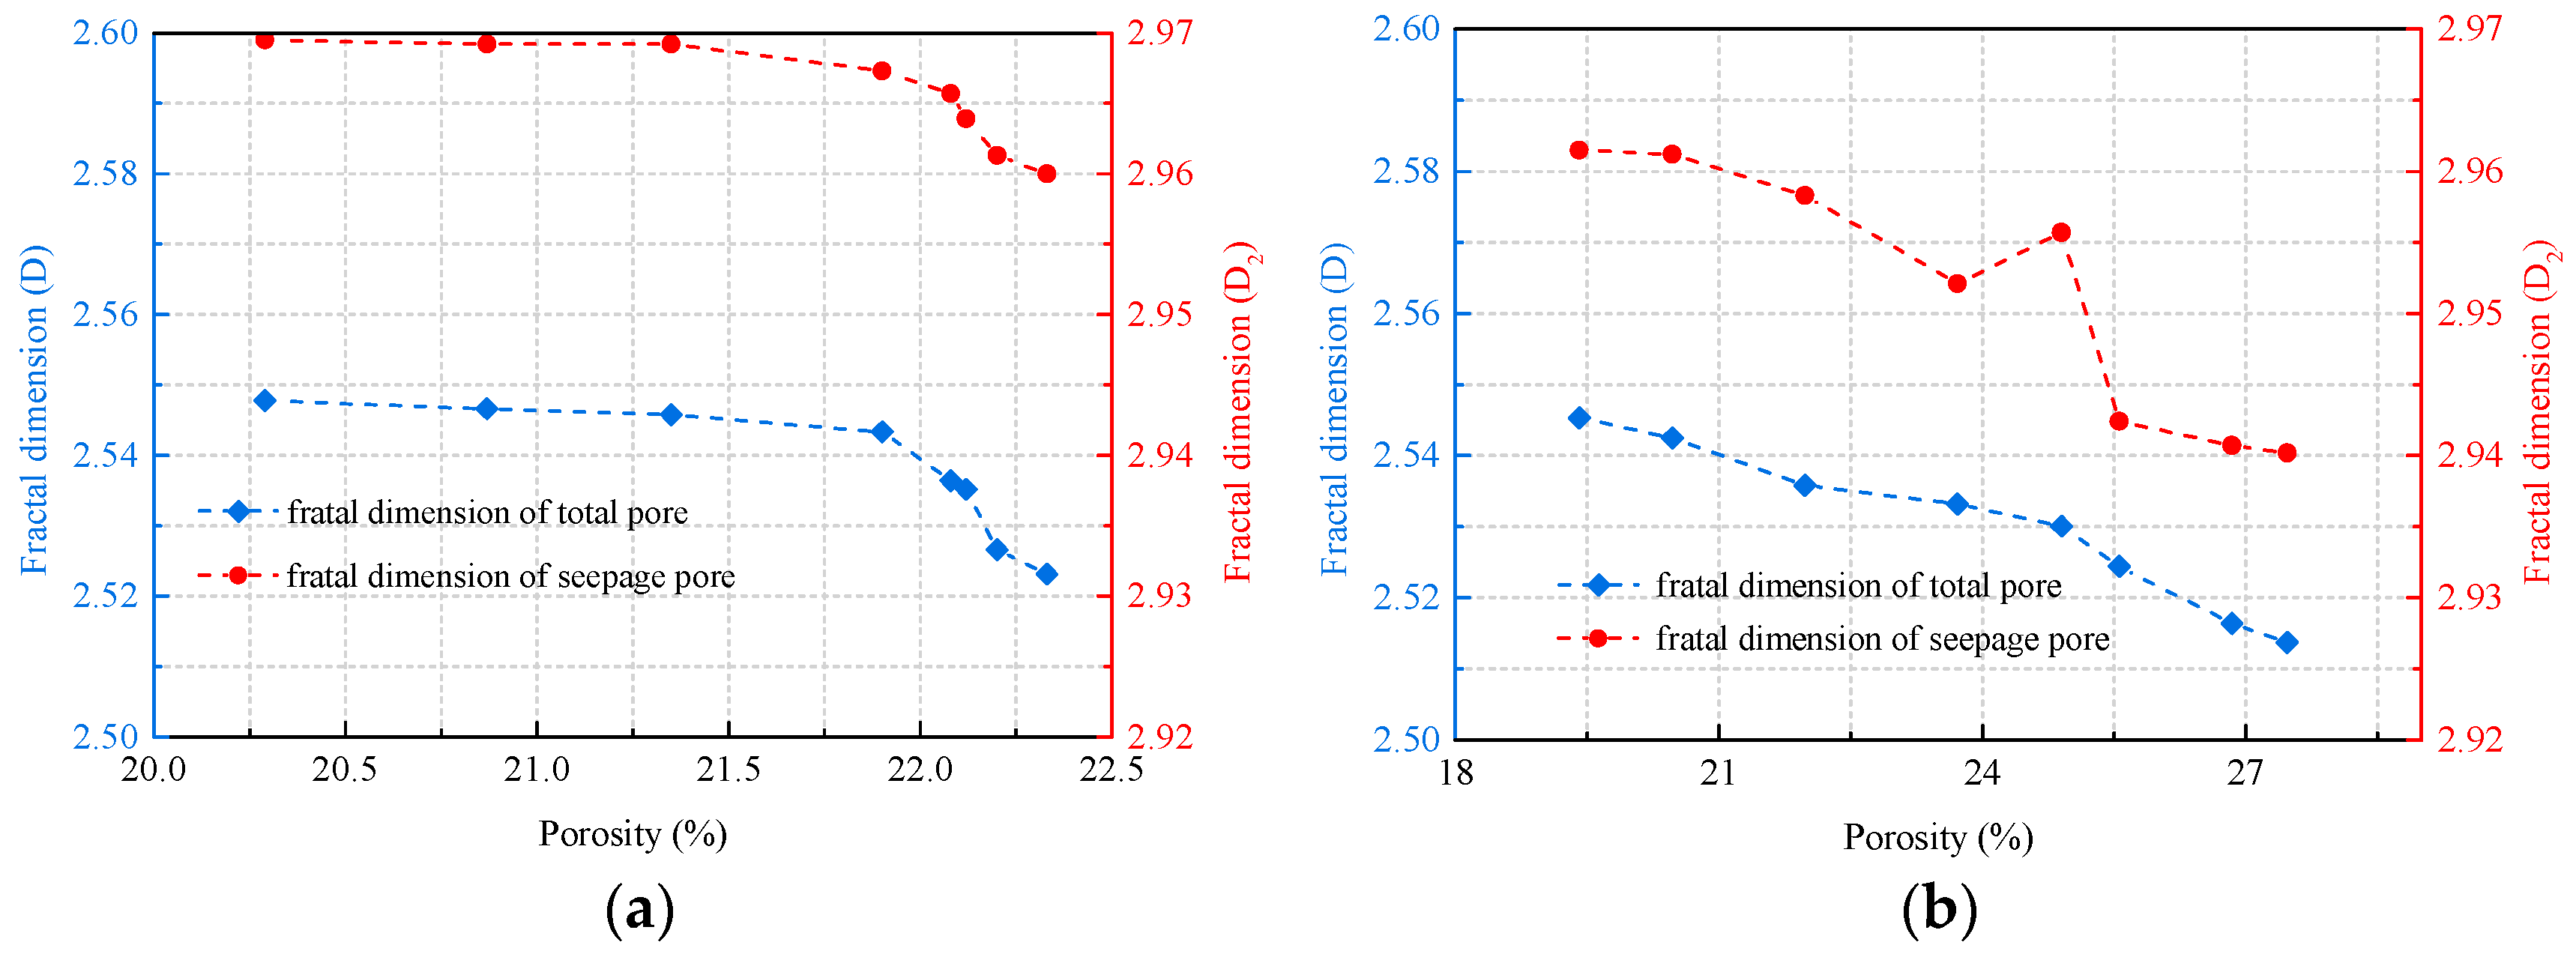
4.2. Relationship between Porosity and Fractal Dimension

The seepage pores and total pores in coal samples show obvious fractal characteristics. Figure 9 shows the relationship between the fractal dimension and the porosity. It is obvious that large fractal dimensions correspond to small porosity, and vice versa, small fractal dimensions correspond to large porosity. The smaller the fractal dimension is, the more uniform the pore structure is. The increase in pore connectivity leads to greater structural damage of coal samples. By comparing the fractal dimension of pore structure of coal samples soaked in salt solution and distilled water, it can be obtained that the decrease in fractal dimension under salt solution immersion is greater than that under distilled water immersion, which indicates that the pore structure anisotropy of coal sample is smaller and the pore connectivity is larger after salt solution immersion.

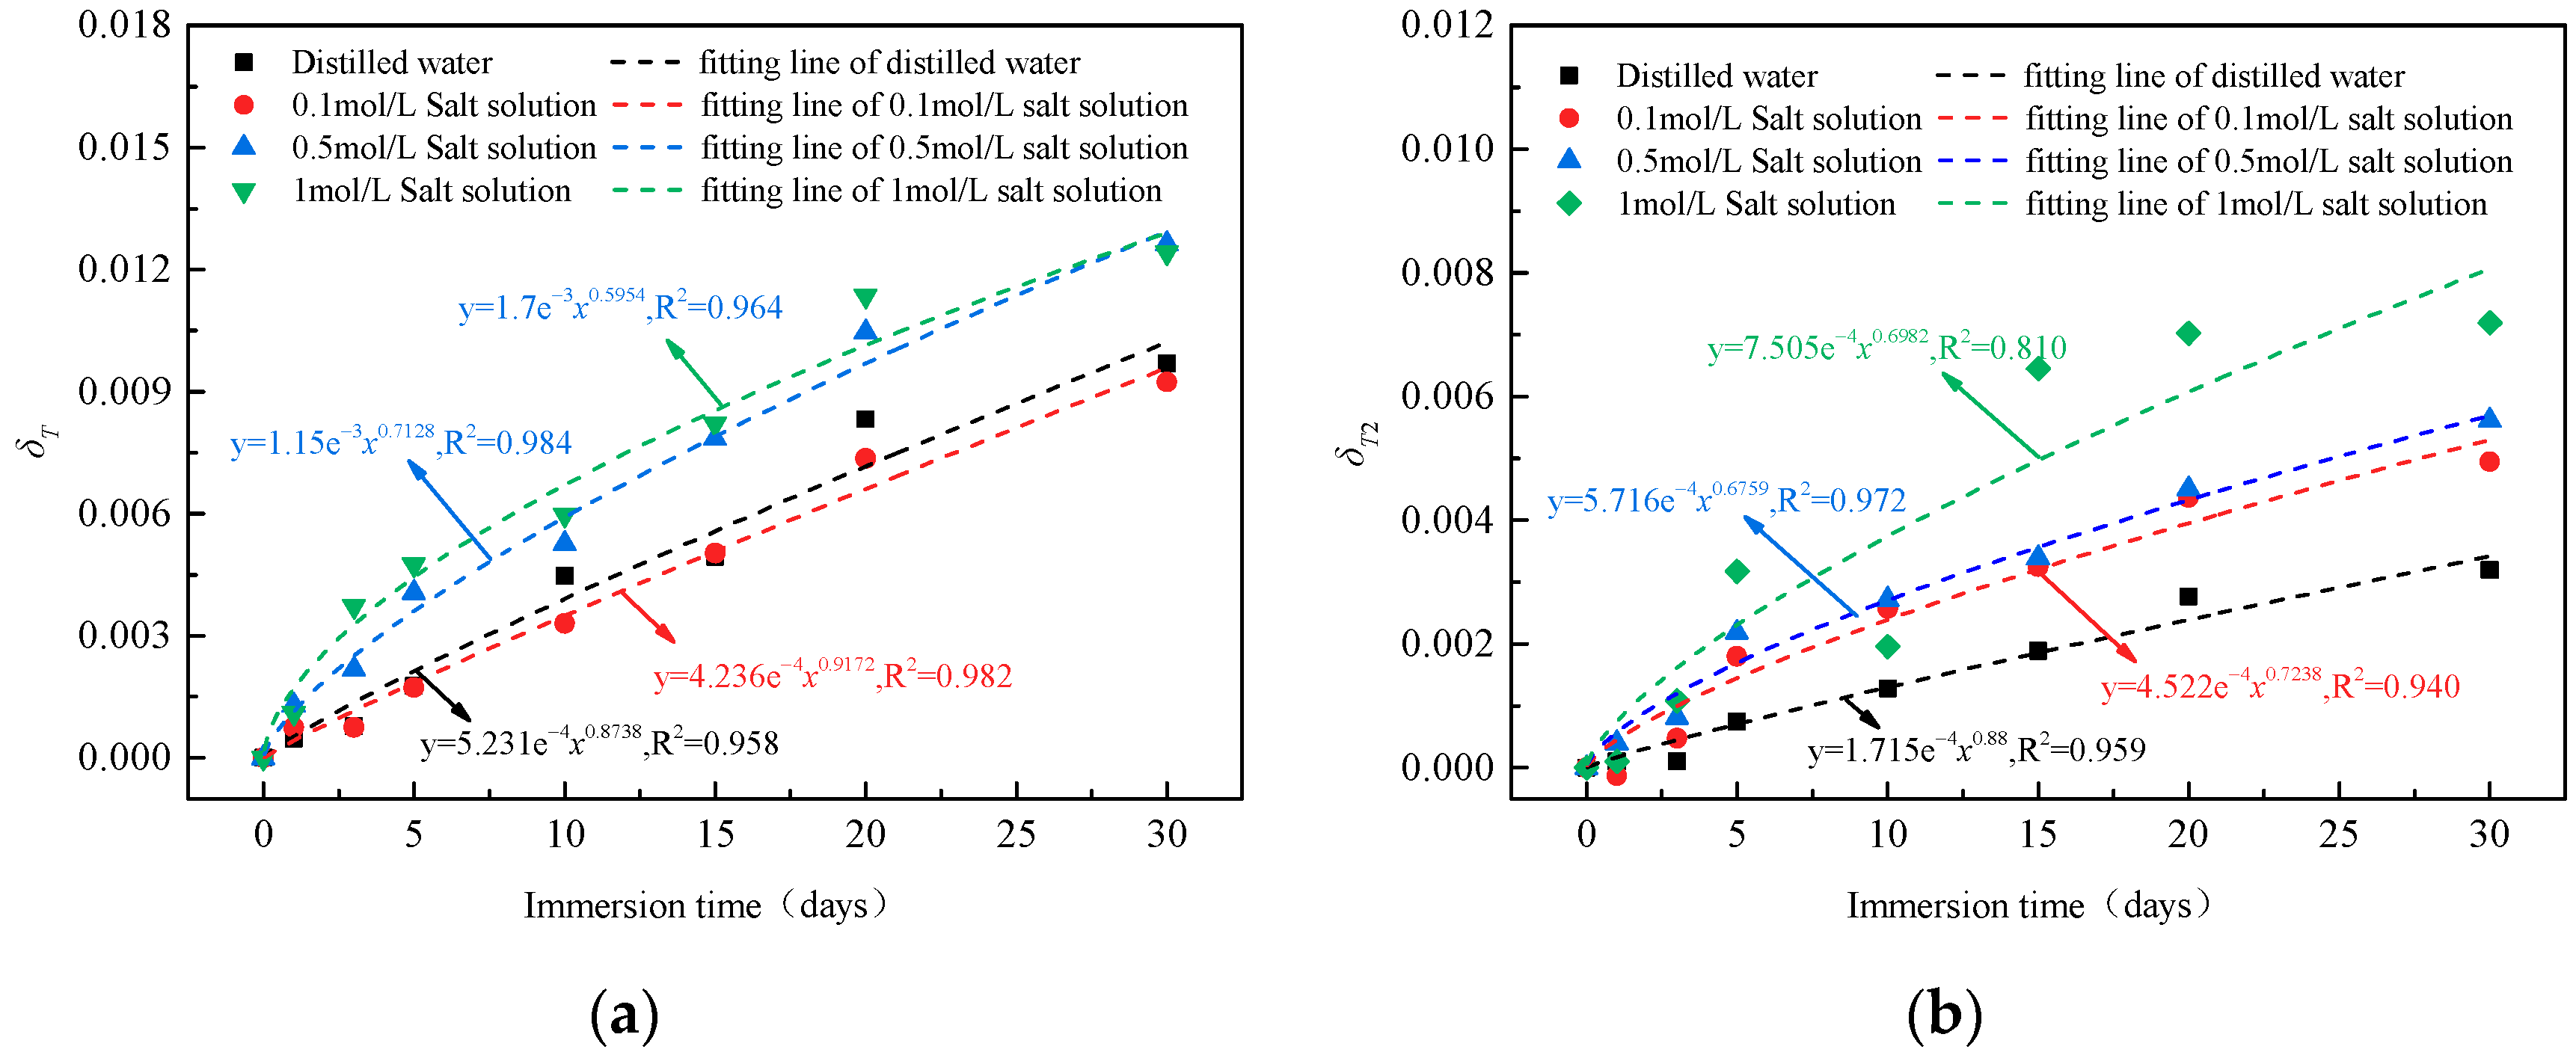
4.3. Diachronic Evolution of Damage

Under the physical and chemical action of salt solution, the minerals inside the coal sample are dissolved and softened, leading to the change in pore structure. In Section 4.1, it is explained that the pore space of the total pore and the seepage pore have fractal characteristics, so the fractal dimension of the pore structure will also change. The damage variable δi based on the fractal characteristics of the total pore and seepage pore is defined as follows:
δ i = D i 0 D i t D i 0 × 100 % i = T , T 2 ;   t = 1 ,   3 ,   5 ,   ,   30
where D is the fractal dimension; i represents different types of pores, in which T represents total pores, T2 represents seepage pores; and t is immersion time, days.
The damage variables of coal samples soaked in distilled water and salt solutions of different concentrations are shown in Table 5.
With the increase in soaking time, the δT and δT2 of coal samples soaked by distilled water and salt solution increase continuously, which indicated that the effect of water and salt solution can aggravate the deterioration of coal structure.
As shown in Figure 10, the damage degree of coal samples represented by different types of pores is positively correlated with soaking time. It directly shows that the longer the soaking time, the more obvious the pore structure changes, and the greater the deterioration degree of mechanical property. Comparing the δT of coal samples soaked in distilled water and salt solution with different concentrations, it can be seen that the δT value of coal soaked in 1 mol/L salt solution is the largest. In general, the damage degree based on the total pore increased with the increase in concentration. Except there is a slight difference between distilled water and 0.1 mol/L salt solution. The δT2 increases with the increase in the concentration of salt solution, which indicates that the concentration of salt solution has a great influence on the formation and expansion of large pores and fractures. Research shows the development and penetration of large pores and fractures is the main cause of the failure of rock material under external load [41,42]. The fractal characteristics of seepage pores composed of large pores and fractures are more significant than those of total pores. Therefore, in practical engineering, we can use the damage variable represented by the fractal dimension of the seepage pores to analyze and evaluate the stability of coal pillars in underground mine.
The research results provide a theoretical basis for the stability evaluation of coal pillar. In order to improve the stability of coal pillar, the initiation and development of internal pores and fractures should be controlled reasonably. Specific methods are as follows: (1) the anti-seepage treatment of coal pillar can be used to effectively isolate the erosion of ions in mine water; (2) the pores and fractures developed in the coal pillar are reinforced by grouting to enhance the integrity of the coal pillar; (3) setting reasonable coal pillar size; (4) improve the external stress environment and reduce the influence of external load disturbance, among which the leaving waste rocks in the mined-out space [43] and the bolt support controling the deformation of broken rock strata in the roof are considered to be effective methods to reduce the disturbance of external stress.

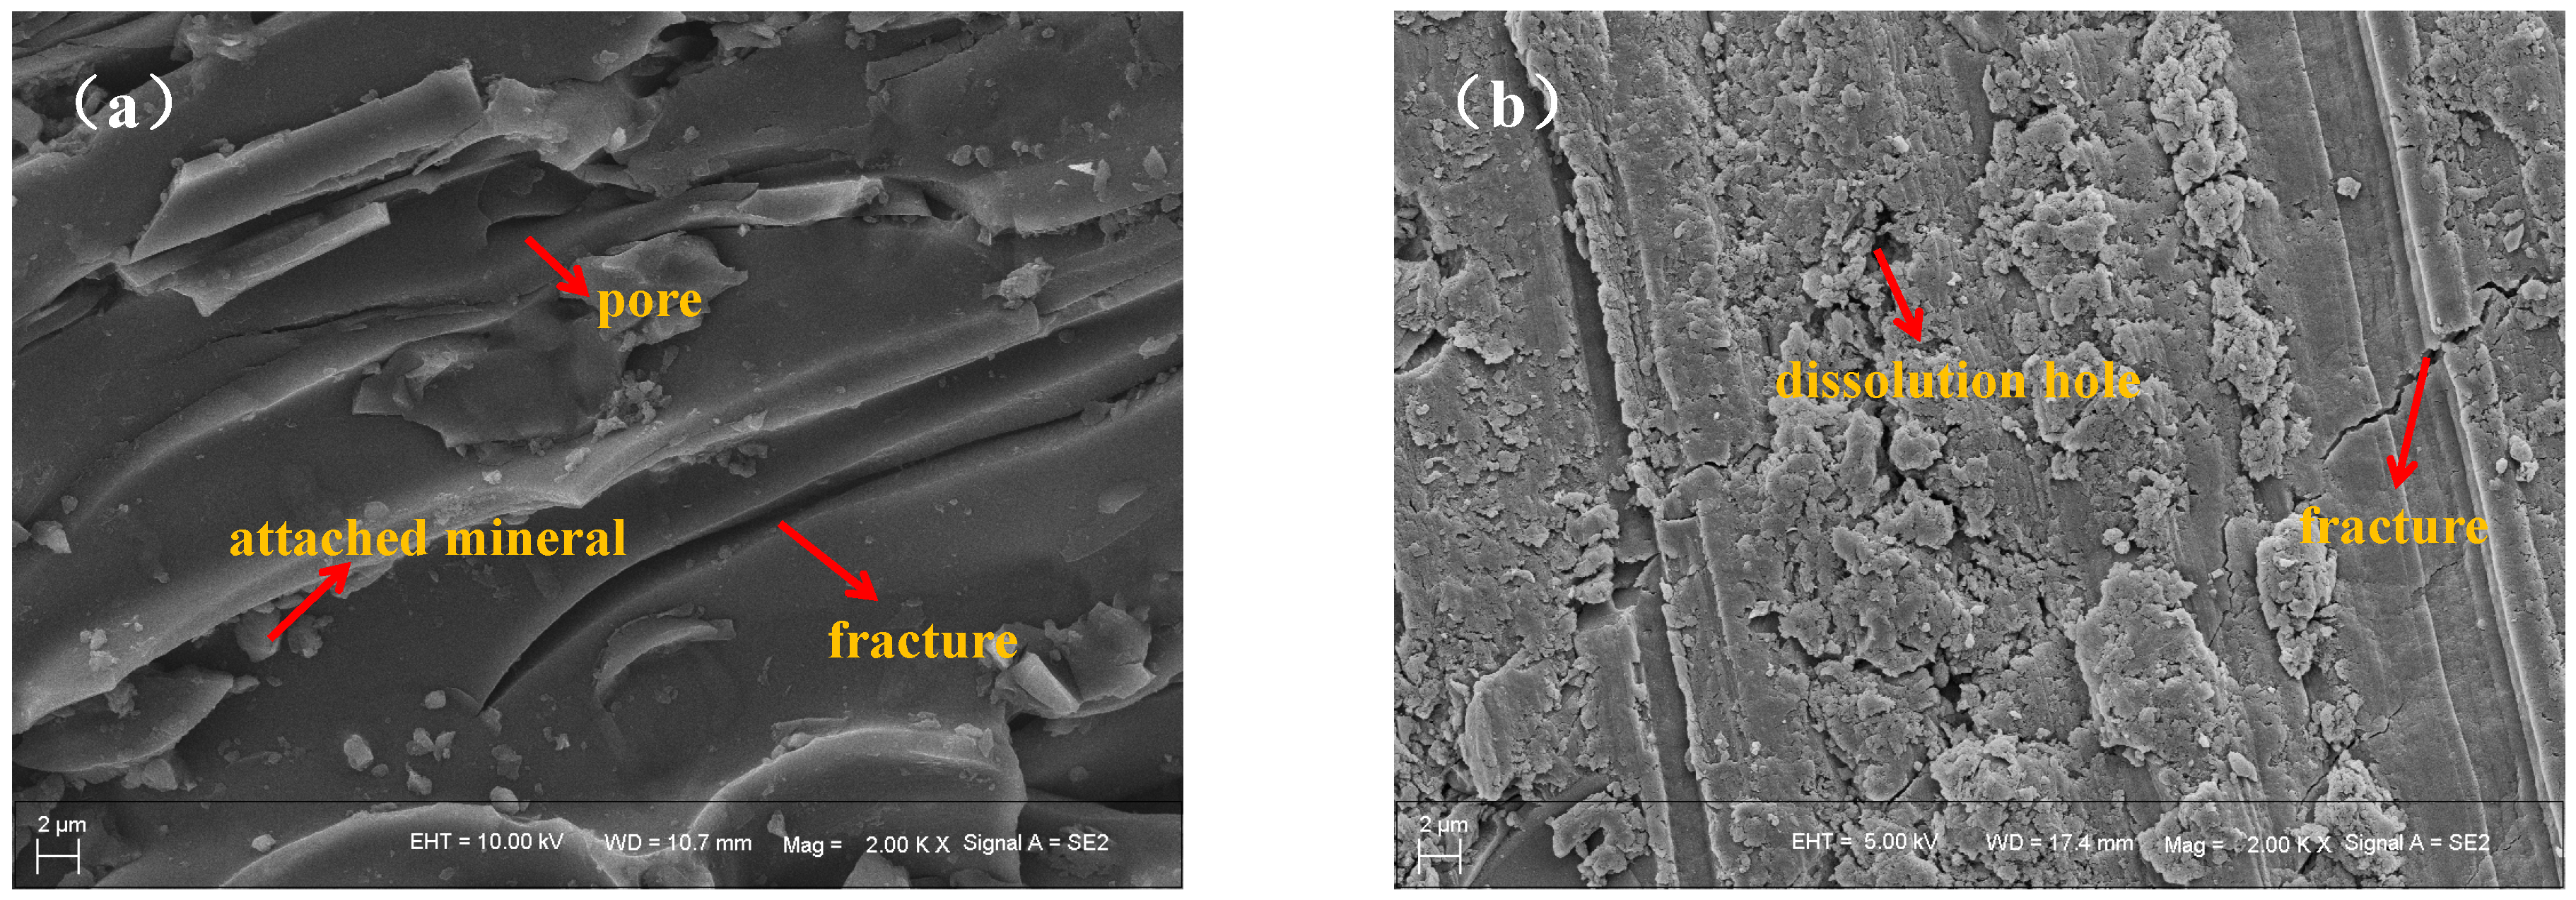
4.4. Damage Mechanism

4.4.1. Mechanism of Water Weakening

Complex physical and chemical interactions occur between the liquid and the rock when it immersed in chemical solutions. The physical interaction is when rock minerals dissolve, the lubrication effect produced by the liquid destroys the interconnection between particles. The physical interaction refers to the dissolution reaction of rock minerals and the lubrication produced by the liquid, which finally destroys the interconnection between particles. Additionally, pore water pressure creates uneven stresses within the rock, leading to the reduction in cohesion and friction. Research shows that under the action of external load, water mainly weakens the strength of coal through the following aspects: reducing fracture energy and friction, reducing particle surface tension, increasing pore pressure, and water chemical corrosion [13,44].
The mineral composition of coal is mainly clay minerals, quartz, etc. Water is transmitted into the interior of the coal through porous channels, and the air in the pore space is gradually exhausted, finally, the spaces between the pores are replaced by water. Due to the strong hydrophilicity of clay minerals, a large number of water molecules is easily to be adsorbed to its surface, thus forming a hydration film in the lattice structure of clay minerals. The thickness of the hydration film increases with the increase in water content, resulting in hydration expansion of the mineral. The non-uniform force produced by hydration expansion causes new micro-fractures in coal, and promotes the further expansion of primary fractures. When water diffuses to the surface of minerals, it will exchange ions with the adsorbed ions on the minerals surface, which will change the structure of coal, increase the porosity, and enhance the permeability. In addition, the filling material in the joint will change from solid to liquid when it encounters water, which will eventually lead to structural deterioration.

4.4.2. Mechanism of Chemical Reaction between Coal and H+ or OH in Solution

Chemical reactions are usually caused by the dissolution of rock minerals by chemical solutions. This dissolution causes changes in the microstructure, making the rock softer and weaker and increasing the porosity. The organic functional groups and minerals in coal can be significantly changed by acid and alkali solution. The kaolinite mineral in coal can react with H+ or OH (as shown Formulas (18) and (19)). The quartz mineral is an acidic oxide and can be effectively dissolved in alkaline solution. The chemical reaction between H+ or OH and the minerals in the coal sample dissolves the microstructure surface, resulting in the generation pores and fractures. In order to clarify the effect of salt solution on the microstructure of coal samples, SEM experiments were carried out on the coal samples that in natural state and soaked in 0.1 mol/L salt solution for 30 days. The microscopic morphology of coal samples in natural state and after salt solution immersion is shown in Figure 11. In the natural state, the mineral particles in coal samples are closely connected, and irregularly shaped pores or fractures are scattered on the surface of the structure. After salt solution immersion, there are a small number of mineral particles inside the sample, which distributed in flakes or blocks. Due to the dissolution of the salt solution, the edges of the mineral particles gradually become blurred, and the pore-fracture structure inside the sample changes. The dissolution of the mineral particles gradually reveals the pores that were originally blocked by the particles. Micro-cracks and pores developed and connected to form large pores and fractures. Internal fractures are interconnected, causing the matrix structure to become loose and the number of pores to increase.
Al 2 O 3 2 SiO 2 2 H 2 O K a o l i n i t e + 14 H + = 2 Al 3 + + 2 Si 4 + + 9 H 2 O
Al 2 O 3 2 SiO 2 2 H 2 O K a o l i n i t e + 6 OH = 2 AlO 2 + 2 SiO 3 2 + 5 H 2 O
SiO 2 + 2 OH = SiO 3 2 + H 2 O

4.4.3. Interaction Mechanism between Coal and Salt Solution

The strength of coal will deteriorate to a certain extent under the action of salt solution [37,45]. The deterioration of coal strength under the action of salt solution is mainly due to the weakening of cohesion between particles. Only considering the static liquid bridge force, the cohesion between particles is mainly composed of the gravitational attraction between particles (Fa) and the static liquid bridge force (Fcap) and the expressions are as follows [46]:
F a = G m 1 m 2 2 R 0 + D 2
F c a p = 2 π R 0 σ cos β 1 D 2 R 2 cos β
where m1, m2 are the mass of particles; R0 is the radius of the particle; D is the distance between particles; σ is surface tension; β is the contact angle between liquid and particle; and R2 is the radius of the liquid bridge neck.
Ni et al. [47] found that the surface tension between liquid and solid particles decreases with the increase in salt solution concentration. It can be seen from Formula (21) that the cohesion between particles in coal is positively correlated with the surface tension, and the increase in surface tension will lead to the increase in cohesion, and vice versa, which indicated that the increase in salt solution will weaken the cohesion between particles, thus resulting in the deterioration of coal strength.

5. Conclusions

In order to study the effect of salt solution on pore structure of coal, salt solution with different concentration was used to soak coal sample and nuclear magnetic resonance measurement was carried out. Firstly, the aging evolution characteristics of porosity and pore structure of coal sample were analyzed. Then, the fractal characteristics of pore structure were discussed on the basis of fractal theory, and the relationship between fractal dimension and immersion parameters was analyzed. Finally, the aging damage variable based on the fractal characteristics of pores was defined, and the hydrochemical damage mechanism of coal under the action of salt solution was analyzed. The main conclusions are summarized as follows:
(1)
With the effect of salt solution immersion, the porosity of coal increased with soaking time. The change rate of porosity increased nonlinearly with soaking time and linearly with salt solution concentration.
(2)
Under the action of salt solution immersion, the NMR transverse relaxation time range of coal becomes wider, and more pores with larger or smaller size were gradually formed. The number of seepage pores and total pores increased with soaking time. while the number of adsorption pores increased first and then decreased with soaking time. At the later stage of immersion, the pores with small size gradually connect to form larger pores.
(3)
The relationship between fractal dimension and soaking time is linearly decreasing. Under the same immersion time, the pore fractal dimension of coal immersed in salt solution decreased more rapidly than that of coal immersed in distilled water. The damage effect of salt solution soaking on coal matrix is greater than that of distilled water. There is a negative correlation between fractal dimension and porosity.
(4)
The diachronic damage variables based on pore fractal dimension was defined. The damage variables have a nonlinear increasing relationship with the soaking time, indicating that the longer the soaking time, the more obvious the pore structure changes and the greater the deterioration of coal. The damage mechanism of coal properties was described from three aspects: water corrosion, acid or alkali chemical reaction and interaction between salt and coal.
The deterioration of coal pore structure affects its macroscopic mechanical properties [24]. The essential cause of coal pillar instability failure is the weakening of the ability to resist deformation under external loads. In order to accurately evaluate the stability of coal pillar, it is necessary to establish a direct relationship between the changes in internal pore structure and mechanical properties, which is what we need to further study in the future. In engineering practice, the temperature and flow velocity of mine water are constantly changing. In addition, a coal pillar is subjected to the pressure of overlying rock during the soaking process. To scientifically evaluate the stability of coal pillar, we need to comprehensively consider the coupling effects of multiple factors such as temperature, stress, and seepage to accurately obtain the evolution law of internal pore and fracture structure of coal pillar in natural conditions. This is the focus of future research.

Author Contributions

Conceptualization, M.W. and Y.T.; methodology, M.W.; validation, Y.T.; formal analysis, M.W.; investigation, M.W. and Y.T.; resources, M.W. and Q.G.; data curation, Y.T. and L.W.; writing—original draft preparation, M.W.; writing—review and editing, Y.T. and Z.Z.; supervision, M.W.; project administration, Z.Z.; funding acquisition, M.W., Y.T., L.W. and Z.Z. All authors have read and agreed to the published version of the manuscript.

Funding

This work was supported by the National Natural Science Foundation of China (Grant No. 52274167), the Research Foundation of Education Bureau of Hunan Province (Grant No. 22B0410, 22C0221, 23A0329), the Natural Science Foundation of Hunan Province (Grant No. 2022JJ40374, 2023JJ40549), the Science and Technology Innovation Program of Hunan Province, China (Grant No. 2023RC3171).

Data Availability Statement

The related data used to support the findings of this study are included within the article.

Conflicts of Interest

The authors declare no conflict of interest.

References

  1. Shi, J.; Huang, W.; Han, H.; Xu, C. Review on treatment technology of salt wastewater in coal chemical industry of China. Desalination 2020, 493, 114640. [Google Scholar] [CrossRef]
  2. Hamawand, I.; Yusaf, T.; Hamawand, S. Coal seam gas and associated water: A review paper. Renew. Sustain. Energy Rev. 2013, 22, 550–560. [Google Scholar] [CrossRef]
  3. Qiao, L.; Wang, Z.; Huang, A. Alteration of mesoscopic properties and mechanical behavior of sandstone due to hydro-physical and hydro-chemical effects. Rock Mech. Rock Eng. 2017, 50, 255–267. [Google Scholar] [CrossRef]
  4. Zhou, Z.; Wang, P.; Cai, X.; Cao, W. Influence of Water Content on Energy Partition and Release in Rock Failure: Implications for Water-Weakening on Rock-burst Proneness. Rock Mech. Rock Eng. 2023, 56, 6189–6205. [Google Scholar] [CrossRef]
  5. Noël, C.; Baud, P.; Violay, M. Effect of water on sandstone’s fracture toughness and frictional parameters: Brittle strength constraints. Int. J. Rock Mech. Min. 2021, 147, 104916. [Google Scholar] [CrossRef]
  6. Feng, X.; Chen, S.; Li, S. Effects of water chemistry on microcracking and compressive strength of granite. Int. J. Rock Mech. Min. 2001, 38, 557–568. [Google Scholar] [CrossRef]
  7. Zhou, Z.; Cai, X.; Cao, W.; Li, X.; Xiong, C. Influence of Water Content on Mechanical Properties of Rock in Both Saturation and Drying Processes. Rock Mech. Rock Eng. 2016, 49, 3009–3025. [Google Scholar] [CrossRef]
  8. Farquharson, J.; Kushnir, A.; Wild, B.; Baud, P. Physical property evolution of granite during experimental chemical stimulation. Geotherm. Energy 2020, 8, 14. [Google Scholar] [CrossRef]
  9. Erguler, Z.; Ulusay, R. Water-induced variations in mechanical properties of clay-bearing rocks. Int. J. Rock Mech. Min. 2009, 46, 355–370. [Google Scholar] [CrossRef]
  10. Chen, S.; Du, Z.; Zhang, Z.; Zhang, H.; Xia, Z.; Feng, F. Effects of chloride on the early mechanical properties and microstruc-ture of gangue-cemented paste backfill. Constr. Build. Mater. 2020, 235, 117504. [Google Scholar] [CrossRef]
  11. Ai, T.; Wu, S.; Zhang, R.; Gao, M.; Zhou, J.; Xie, J.; Ren, L.; Zhang, Z. Changes in the structure and mechanical properties of a typical coal induced by water immersion. Int. J. Rock Mech. Min. 2021, 138, 104597. [Google Scholar] [CrossRef]
  12. Gu, H.; Tao, M.; Cao, W.; Zhou, J.; Li, X. Dynamic fracture behaviour and evolution mechanism of soft coal with different porosities and water contents. Theor. Appl. Fract. Mech. 2019, 103, 102265. [Google Scholar] [CrossRef]
  13. Zhao, Y.; Liu, S.; Jiang, Y.; Wang, K.; Huang, Y. Dynamic Tensile Strength of Coal under Dry and Saturated Conditions. Rock Mech. Rock Eng. 2016, 49, 1709–1720. [Google Scholar] [CrossRef]
  14. Liu, P.; Fan, L.; Fan, J.; Zhong, F. Effect of water content on the induced alteration of pore morphology and gas sorption/diffusion kinetics in coal with ultrasound treatment. Fuel 2021, 306, 121752. [Google Scholar] [CrossRef]
  15. Zhang, X.; Gamage, R.; Perera, M.; Ranathunga, A. Effects of Water and Brine Saturation on Mechanical Property Alterations of Brown Coal. Energies 2018, 11, 1116. [Google Scholar] [CrossRef]
  16. Yao, Q.; Chen, T.; Ju, M.; Liang, S.; Liu, Y.; Li, X. Effects of water intrusion on mechanical properties of and crack propagation in coal. Rock Mech. Rock Eng. 2016, 49, 4699–4709. [Google Scholar] [CrossRef]
  17. Liu, Y.; Yin, G.; Li, M.; Zhang, D.; Huang, G.; Liu, P.; Liu, C.; Zhao, H.; Yu, B. Mechanical properties and failure behavior of dry and water-saturated anisotropic coal under true-triaxial loading conditions. Rock Mech. Rock Eng. 2020, 53, 4799–4818. [Google Scholar] [CrossRef]
  18. Yao, Q.; Zheng, C.; Tang, C.; Xu, Q.; Chong, Z.; Li, X. Experimental Investigation of the Mechanical Failure Behavior of Coal Specimens With Water Intrusion. Front. Earth Sci. 2020, 7, 348. [Google Scholar] [CrossRef]
  19. Wang, S.; Elsworth, D.; Liu, J. Permeability evolution in fractured coal: The roles of fracture geometry and water-content. Int. J. Coal Geol. 2011, 87, 13–25. [Google Scholar] [CrossRef]
  20. Larsen, J. The effects of dissolved CO2 on coal structure and properties. Int. J. Coal Geol. 2004, 57, 63–70. [Google Scholar] [CrossRef]
  21. Balucan, R.; Turner, L.; Steel, K. Acid-induced mineral alteration and its influence on the permeability and compressibility of coal. J. Nat. Gas. Sci. Eng. 2016, 33, 973–987. [Google Scholar] [CrossRef]
  22. Xu, J.; Zhai, C.; Liu, S.; Qin, L.; Wu, S. Pore variation of three different metamorphic coals by multiple freezing-thawing cycles of liquid CO2 injection for coalbed methane recovery. Fuel 2017, 208, 41–51. [Google Scholar] [CrossRef]
  23. Xie, J.; Ni, G.; Xie, H.; Li, S.; Sun, Q.; Dong, K. The effect of adding surfactant to the treating acid on the chemical properties of an acid-treated coal. Powder Technol. 2019, 356, 263–272. [Google Scholar]
  24. Li, S.; Ni, G.; Wang, H.; Xun, M.; Xu, Y. Effects of acid solution of different components on the pore structure and mechanical properties of coal. Adv. Powder Technol. 2020, 31, 1736–1747. [Google Scholar] [CrossRef]
  25. Xu, Q.; Liu, R.; Yang, H. Effect of acid and alkali solutions on micro-components of coal. J. Mol. Liq. 2021, 329, 115518. [Google Scholar] [CrossRef]
  26. Yang, H.; Yu, Y.; Cheng, W.; Rui, J.; Xu, Q. Influence of acetic acid dissolution time on evolution of coal phase and surface morphology. Fuel 2021, 286, 119464. [Google Scholar] [CrossRef]
  27. Li, Y.; Cui, H.; Zhang, P.; Wang, D.; Wei, J. Three-dimensional visualization and quantitative characterization of coal fracture dynamic evolution under uniaxial and triaxial compression based on μCT scanning. Fuel 2020, 262, 116568. [Google Scholar] [CrossRef]
  28. Liu, Z.; Liu, D.; Cai, Y.; Yao, Y.; Pan, Z.; Zhou, Y. Application of nuclear magnetic resonance (NMR) in coalbed methane and shale reservoirs: A review. Int. J. Coal Geol. 2020, 218, 103261. [Google Scholar] [CrossRef]
  29. Nie, B.; Liu, X.; Yang, L.; Meng, J.; Li, X. Pore structure characterization of different rank coals using gas adsorption and scanning electron microscopy. Fuel 2015, 158, 908–917. [Google Scholar] [CrossRef]
  30. Li, Y.; Song, D.; Liu, S.; Ji, X.; Hao, H. Evaluation of pore properties in coal through compressibility correction based on mercury intrusion porosimetry: A practical approach. Fuel 2021, 291, 120130. [Google Scholar] [CrossRef]
  31. Ni, G.; Li, S.; Rahman, S.; Xun, M.; Wang, H.; Xu, Y.; Xie, H. Effect of nitric acid on the pore structure and fractal characteristics of coal based on the low-temperature nitrogen adsorption method. Powder Technol. 2020, 367, 506–516. [Google Scholar] [CrossRef]
  32. Zhou, S.; Liu, D.; Cai, Y.; Yao, Y. Fractal characterization of pore-fracture in low-rank coals using a low-field NMR relaxation method. Fuel 2016, 181, 218–226. [Google Scholar] [CrossRef]
  33. Liu, Z.; Yang, H.; Wang, W.; Cheng, W.; Xin, L. Experimental Study on the Pore Structure Fractals and Seepage Characteristics of a Coal Sample Around a Borehole in Coal Seam Water Infusion. Transp. Porous Media 2018, 125, 289–309. [Google Scholar] [CrossRef]
  34. Chen, S.; Tang, D.; Tao, S.; Ji, X.; Xu, H. Fractal analysis of the dynamic variation in pore-fracture systems un-der the action of stress using a low-field NMR relaxation method: An experimental study of coals from western Guizhou in China. J. Pet. Sci. Eng. 2019, 173, 617–629. [Google Scholar] [CrossRef]
  35. Qin, L.; Zhai, C.; Liu, S.; Xu, J.; Wu, S.; Dong, R. Fractal dimensions of low rank coal subjected to liquid nitrogen freeze-thaw based on nuclear magnetic resonance applied for coalbed methane recovery. Powder Technol. 2018, 325, 11–20. [Google Scholar] [CrossRef]
  36. Yao, Y.; Liu, D.; Tang, D.; Tang, S.; Huang, W.; Liu, Z.; Che, Y. Fractal characterization of seepage-pores of coals from China: An in-vestigation on permeability of coals. Comput. Geosci. 2009, 35, 1159–1166. [Google Scholar] [CrossRef]
  37. Wang, M.; Guo, Q.; Tian, Y.; Dai, B. Physical and Mechanical Properties Evolution of Coal Subjected to Salty Solution and a Damage Constitutive Model under Uniaxial Compression. Mathematics 2021, 9, 3264. [Google Scholar] [CrossRef]
  38. Ni, G.; Xie, H.; Li, S.; Sun, Q.; Huang, D.; Cheng, Y.; Wang, N. The effect of anionic surfactant (SDS) on pore-fracture evolution of acidified coal and its significance for coalbed methane extraction. Adv. Powder Technol. 2019, 30, 940–951. [Google Scholar]
  39. Liu, R.; Li, B.; Jiang, Y. A fractal model based on a new governing equation of fluid flow in fractures for characterizing hydraulic properties of rock fracture networks. Comput. Geotech. 2016, 75, 57–68. [Google Scholar] [CrossRef]
  40. Li, B.; Liu, R.; Jiang, Y. A multiple fractal model for estimating permeability of dual-porosity media. J. Hydrol. 2016, 540, 659–669. [Google Scholar] [CrossRef]
  41. Li, P.; Cai, M.; Gao, Y.; Wang, P.; Miao, S.; Wang, Y.; Xi, X. Dynamic mechanical behavior and cracking mechanism of cross-jointed granite containing a hole. J. Mater. Res. Technol. 2023, 22, 1572–1594. [Google Scholar] [CrossRef]
  42. Cai, X.; Zhou, Z.; Tan, L.; Zang, H.; Song, Z. Fracture behavior and damage mechanisms of sandstone subjected to wetting-drying cycles. Eng. Fract. Mech. 2020, 234, 107109. [Google Scholar] [CrossRef]
  43. Smoliński, A.; Malashkevych, D.; Petlovanyi, M.; Rysbekov, K.; Lozynskyi, V.; Sai, K. Research into Impact of Leaving Waste Rocks in the Mined-Out Space on the Geomechanical State of the Rock Mass Surrounding the Longwall Face. Energies 2022, 15, 9522. [Google Scholar] [CrossRef]
  44. Gu, H.; Tao, M.; Wang, J.; Jiang, H.; Li, Q.; Wang, W. Influence of water content on dynamic mechanical properties of coal. Geomech. Eng. 2018, 16, 85–95. [Google Scholar]
  45. Wang, M.; Xi, X.; Guo, Q. Deterioration Mechanism and Constitutive Model of Coal Subjected to Dry-ing-Wetting Cycles of Salty Mine Water. Lithosphere 2022, 2022, 7935979. [Google Scholar] [CrossRef]
  46. Pitois, O.; Moucheront, P.; Chateau, X. Liquid Bridge between Two Moving Spheres: An Experimental Study of Viscosity Effects. J. Colloid Interface Sci. 2000, 231, 26–31. [Google Scholar] [CrossRef]
  47. Ni, G.; Sun, Q.; Xun, M.; Wang, H.; Wang, H.; Cheng, W.; Wang, G. Effect of NaCl-SDS compound solution on the wettability and functional groups of coal. Fuel 2019, 257, 11607. [Google Scholar]
Figure 1. Mineral composition analysis. (a) X-ray diffraction curve; (b) mineral content.
Mathematics 12 00072 g001
Figure 2. Experimental process and equipment.
Mathematics 12 00072 g002
Figure 3. The porosity change rate varies with immersion time.
Mathematics 12 00072 g003
Figure 4. The porosity change rate varies with the concentration of salt solution.
Mathematics 12 00072 g004
Figure 5. T2 spectra of coal samples under the action of salt solution. (a) Distilled water; (b) 0.1 mol/L salt solution; (c) distilled water; (d) 1 mol/L salt solution.
Mathematics 12 00072 g005
Figure 6. The relationship between immersion time and pore number of coal under the action of salt solution. (a) Adsorption pore; (b) seepage pore; (c) total pore.
Mathematics 12 00072 g006
Figure 7. Fractal dimension of pore structure of coal sample. (a) Immersed in distilled water for 0 day; (b) Immersed in distilled water for 30 days; (c) immersed in 0.1 mol/L salt solution for 0 day; (d) immersed in 0.1 mol/L salt solution for 30 days; (e) immersed in 0.5 mol/L salt solution for 0 day; (f) immersed in 0.5 mol/L salt solution for 30 days; (g) immersed in 1 mol/L salt solution for 0 day; (h) immersed in 1 mol/L salt solution for 30 days.
Mathematics 12 00072 g007aMathematics 12 00072 g007b
Figure 8. Relationship between fractal dimension and immersion time. (a) Immersed in distilled water; (b) immersed in 1 mol/L salt solution.
Mathematics 12 00072 g008
Figure 9. The relationship between fractal dimension and porosity. (a) Immersed in distilled water; (b) immersed in 1 mol/L salt solution.
Mathematics 12 00072 g009
Figure 10. Relationship curves of δT, δT2 and soaking time under the action of salt solution. (a) δT; (b) δT2.
Mathematics 12 00072 g010
Figure 11. Microscopic morphology of coal samples under the action of salt solution, (a) natural state, (b) after 0.1 mol/L salt solution immersion.
Mathematics 12 00072 g011
Table 1. φp and Δφp of coal samples at different immersion time.
Immersion Time (Days)Distilled
Water
0.1 mol/L
Salt Solution
0.5 mol/L
Salt Solution
1 mol/L
Salt Solution
φp (%)Δφp (%)φp (%)Δφp (%)φp (%)Δφp (%)φp (%)Δφp (%)
020.29 19.83 16.64 19.41
120.872.8620.664.1917.344.2120.475.46
321.355.2221.528.5218.3910.5221.9813.24
521.907.9422.8115.0319.6918.3323.7222.21
1022.088.8223.3017.5020.1721.2124.9028.28
1522.129.0223.7419.7220.9225.7225.5631.69
2022.209.4123.9520.7821.4729.0326.8438.28
3022.3310.0524.1321.6822.0232.3327.4741.53
Table 2. Relationship between porosity change rate and immersion time.
Concentration of Salt Solution (mol/L)Fit FunctionabR2
0y = a × (1 − eb×x)9.5130.30650.986
0.1 21.170.20150.988
0.5 31.300.13580.979
1 40.790.12850.983
Table 3. Relationship between porosity change rate and salt solution concentration.
Immersion Time (Days)Fit FunctionabR2
1y = a + b × x3.3442.0900.895
3 6.5677.0190.838
5 11.0612.050.730
10 12.3016.630.806
15 13.7619.450.755
20 14.1325.600.849
30 15.0328.430.858
Table 4. Fractal dimension of coal pore structure.
Immersion Solution TypeImmersion Time (Days)Adsorption PoreSeepage PoreTotal Pores
D1R2D2R2DR2
Distilled water01.24300.8222.96950.5902.54780.520
11.24750.8222.96920.5952.54660.520
31.22180.8242.96920.5752.54580.521
51.19890.8272.96730.5832.54330.522
71.16260.8322.96570.5872.53640.526
151.13980.8322.96390.5922.53520.525
201.10330.8402.96130.6052.52660.531
301.07310.8432.96000.6042.52310.532
0.1 mol/L salt solution01.26040.8182.95370.6082.54370.532
11.25900.8202.95410.5912.54180.534
31.23150.8222.95230.6082.54180.534
51.21360.8212.94840.6862.53930.530
71.18200.8262.94610.6872.53530.535
151.15140.8282.94410.6802.53090.536
201.11630.8322.94080.7072.52500.539
301.08830.8362.93910.6952.52020.542
0.5 mol/L salt solution01.24430.8232.97410.6232.56350.502
11.21660.8252.97290.6362.56020.503
31.19340.8272.97170.6462.55790.504
51.13940.8302.96760.7102.55310.505
71.10980.8322.96600.7342.55000.506
151.07730.8382.96400.7312.54340.511
201.03980.8422.96070.7662.53670.505
301.00810.8452.95740.7882.53110.519
1 mol/L salt solution01.23610.8282.96150.5922.54530.525
11.21190.8292.96120.5882.54250.525
31.18560.8332.95830.6062.53580.531
51.15070.8352.95210.7032.53320.530
71.12960.8362.95570.7212.53010.534
151.09440.8412.94240.8162.52440.537
201.05870.8462.94070.8002.51640.542
301.03180.8472.94020.7852.51370.542
Table 5. Damage variables of coal sample under the action of salt solution.
Immersion Time (Days)Distilled
Water
0.1 mol/L
Salt Solution
0.5 mol/L
Salt Solution
1 mol/L
Salt Solution
δT
(%)
δT2
(%)
δT
(%)
δT2
(%)
δT
(%)
δT2
(%)
δT
(%)
δT2
(%)
00.000.000.000.000.000.000.000.00
10.050.010.07−0.010.130.040.110.01
30.080.010.070.050.220.080.370.11
50.180.070.170.180.410.220.480.32
100.450.130.330.260.530.270.600.20
150.490.190.500.330.780.340.820.64
200.830.280.740.441.050.451.140.70
300.970.320.920.491.260.561.240.72
Disclaimer/Publisher’s Note: The statements, opinions and data contained in all publications are solely those of the individual author(s) and contributor(s) and not of MDPI and/or the editor(s). MDPI and/or the editor(s) disclaim responsibility for any injury to people or property resulting from any ideas, methods, instructions or products referred to in the content.

