Article

The Lomax-Exponentiated Odds Ratio–G Distribution and Its Applications

Department of Mathematics and Statistics, University of West Florida, Pensacola, FL 32514, USA
*
Author to whom correspondence should be addressed.
These authors contributed equally to this work.
Mathematics 2024, 12(10), 1578; https://doi.org/10.3390/math12101578
Submission received: 16 April 2024 / Revised: 10 May 2024 / Accepted: 15 May 2024 / Published: 18 May 2024
(This article belongs to the Special Issue New Advances in Applied Probability and Stochastic Processes)

Abstract

:
This paper introduces the Lomax-exponentiated odds ratio–G (L-EOR–G) distribution, a novel framework designed to adeptly navigate the complexities of modern datasets. It blends theoretical rigor with practical application to surpass the limitations of traditional models in capturing complex data attributes such as heavy tails, shaped curves, and multimodality. Through a comprehensive examination of its theoretical foundations and empirical data analysis, this study lays down a systematic theoretical framework by detailing its statistical properties and validates the distribution’s efficacy and robustness in parameter estimation via Monte Carlo simulations. Empirical evidence from real-world datasets further demonstrates the distribution’s superior modeling capabilities, supported by compelling various goodness-of-fit tests. The convergence of theoretical precision and practical utility heralds the L-EOR–G distribution as a groundbreaking advancement in statistical modeling, significantly enhancing precision and adaptability. The new model not only addresses a critical need within statistical modeling but also opens avenues for future research, including the development of more sophisticated estimation methods and the adaptation of the model for various data types, thereby promising to refine statistical analysis and interpretation across a wide array of disciplines.

1. Introduction

The introduction of generalized distributions represents a significant advancement in the field of statistical analysis, laying the foundation for the development of both flexible and complex statistical models. These frameworks are highly regarded by researchers and statisticians for their capability to tailor analytical strategies to the unique challenges encountered in various datasets [1]. Generalized distributions have garnered widespread interest across numerous fields, such as epidemiology and survival analysis, due to their comprehensive applicability, as illustrated by recent models proposed in [2,3,4]. Recent additions to this domain include the transformed Log–Burr III distribution [5], the Ristić–Balakrishnan–Topp–Leone–Gompertz–G distribution [6], a novel family of modified slash distribution [7], the flexible Gumbel distribution [8], the new sine inverted exponential distribution [9], the Beta-truncated Lomax distribution [10], the bivariate Chen distribution [11], the power function–Lindley distribution [12], and the two-parameter Weibull distribution [13], among others.
This paper introduces the Lomax-exponentiated odds ratio–G distribution, a novel integration of the Lomax distribution’s resilience with the odds ratio. Originating from the Pareto Type-II distribution, the addition of an extra scale parameter to the Lomax distribution significantly enhances its effectiveness in accurately estimating failure times and lifespans [14]. The odds ratio is utilized in various areas, including epidemiology and the social sciences, to accurately model binary events. It elucidates the impact of numerous factors on dichotomous outcomes, providing insights into the likelihood of an event occurring. The incorporation of exponentiation within the Odds Ratio distribution broadens its adaptability, enabling the modeling of complex interrelationships and interactions among variables. This enhancement exemplifies the extensive utility of statistical distributions in addressing a wide array of analytical challenges [15,16,17].
The L-EOR–G distribution demonstrates promising potential as a robust solution for a wide range of data analysis challenges. By amalgamating these well-established concepts, the L-EOR–G distribution seeks to enhance the adaptability and potential of the foundational models. Compared to other sophisticated generalized models, the L-EOR–G distribution is conceptually straightforward and aligns with well-known distributions such as the Pareto type I, beta prime, F distribution, and q-exponential distribution.
The rationale for proposing the L-EOR–G distribution stems not only from the need for greater model flexibility but also from the desire to provide a unified approach to data analysis that can be easily interpreted and applied across different disciplines. The L-EOR–G distribution is posited to offer superior fit and predictive accuracy for datasets that exhibit behaviors challenging to model with traditional distributions. Moreover, the development of the L-EOR–G distribution is motivated by the ongoing evolution in statistical methodologies, where there is a pressing need for models that not only fit the data well but also offer insights into the underlying processes generating the data. By providing a more adaptable and intuitive modeling tool, the L-EOR–G distribution aims to contribute to the advancement of statistical science, opening new avenues for research and application.
The manuscript details the proposal of the new distribution in Section 2, followed by an exploration of the mathematical properties of this distribution family in Section 3. Section 4 discusses various parameter estimation methods alongside Monte Carlo simulations for each estimator. Section 5 presents several special cases, including their probability density functions, hazard rate functions, skewness, and kurtosis. Finally, Section 6 showcases the application of the new model to real-life datasets, demonstrating its practical utility and flexibility. Detailed proofs for all theorems and lemmas presented in this manuscript are available in the Supplementary Information, which is accessible via the following URL: https://github.com/shusenpu/LEORG/blob/8f2f214fad950627216556df0158f2ca6d03554d/SI.pdf (accessed on 17 May 2024).

2. Lomax-Exponentiated Odds Ratio–G Family of Distributions

Chen et al. proposed the exponentiated odds ratio generator [18], which introduces a comprehensive framework for generalized odds ratio distributions. In this paper, the Lomax distribution is selected as the outer distribution with its cumulative distribution function (cdf) represented as
R ( t ) = 1 ( 1 + λ t ) k ,
where λ > 0 is the scale parameter and k > 0 is the concentration of the distribution. Consequently, the cdf of the newly defined Lomax-exponentiated odds ratio–G is expressed by the following:
F L - E O R G ( x ) = 1 1 + λ α G ( x , ψ ) G ¯ ( x , ψ ) β k ,
which simplifies to the following:
F L - E O R G ( x ) = 1 1 + α G ( x , ψ ) G ¯ ( x , ψ ) β k ,
and the probability density function (pdf) is detailed as follows:
f L - E O R G ( x ) = k α β g ( x , ψ ) G ( x , ψ ) β 1 G ¯ ( x , ψ ) β + 1 1 + α G ( x , ψ ) G ¯ ( x , ψ ) β k 1 ,
where the parameters α , β , and k are positive, characterizing the scale, shape, and concentration of the distribution. The function g ( x , ψ ) denotes the baseline pdf, G ( x , ψ ) represents the cdf associated with the baseline distribution, and G ¯ ( x , ψ ) = 1 G ( x , ψ ) is defined as the survival function. This formulation encapsulates the intricate relationship between the proposed L-EOR–G distribution and its underlying baseline distribution, emphasizing the adaptability and comprehensive nature of the L-EOR–G model in capturing various statistical phenomena. Our objective is to demonstrate that the incorporation of extra parameters can enhance simple distributions, originally characterized by limited variability, enabling them to exhibit a diverse array of shapes and skewness. For practical applications, utilizing this newly developed family of distributions, we advocate the selection of baseline functions with straightforward formats.
Notably, when k = 1 α , the L-EOR–G distribution converges to the extended odd Weibull–G distribution as discussed by [19]. The ensuing subsections are dedicated to a thorough exploration of the statistical properties, simulations, special cases, and real-world applications of this innovative distribution.

3. Mathematical and Statistical Properties

Transitioning into a deeper exploration of the Lomax-exponentiated odds ratio–G distribution, this section is dedicated to elucidating its mathematical and statistical properties. The analysis includes moments of the L-EOR–G distributions, moment-generating function, raw, central, and incomplete moments, the Rényi entropy, and probability-weighted moments, establishing a comprehensive understanding of the distribution’s characteristics.

3.1. Expansion of the Probability Density Function

Theorem 1.
The probability density function (pdf) of the L-EOR–G distribution is formulated as a linear combination of exponentiated generalized distributions, as follows:
f L - E O R G ( x ) = j , m = 0 c j , m s m + β ( j + 1 ) ( x , ψ ) ,
where coefficients c j , m are specified by the following:
c j , m = k α β ( 1 ) m α j ( m + β ( j + 1 ) ) k + j j β ( j + 1 ) + m m .
The function s m + β ( j + 1 ) ( x , ψ ) represents the exponentiated–G distribution with parameter m + β ( j + 1 ) , described as follows:
s m + β ( j + 1 ) ( x , ψ ) = ( m + β ( j + 1 ) ) g ( x , ψ ) G ( x , ψ ) m + β j + β 1 .
Proofs for Theorem 1 and all subsequent theorems and lemmas are provided in the Supplementary Information.

3.2. Hazard Rate

Theorem 2.
The hazard rate function (hrf) of the L-EOR–G distribution is articulated as follows:
h r f ( x ) = k α β g ( x , ψ ) G ( x , ψ ) β 1 G ¯ ( x , ψ ) β + 1 1 + α G ( x , ψ ) G ¯ ( x , ψ ) β 1 ,
and its reverse hazard rate function (rhrf) is given by the following:
τ ( x ) = k α β g ( x , ψ ) G ( x , ψ ) β 1 G ¯ ( x , ψ ) β + 1 1 + α G ( x , ψ ) G ¯ ( x , ψ ) β k 1 1 1 + α G ( x , ψ ) G ¯ ( x , ψ ) β k .

3.3. Quantile Function

Theorem 3.
The quantile function for the L-EOR–G distribution is delineated as follows:
Q ( u ) = G 1 ( ( 1 u ) 1 k 1 ) 1 β α 1 β + ( ( 1 u ) 1 k 1 ) 1 β .
The subsequent subsections further detail moments, central moments, incomplete moments, and generating functions, providing a multifaceted view of the L-EOR–G distribution’s mathematical framework.

3.4. Moments, Incomplete Moments and Generating Functions

Moments serve as statistical measures to characterize probability distributions and succinctly summarize datasets. From the first moment (mean), representing the distribution’s location, to the variance (second central moment) depicting the spread, and onto skewness and kurtosis (third and fourth standardized moments) illustrating the shape, each moment contributes to a full picture of the distribution.

3.4.1. Raw Moments

Lemma 1.
The r t h order raw moment of the L-EOR–G distribution is expressed as follows:
μ r = E [ Y r ] = m , j = 0 c j , m E ( Z j , m r ) ,
where Z j , m is the exponentiated–G random variable with parameter ( m + β ( j + 1 ) ) , and c j , m is as defined in Equation (6).

3.4.2. Central Moments

Lemma 2.
The n t h -order central moment of the L-EOR–G distribution is articulated as follows:
μ n = m , j , r = 0 n r ( μ 1 ) n r c j , m E [ Y m + β ( j + 1 ) ] ,
where E [ Y m + β ( j + 1 ) ] signifies the expected value of the exponentiated–G random variable Y m + β ( j + 1 ) , and c j , m is as outlined in Equation (6).

3.4.3. Incomplete Moments

Lemma 3.
The s t h incomplete moment of the L-EOR–G distribution is detailed as follows:
η s ( t ) = j , m = 0 c j , m t x s h m + β ( j + 1 ) ( x , ψ ) d x ,
highlighting the integration of x s with the function h m + β ( j + 1 ) ( x , ψ ) over the range to t, and c j , m is as defined in Equation (6).

3.4.4. Moment-Generating Functions

Lemma 4.
The moment-generating function (MGF) of the L-EOR–G distribution is provided in terms of the MGF of the exponentiated–G distribution:
M X ( t ) = m , j , r = 0 n r ( μ 1 ) n r c j , m E [ Y m + β ( j + 1 ) ] ,
where M m + β ( j + 1 ) ( t ) represents the MGF of the exponentiated–G random variable Y m + β ( j + 1 ) , and c j , m is as defined in Equation (6).

3.5. Rényi Entropy and Order Statistics

Lemma 5.
The Rényi entropy of the L-EOR–G distribution is expressed as follows:
I R ( v ) = 1 1 v log j , m = 0 w m + β j v + β exp ( 1 v ) I R E G ,
where I R E G is the Rényi entropy of the exponentiated–G family.
In the field of statistics, the k t h -order statistic from a statistical sample denotes the k t h smallest value within that sample. Order statistics, together with rank statistics, serve as essential instruments in the areas of non-parametric statistics and statistical inference.
Lemma 6.
Let X 1 , X 2 , , X n be independent and identically distributed (i.i.d.) random variables from the L-EOR–G distribution. The i t h -order statistic is articulated as follows:
f i : n ( x ) = n ! ( i 1 ) ! ( n i ) ! m = 0 n i n i m ( 1 ) m j = 0 i 1 + m i 1 + m j ( 1 ) j × z = 0 k j k j + z z α G ( x , ψ ) G ¯ ( x , ψ ) β k j f L - E O R G ( x ) ,
illustrating the complexity and application potential of the L-EOR–G distribution’s order statistics.

3.6. Probability-Weighted Moments

Lemma 7.
The probability-weighted moments of the L-EOR–G distribution are given as follows:
P W M ( x ; p , q ) = ( F L - E O R G ( x ) ) p ( 1 F L - E O R G ( x ) ) q f L - E O R G ( x ) d x

4. Special Cases of the L-EOR–G Distribution

This section is dedicated to examining several special cases within the Lomax- exponentiated odds ratio–G framework, emphasizing its flexibility and adaptability across various distributions. Through this exploration, we aim to highlight the versatility of the L-EOR–G model by using different baseline distributions. For each distinct case, we present plots of its probability density function, hazard rate function, as well as its skewness and kurtosis for chosen parameters. Further visualizations of skewness and kurtosis for these cases are provided in the Supplementary Information.

4.1. Lomax-Exponentiated Odds Ratio–Uniform Distribution

Given a uniform baseline distribution G ( x , ψ ) with parameter θ > 0 , where g ( x , θ ) = 1 θ and G ( x , θ ) = x θ , we derive the Lomax-exponentiated odds ratio–uniform (L-EOR–U) distribution. Its cumulative distribution function and probability density function are, respectively, defined as follows:
F L - E O R U ( x ) = 1 1 + α x θ x β k ,
f L - E O R U ( x ) = k α β θ x β 1 ( θ x ) β + 1 1 + α x θ x β k 1 .
The hazard rate function is elucidated as follows, showcasing the distribution’s behavior in failure rate modeling:
h L - E O R U ( x ) = k α β θ x β 1 ( θ x ) β + 1 1 + α x θ x β 1 .
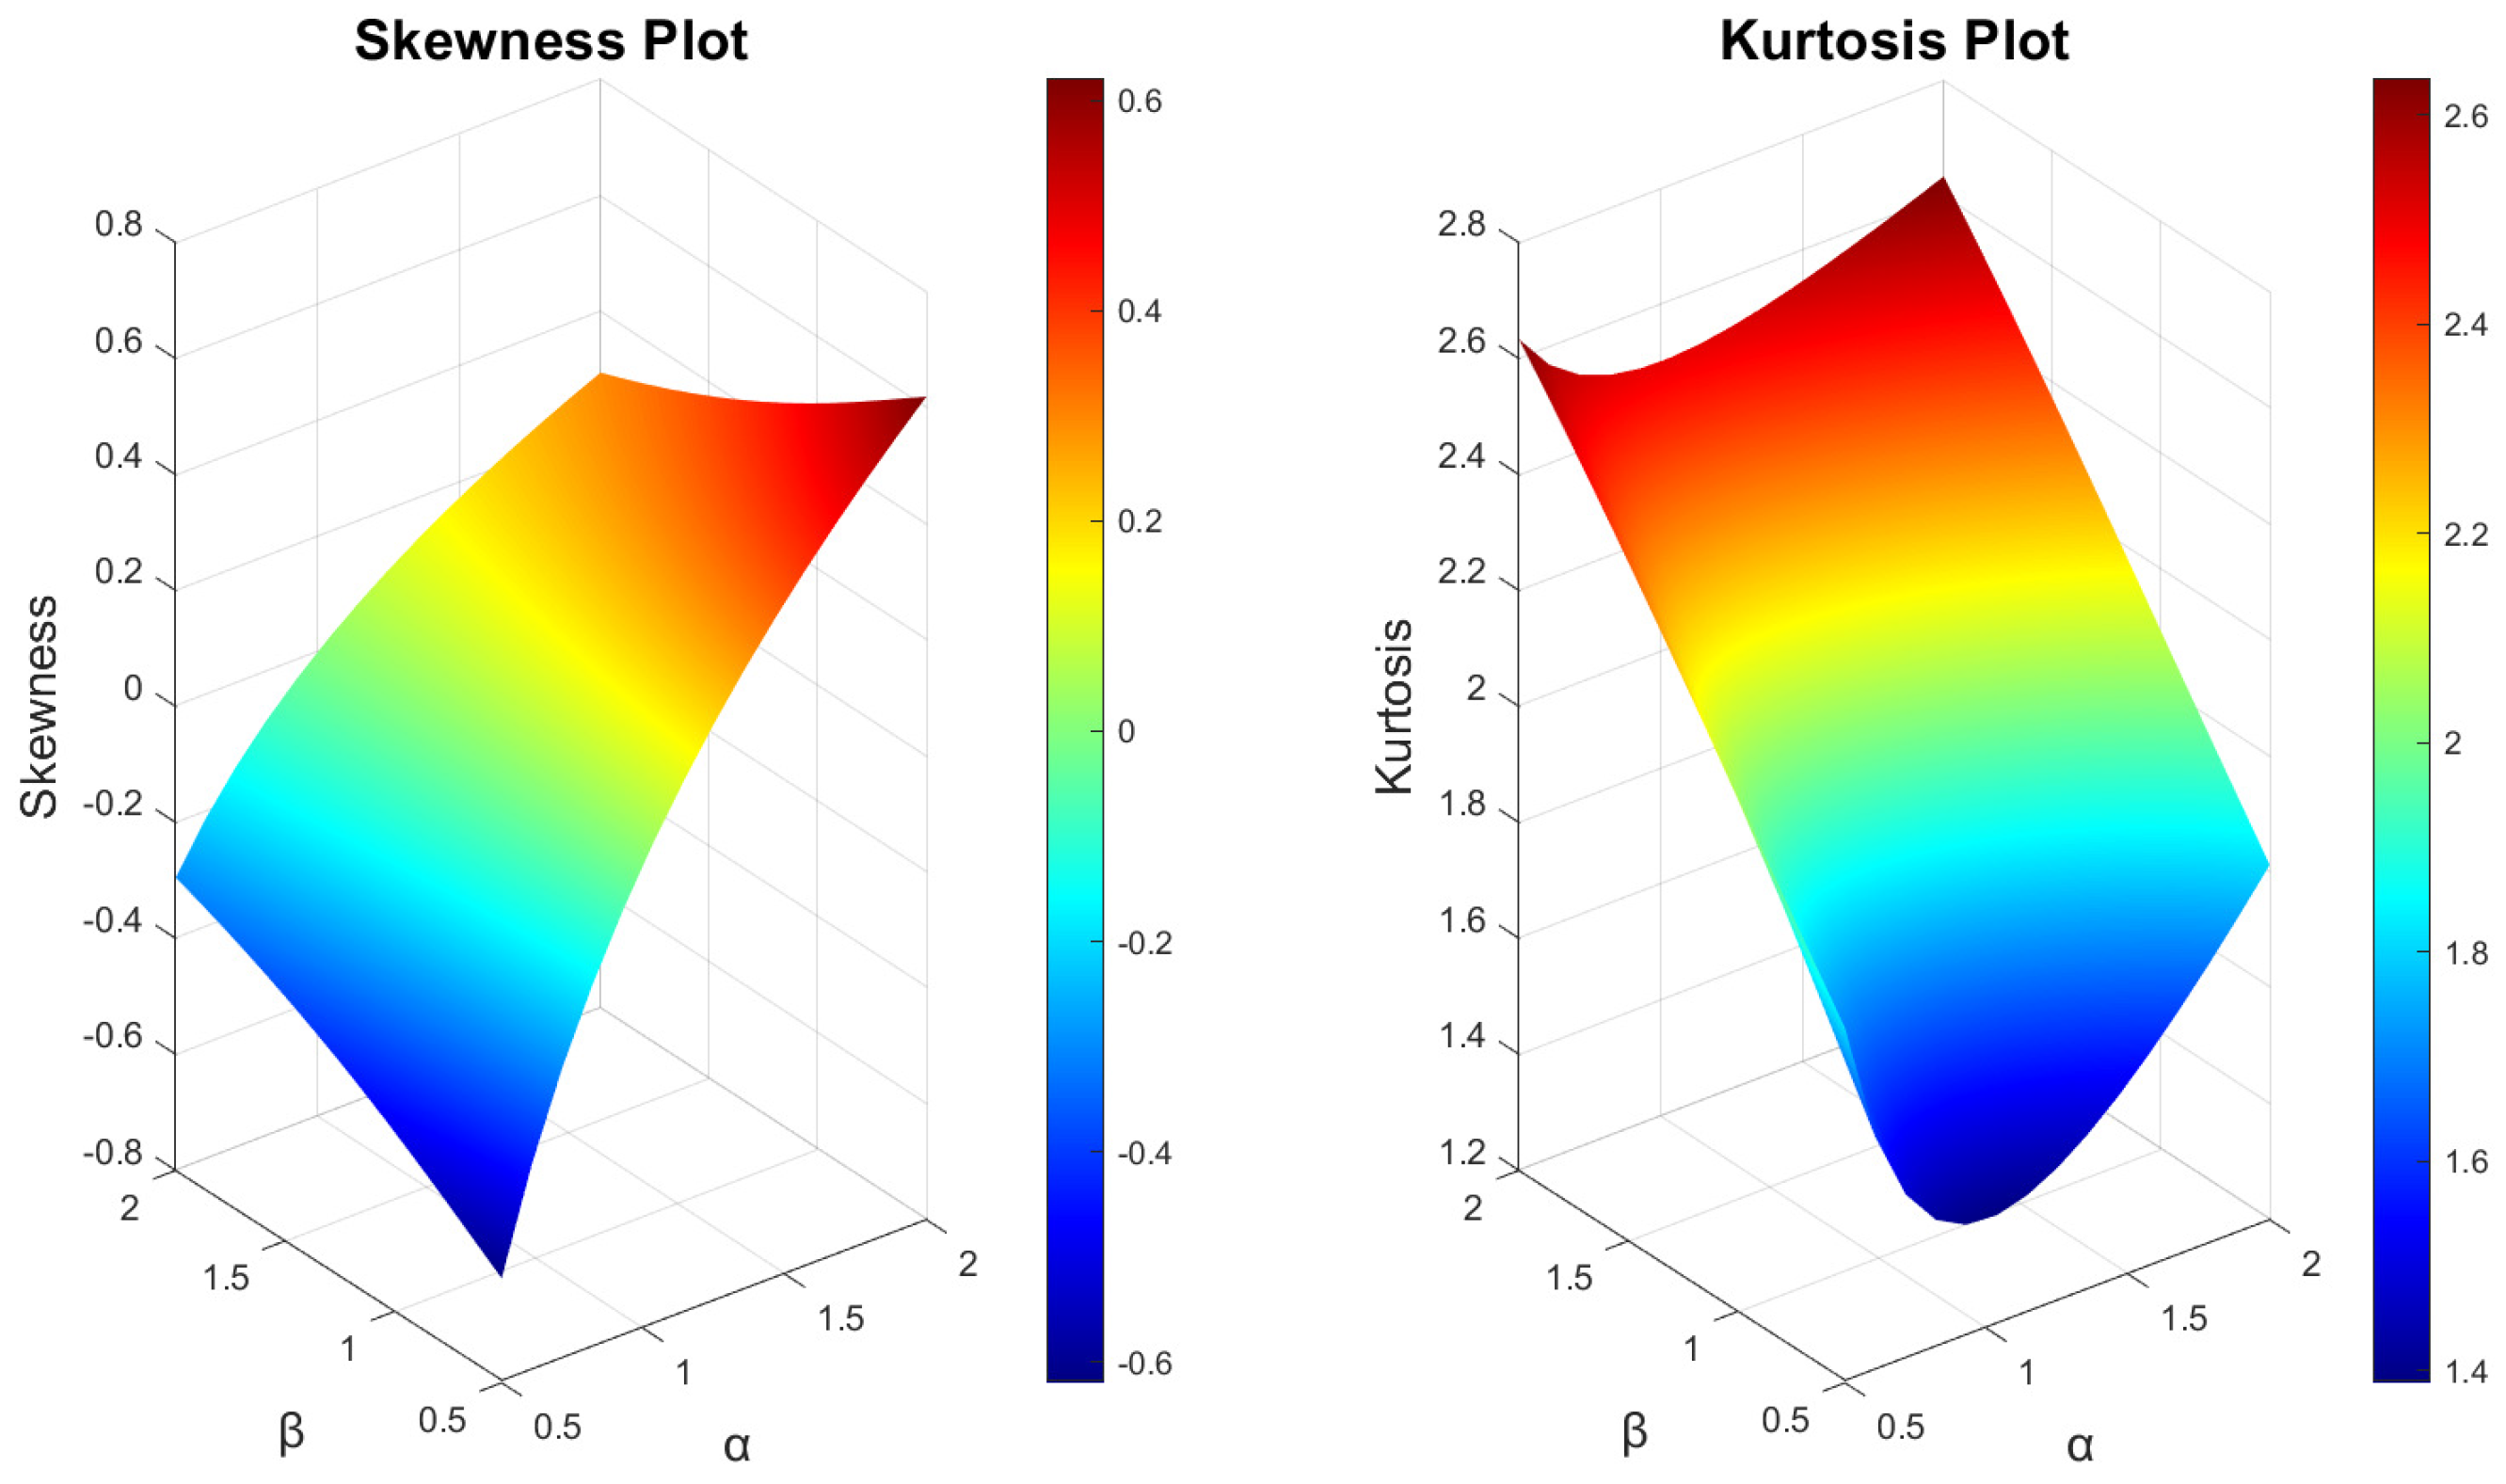
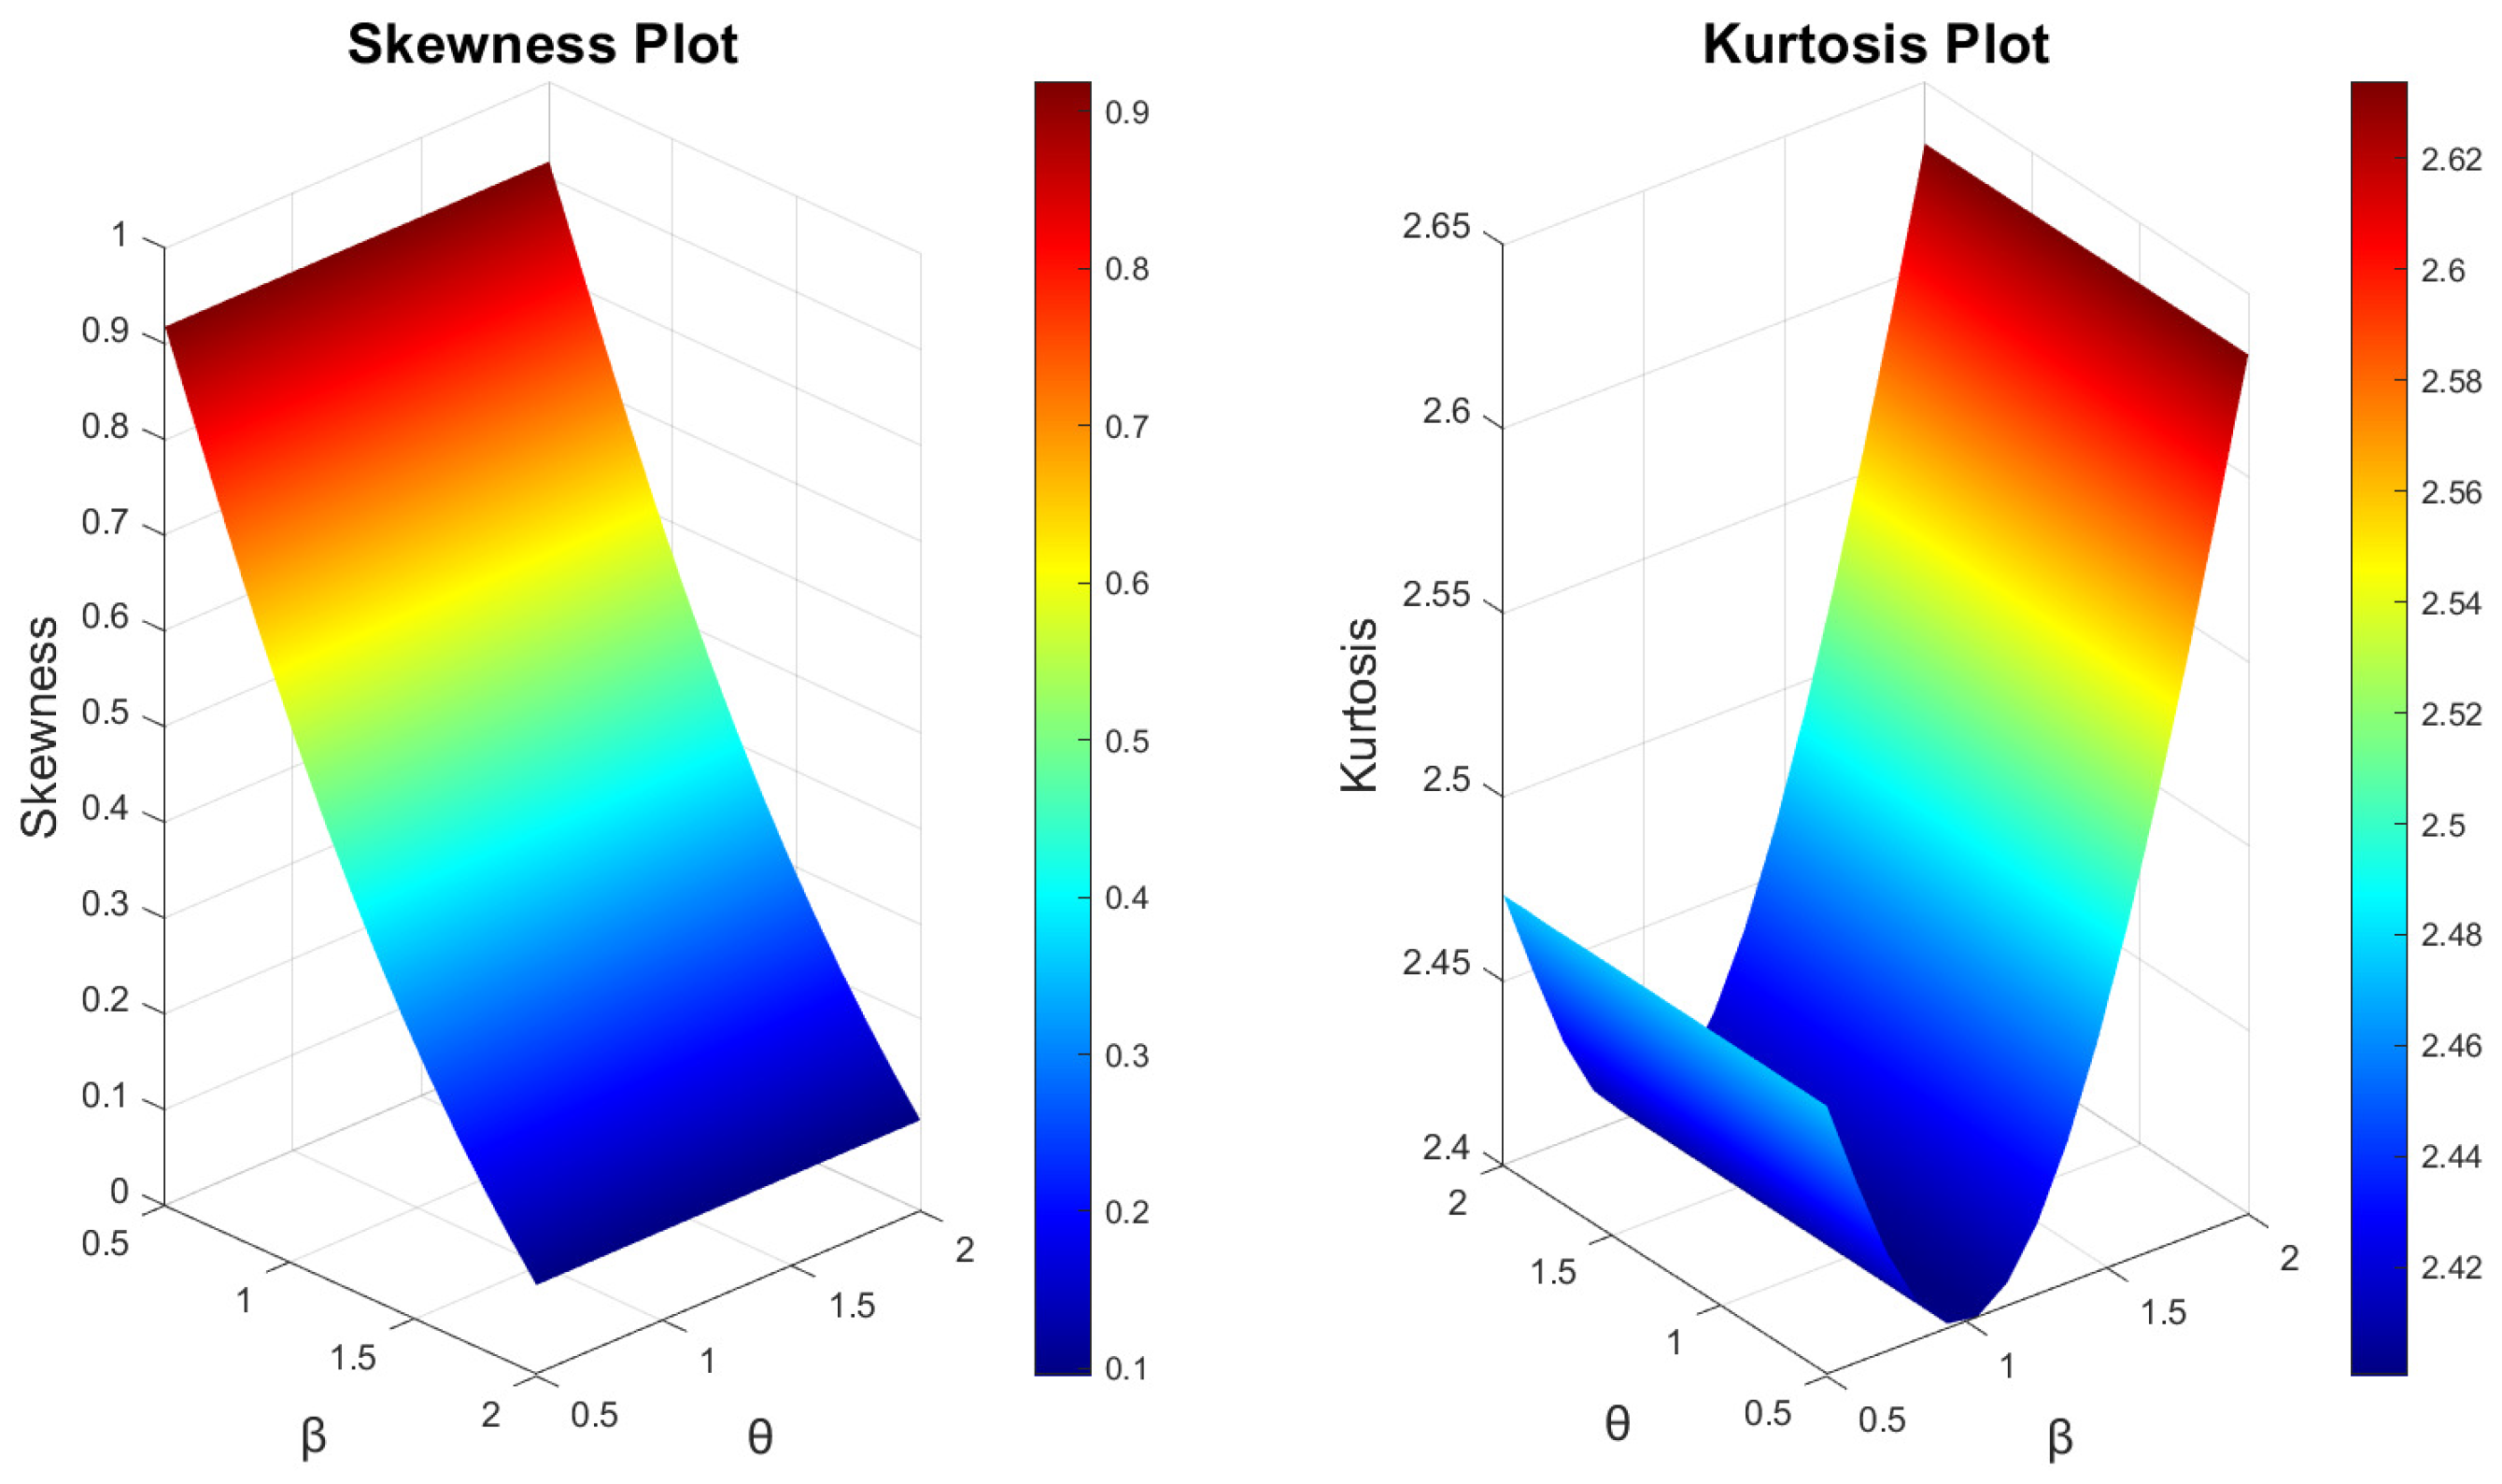
Figure 1 displays the pdf and hrf visualizations for the L-EOR–U distribution, showing a diverse array of curve shapes including monotonically decreasing trends, as well as left- and right-skewed, and various bell-shaped patterns. In parallel, the hrf of the L-EOR–U distribution illustrates a spectrum of growth trends including consistent increases and distinct bathtub profiles, emphasizing the model’s versatility. Further demonstrating this flexibility, Figure 2 and Figure 3 present the skewness and kurtosis across different parameter settings for the L-EOR–U distribution, highlighting the broad adaptability and shape variability of this model. The skewness plots show that the distributions can be left or right skew and the kurtosis plot shows that the peak and tails can have various shapes.

4.2. Lomax-Exponentiated Odds Ratio–Exponential Distribution

When the baseline distribution G ( x , ψ ) follows an exponential distribution with parameter γ > 0 , i.e., g ( x ; γ ) = γ e γ x and G ( x ; γ ) = 1 e γ x , we obtain the Lomax-exponentiated odds ratio–exponential (L-EOR–E) distribution. Its cdf and pdf are given by the following:
F L - E O R E ( x ) = 1 1 + α e γ x 1 β k ,
f L - E O R E ( x ) = k α β γ ( 1 e γ x ) β 1 ( e γ x ) β 1 + α e γ x 1 β k 1 .
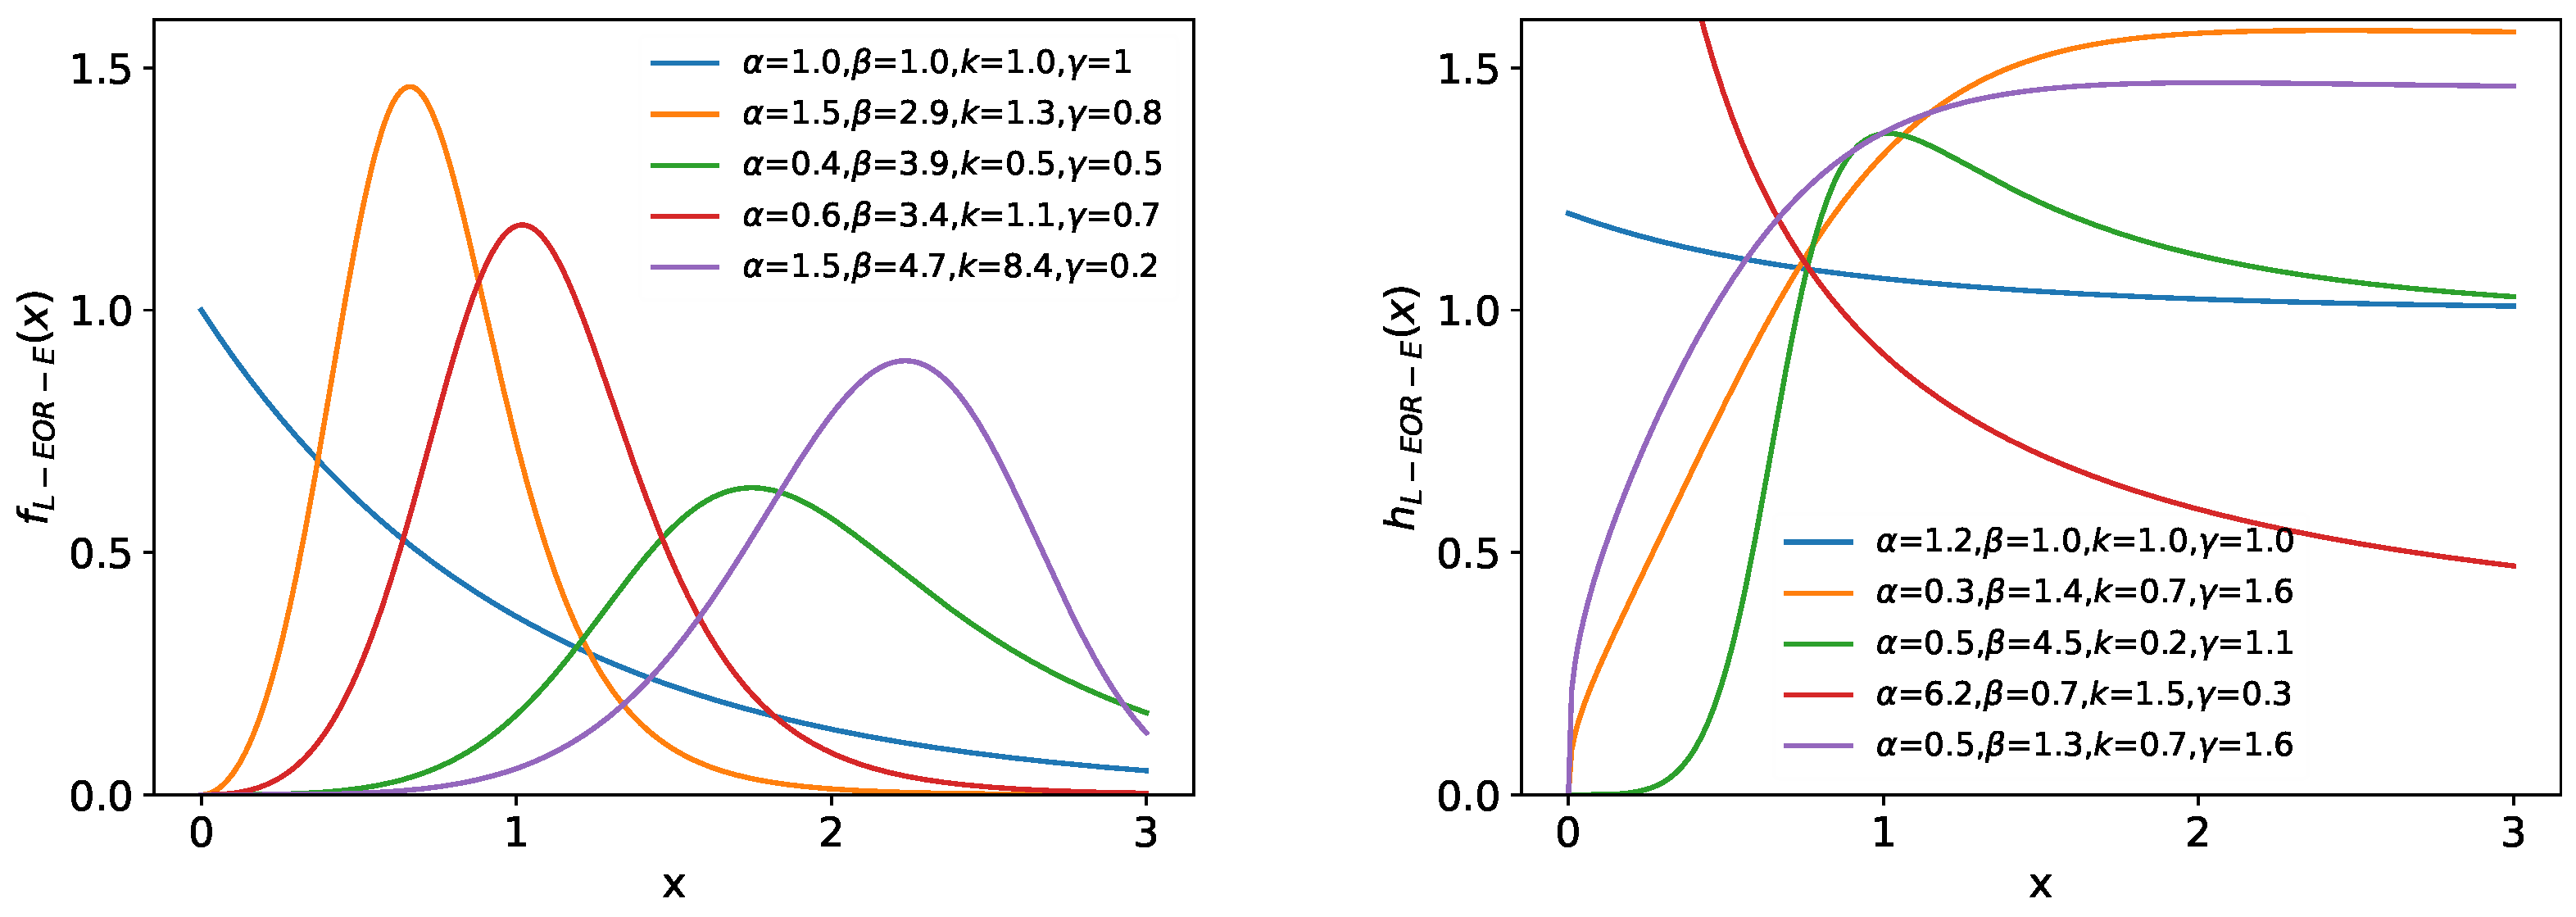
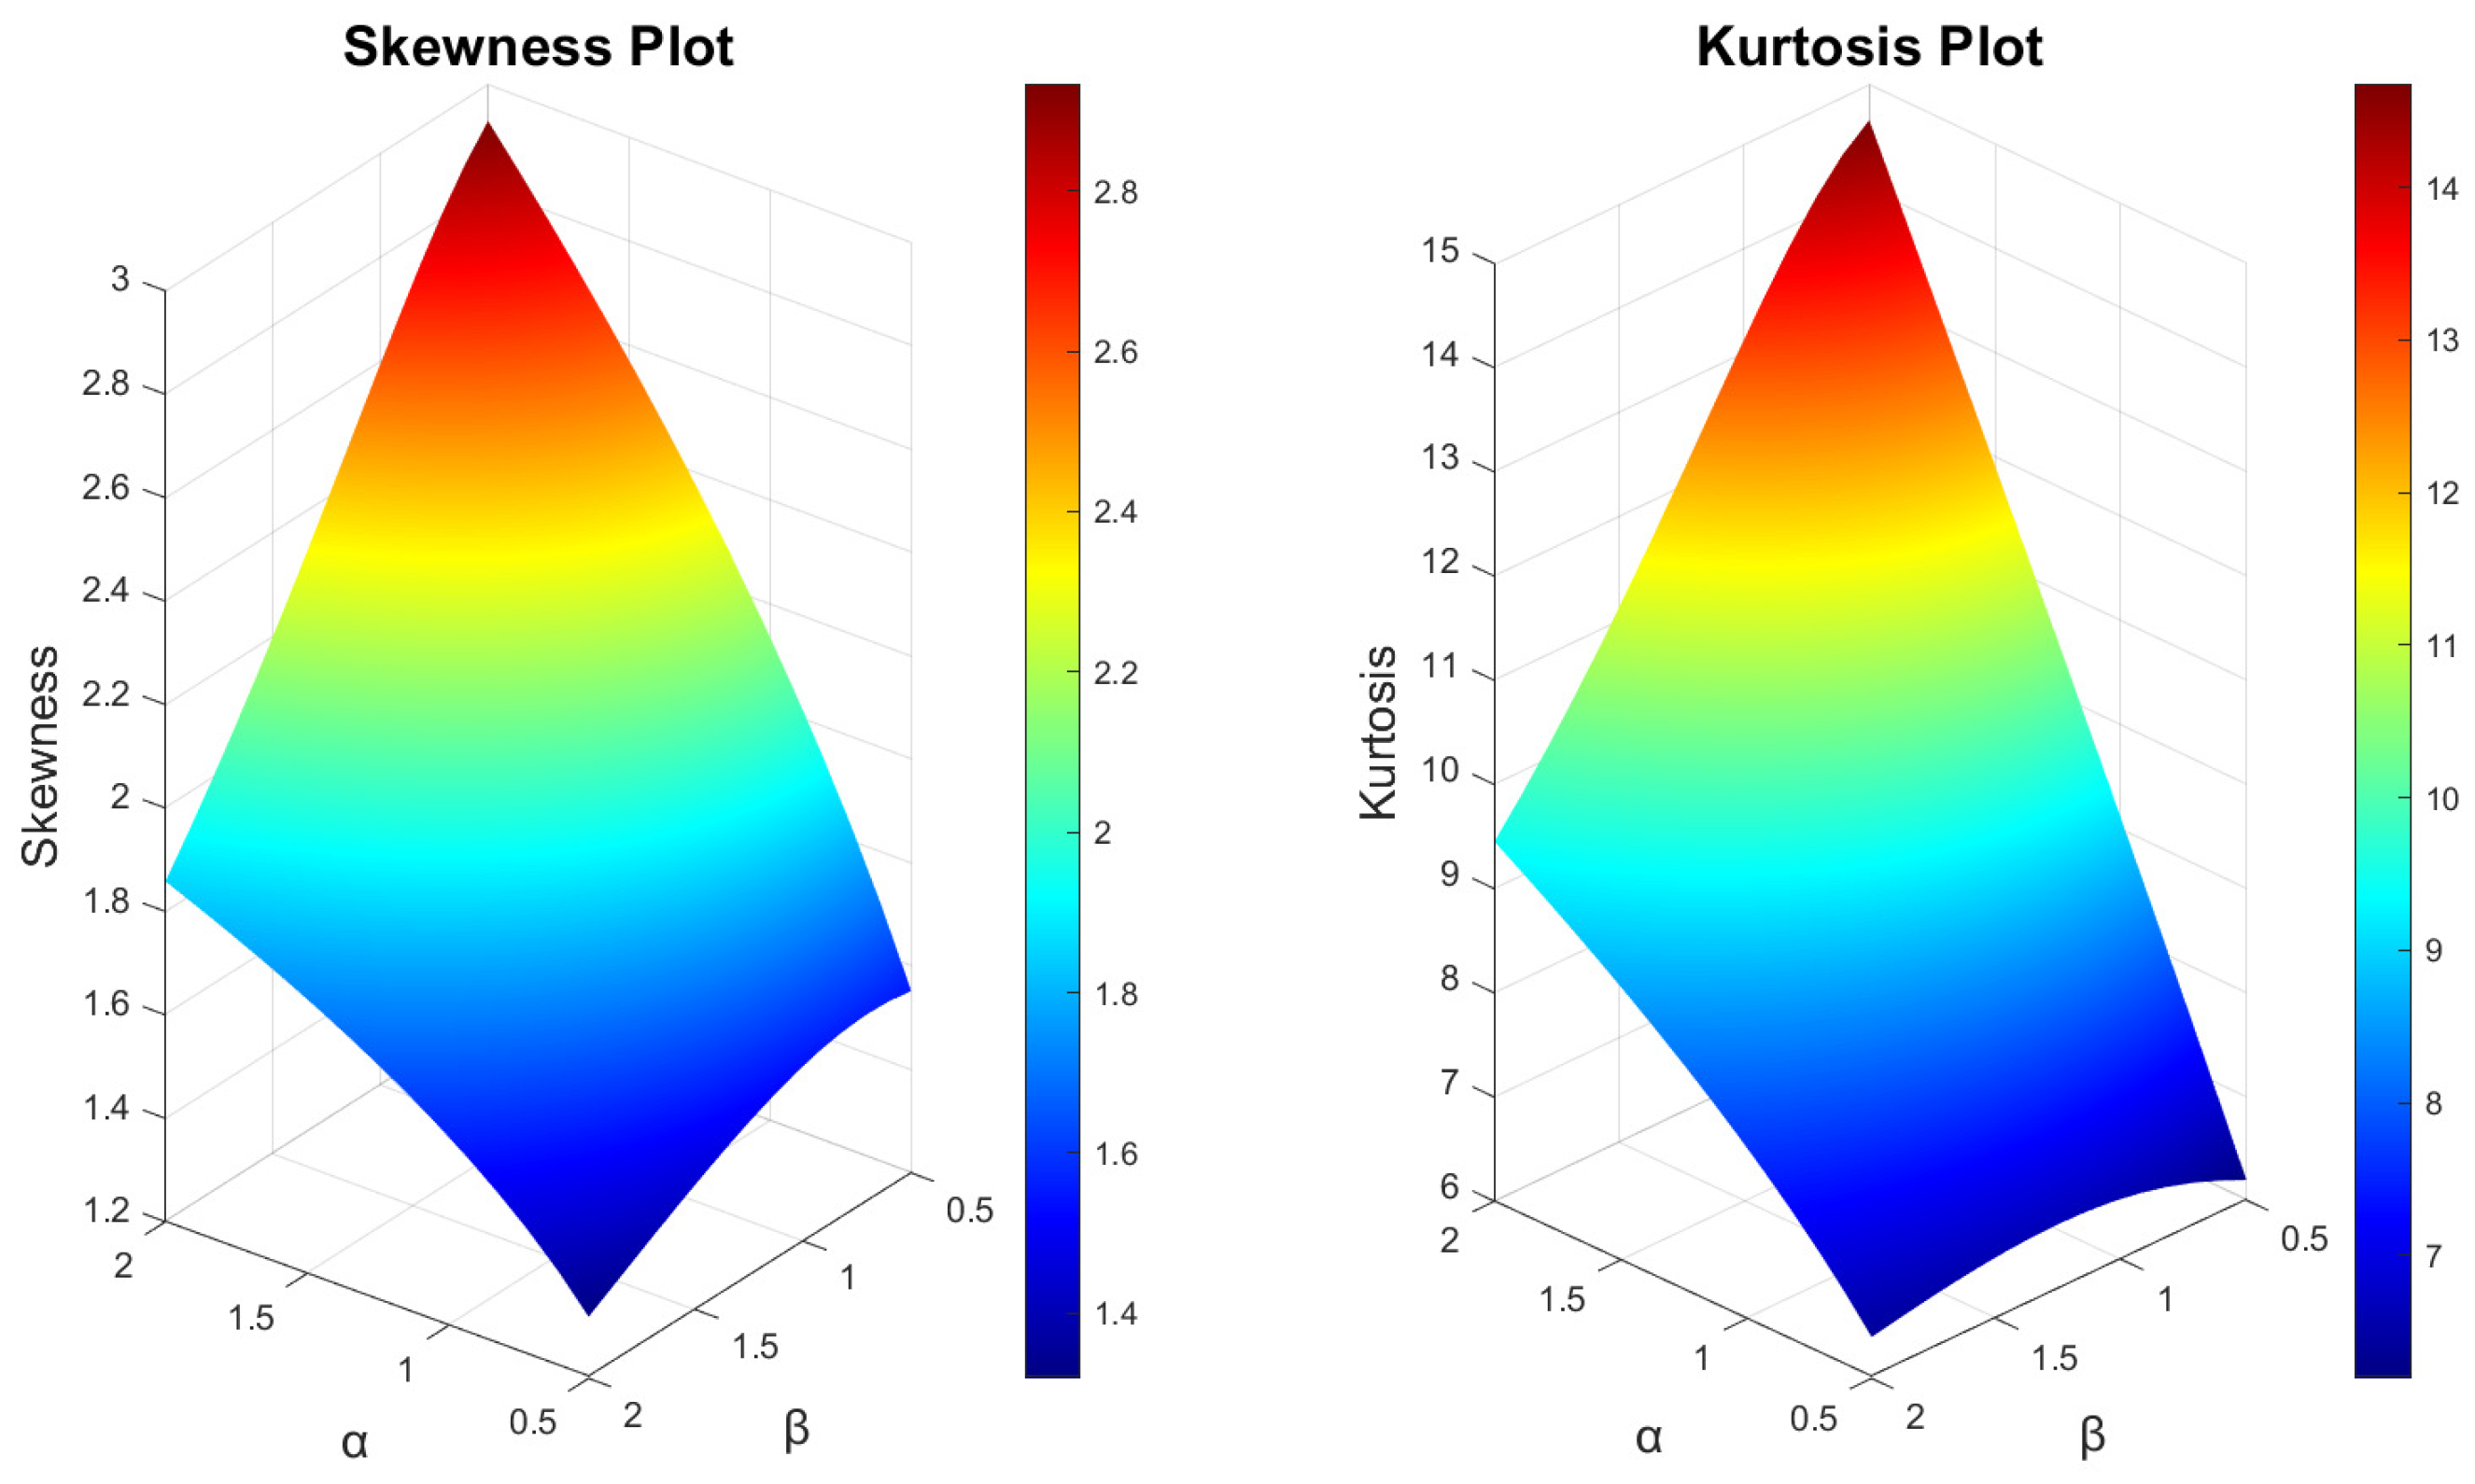
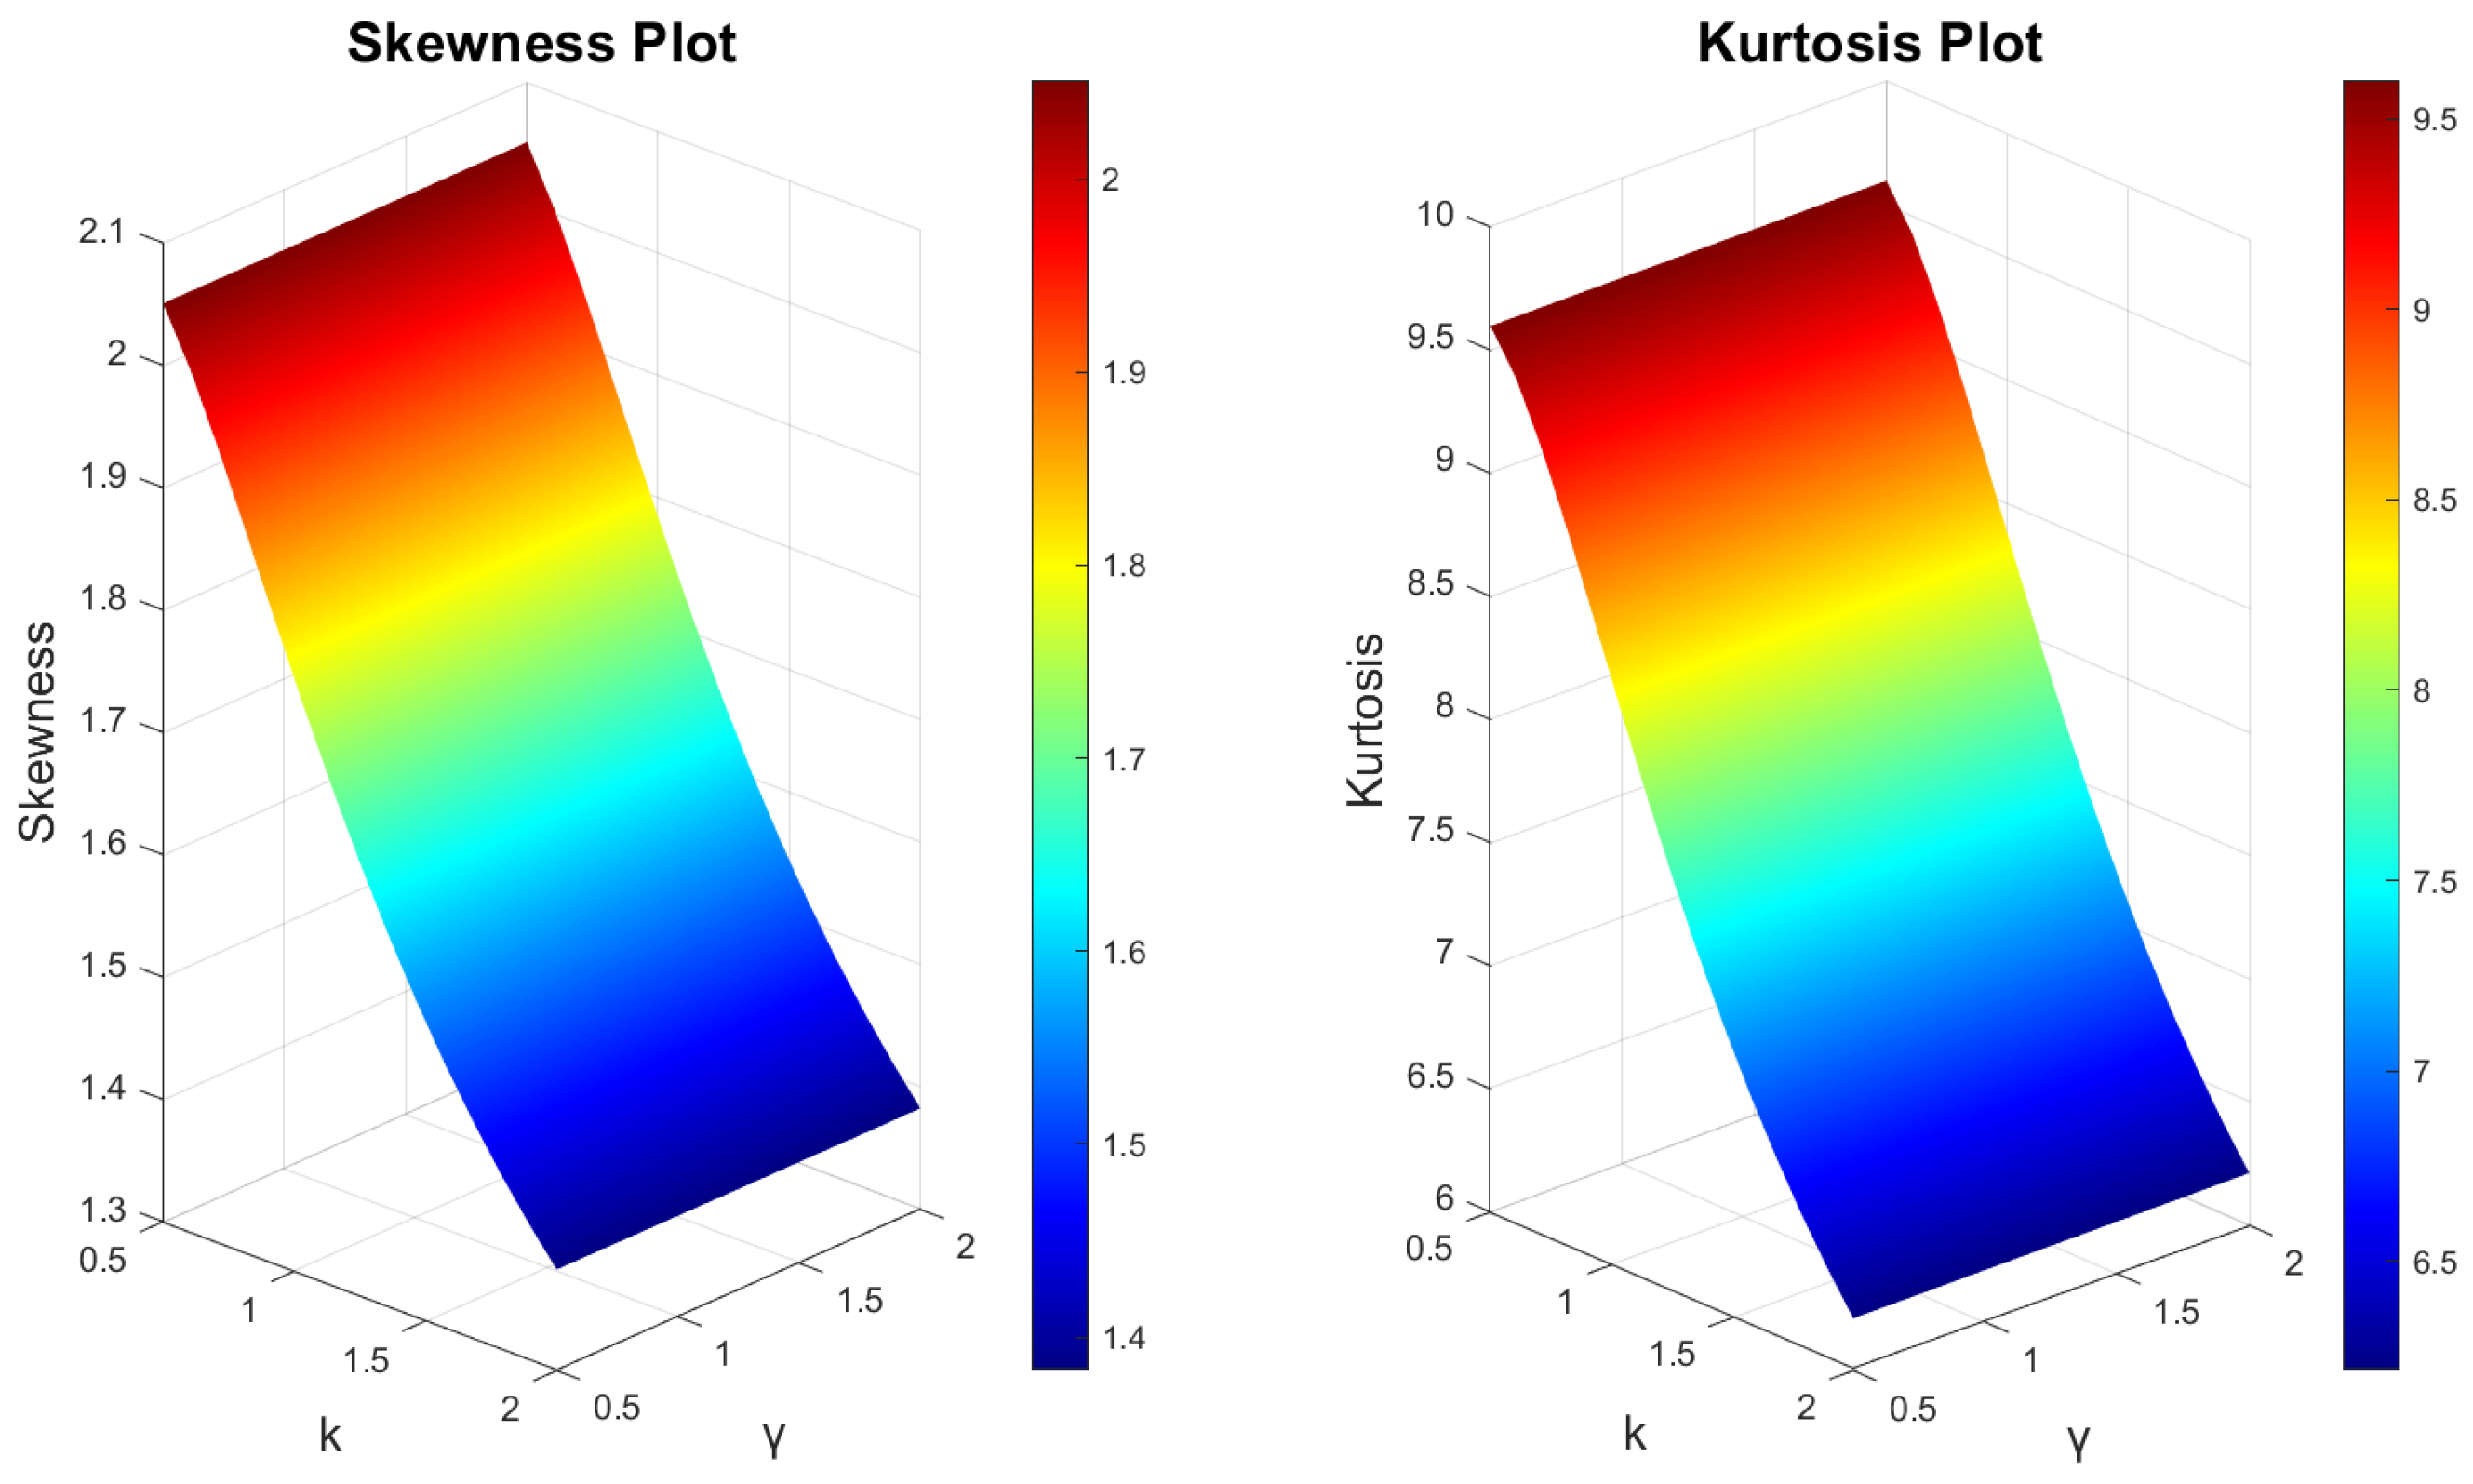
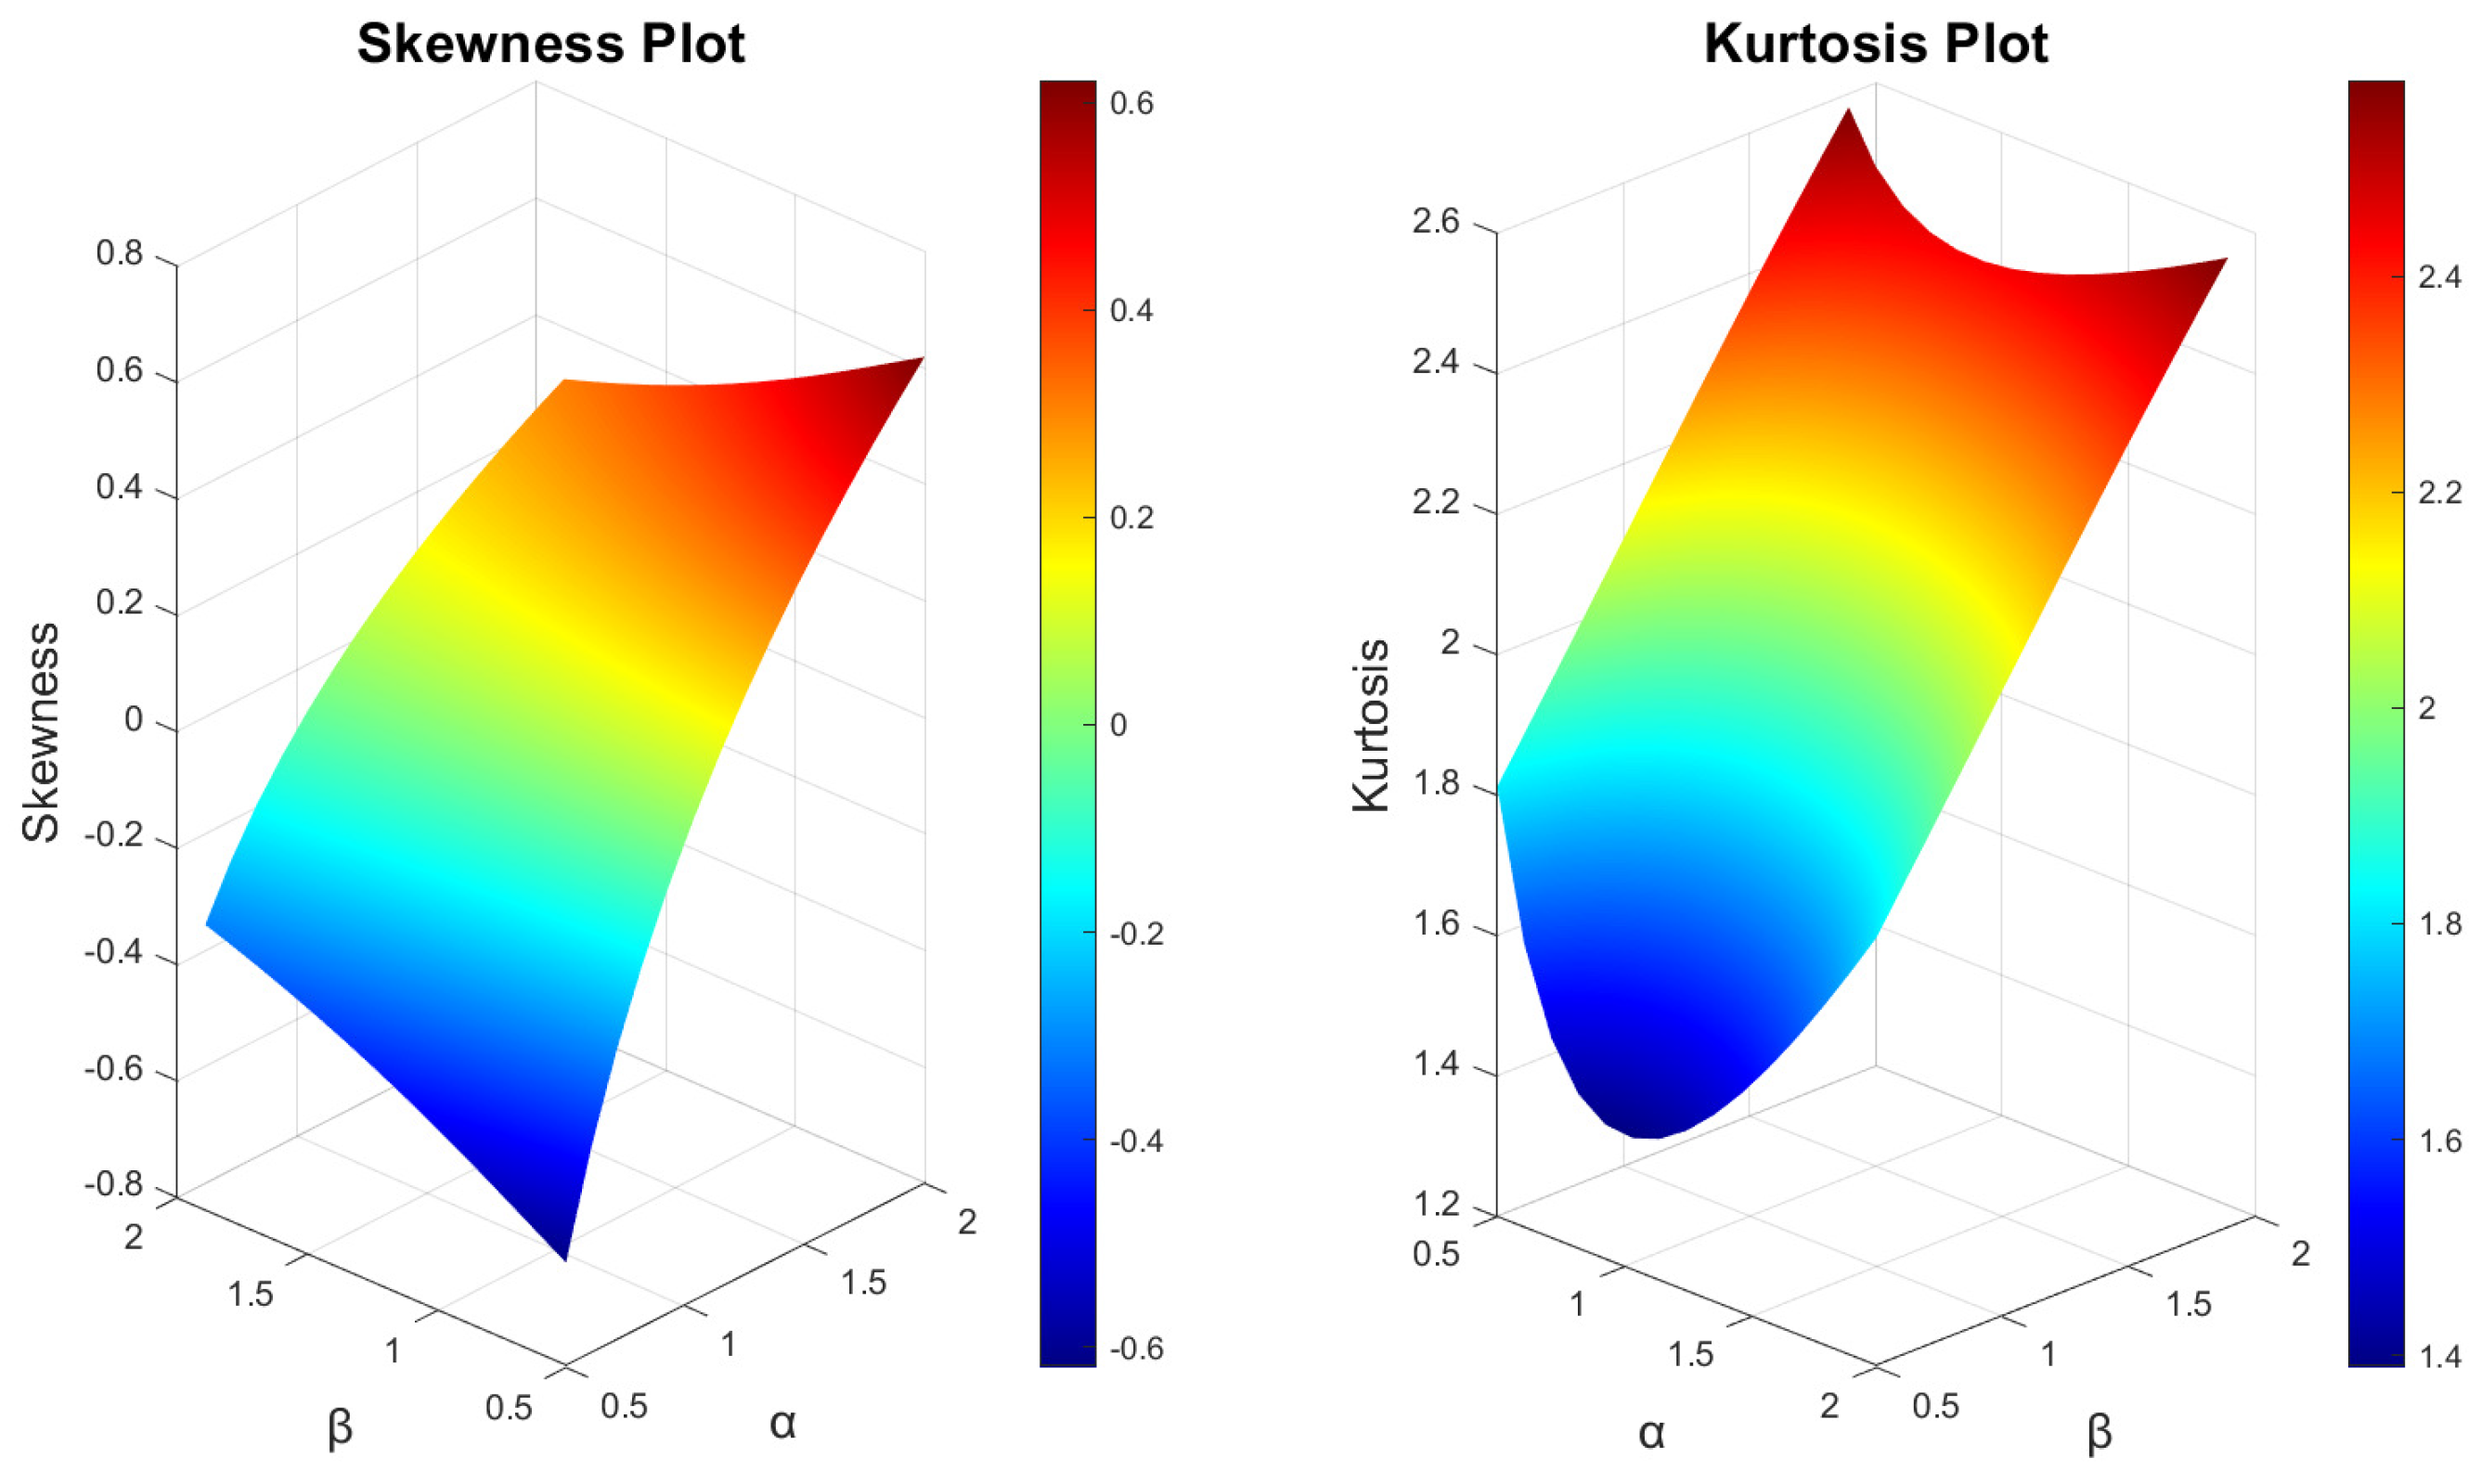
Figure 4 illustrates the pdf for five combinations of the L-EOR–E distribution, demonstrating a range of skewness profiles. The hrf for the L-EOR–E distribution reveals a variety of behaviors, including consistent declines, assorted growth trends, and inverted U-shaped curves. Furthermore, variations in skewness and kurtosis across different parameter settings for the L-EOR–E distribution are detailed in Figure 5 and Figure 6, highlighting the distribution’s flexibility in shape under varied conditions. The skewness and kurtosis plots show that the distributions can have different symmetry and tail shapes.

4.3. Lomax-Exponentiated Odds Ratio–Weibull Distribution

Considering a Weibull baseline distribution with parameters λ , γ > 0 , the Lomax-exponentiated odds ratio–Weibull (L-EOR–W) distribution emerges. Its cdf and pdf, showcasing a rich array of behaviors across different parameter values, are defined as follows:
F L - E O R W ( x ) = 1 1 + α e λ x γ 1 β k ,
f L - E O R W ( x ) = k α β λ x γ 1 ( 1 e λ x γ ) β 1 ( e λ x γ ) β 1 + α e λ x γ 1 β k 1 .
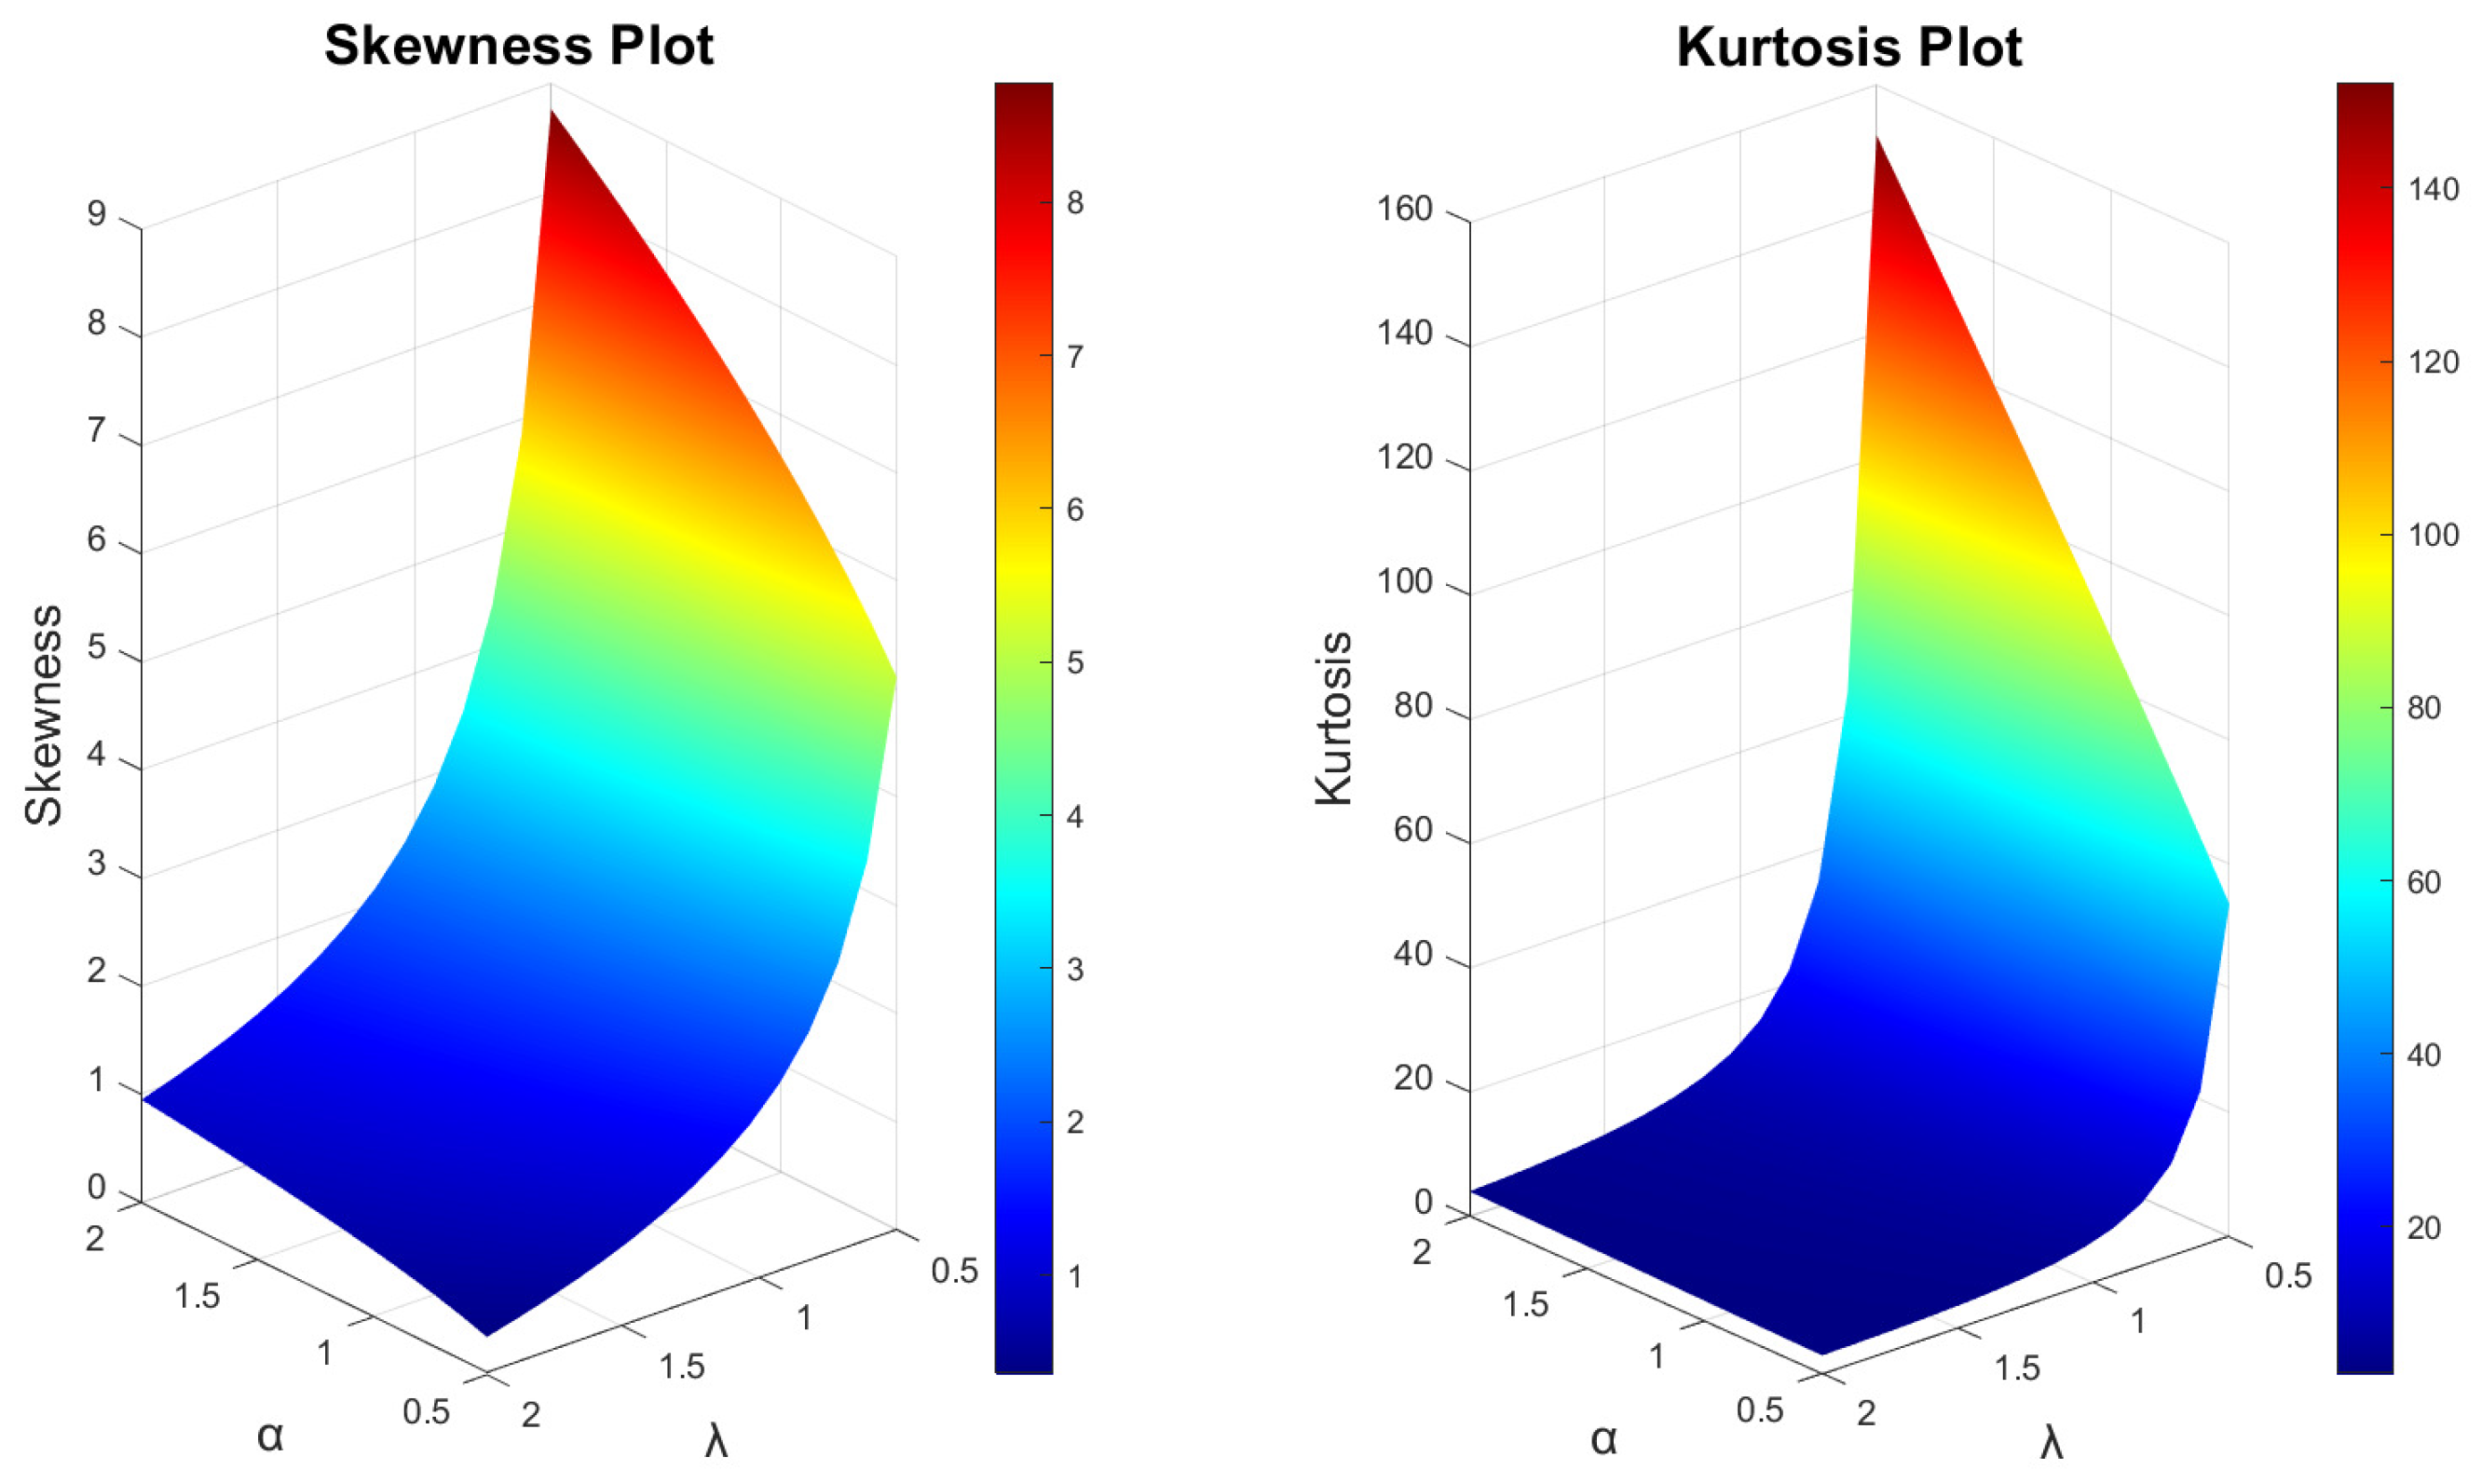
Figure 7 presents the pdf for various configurations of the L-EOR–W distribution, including a wide range of curve characteristics from left- and right-skewed to nearly symmetrical and declining profiles. Notably, the pdf illustrates a distinct stretched M shape featuring dual peaks. Correspondingly, the hrf for these distributions unveils a variety of shapes, including different forms of U-shaped, inverted U-shaped, and concave-upward trends. Further detailing the distribution’s adaptability, Figure 8 and Figure 9 explore the skewness and kurtosis across assorted parameter settings for the L-EOR–W distribution, showcasing its shape versatility under varying conditions. Diverse skewness and kurtosis plots indicate that the L-EOR–W distributions can have different symmetry and tail characteristics.

4.4. Lomax-Exponentiated Odds Ratio–Kumaraswamy Distribution

With the Kumaraswamy distribution as the baseline, characterized by parameters a , b > 0 , we explore the Lomax-exponentiated odds ratio–Kumaraswamy (L-EOR–K) distribution. This variant is particularly notable for its flexibility in modeling data with diverse behaviors through its cdf and pdf:
F L - E O R K ( x ) = 1 1 + α ( 1 x a ) b 1 β k ,
f L - E O R K ( x ) = k α β a b x a 1 ( 1 ( 1 x a ) b ) β 1 ( 1 x a ) b β + 1 1 + α ( 1 x a ) b 1 β k 1 .
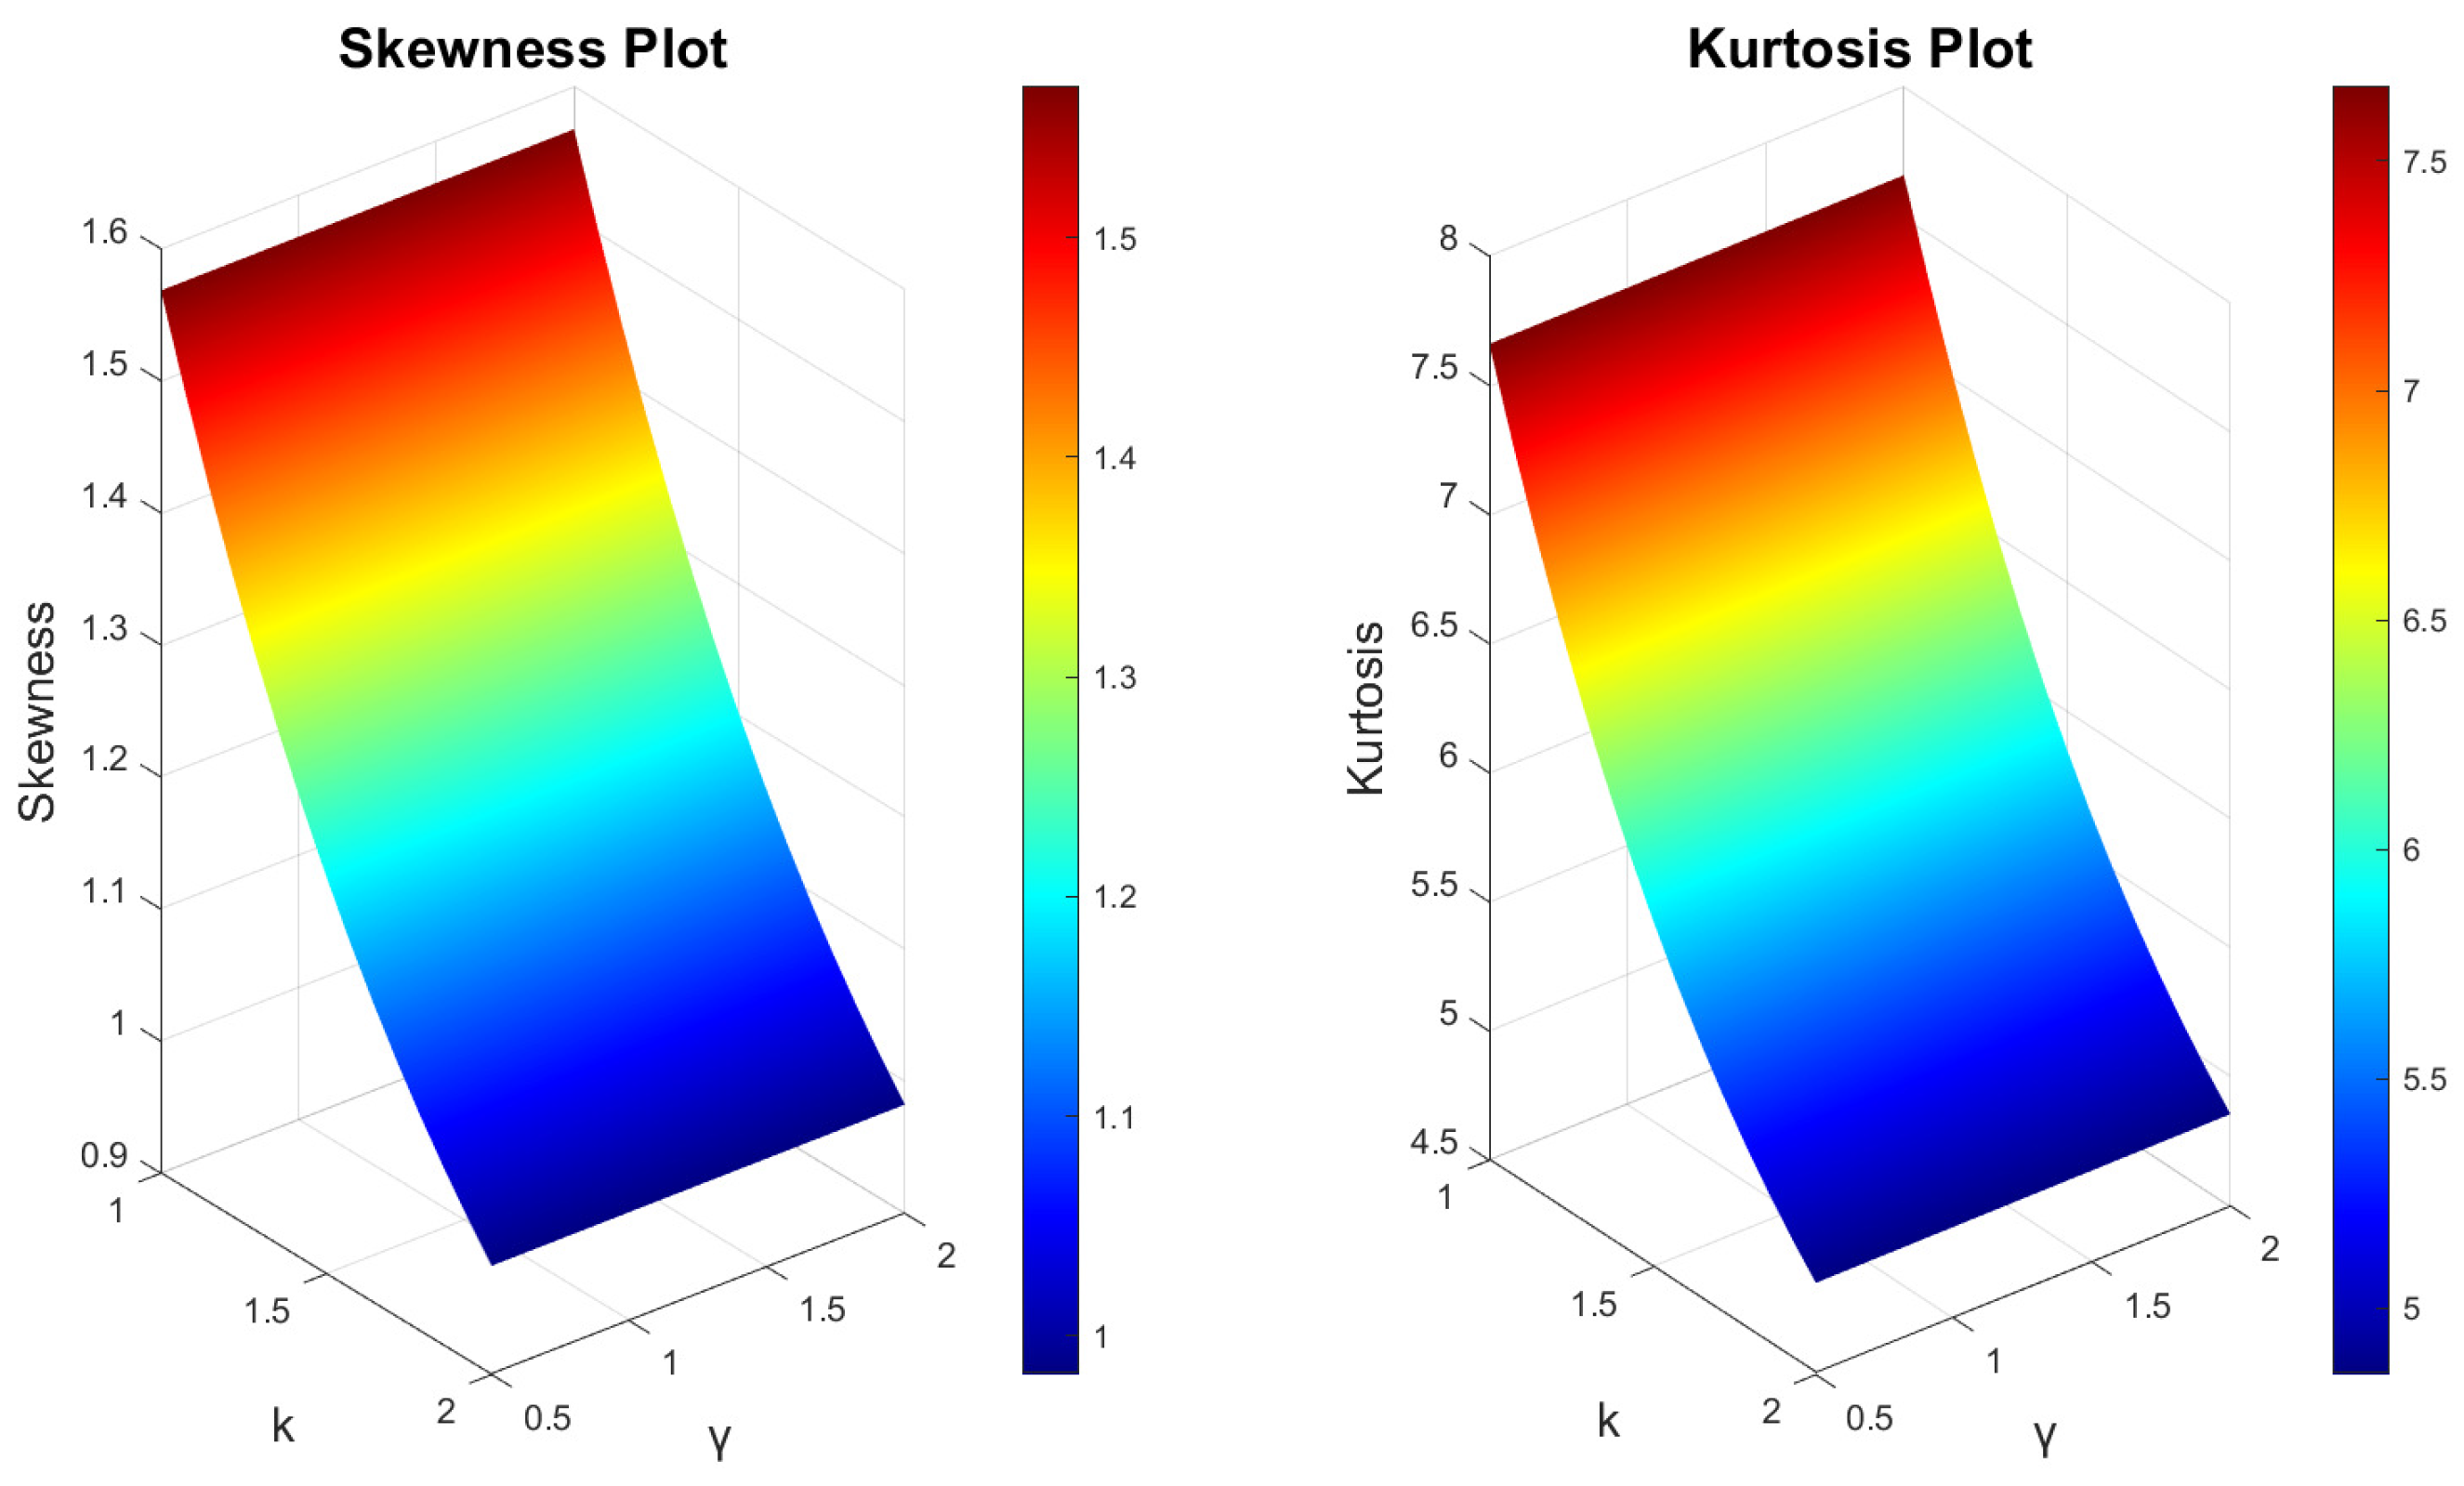
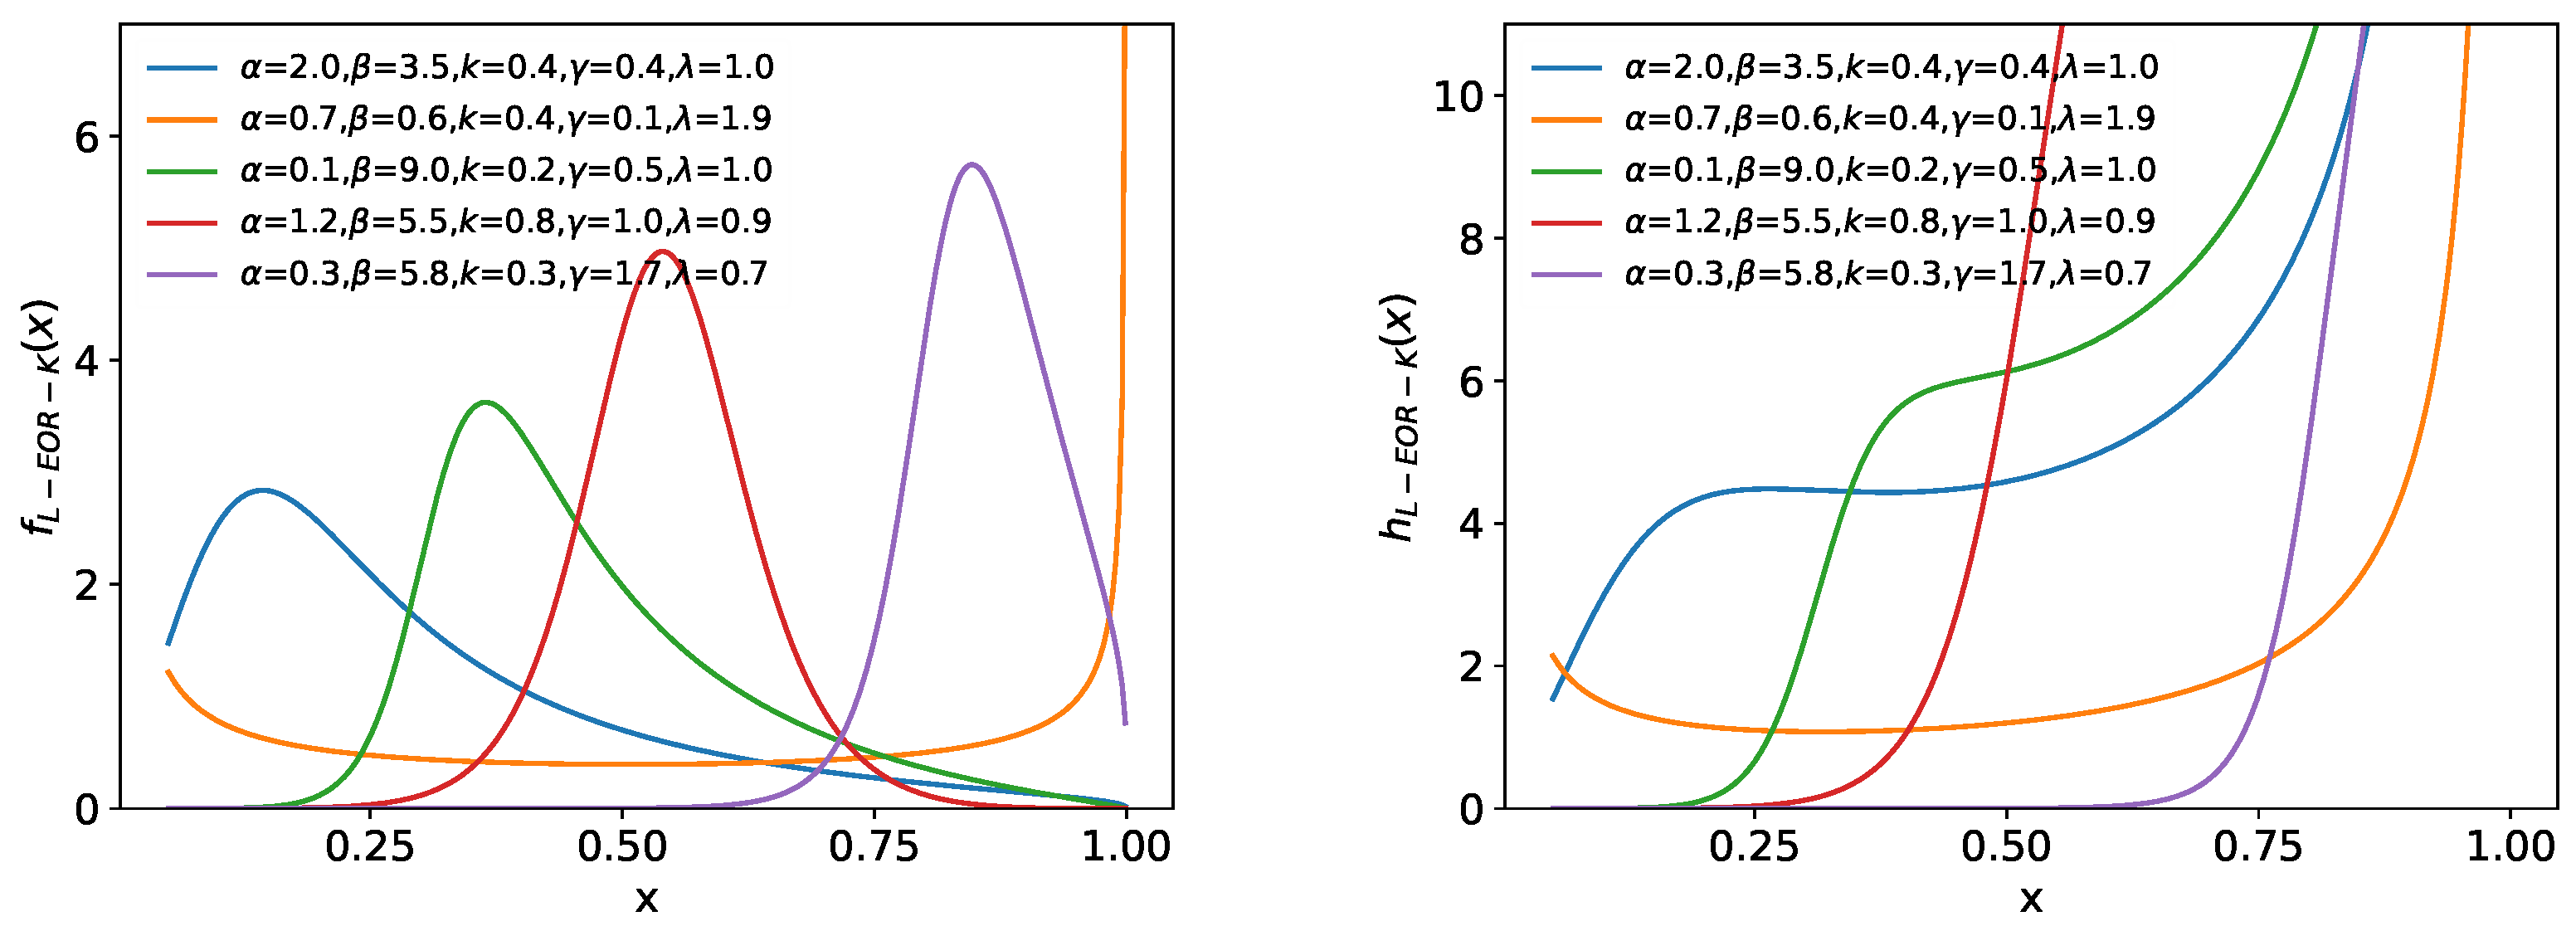
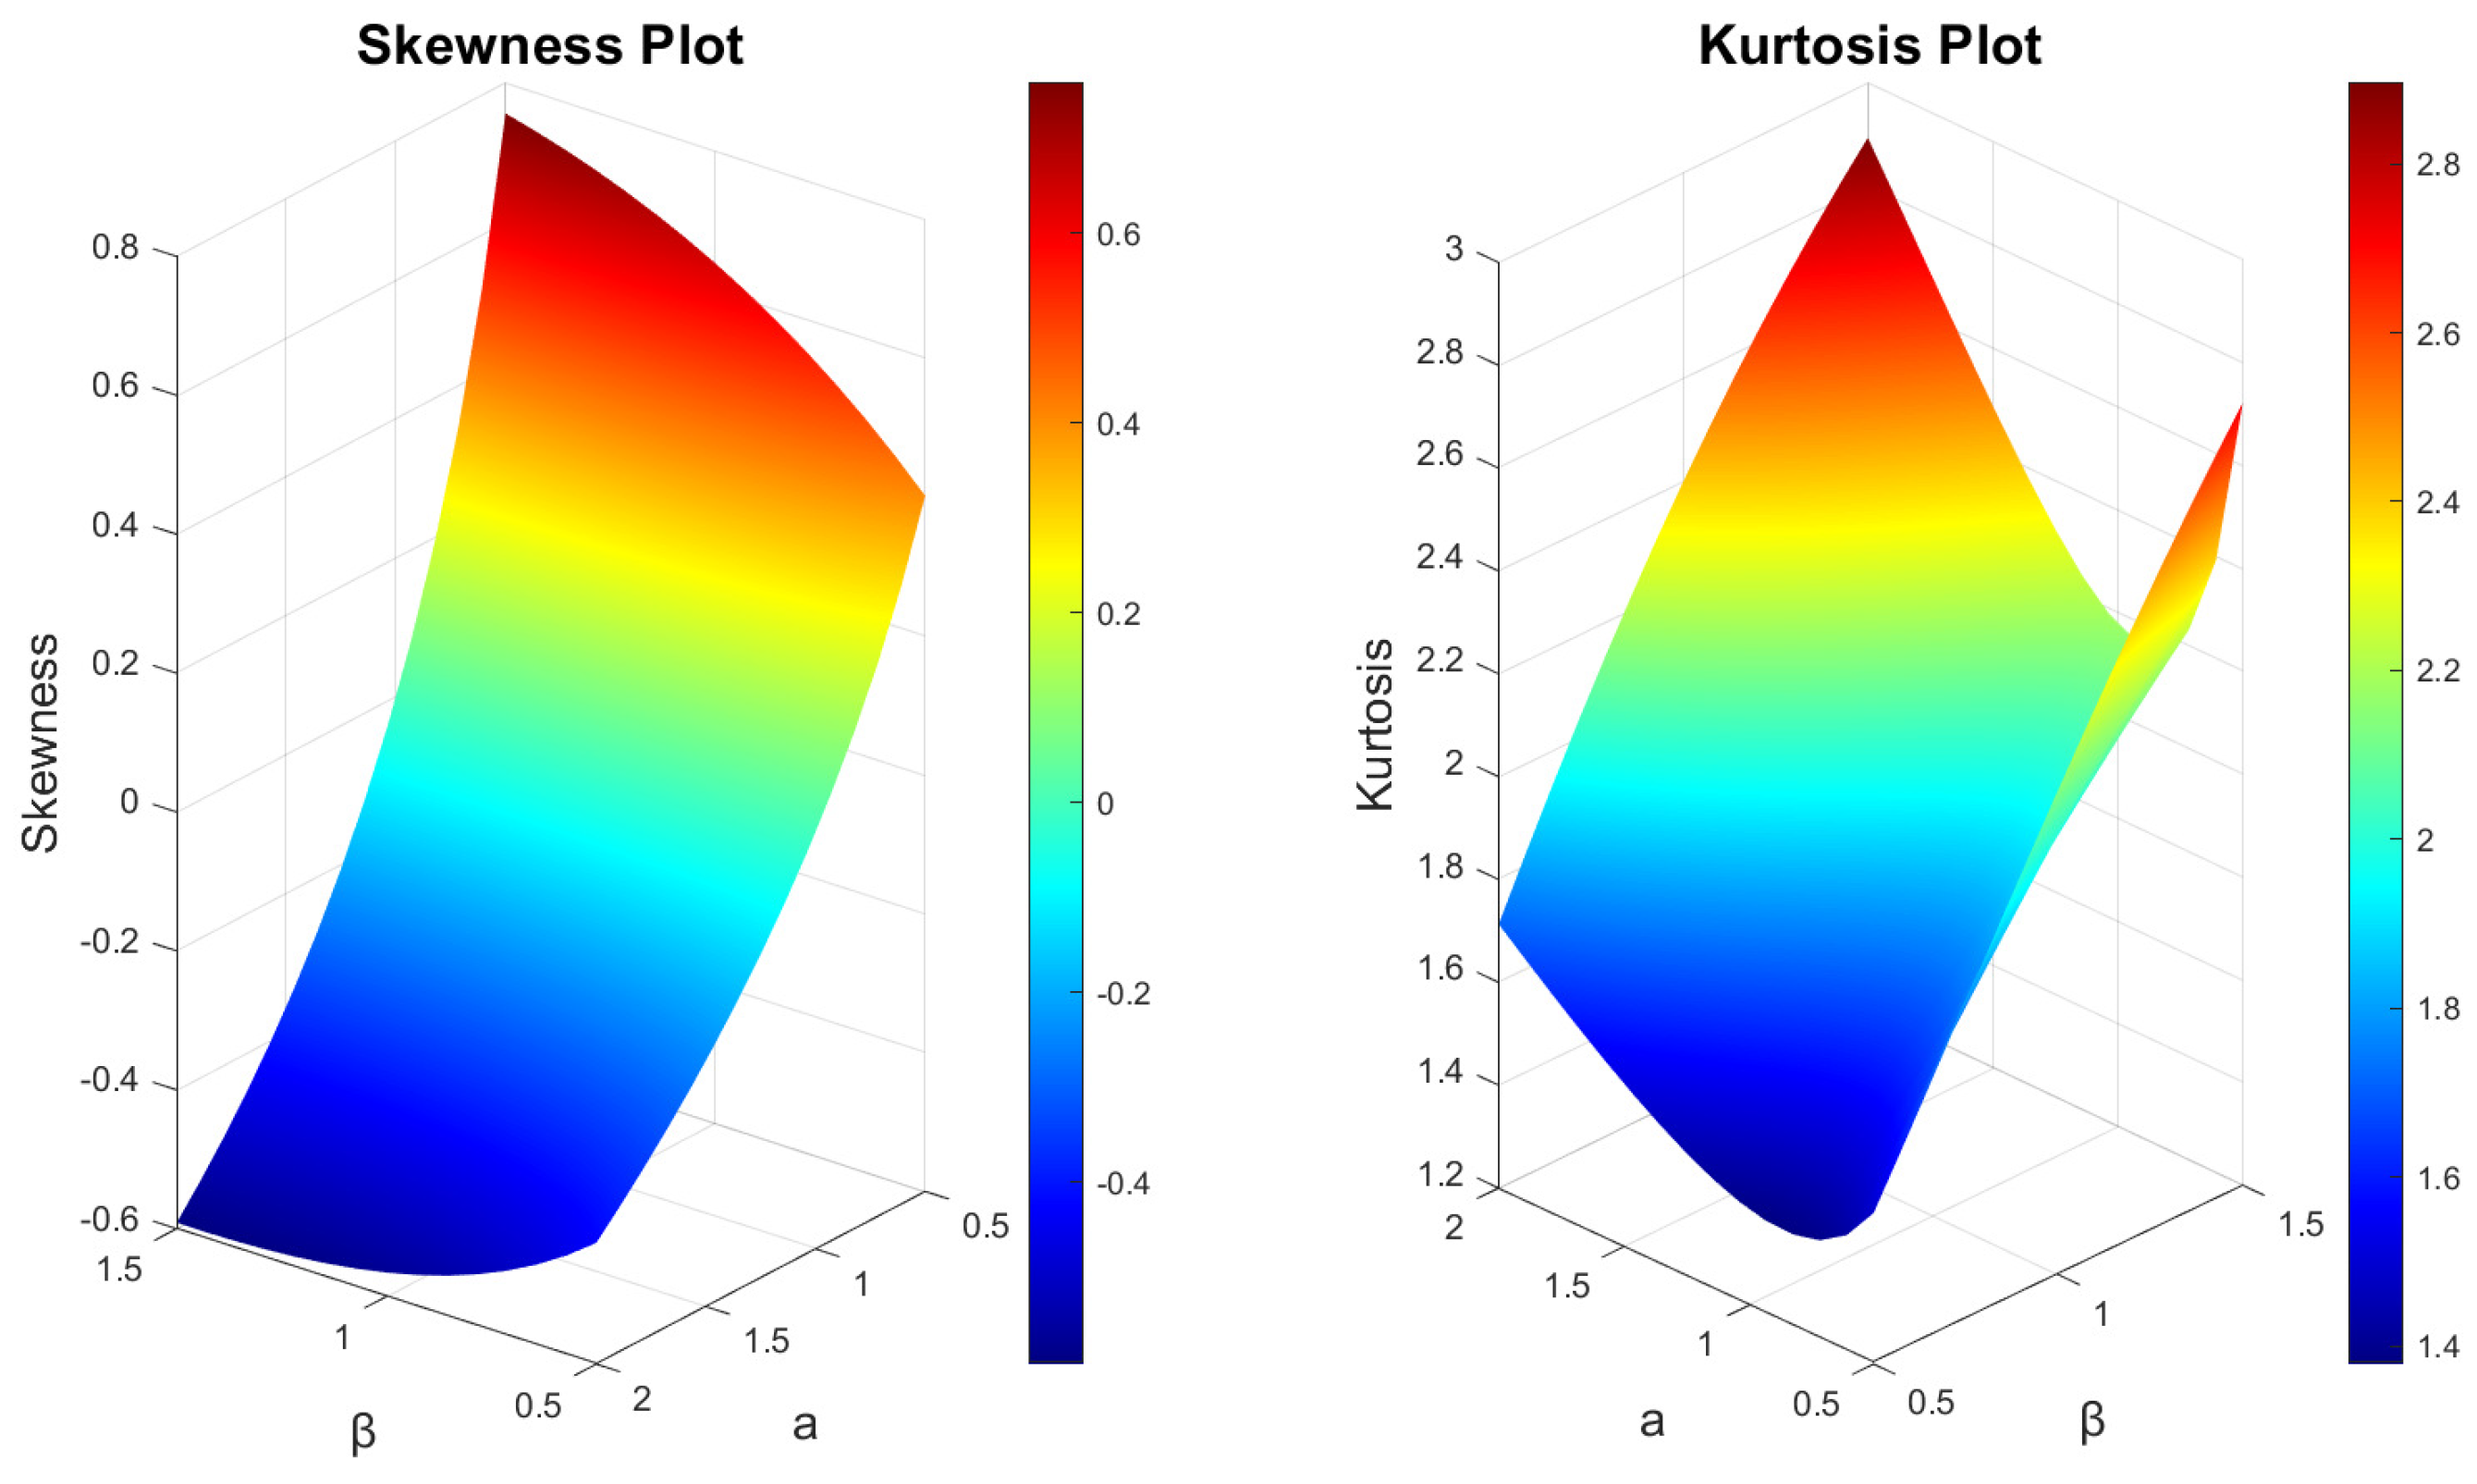
Figure 10 features the pdf for five notable instances within the L-EOR–K distribution framework, exhibiting a spectrum of shapes from unimodal to bathtub configurations. The hrf for these distributions further diversifies the analysis, showcasing U-shaped and varied ascending patterns. Additionally, Figure 11 and Figure 12 delve into the skewness and kurtosis across multiple parameter settings of the L-EOR–K distribution, revealing its capacity to span a broad range from negative to positive values in skewness, emphasizing the model’s extensive flexibility in statistical shape representation. The skewness and kurtosis plots suggest that the L-EOR–K distributions can have different symmetry and tail shapes.
This exploration of special cases within the L-EOR–G distribution framework not only emphasizes its theoretical significance but also shows its practical potential in modeling real-world data with varying characteristics.

5. Methods of Estimation

This section provides an in-depth examination of the diverse estimation methodologies applicable to the Lomax-exponentiated odds ratio–G distribution. The array of approaches, from maximum likelihood estimation to the Anderson–Darling approach, demonstrates the distribution’s efficacy in statistical modeling. This exploration highlights the adaptability and robust nature of the L-EOR–G model through various estimation strategies, affirming its utility in diverse analytical scenarios.

5.1. Maximum Likelihood Estimation

The maximum likelihood estimator (MLE) method is widely recognized for its efficacy in parameter estimation within distributions. Let Δ = ( α , β , k , ψ ) T , then the likelihood for Δ is given by the following:
( f L - E O R G n ( Δ ) ) = n ( log ( k ) + log ( α ) + log ( β ) ) + i = 1 n log [ g ( x i , ψ ) ] + ( β 1 ) i = 1 n log [ G ( x i , ψ ) ] ( β + 1 ) i = 1 n log [ G ¯ ( x i , ψ ) ] ( k + 1 ) i = 1 n log 1 + α G ( x i , ψ ) G ¯ ( x i , ψ ) β .
The MLE can be obtained by solving the nonlinear equations α , β , k , ψ k = 0 employing numerical methods, such as the Newton–Raphson approach.

5.2. Least Squares and Weighted Least Squares Estimation

Both (weighted) least squares estimation (LS or WLS) methodologies provide estimators for model parameters, with the LS estimation formulated as follows:
L S ( σ ) = i = 1 n F L - E O R G ( x i , σ ) i n + 1 2 .
The WLS estimation, on the other hand, seeks to minimize the following:
W L S ( σ ) = i = 1 n ( n + 1 ) 2 ( n + 2 ) i ( n i + 1 ) F L - E O R G ( x i , σ ) i n + 1 2 .
LS or WLS can be derived by solving the nonlinear equations L S k , L S α , L S β , L S ψ s = 0 using numerical methods like the Newton–Raphson approach.

5.3. Maximum Product Spacing Approach of Estimation

The maximum product spacing approach of estimation (MPS) approach proves especially valuable when confronting unknown or intricate distributions, as highlighted by [20].
The geometric mean of MPS spacings is defined as follows:
M P S ( σ ) = i = 1 n + 1 T i ( x i , σ ) 1 n + 1
where
T i ( x i , σ ) = F L - E O R G ( x 1 , σ ) , i = 1 F L - E O R G ( x i , σ ) F L - E O R G ( x i 1 , σ ) , i = 2 , 3 , , n 1 F L - E O R G ( x n , σ ) , i = n + 1
Therefore, the objective is to maximize the following:
M P S ( σ ) = 1 1 + α G ¯ ( x 1 , ψ ) G ( x 1 , ψ ) β k 1 + α G ¯ ( x n , ψ ) G ( x n , ψ ) β k × i = 2 n 1 + α G ¯ ( x i 1 , ψ ) G ( x i 1 , ψ ) β k 1 + α G ¯ ( x i , ψ ) G ( x i , ψ ) β k 1 n + 1
Equivalently, we can maximize the function L ( σ ) = log [ M P S ( σ ) ]
L ( σ ) = 1 n + 1 i = 1 n + 1 log [ T i ( x i , σ ) ] = 1 n + 1 k log 1 + α G ¯ ( x n , ψ ) G ( x n , ψ ) β + log 1 1 + α G ¯ ( x 1 , ψ ) G ( x 1 , ψ ) β k + i = 2 n log 1 + α G ¯ ( x i 1 , ψ ) G ( x i 1 , ψ ) β k 1 + α G ¯ ( x i , ψ ) G ( x i , ψ ) β k
The MPS is achievable by solving the nonlinear equations L k , L α , L β , L ψ s = 0 via numerical methods. The MPS approach is particularly useful when dealing with unknown or complex distributions, enhancing the robustness of the estimation process.

5.4. Cramér–von Mises Approach of Estimation

We can employ the Cramér–von Mises criterion to derive estimators by minimizing the function C V M ( x , σ ) with respect to σ , where
C V M ( x , σ ) = 1 12 n 2 + 1 n i = 1 n F L - E O R G ( x i , σ ) 2 i 1 2 n 2 = 1 12 n 2 + 1 n i = 1 n 1 1 + α G ¯ ( x i , ψ ) G ( x i , ψ ) β k 2 i 1 2 n 2

5.5. Anderson–Darling Approach of Estimation

The Anderson–Darling approach of estimation can be determined by minimizing the function A D ( σ ) with respect to σ , where
A D ( σ ) = n 1 n i = 1 n ( 2 i 1 ) [ log F L - E O R G ( x i , σ ) log F ¯ L - E O R G ( x n + 1 i , σ ) ] = n 1 n i = 1 n ( 2 i 1 ) k log 1 + α G ¯ ( x n + 1 i , ψ ) G ( x n + 1 i , ψ ) β + log 1 1 + α G ¯ ( x i , ψ ) G ( x i , ψ ) β k
The AD approach enables the refinement of estimations, contributing to the accurate characterization of the L-EOR–G distribution.

5.6. Simulation Study

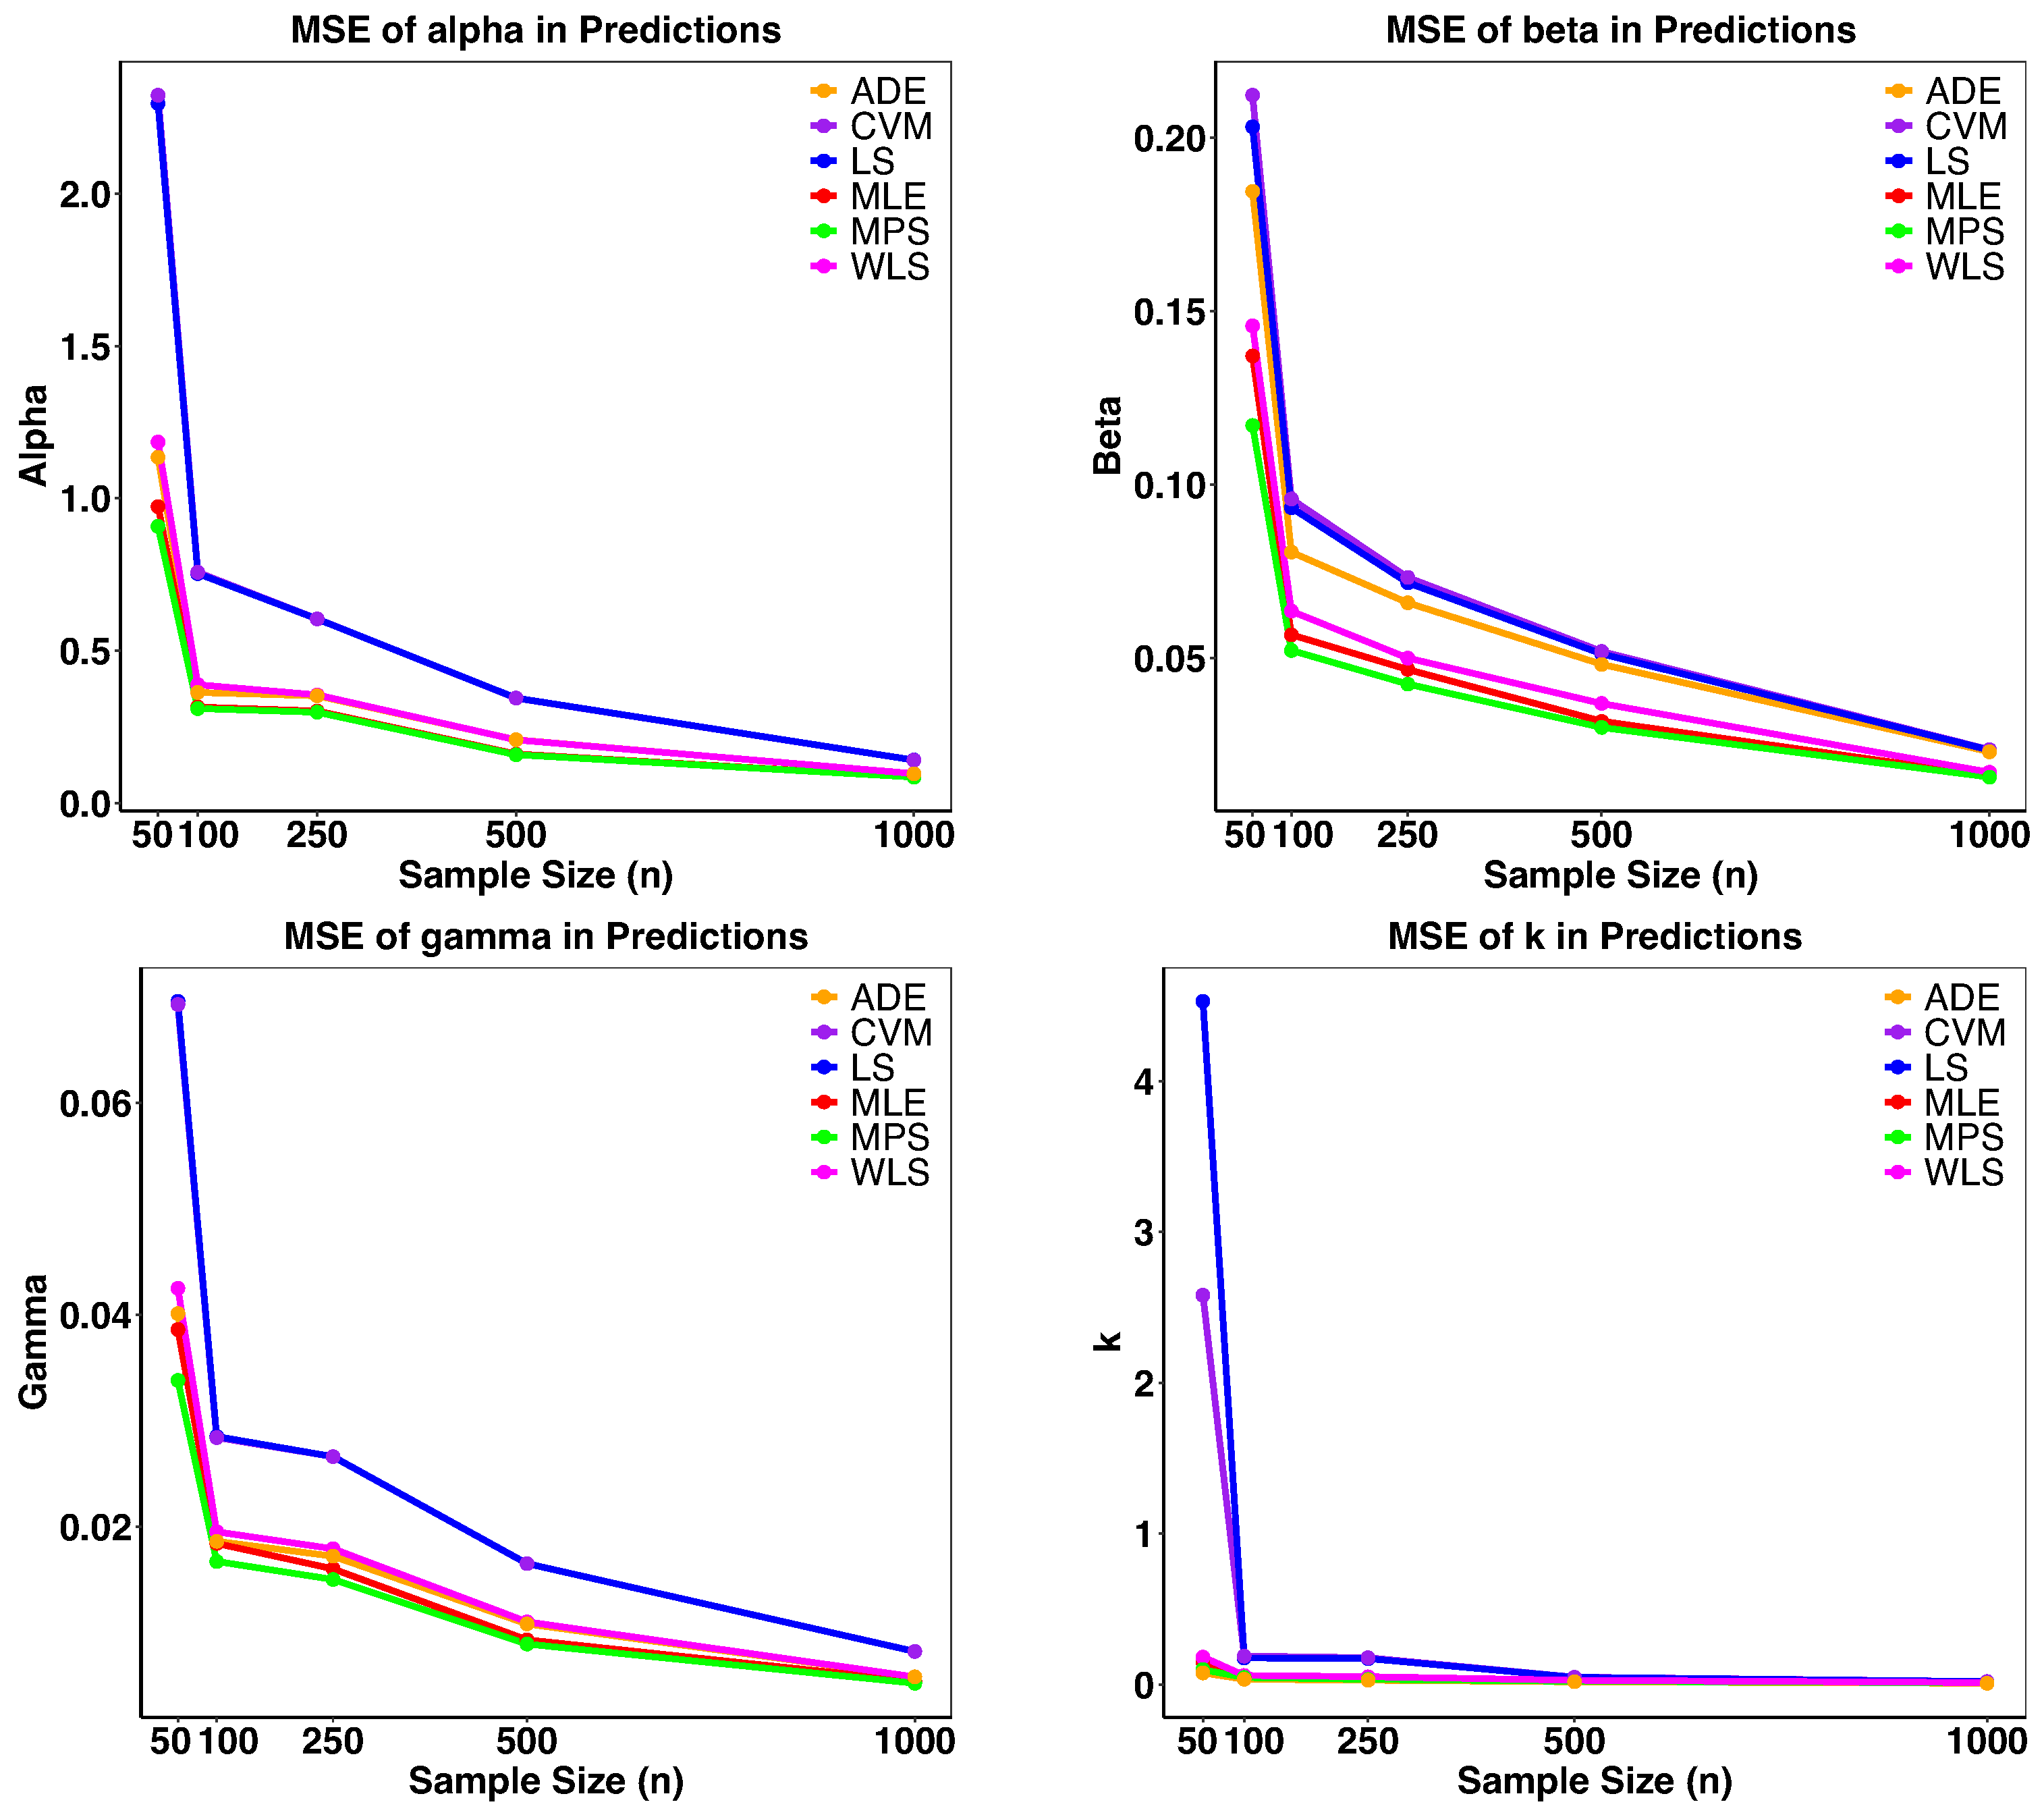
In this subsection, we incorporate a simulation study to show the practical application of the estimation techniques explored. By integrating Monte Carlo simulations with various estimation strategies, we aim to estimate the parameters of Lomax-exponentiated odds ratio–exponential distribution with predefined settings, such as α = 1.5 , β = 2.9 , γ = 1.3 , and k = 0.8 . Sample sizes of N = 50 , 100 , 250 , 500 , and 1000 were utilized to generate random samples, with each experiment replicated N = 500 times to ensure robustness. Subsequently, both the bias and mean squared error (MSE) were computed for each dataset to evaluate the estimators’ performance. The outcomes, illustrated in Table 1 and Figure 13 within this paper, reveal that MSE tends toward zero as sample size increases, affirming the reliability and stability of the estimations across different scenarios. This empirical analysis not only validates the effectiveness of the estimation methods but also demonstrates their applicability in real-world data analysis, thereby enhancing the L-EOR–G distribution’s utility in statistical modeling.

6. Applications

In this section, we delve into applying our proposed model to datasets from the real world, aiming to illustrate its efficiency and flexibility. We test the Lomax-exponentiated odds ratio–exponential distribution (LEORE) against a selection of established models, including the exponentiated generalized Gumbel type-two (EGG2) [21], exponentiated Weibull logistic (EWL) [22], Lomax–Gumbel type-2 (LGT) [23], Kumaraswamy–Weibull (KW) [24], and type-2 Gumbel (T2G) [25].
Our comparative analysis employs a comprehensive set of metrics for evaluating model performance, such as the −2 log-likelihood, Cramér–von Mises ( W ), Anderson–Darling ( A ), Akaike information criterion (AIC), Bayesian information criterion (BIC), consistent Akaike information criterion (CAIC), Hannan–Quinn information criterion (HQIC), and the Kolmogorov–Smirnov (K-S) statistic with its p-value, to determine the most suitable model for capturing the intricacies of the observed data.

6.1. Analysis of Carbon Fiber Strength Data

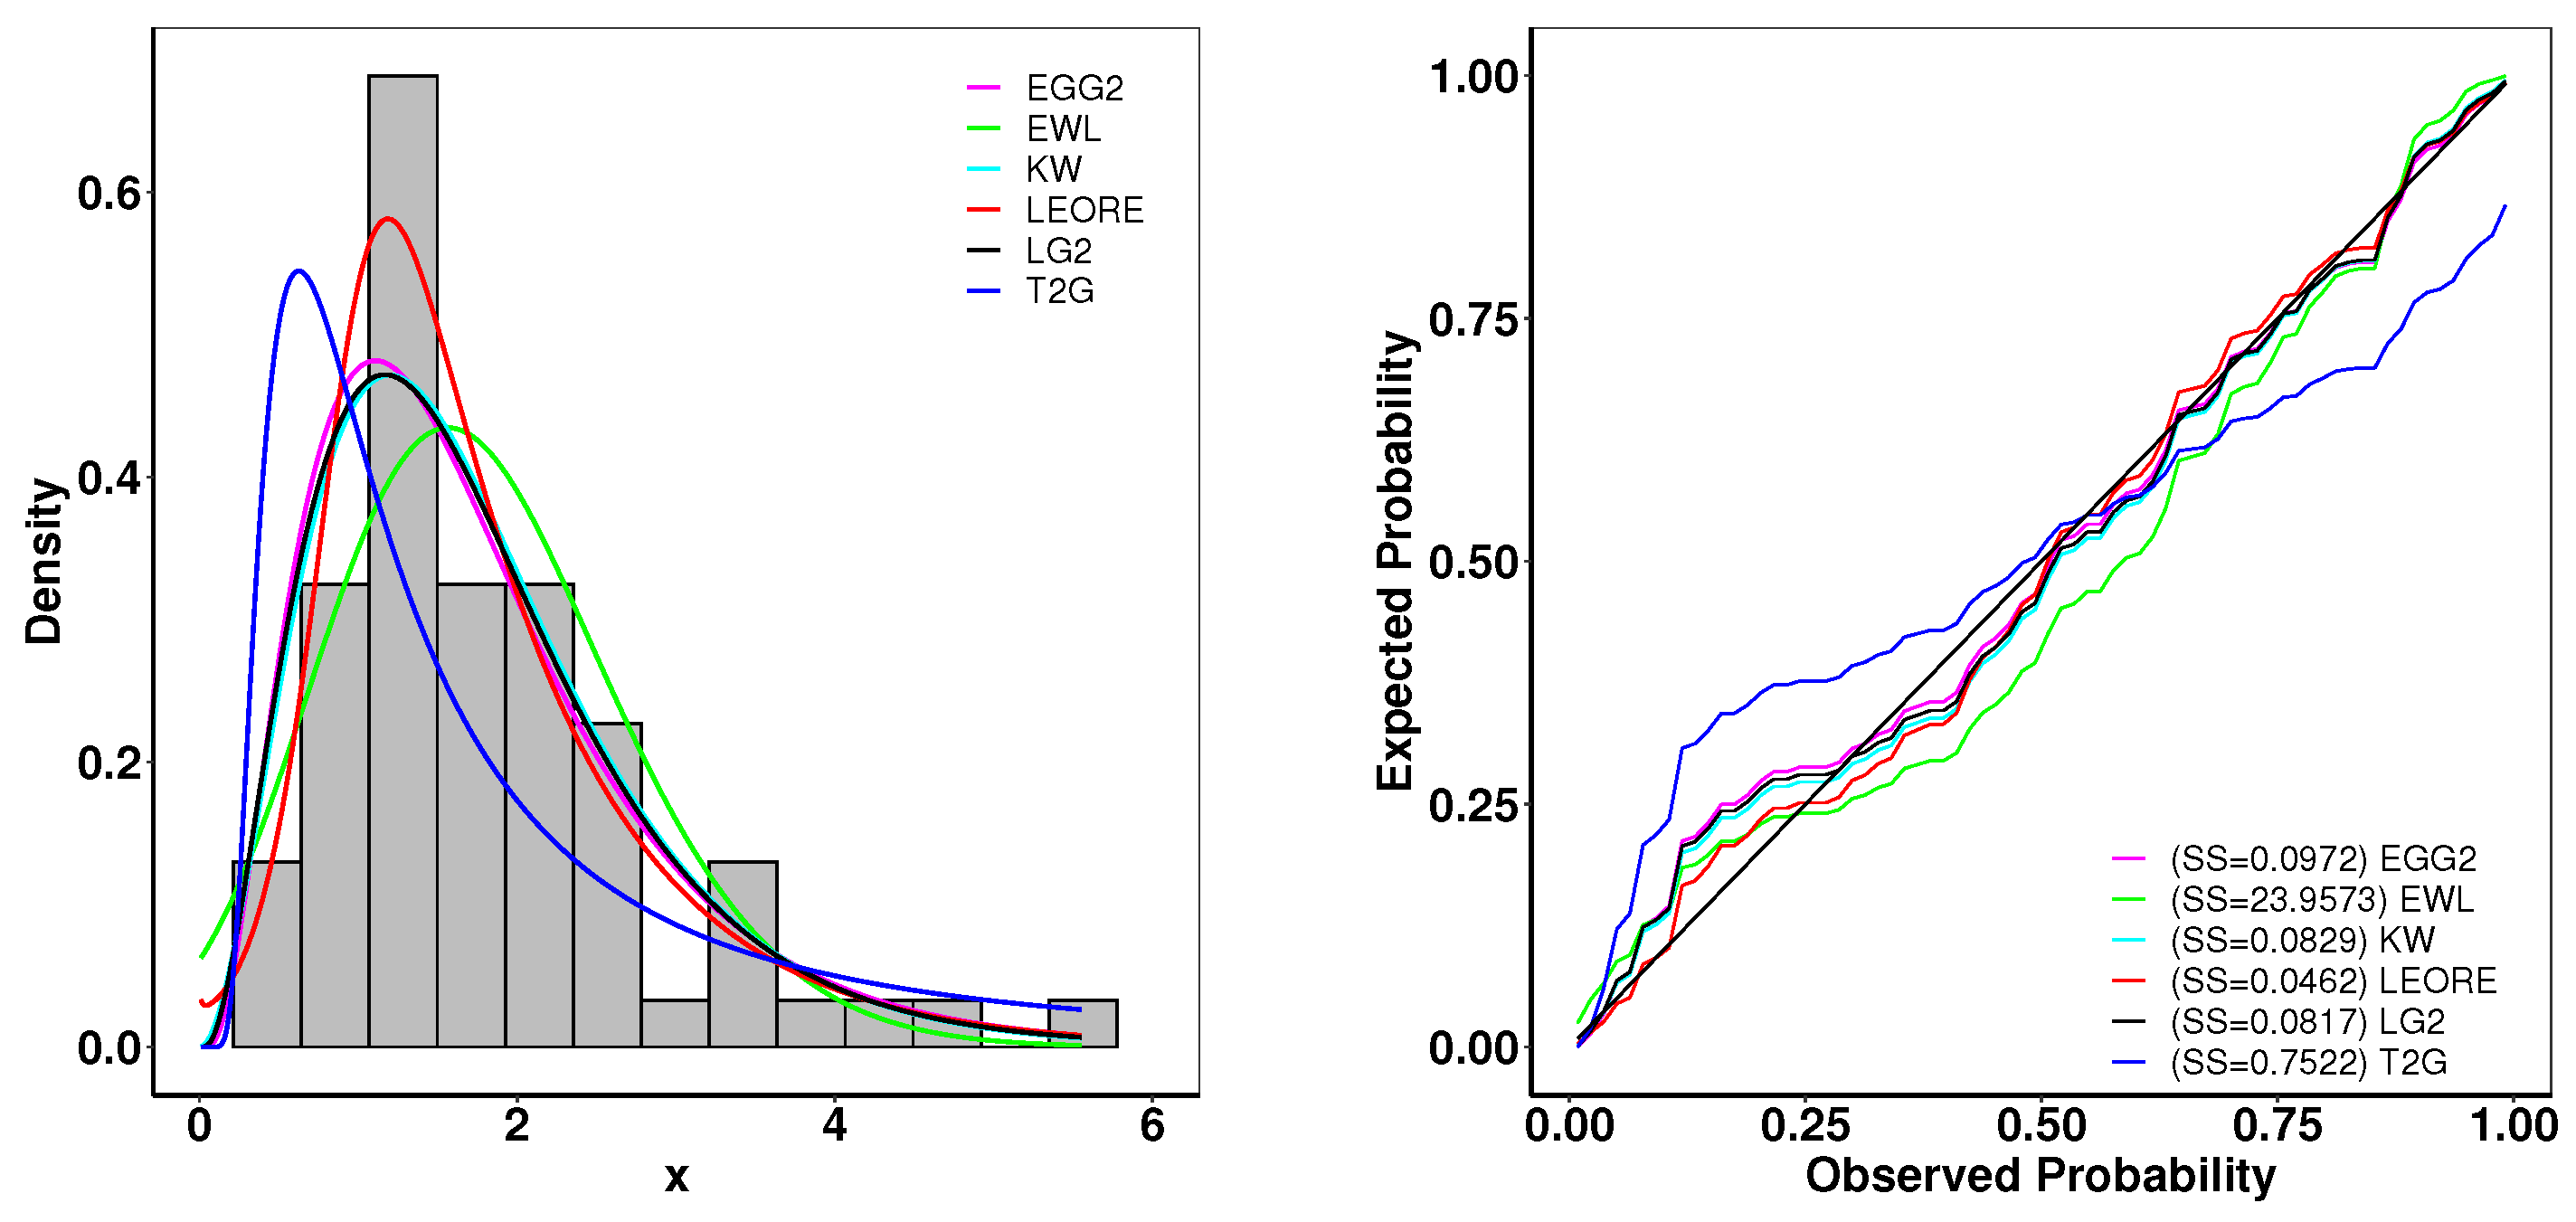
This section examines the breaking strength data of carbon fibers, each with a length of 50 mm, based on a study with a sample size of n = 66 , as detailed by Nichols et al. [26]. We present a detailed comparison of parameter estimates and goodness-of-fit statistics in Table 2. Furthermore, Figure 14 displays the empirical distribution of the observed data alongside the estimated density functions of several fitted models. Among these, the LEORE distribution emerges as the superior fit for this dataset, evidenced by its exemplary goodness-of-fit statistics and the most favorable K-S test p-value, as tabulated in Table 2.
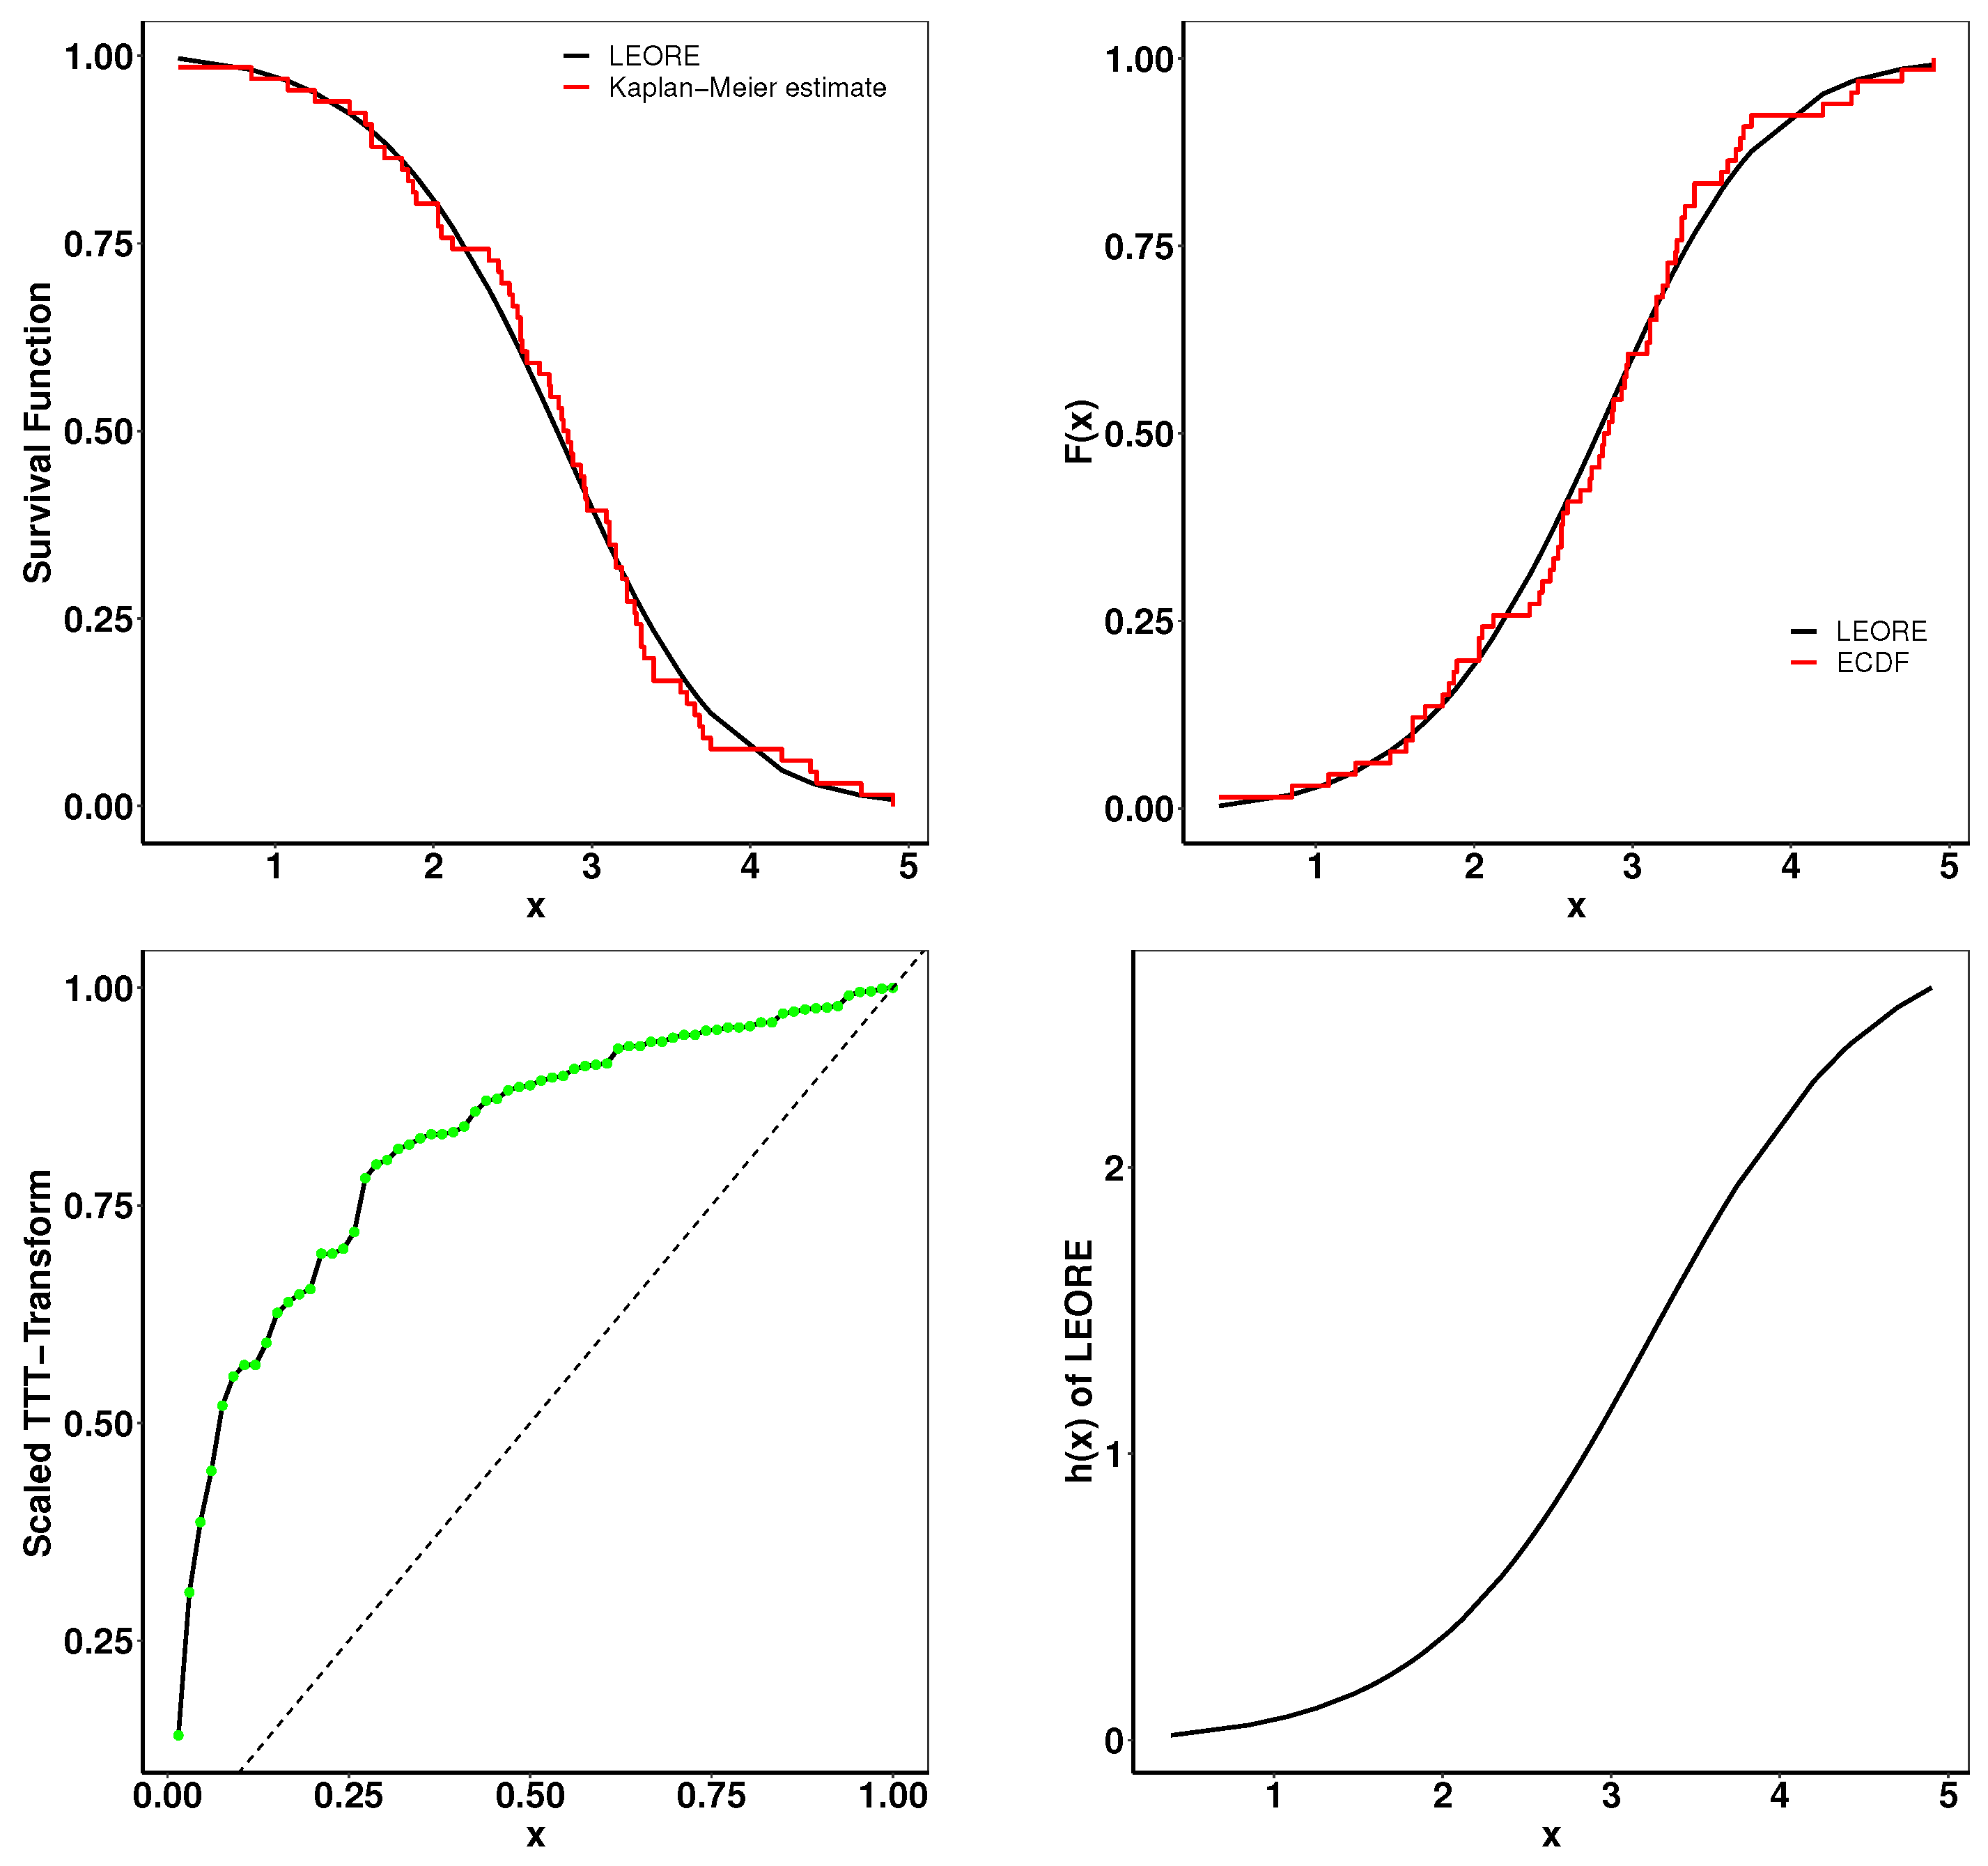
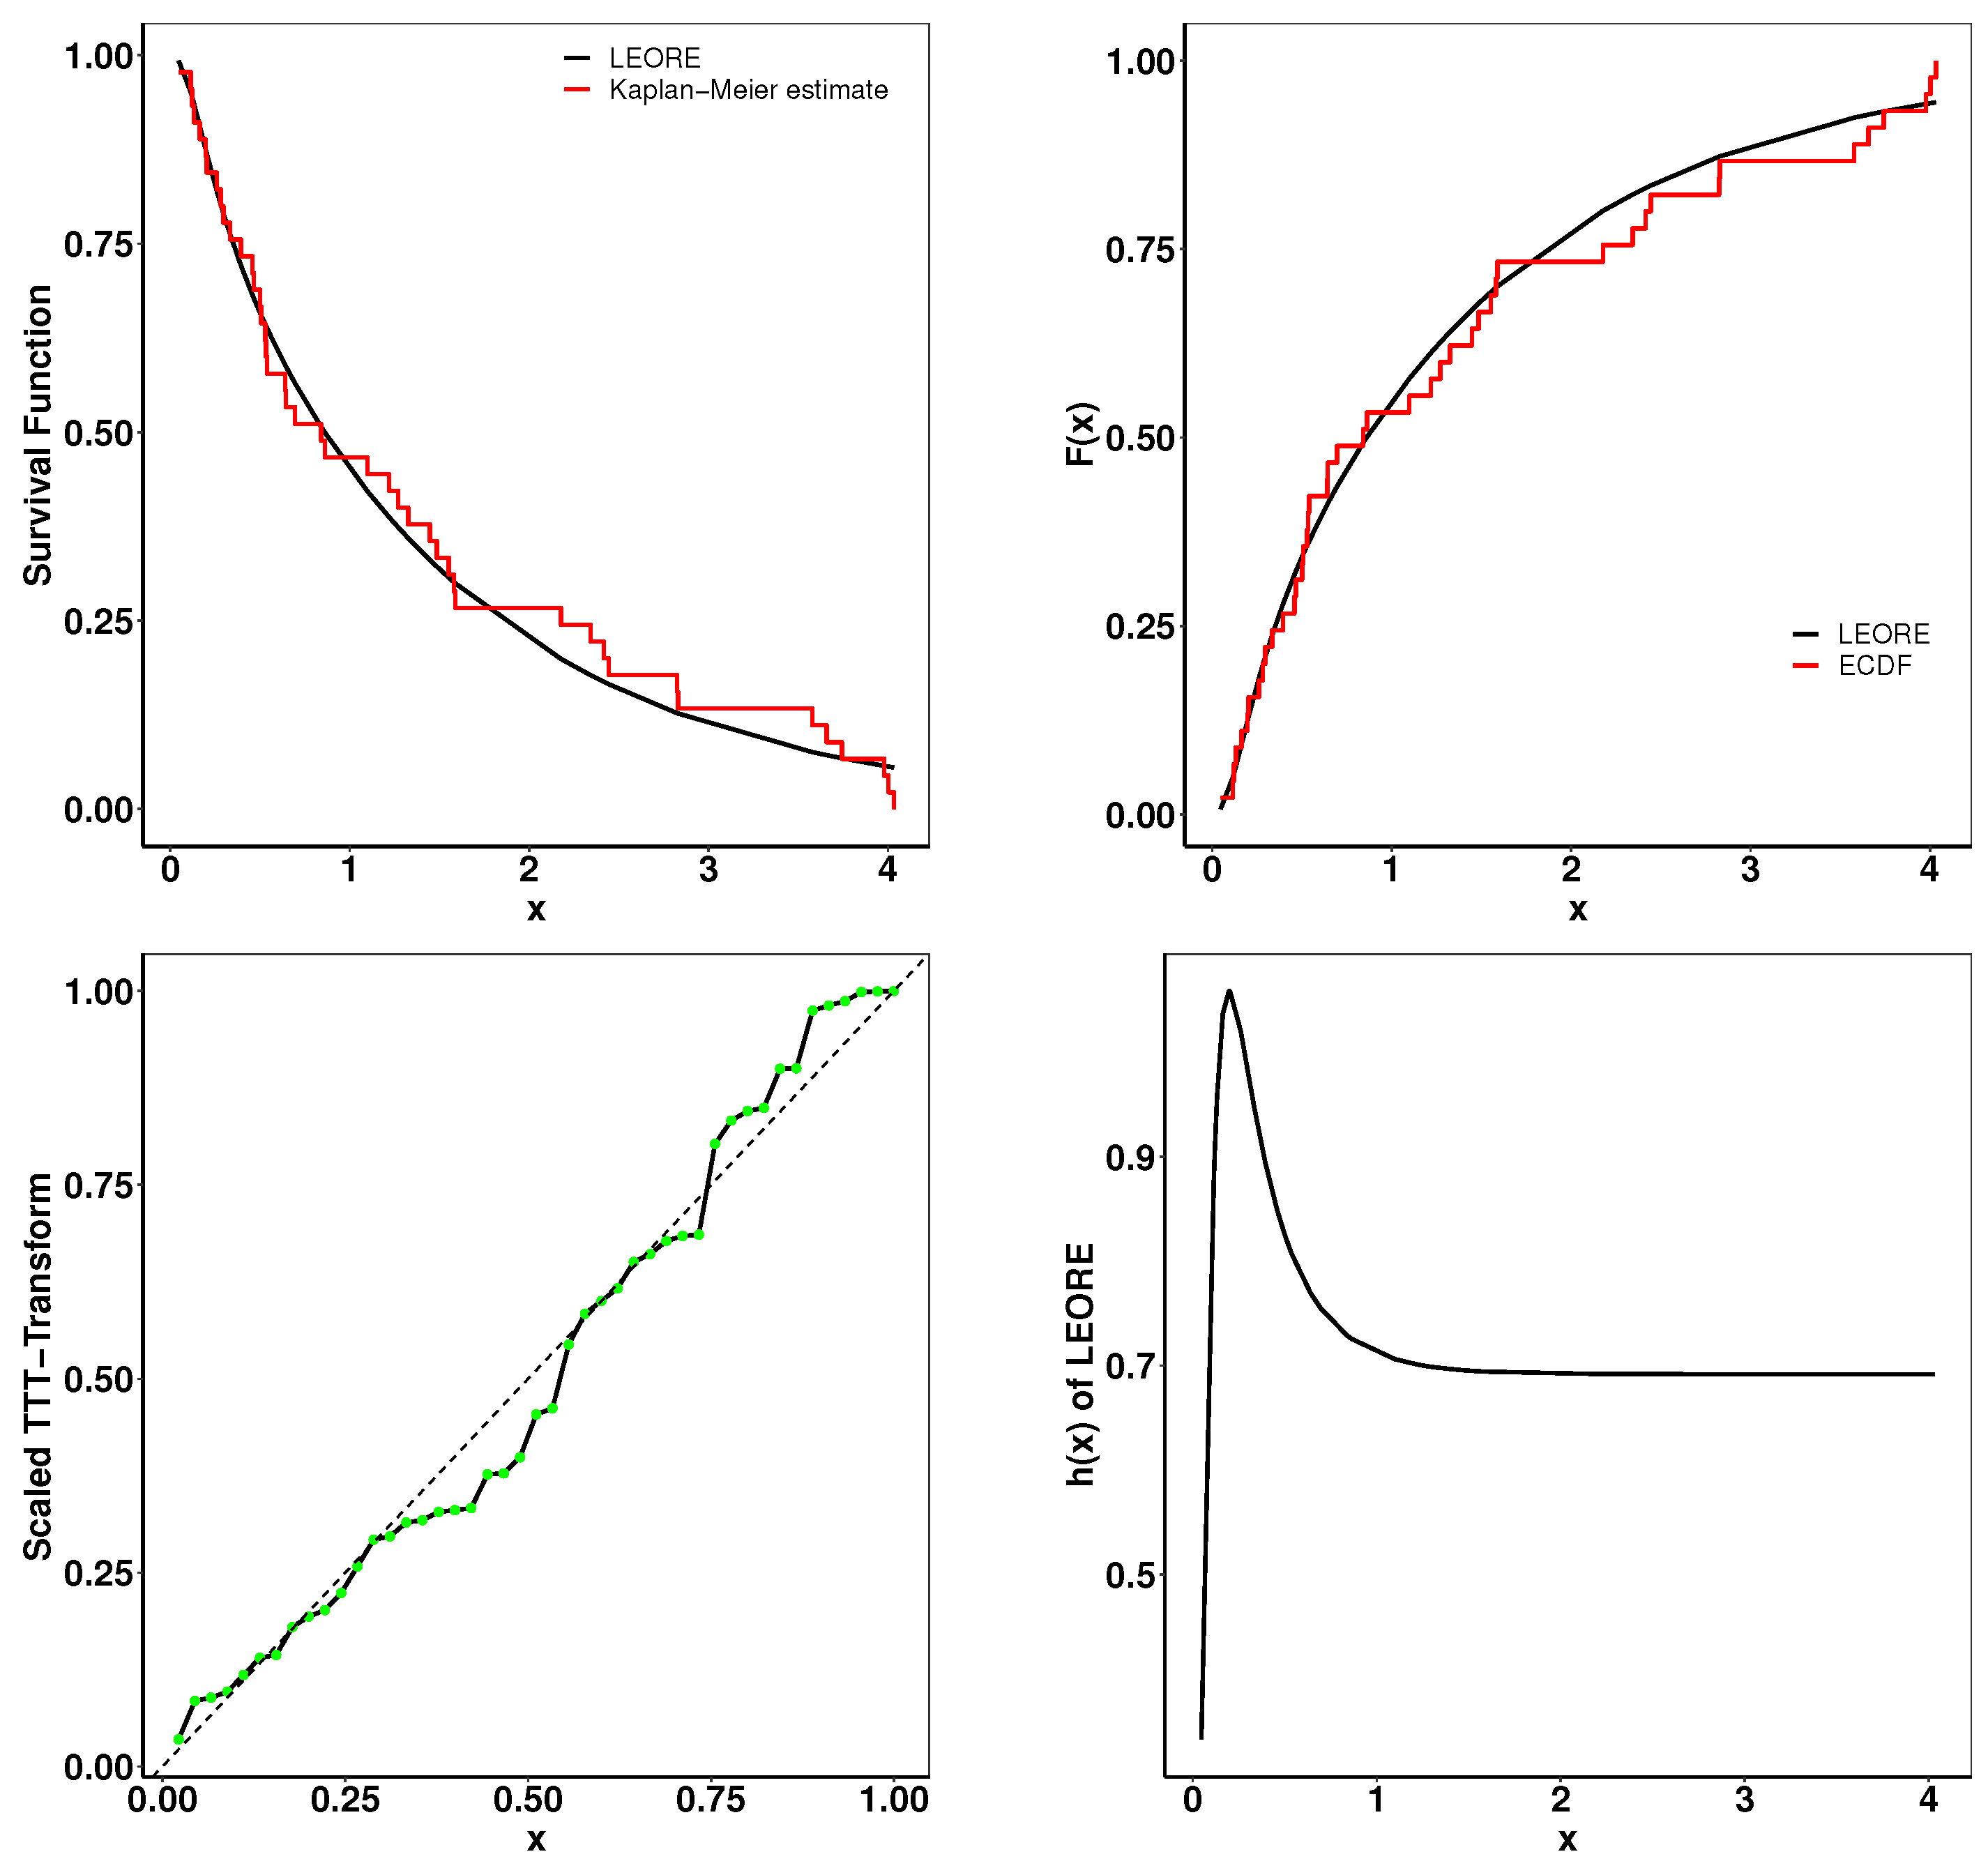
In addition, Figure 15 presents a collection of diagnostic plots, including the Kaplan–Meier (K-M) survival curve, juxtapositions of the theoretical and empirical cumulative distribution functions (TCDF and ECDF), and a scaled total time on test (TTT) plot. The congruence between theoretical forecasts and empirical observations reaffirms the suitability of the LEORE distribution in accurately modeling the dataset, particularly highlighting its capacity to capture non-monotonic hazard rate behaviors.

6.2. Survival Analysis of Guinea Pigs

This dataset encompasses survival durations of guinea pigs following injections with tubercle bacilli, explored in the study by Kundu et al. [27]. Parameter estimations along with goodness-of-fit metrics are detailed in Table 3. Figure 16 shows the histogram of actual survival times against the density curves of several fitted models. The LEORE distribution distinctly outperforms its counterparts, as evidenced by its superior goodness-of-fit indicators and the most significant K-S test p-value.
Additionally, a set of illustrative plots—including the K-M survival curve, both TCDF and ECDF, and the TTT plot—are presented in Figure 17. The remarkable alignment between empirical data and theoretical predictions reinforces the LEORE model’s accuracy in fitting the data. The TTT plot, in particular, suggests the model’s proficiency in delineating a monotonic hazard rate structure, further confirming its applicability.

6.3. Analysis of Chemotherapy Treatment Data

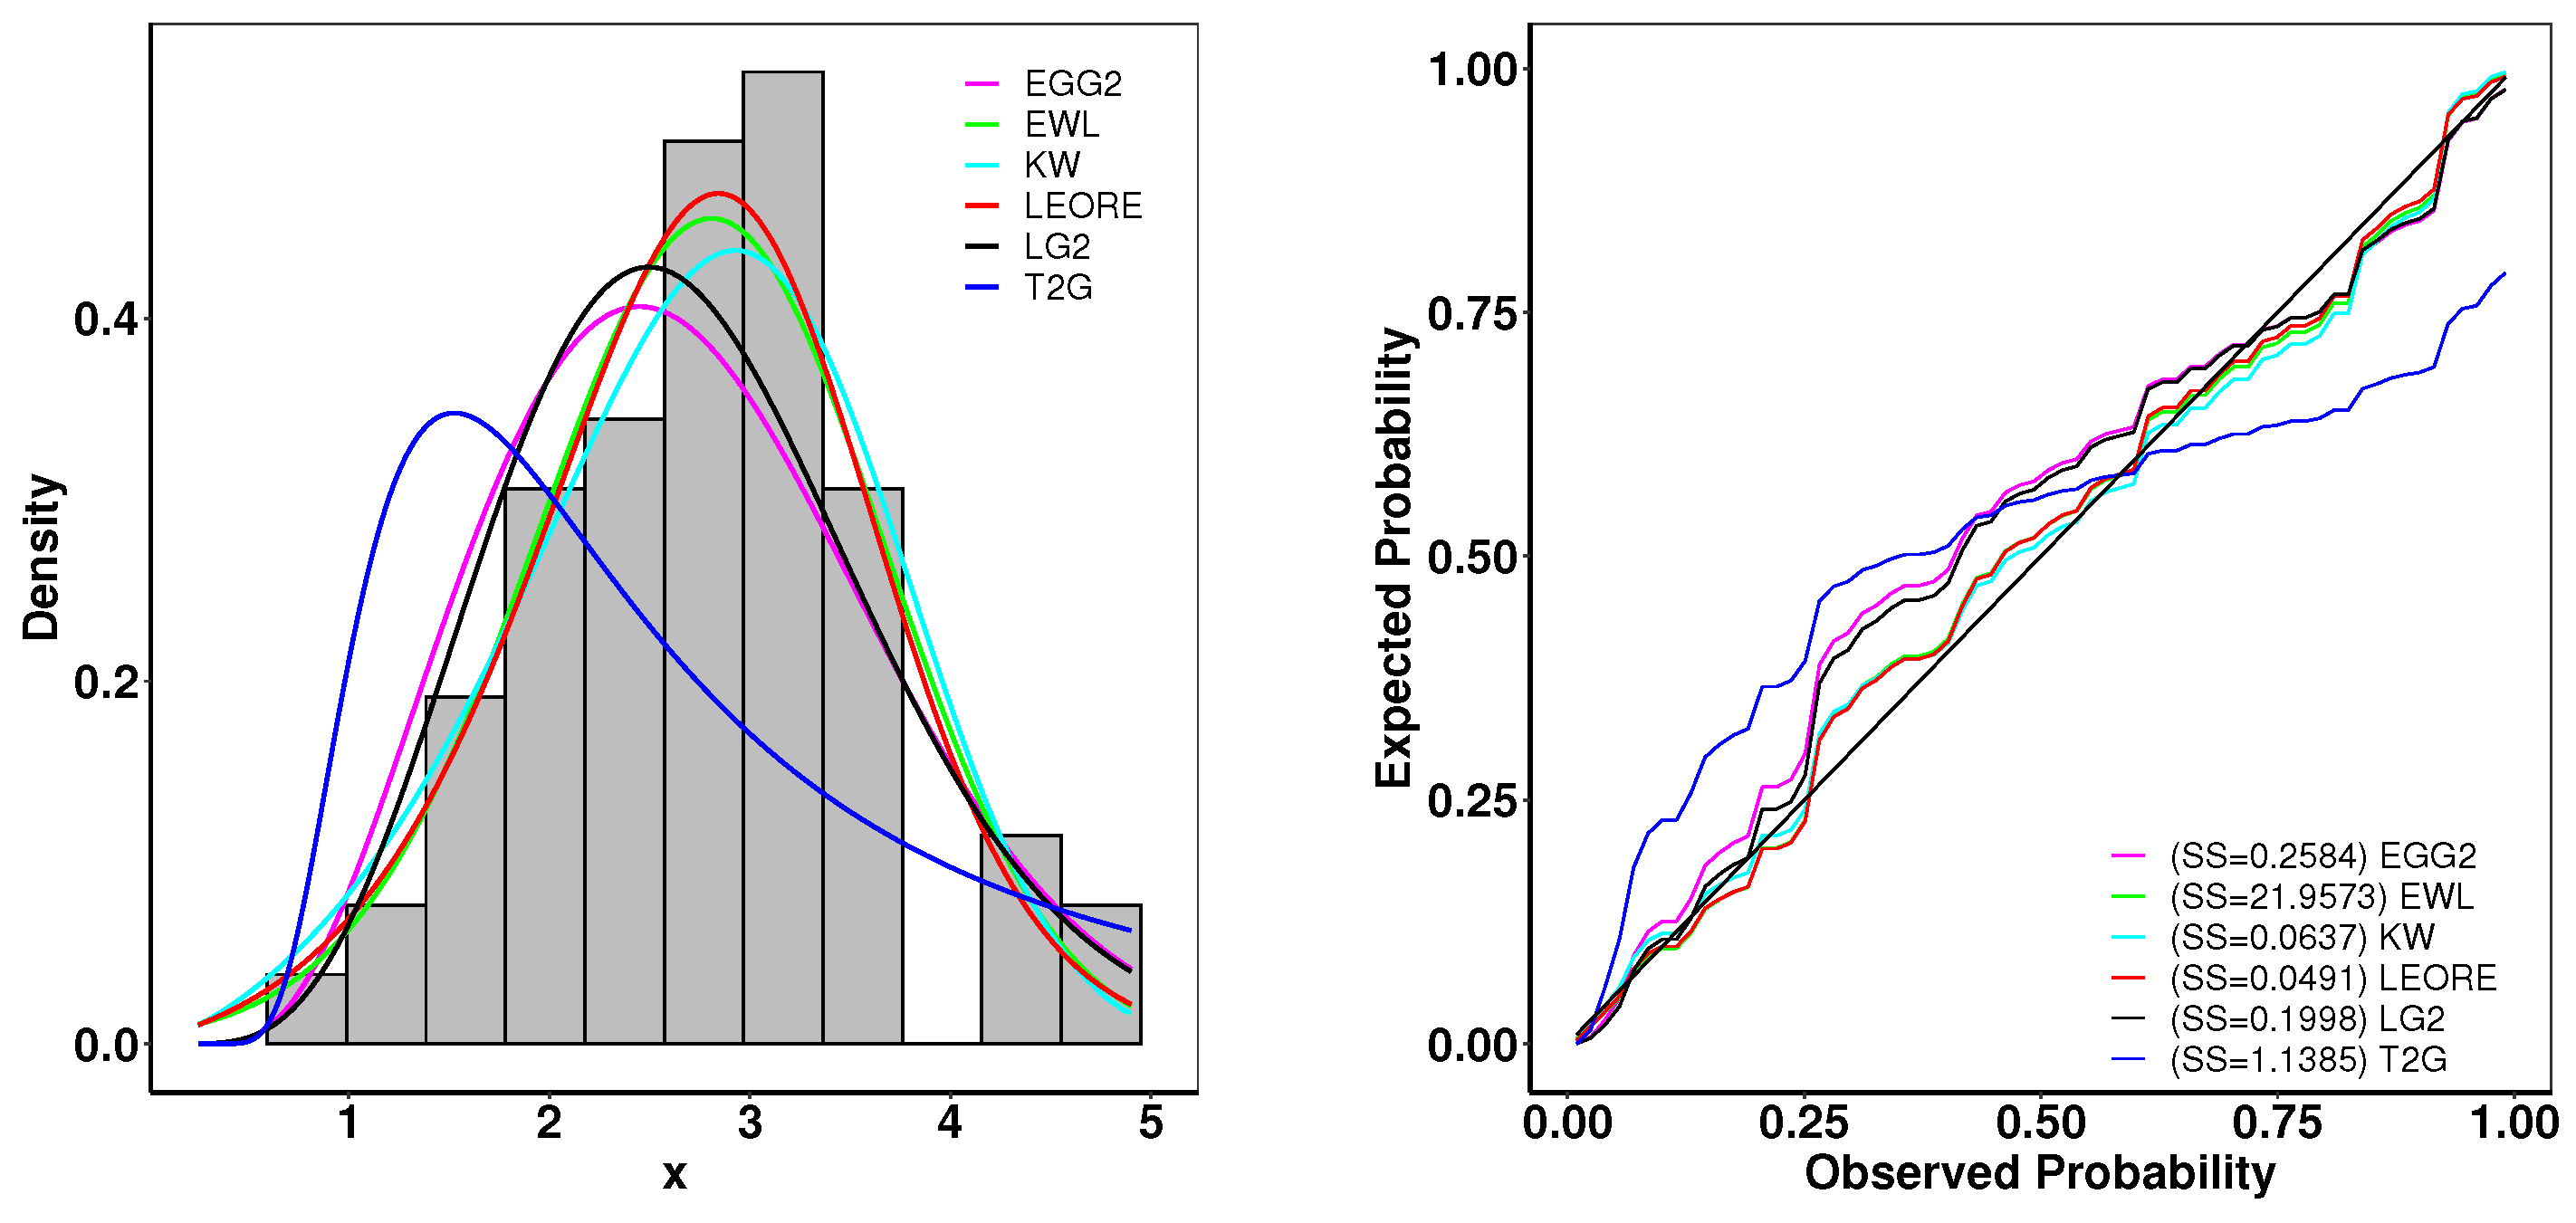
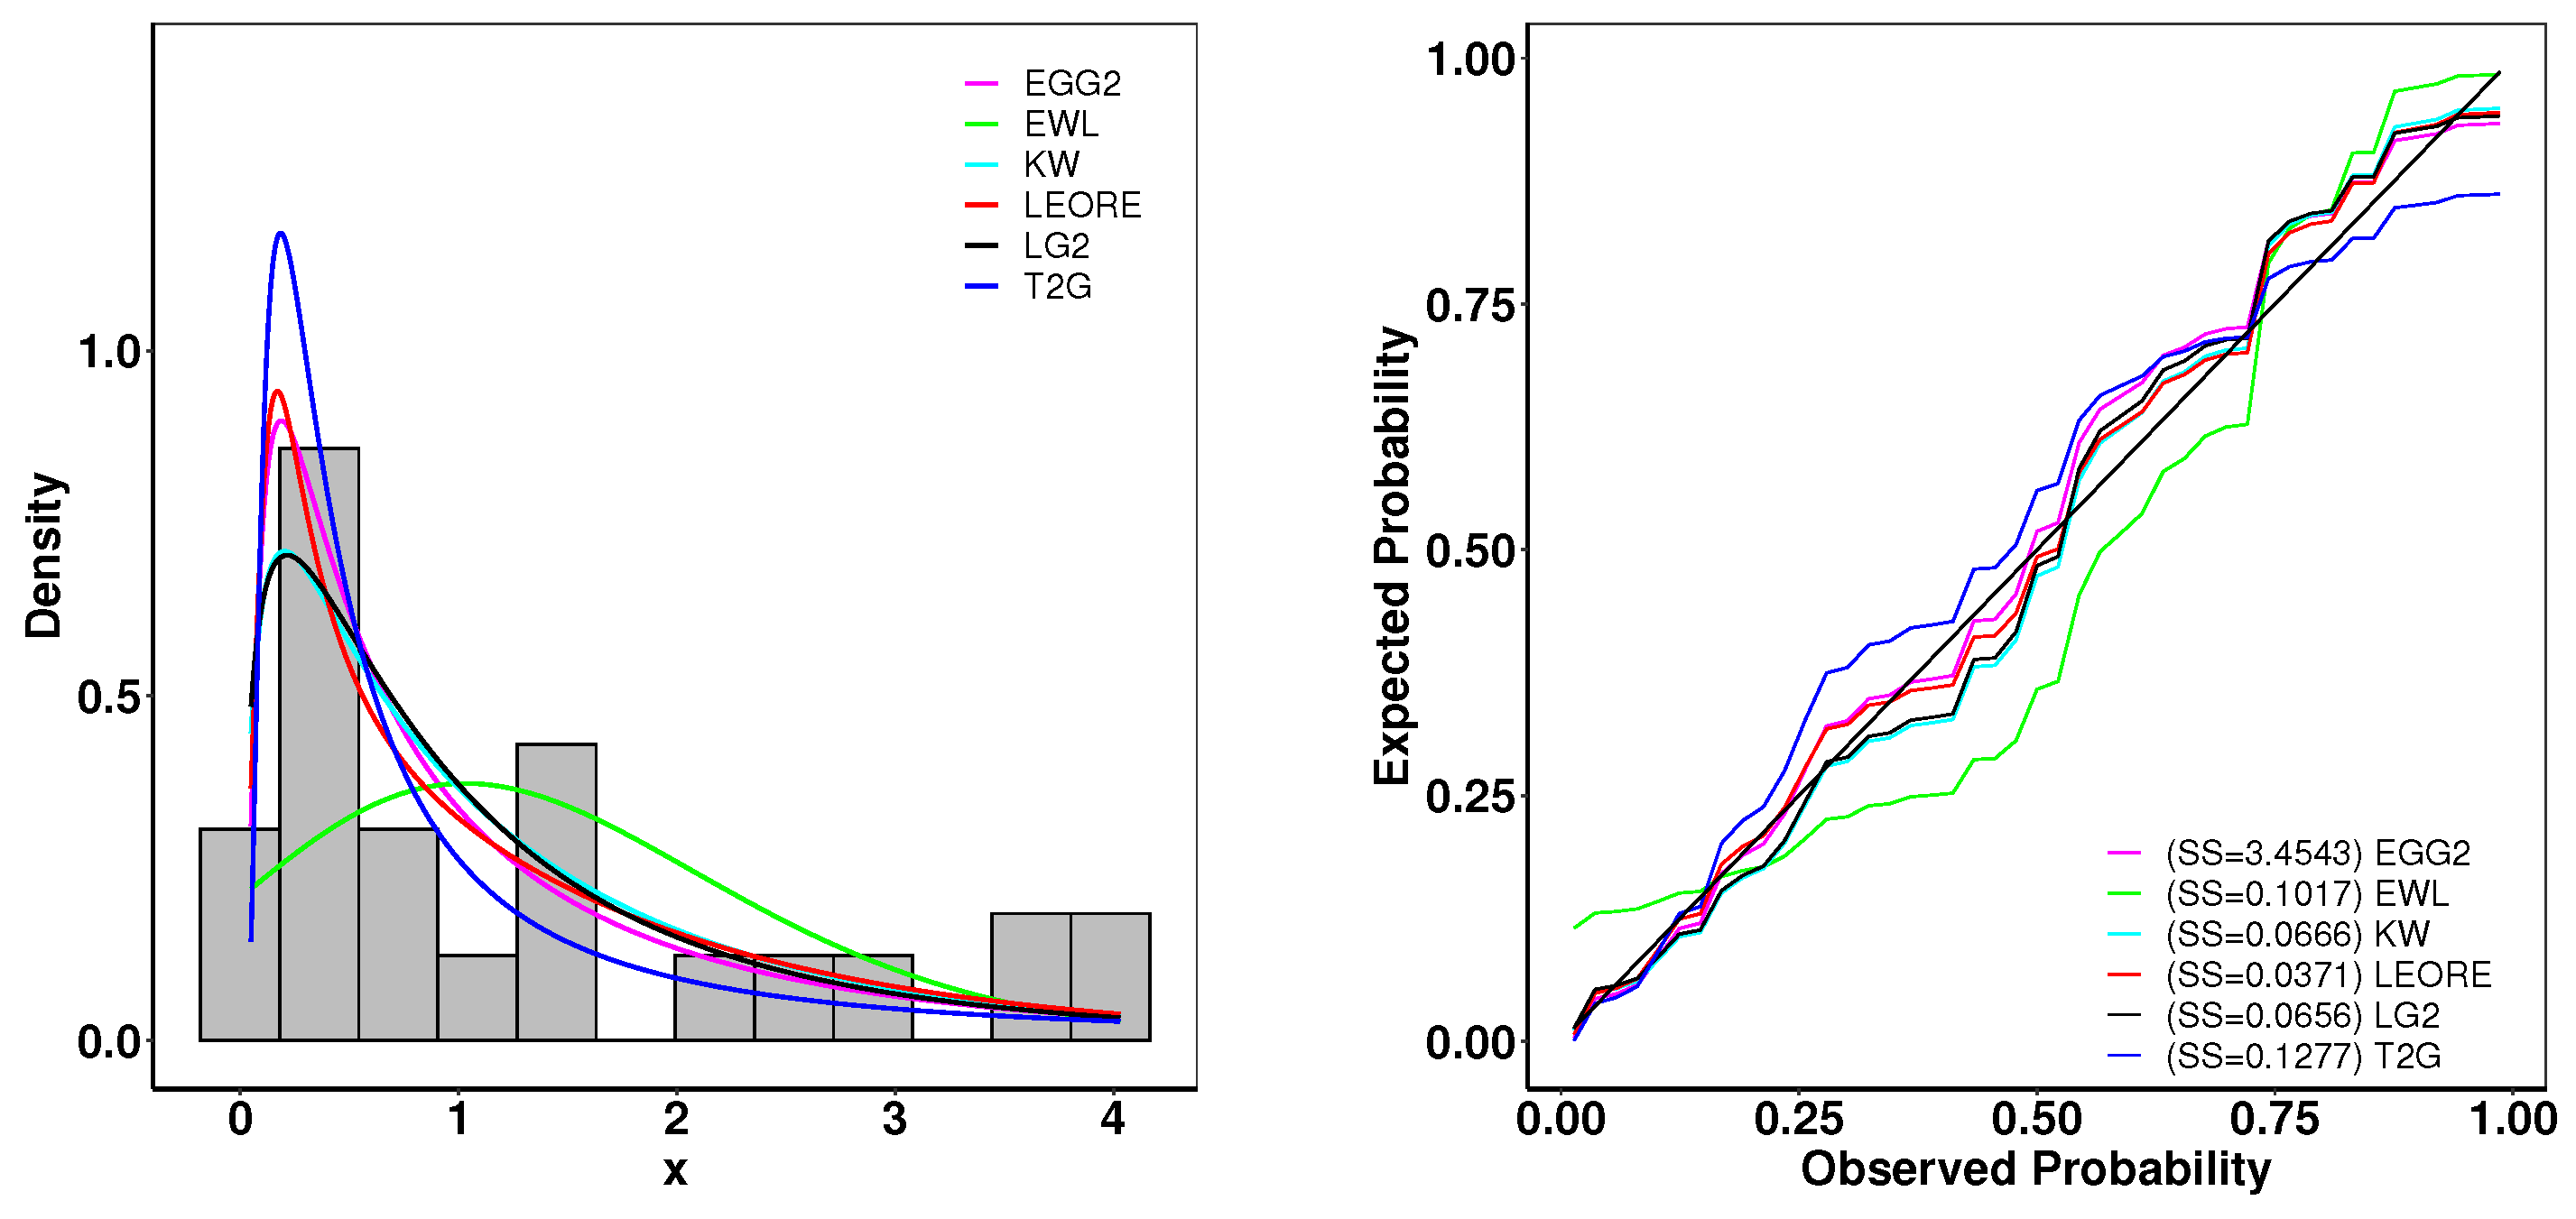
This section examines the survival times (in years) of patients undergoing chemotherapy as part of a study reported by Bekker et al. [28]. Parameter estimations and goodness-of-fit assessments are systematically tabulated in Table 4. Additionally, Figure 18 offers a visual comparison between the empirical distribution and fitted density functions, alongside the expected probabilities. According to the comparative analysis in Table 4, the LEORE distribution emerges as the most accurate model, demonstrating the lowest goodness-of-fit values and the most substantial p-value in the K-S test.
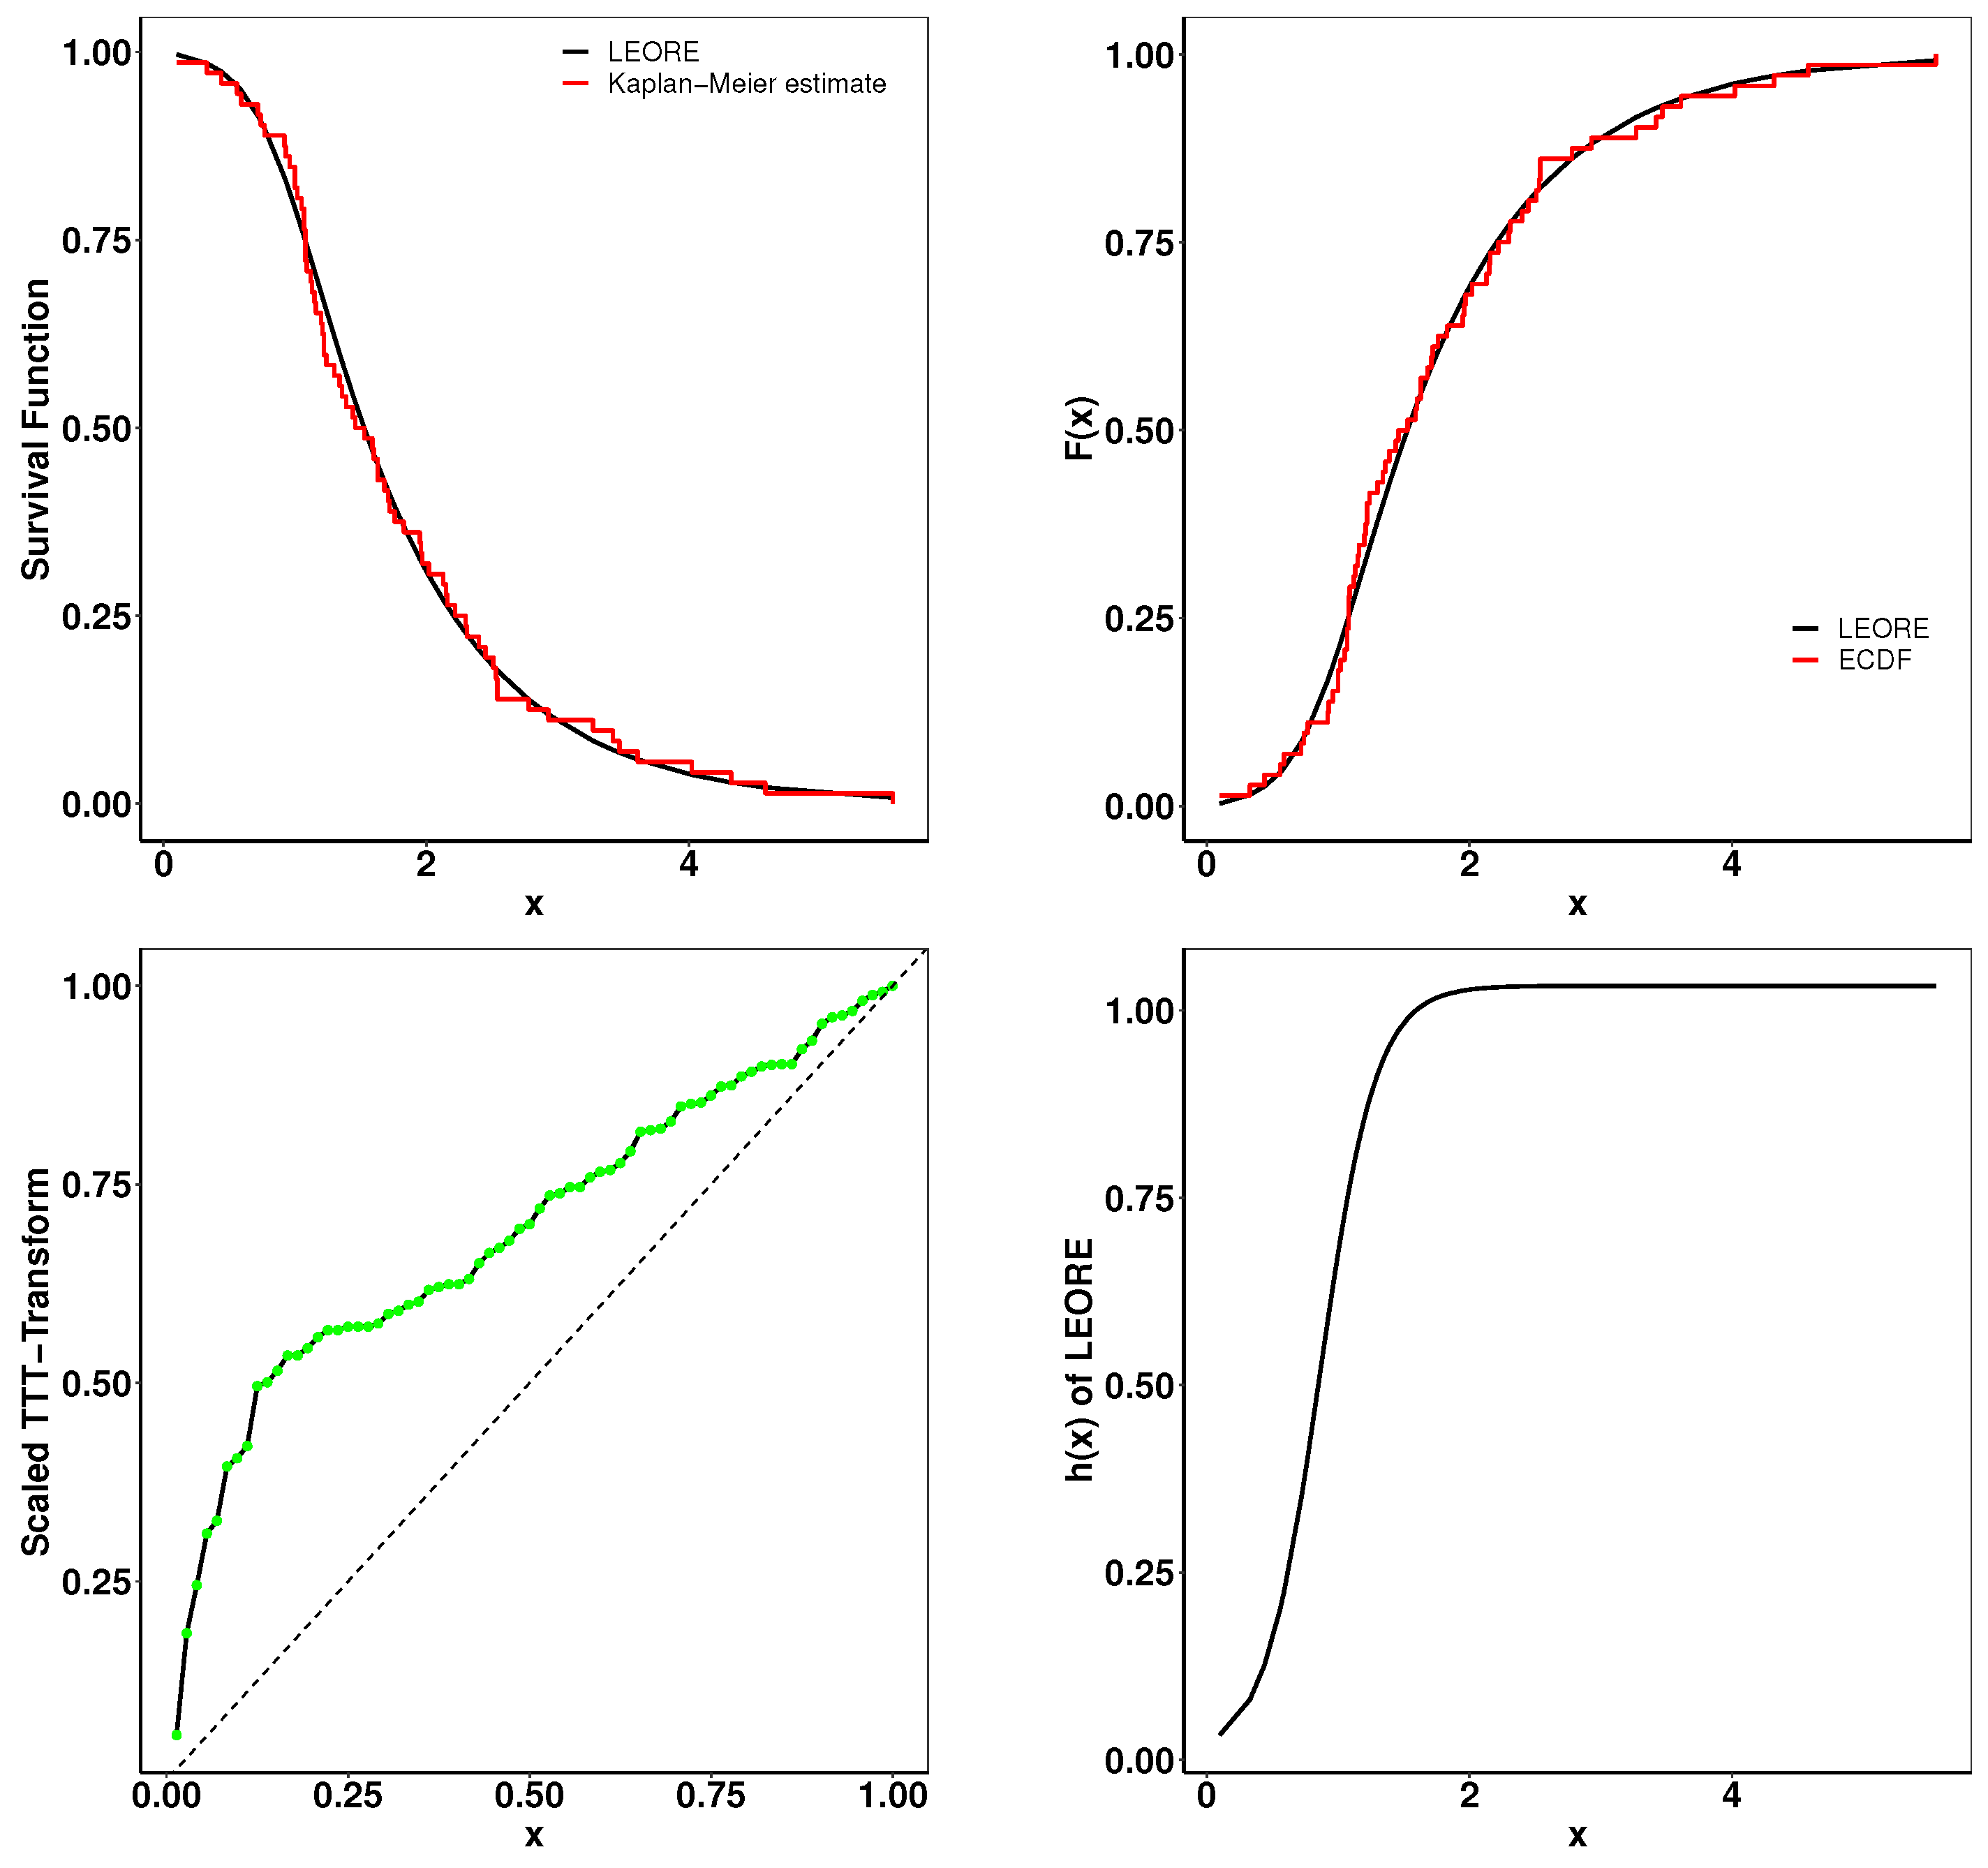
Figure 19 further provides a suite of plots, including the Kaplan–Meier survival curve, TCDF and ECDF, and a TTT plot. The match between empirical and theoretical observations indicates the efficacy of the proposed model in capturing the dataset’s characteristics. Notably, the scaled TTT plot reveals the model’s capability to accurately represent a non-monotonic hazard rate structure, affirming its suitability for complex survival data analysis.

7. Conclusions

The exploration and unveiling of the Lomax-exponentiated odds ratio–G distribution within this study marks a new advancement in the field of statistical analysis. This work—aimed at transcending the limitations of conventional statistical distributions in capturing the complex nature of modern datasets—rigorously explores the L-EOR–G distribution’s theoretical properties, parameter estimation methodologies, and empirical applicability. Our analysis evidences the distribution’s unparalleled flexibility and efficiency in modeling a wide spectrum of data behaviors, setting it apart from many existing models.
The empirical analysis demonstrates the L-EOR–G distribution’s superiority in fitting a diverse array of data distributions more adeptly than traditional counterparts. This is substantiated by consistently superior goodness-of-fit measures and K-S test p-values across various datasets, illustrating not only the model’s exceptional fitting prowess but also its potential to significantly enhance scientific research and informed decision-making processes. In summation, the introduction of the L-EOR–G distribution signifies a leap forward in bridging the divide between theoretical sophistication and practical utility in statistical modeling.

Supplementary Materials

Detailed proofs of all the theorems and lemmas presented in this manuscript can be found in the Supplementary Information, which is accessible at https://github.com/shusenpu/LEORG/blob/8f2f214fad950627216556df0158f2ca6d03554d/SI.pdf (accessed on 17 May 2024). Furthermore, additional examples of skewness and kurtosis for special cases are presented in the Supplementary Information.

Author Contributions

Conceptualization, S.P. and X.C.; methodology, S.S.R., H.K., D.M. and X.C.; software, X.C., S.S.R., A.C. and D.M.; validation, H.K., D.M., A.C. and S.P.; formal analysis, S.S.R. and S.P.; investigation, X.C., H.K. and S.S.R.; resources, X.C. and S.P.; data curation, X.C.; writing—original draft preparation, S.S.R., H.K., D.M., X.C. and S.P.; writing—review and editing, H.K., A.C. and S.P.; visualization, X.C., D.M. and S.S.R.; supervision, S.P. and A.C.; project administration, S.P. All authors have read and agreed to the published version of the manuscript.

Funding

This research received no external funding.

Data Availability Statement

All data utilized in this study are accessible from the references cited. Statistical analyses were performed using the R programming language (version 4.1.2, R Core Team, 2024).

Acknowledgments

The authors wish to express their gratitude for the valuable suggestions provided by colleagues from the CSDA lab at the University of West Florida.

Conflicts of Interest

The authors declare no conflicts of interest.

Abbreviations

The following abbreviations are used in this manuscript:
L-EOR–GLomax-exponentiated odds ratio–G
cdfcumulative distribution function
pdfprobability density function
hrfhazard rate function
MLEmaximum likelihood estimate
MPSmaximum product spacing estimate
LSleast square estimates
WLSweighted least square estimate
CVMCramér–von Mises estimate
ADAnderson–Darling estimate
MSEmean squared error
L-EOR–ULomax-exponentiated odds ratio–uniform
L-EOR–WLomax-exponentiated odds ratio–Weibull
L-EOR–ELomax-exponentiated odds ratio–exponential
L-EOR–KLomax-exponentiated odds ratio–Kumaraswamy
T2Gtype-2 Gumbel
CAICconsistent Akaike information criterion
BICBayesian information criterion
HQICHannan–Quinn Criterion
W Cramér–von Mises statistic
A Anderson–Darling statistic
K-SKolmogorov–Smirnov statistic
TCDFtheoretical cumulative distribution function
ECDFempirical cumulative distribution function
TTTtotal time on test
K-MKaplan–Meier

References

  1. Lawless, J.F. Statistical Models and Methods for Lifetime Data; John Wiley & Sons: Hoboken, NJ, USA, 2011. [Google Scholar]
  2. Bourguignon, M.; Silva, R.B.; Cordeiro, G.M. The Weibull-G family of probability distributions. J. Data Sci. 2014, 12, 53–68. [Google Scholar] [CrossRef]
  3. Pu, S.; Oluyede, B.O.; Qiu, Y.; Linder, D. A Generalized Class of Exponentiated Modified Weibull Distribution with Applications. J. Data Sci. 2016, 14, 585–613. [Google Scholar] [CrossRef]
  4. Oluyede, B.; Pu, S.; Makubate, B.; Qiu, Y. The gamma-Weibull-G Family of distributions with applications. Austrian J. Stat. 2018, 47, 45–76. [Google Scholar] [CrossRef]
  5. Ishaq, A.I.; Suleiman, A.A.; Usman, A.; Daud, H.; Sokkalingam, R. Transformed Log-Burr III Distribution: Structural Features and Application to Milk Production. Eng. Proc. 2023, 56, 322. [Google Scholar] [CrossRef]
  6. Pu, S.; Moakofi, T.; Oluyede, B. The Ristić–Balakrishnan–Topp–Leone–Gompertz-G Family of Distributions with Applications. J. Stat. Theory Appl. 2023, 22, 116–150. [Google Scholar] [CrossRef]
  7. Reyes, J.; Iriarte, Y.A. A New Family of Modified Slash Distributions with Applications. Mathematics 2023, 11, 3018. [Google Scholar] [CrossRef]
  8. Liu, Q.; Huang, X.; Zhou, H. The flexible gumbel distribution: A new model for inference about the mode. Stats 2024, 7, 317–332. [Google Scholar] [CrossRef]
  9. David, I.; Mathew, S.; Falgore, J. New Sine Inverted Exponential Distribution: Properties, Simulation and Application. Eur. J. Stat. 2024, 4, 5. [Google Scholar] [CrossRef]
  10. EL-Damrawy, H. The Beta-Truncated Lomax Distribution with Communications Data. Delta J. Sci. 2024, 48, 135–144. [Google Scholar] [CrossRef]
  11. Sarhan, A.M.; Apaloo, J.; Kundu, D. A new bivariate lifetime distribution: Properties, estimations and its extension. Commun. Stat.-Simul. Comput. 2024, 53, 879–896. [Google Scholar] [CrossRef]
  12. Muhi, E.F. A New Family of Power Function-Lindley Distribution. Adv. Nonlinear Var. Inequal. 2024, 27, 325–337. [Google Scholar]
  13. Lone, M.A.; Dar, I.H.; Jan, T. A New Family of Generalized Distributions with an Application to Weibull Distribution. Thail. Stat. 2024, 22, 1–16. [Google Scholar]
  14. Lomax, K.S. Business failures: Another example of the analysis of failure data. J. Am. Stat. Assoc. 1954, 49, 847–852. [Google Scholar] [CrossRef]
  15. Bland, J.M.; Altman, D.G. The odds ratio. BMJ 2000, 320, 1468. [Google Scholar] [CrossRef] [PubMed]
  16. VanderWeele, T.J.; Vansteelandt, S. Odds ratios for mediation analysis for a dichotomous outcome. Am. J. Epidemiol. 2010, 172, 1339–1348. [Google Scholar] [CrossRef] [PubMed]
  17. Gosho, M.; Ohigashi, T.; Nagashima, K.; Ito, Y.; Maruo, K. Bias in odds ratios from logistic regression methods with sparse data sets. J. Epidemiol. 2023, 33, 265–275. [Google Scholar] [CrossRef] [PubMed]
  18. Chen, X.; Xie, Y.; Cohen, A.; Pu, S. Advancing Continuous Distribution Generation: An Exponentiated Odds Ratio Generator Approach. arXiv 2024, arXiv:2402.17294. [Google Scholar]
  19. Alizadeh, M.; Altun, E.; Afify, A.Z.; Gamze, O. The extended odd Weibull-G family: Properties and applications. Commun. Fac. Sci. Univ. Ank. Ser. A1 Math. Stat. 2018, 68, 161–186. [Google Scholar] [CrossRef]
  20. Cheng, R.C.H.; Amin, N.A.K. Estimating Parameters in Continuous Univariate Distributions with a Shifted Origin. J. R. Stat. Soc. Ser. B (Methodol.) 1983, 45, 394–403. [Google Scholar] [CrossRef]
  21. Ogunde, A.; Fayose, S.; Ajayi, B.; Omosigho, D. Extended gumbel type-2 distribution: Properties and applications. J. Appl. Math. 2020, 2020, 2798327. [Google Scholar] [CrossRef]
  22. MURAT, U.; Gamze, Ö. Exponentiated Weibull-logistic distribution. Bilge Int. J. Sci. Technol. Res. 2020, 4, 55–62. [Google Scholar]
  23. Adeyemi, A.O.; Adeleke, I.A.; Akarawak, E.E. Lomax gumbel type two distributions with applications to lifetime data. Int. J. Stat. Appl. Math. 2022, 7, 36–45. [Google Scholar] [CrossRef]
  24. Cordeiro, G.M.; Ortega, E.M.; Nadarajah, S. The Kumaraswamy Weibull distribution with application to failure data. J. Frankl. Inst. 2010, 347, 1399–1429. [Google Scholar] [CrossRef]
  25. Kim, H.c. A Comparison of Reliability Factors of Software Reliability Model Following Lindley and Type-2 Gumbel Lifetime Distribution. Int. Inf. Inst. (Tokyo) Inf. 2018, 21, 1077–1084. [Google Scholar]
  26. Nichols, M.D.; Padgett, W. A bootstrap control chart for Weibull percentiles. Qual. Reliab. Eng. Int. 2006, 22, 141–151. [Google Scholar] [CrossRef]
  27. Kundu, D.; Gupta, R.D. An extension of the generalized exponential distribution. Stat. Methodol. 2011, 8, 485–496. [Google Scholar] [CrossRef]
  28. Bekker, A.; Roux, J.J.J.; Mosteit, P.J. A generalization of the compound rayleigh distribution: Using a bayesian method on cancer survival times. Commun. Stat.-Theory Methods 2000, 29, 1419–1433. [Google Scholar] [CrossRef]
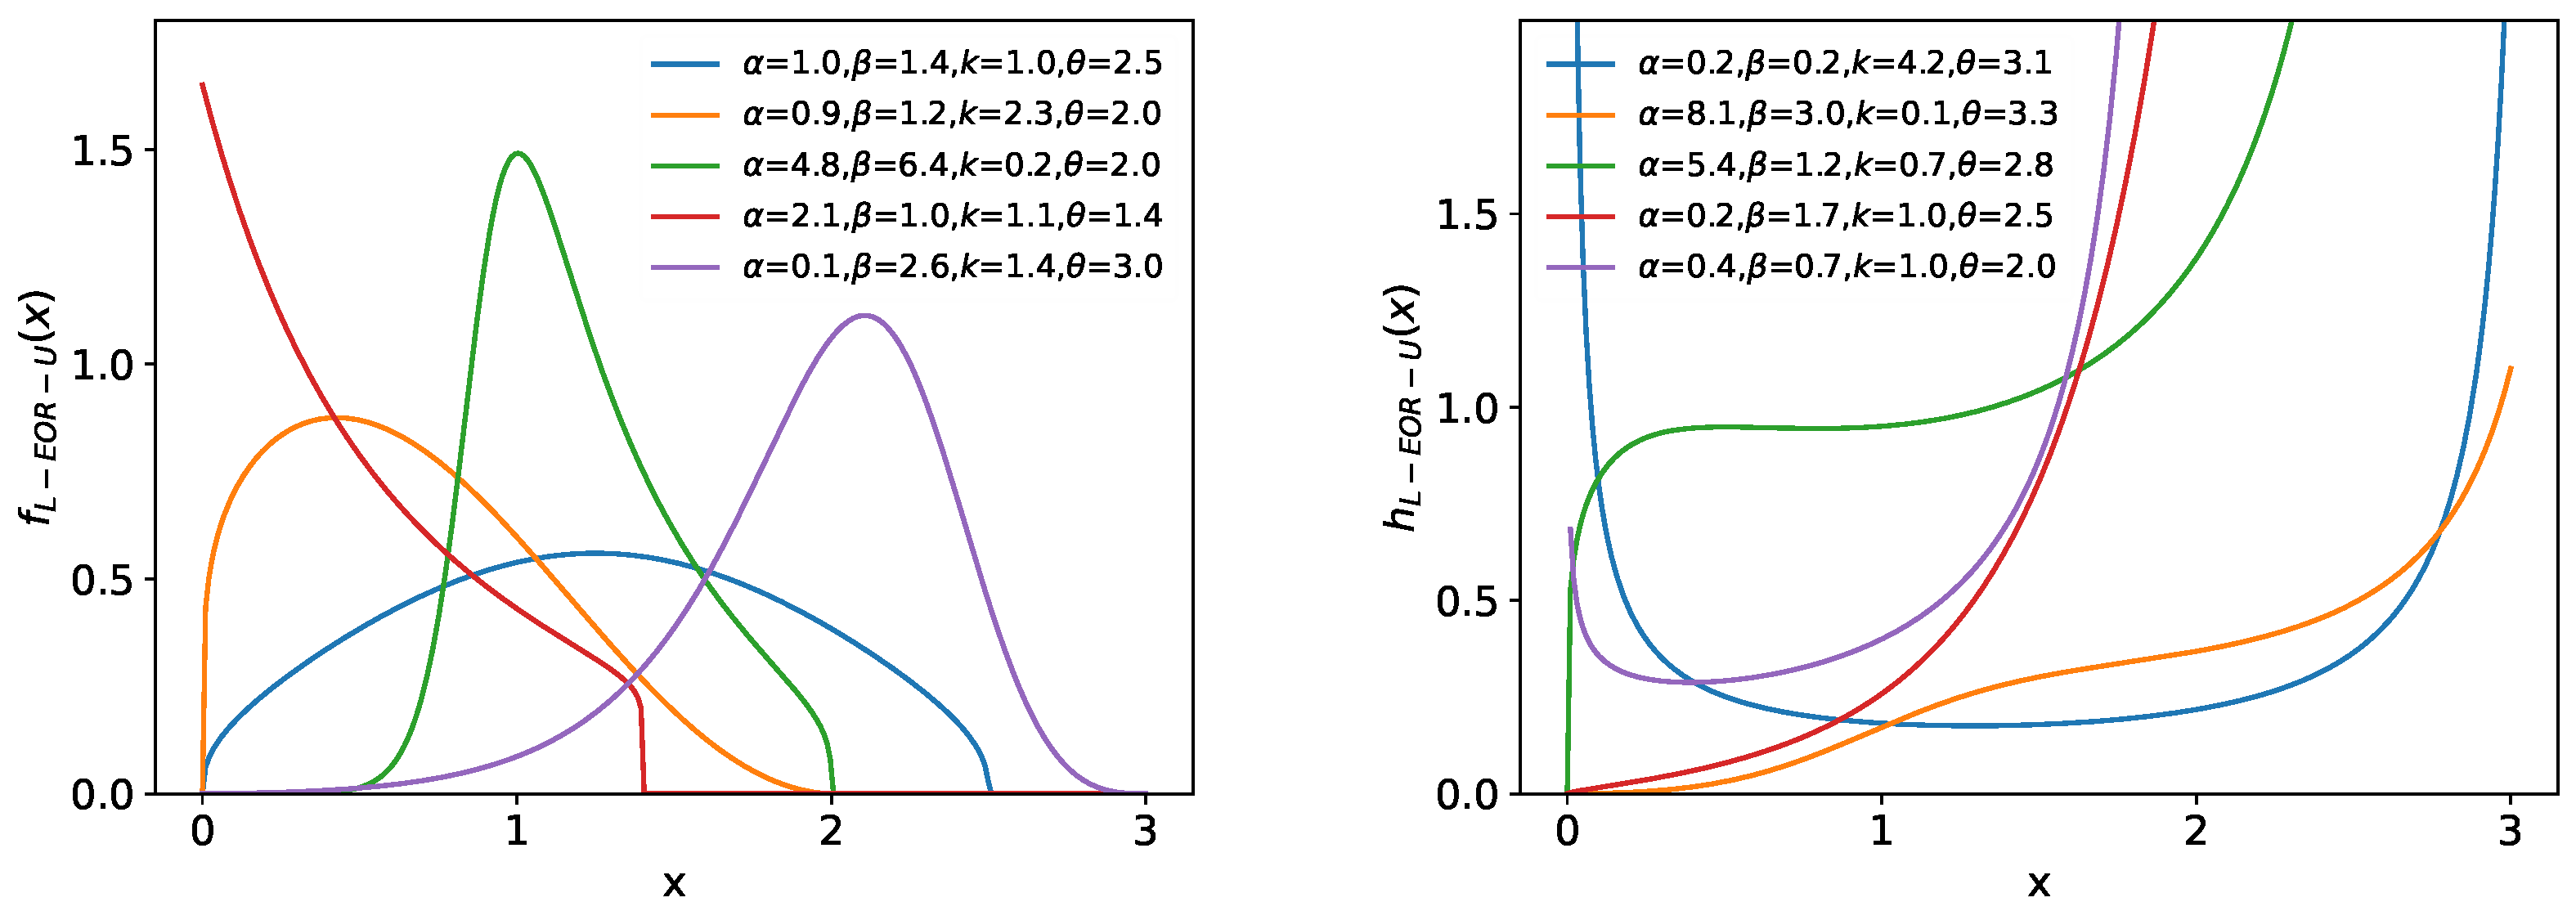
Figure 1. The pdf (left) and hrf (right) plots for the L-EOR–U distribution with various parameters.
Mathematics 12 01578 g001
Figure 2. Skewness and kurtosis plots for the L-EOR–U distribution. The parameters α and β are varied, while keeping k = 1 and θ = 1 .
Mathematics 12 01578 g002
Figure 3. Skewness and kurtosis plots for the L-EOR–U distribution. The parameters β and θ are varied, while keeping α = 1 and k = 2 .
Mathematics 12 01578 g003
Figure 4. The pdf (left) and hrf (right) plots for the L-EOR–E distribution with various parameters.
Mathematics 12 01578 g004
Figure 5. Skewness and kurtosis plots for the L-EOR–E distribution. The parameters α and β are varied, while keeping k = 1 and γ = 1 .
Mathematics 12 01578 g005
Figure 6. Skewness and kurtosis plots for the L-EOR–E distribution. The parameters k and γ are varied, while keeping α = 1 , and β = 1.5 .
Mathematics 12 01578 g006
Figure 7. The pdf (left) and hrf (right) plots for the L-EOR–W distribution with various parameters.
Mathematics 12 01578 g007
Figure 8. Skewness and kurtosis plots for the L-EOR–W distribution. The parameters α and λ are varied, while keeping k = 1 , γ = 1 and β = 1 .
Mathematics 12 01578 g008
Figure 9. Skewness and kurtosis plots for the L-EOR–W distribution. The parameters k and γ are varied, while keeping α = 1 , β = 2 , and λ = 1 .
Mathematics 12 01578 g009
Figure 10. The pdf (left) and hrf (right) plots for the L-EOR–K distribution with various parameters.
Mathematics 12 01578 g010
Figure 11. Skewness and kurtosis plots for the L-EOR–K distribution. The parameters α and β are varied, while keeping k = 1 , a = 1 , and b = 1 .
Mathematics 12 01578 g011
Figure 12. Skewness and kurtosis plots for the L-EOR–K distribution. The parameters β and a are varied, while keeping α = 1 , k = 1 , and b = 1 .
Mathematics 12 01578 g012
Figure 13. MSE of parameters in Table 1.
Mathematics 12 01578 g013
Figure 14. (left) Fitted density superposed on the histogram and observed probability for the carbon fiber data. (right) Expected probability plots for the carbon fiber data.
Mathematics 12 01578 g014
Figure 15. Fitted K-M survival curve, theoretical and ECDF, the TTT statistics, and the hrf for the carbon fiber data.
Mathematics 12 01578 g015
Figure 16. (left) Fitted density superposed on the histogram and observed probability for the carbon fiber data. (right) Expected probability plots for the Guinea data.
Mathematics 12 01578 g016
Figure 17. Fitted K-M survival curve, theoretical and ECDF, the TTT statistics, and the hrf for the Guinea data.
Mathematics 12 01578 g017
Figure 18. (left) Fitted density superposed on the histogram and observed probability for the chemotherapy data. (right) Expected probability plots for the chemotherapy data.
Mathematics 12 01578 g018
Figure 19. Fitted K-M survival curve, theoretical and ECDF, the TTT statistics, and the hrf for the Chemotherapy data.
Mathematics 12 01578 g019
Table 1. Different estimations for α = 1.5 , β = 2.9 , γ = 1.3 , and k = 0.8 .
MLELSWLSMPSCVMAD
N Bias MSE Bias MSE Bias MSE Bias MSE Bias MSE Bias MSE
50 α 0.20910.97350.37202.29620.25981.18490.24340.90790.36622.32360.24901.1354
β 0.04410.13710.03500.20310.02820.1458−0.02370.11710.06280.21220.03340.1845
γ −0.00950.0386−0.02410.0696−0.00760.04250.00290.0338−0.02670.0693−0.00710.0401
k0.09030.15080.33084.52870.09540.18250.05140.09820.30912.57950.05200.0767
100 α 0.04670.31510.14720.75320.07740.38830.07410.31010.14390.75730.07210.3628
β 0.02130.05680.02950.09340.01810.0636−0.01420.05230.04340.09590.01740.0806
γ −0.01490.0184−0.01300.0285−0.01160.0195−0.00830.0167−0.01410.0284−0.01150.0186
k0.05360.05630.07960.17600.05030.06010.03740.04650.08310.18870.03240.0346
250 α 0.09550.30220.12880.60410.10020.35500.11970.29800.12530.60430.10410.3519
β 0.03210.04680.01970.07180.02020.05010.00060.04260.03140.07330.02470.0660
γ 0.00080.0160−0.01040.0266−0.00210.01790.00630.0150−0.01140.0266−0.00070.0172
k0.02580.03960.07660.17200.03550.05200.01320.03410.07930.17760.01950.0285
500 α 0.03960.16090.09870.34460.05950.20730.05720.15850.09640.34420.06280.2077
β 0.01410.03190.01990.05130.01310.0370−0.00720.03010.02730.05200.01580.0483
γ −0.00410.0093−0.00280.0165−0.00260.0110−0.00030.0089−0.00340.0165−0.00170.0108
k0.02160.02340.03390.04790.02240.02810.01370.02120.03520.04870.01330.0177
1000 α 0.02310.08530.04170.14100.02920.09650.03450.08500.04050.14090.02740.0961
β 0.00410.01620.00230.02360.00180.0172−0.00780.01580.00610.02370.00150.0231
γ −0.00200.0054−0.00260.0082−0.00150.0058−0.00020.0052−0.00290.0082−0.00200.0058
k0.01060.01180.01670.01980.01050.01260.00630.01110.01730.01990.00730.0085
Table 2. MLEs and goodness-of-fit statistics for carbon fiber data.
ModelEstimates (SE)Statistics
2 log L AIC CAIC BIC HQIC W A K-Sp-Value
LEORE α β γ k170.0125178.0125178.6683186.7711181.47350.05420.32360.06670.9305
0.00961.77160.80691.9784
(0.0080)(0.6433)(0.4434)(1.3153)
EGG2 α ab ν 181.4496189.4496190.1054198.2082192.91060.21321.17340.14030.1487
12.3804184.36050.56940.7059
(2.4007)(22.9474)(0.2141)(0.1196)
EWL α β γ θ 170.8907178.8907179.5464187.6493182.35160.06300.37800.07370.866
0.63001.21310.41148.2735
(0.5545)(25.6944)(8.7128)(8.2943)
LGT α β θ k183.1803187.1549187.8107195.9135190.61590.19361.04690.12250.2753
20.08730.007912.12830.4017
(16.4838)(0.0039)(1.0021)(0.0586)
KW λ abc171.1142179.1142179.77187.8729182.575221.0186131.38390.9969<2.2 ×   10 16
0.50180.62010.16253.9198
(0.0065)(0.0795)(0.0216)(0.0083)
T2G α ν --242.3898246.3898246.5803250.7691248.12030.09170.60790.11200.5864
3.22621.6480
(0.4193)(0.1226)
Table 3. MLEs and goodness-of-fit statistics for the Guinea data.
ModelEstimates (SE)Statistics
2 log L AIC CAIC BIC HQIC W A K-Sp-Value
LEORE α β γ k183.4629191.4629192.0599200.5695195.08830.04520.26680.07280.8396
0.01720.79635.89690.2199
(0.0151)(0.7221)(5.8743)(0.0753)
EGG2 α ab ν 190.2207198.2207198.8177207.3274201.84610.08820.58730.10090.4562
6.0290122.14101.01560.3620
(1.3408)(130.8008)(0.6569)(0.1289)
EWL α β γ θ 196.7943204.7943205.3913213.9009208.41970.23871.40300.11390.3077
3.85020.46990.4699188.2497
(0.7350)(8.9080)(8.9083)(147.1816)
LGT α β θ k189.0739197.0739197.6709206.1806200.69930.08990.57290.09560.5254
18.07690.01338.48280.2597
(37.9855)(0.0114)(2.0439)(0.0892)
KW λ abc188.1312196.1312196.7283205.2379199.756623.0962143.15790.9994<2.2 ×   10 16
0.76673.10781.72840.9920
(0.7008)(3.8532)(5.4959)(1.0412)
T2G α ν --236.332240.332240.5059244.8854242.14470.52673.35230.19660.0076
1.06871.1731
(0.1324)(0.0843)
Table 4. MLEs and goodness-of-fit statistics for chemotherapy data.
ModelEstimates (SE)Statistics
2 log L AIC CAIC BIC HQIC W A K-Sp-Value
LEORE α β γ k113.6159121.6159122.6159128.8425124.30990.03680.28950.06750.9777
3.25962.15453.53890.0907
(5.4519)(1.2061)(3.4657)(0.1109)
EGG2 α ab ν 116.0689124.0689125.0689131.2956126.76290.04870.37640.08740.852
5.243611.99160.19710.5806
(0.0546)(0.1520)(0.0344)(0.0521)
EWL α β λ θ 138.8585146.8585147.8585154.0851149.55250.31601.98750.18310.0859
5.59410.33790.4619604.6459
(1.2435)(12.2857)(16.7974)(761.9120)
LGT α β θ k116.3564124.3564125.3564131.5831127.05040.06100.42700.08920.835
17.99030.01967.03320.1503
(24.8990)(0.0298)(1.9777)(0.0459)
KW λ abc114.8207122.8207123.8207130.0474125.514815.803890.46230.9889<2.2 ×   10 16
9.54992.45180.11180.9081
(0.1925)(1.1598)(0.0499)(0.1267)
T2G α ν --127.6381131.6381131.9238135.2515132.98510.14300.97900.13820.3253
0.49870.8672
(0.0979)(0.0928)
Disclaimer/Publisher’s Note: The statements, opinions and data contained in all publications are solely those of the individual author(s) and contributor(s) and not of MDPI and/or the editor(s). MDPI and/or the editor(s) disclaim responsibility for any injury to people or property resulting from any ideas, methods, instructions or products referred to in the content.