Article

Uncertainty Analysis of Aircraft Center of Gravity Deviation and Passenger Seat Allocation Optimization

Air Traffic Management Institute, Civil Aviation University of China, Tianjin 300300, China
*
Author to whom correspondence should be addressed.
Mathematics 2024, 12(10), 1591; https://doi.org/10.3390/math12101591
Submission received: 26 March 2024 / Revised: 8 May 2024 / Accepted: 14 May 2024 / Published: 20 May 2024
(This article belongs to the Section Engineering Mathematics)

Abstract

:
The traditional method of allocating passenger seats based on compartments does not effectively manage an aircraft’s center of gravity (CG), resulting in a notable divergence from the desired target CG (TCG). In this work, the Boeing B737-800 aircraft was employed as a case study, and row-based and compartment-based integer programming models for passenger allocation were examined and constructed with the aim of addressing the current situation. The accuracy of CG control was evaluated by comparing the row-based and compartment-based allocation techniques, taking into account different bodyweights and numbers of passengers. The key contribution of this research is to broaden the range of the mobilizable set for the aviation weight and balance (AWB) model, resulting in a significant reduction in the range of deviations in the center of gravity outcomes by a factor of around 6 to 16. The effectiveness of the row-based allocation approach and the impact of passenger weight randomness on the deviation of an airplane’s CG were also investigated in this study. The Monte Carlo method was utilized to quantify the uncertainty associated with passenger weight, resulting in the generation of the posterior distribution of the aircraft’s center of gravity (CG) deviation. The outcome of the row-based model test is the determination of the range of passenger numbers that can be effectively allocated under different TCG conditions.

1. Introduction

The process of aviation weight and balance planning involves the development of a strategic plan to allocate passengers, carriages, baggage, and mail to various cabin compartments. The aim of this plan is to maintain the equilibrium of the aircraft throughout operation, taking into consideration factors such as load capacity and the position of the center of gravity. The primary goal of this system is to maintain the aircraft’s center of gravity (CG) and overall weight within a safe range, as this is a crucial factor in ensuring the safety of flight operations.
Aircraft exhibit distinct characteristics compared to land or sea transportation vehicles, as depicted in Figure 1. Land and water transport vehicles have the ability to bear weight by means of wheels on the ground or hulls on water surfaces, thereby providing multi-point support and ensuring high stability. Their load distribution balancing criteria are often less stringent, with differential weight constraints imposed between the left and right sides as well as the front and rear of the body. Nevertheless, during flight, the aerodynamic force exerted by the weight is primarily concentrated on the wings, resulting in a singular point of force. Additionally, the dynamic nature of the atmospheric environment necessitates the maintenance of the aircraft’s operational stability. Hence, in contrast to land and marine transportation, the balance requirements of air transportation are exceedingly stringent, thus limiting the CG within a specific range and mandating that it is close to a predetermined target CG (TCG).
The aircraft CG position is the basis of the aircraft’s balance during operation, and its analysis and evaluation have attracted the attention of many scholars. Idan, Iosilevskii, and Nazarov (2003) used artificial neural networks (NNs) to construct an aircraft weight and CG position [1]. Zhang, Yang, and Shen (2012) proposed a hybrid CG estimation and sliding mode adaptive control approach and introduced an online CG estimation method based on adaptive weight data fusion to guarantee smaller dynamic inversion errors [2]. Yang et al. (2016) proposed a Gaussian process regression model for the estimation of the CG location of fixed-wing aircraft [3]. Their model is a data-based approach explicitly tackling uncertainties caused by the quality and quantity of the data. In the work of Jumat and Abdullah (2018), a baggage load planning system for a Boeing 737-800 aircraft is considered to obtain a good CG position for improved fuel consumption [4]. Chaves, Silvestre, and Gamboa (2018) presented an approach to onboard in-flight weight and balance estimation systems for the identification of weight and CG position using cruise angle of attack, Mach number, and elevator deflection values [5]. Zhao et al. (2021) constructed a mixed integer programming model to maximize the total payload and minimize the CG deviation and proposed a new set of CG envelope constraints [6].
The position of the aircraft’s center of gravity (CG) during operation is primarily influenced by factors such as the aircraft’s empty weight CG; fuel quantity; and the distribution of passengers, cargo, baggage, and other relevant elements. The fuel quantity for an AWB plan is typically estimated based on the aircraft’s empty weight CG for a particular flight. The primary function of stowage is the precise placement and distribution of passengers, freight, luggage, and other related items. In terms of air cargo transportation, several mathematical models and optimization methods have been developed to address AWB (Larsen & Mikkelsen, 1980 [7]; Brosh, 1981 [8]; Amiouny et al., 1992 [9]; Wodziak & Fadel, 1994 [10]; Mathur, 1998 [11]; Heidelberg et al., 1998 [12]; Dahmani & Krichen, 2013 [13]). However, as Brandt and Nickel (2019) have mentioned, the problems with real-world scales and practical constraints have yet to be solved [14]. Regarding air passenger transportation, the literature on AWB planning mainly concernspassenger seat allocation, with several real-world operation requests (Schultz and Soolaki 2021 [15]; Ren, Pan, and Jiang 2022 [16]; Notomista et al. 2016 [17]; Birolini et al. 2022 [18]; Wong et al. 2009 [19]; Ma et al. 2023 [20]).
The CG of the AWB plan is not exactly equal to the airlines’ TCG. Its deviation is uncertain because of the randomness of individual passenger weight and seat allocation. Normally, airline AWB planning assigns passengers based on aircraft compartments, not seats in operation. This causes little diversity in allocation plans, and passengers’ seat allocations are uncertain. Moreover, not many studies have been conducted on cabin assignments, as their focus has been on cabin seat comfort and passenger seat selection preferences as well as other relevant factors. Liu, YX et al. (2023) improved cabin seating distribution using the Wells–Riley model to reduce the probability of passengers contracting respiratory illnesses and to improve the economic efficiency of airlines [21]. From the perspective of an airline company, J Qiu et al. (2017) collected and analyzed passengers’ content and operating habits regarding cabin multimedia devices, built a model of passengers’ personalities and preferences, predicted passengers’ likely positive opinions of each other, and intelligently assigned them to adjacent seats [22]. Castro, J et al. (2021) proposed a seat allocation model considering the future sales of the airline [23]. Milne, R. J. et al. (2024) used a greedy algorithm to assign seats to passengers in order to separate infectious passengers from susceptible ones, reducing the rate of disease transmission [24]. However, all of these methods can cause the CG of the AWB plan to vary considerably from the TCG. Moreover, passengers vary greatly in terms of individual weight and cabin carry-on baggage. For example, in 2023, a large number of South Korean passengers secretly took heavy grain on airplanes from China back to their country, where rice is quite expensive. It was notably reported that the weight of the cabin carry-on baggage of these “grain customers” was 5–8 times that of an ordinary passenger. However, this factor was ignored in AWB planning and caused other CG errors. Additional ballasts are adopted by most airlines to reduce CG errors and limit CG deviations within reasonable bounds. This makes the aircraft heavier, increasing fuel consumption and carbon emissions. There are many studies in the research literature on uncertainty, such as Birge and Louveaux 2011 [25]; Hannan et al. 2020 [26]; Crainic, Djeumou Fomeni, and Rei 2021 [27]; and Crainic et al. 2024 [28]. However, to the best of our knowledge, there is little research on uncertainty in AWB planning.
The current body of research on passenger loading mostly concentrates on the operational economics and implementation of loading systems, with loading being considered as an additional instrument. Nevertheless, there is a notable lack of research on the control intensity of the CG considering the results of passenger allocation and the uncertainty associated with passenger weight. In addressing this research gap, the focus of this study is on maximizing the model’s utility by investigating how the allocation of passengers and cargo can improve control of the aircraft’s CG, as well as setting an appropriate TCG.
In order to mitigate the CG deviation and enhance loading accuracy, a row-based linear integer programming model was devised to optimize the allocation of passenger seats. In contrast to the compartment-based model, the proposed approach has the potential to effectively reduce CG deviation and achieve optimal control over the aircraft’s CG configuration. Furthermore, by employing the Monte Carlo methodology, the posterior distribution of the aircraft’s CG was derived based on the varying weight distributions of passengers. The influence of passenger weight uncertainty on airplane CG was quantified by calculating confidence intervals at different levels of the CG deviation distribution. The optimal placement of the TCG was ascertained through a comparative analysis of the confidence intervals for a range of appropriate deviation distributions. This improves the usefulness of the scheduling model.
The sections of this article are organized as follows: Section 1 provides the introduction and introduces the background and topic; Section 2 describes the compartment-based and row-based mathematical models; Section 3 compares the results of the two AWB models; Section 4 describes the analysis of the effect of passenger weight uncertainty on the center of gravity of an aircraft using the row-based AWB model; and Section 5 summarizes the conclusions.

2. Description and Model Formulation

Our methodology involves loading the aircraft with a target center of gravity (PTCG) position. The goal is to obtain a center of gravity (PCG) that closely matches this target value. The center of gravity of an aircraft is calculated by dividing the total moment on the aircraft by the total weight, as described in Equation (1):
B CG = z = 1 N z B z w P x z + h = 1 N H B h w h + B OEW W OEW + B TOF W TOF z = 1 N z w P x z + h = 1 N H w h + W OEW + W TOF
where z is the index of passenger compartments; Bz is the arm of the zth compartment; h is the index of cargo holds; Bh is the arm of the hth lower cargo hold; BOEW is the arm of the aircraft’s empty operational weight (OEW); BTOF is the arm of the aircraft’s takeoff fuel (TOF); p is the index of passengers; wP is the average weight of a passenger; WOEW is the aircraft’s empty operational weight; WTOF is the takeoff fuel weight; xz is the number of passengers allocated to the zth compartment; and wh is the weight allocated to the hth lower cargo hold.
In practical applications, the relative position (PCG) is a more convenient and widely used representation compared to the absolute position (BCG). It is defined as the ratio of the wing reference distance measured from the leading edge of the mean aerodynamic chord (MAC) to the CG position to the MAC chord length (as illustrated in Figure 2. Therefore, the expression for the PCG can be represented as Equation (2). Its unit is %MAC.
P CG = ( B CG L E M A C ) L M A C × 100
where LMAC is the length of the MAC and LEMAC is the distance to the leading edge of the MAC.

2.1. The Compartment-Based AWB Model

When allocating passengers to seats within an airplane cabin, it is customary to partition the cabin into various compartments based on seat classes, denoted by codes such as OA, OB, OC, and so on (as depicted in Figure 3). The number of passengers in each compartment is determined by calculating the weight balance. In order to determine the CG, the mean arm length inside each compartment is utilized, without taking into account the differences in arm values among seats in various rows within each compartment. The computation of the CG is thereby simplified.
The compartment-based AWB system assigns passengers and luggage to separate compartments to minimize the difference between the CG and TCG. Compartment-based AWB planning, as per airlines’ daily operating procedures, entails the allocation of passengers to certain compartments and cargo, baggage, mail, and other goods to cargo holds. This allocation is performed while adhering to weight, load balance, and other limits in order to minimize the deviation of the CG.
The following notation is used in this work:
p: The index of passengers.
NP: The number of passengers.
z: The index of passenger compartments.
NZ: The number of passenger compartments of the aircraft.
nz: The number of passengers that compartment z can accommodate.
WC: The weight of cargo, baggage, mail, and so on.
h: The index of cargo holds.
NH: The number of cargo holds.
Wh: The weight limit for lower cargo hold h.
WMPL: The maximum payload of the aircraft.
PCG: The CG after loading.
PTCG: The given TCG.
PFCG: The forward limit of the aircraft CG.
PACG: The aft limit of the aircraft CG.
Given integer decision variable xz as the number of passengers allocated to the zth compartment, z = 1, 2, …, NZ. Additionally, let the decision variable wh represent the weight allocated to the hth lower cargo hold, where h = 1, 2, …, NH. The model can be expressed as follows.
min P CG P TCG
s . t . z = 1 N Z x z N P
x z n z , z = 1 , 2 , , N z
h = 1 N H w h W C
w h W h , h = 1 , 2 , , N H
z = 1 N Z w P · x z + h = 1 N H w h W MPL
P CG P FCG
P CG P ACG
The aim of objective (1) is to minimize the deviation between the loaded CG and TCG. The aircraft CG is typically expressed in two ways: absolute position (BCG) and relative position (PCG).
Constraint (2) is the total passenger limit; Constraint (3) is the maximum number limit for each compartment; Constraint (4) is the total weight limit for cargo, baggage, and mail; Constraint (5) is the maximum load limit for each cargo hold; Constraint (6) is the total payload limit for the aircraft; and Constraints (7) and (8) are the pitch balance constraints for the aircraft, indicating that the CG of the aircraft needs to be within the forward and aft limits.
A somewhat aftward center of gravity (CG) typically results in decreased aerodynamic drag during flight, thereby conserving fuel. In order to adhere to national regulations for “carbon peaking” and “carbon neutrality”, airlines frequently opt for a somewhat aftward TCG with the aim of achieving cost savings. During AWB planning, the distribution of passengers and cargo is modified to minimize the difference between the loaded CG and the TCG. Nevertheless, potential variations arise due to the intrinsic limitations associated with the allocation of passengers per compartment. In addition, the variability in passenger and cargo weights, offsets in cargo center of gravity, and differences in fuel weight and density collectively lead to increased loading uncertainty, as depicted in Figure 4.
Let Δ C G : = P CG P TCG and Δ C G : = P CG P TCG . The objective of AWB planning is min |ΔCG|. When allocating passengers based on compartments, it is challenging to achieve precise control over the CG. This is because there are limitations on the available weight, adjustable compartments, and number of passengers. As a result, |ΔCG| is greater.
As an illustration, if there is just one traveler on the flight and the TCG is 17% MAC, assigning the passenger to separate compartments will produce distinct CGs. For the B737-800, the values would be 16.9244% in the OA compartment, 17.2177% in the OB, and 17.8844% in the OC, and |ΔCG| is at least 0.0756% MAC. The third row gives the passenger a CG position of 17.0033% MAC and reduces |ΔCG| to 0.0033% MAC if the passenger is allocated according to seats. This approach has a noticeably higher degree of accuracy.
A smaller value of |CG| indicates a narrower disparity between the loaded and target CG. Airlines have the option to select a more forward-looking TCG to reduce fuel consumption, carbon emissions, and expenses as well as a more efficient AWB design to eliminate the requirement for additional fuel and ballasts in order to enhance strategic planning. Furthermore, considering effective administration of the aircraft’s CG can reduce the likelihood of mishaps caused by an imprecise CG, hence improving flight safety. Consequently, it becomes essential to partition the airplane cabin into each row of seats for the assigned passengers.

2.2. The Row-Based AWB Model

The AWB model for air transportation based on seating rows is described as follows: The quantity of cargo assigned to each cargo hold and the number of passengers assigned to each row of seats in the cabin serve as the decision variables. In order to lower |ΔCG| and enhance the accuracy of the AWB plan, a linear mixed integer programming model was developed to assign passengers by rows while accounting for restrictions such as cargo and seat capacities, weight, and balance limits.
Let xr be the integer decision variable representing the number of passengers assigned to the rth row, where r = 1, 2, …, NR, and NR is the number of rows in the cabin. Let the decision variable wh represent the weight assigned to the hth lower cargo hold, h = 1, 2, …, NH. The following is the row-based AWB model.
min P CG P TCG
r = 1 N R x r N P
x r n r z = 1 , 2 , , N R
h = 1 N H w h W C
w h W h , h = 1 , 2 , , N H
r = 1 N R w P · x r + h = 1 N H w h W MPL
P CG P FCG
P CG P ACG
where nr represents the number of seats in the rth row of the cabin. The remaining terms are consistent with the compartment-based AWB model.

3. Computational Experiments

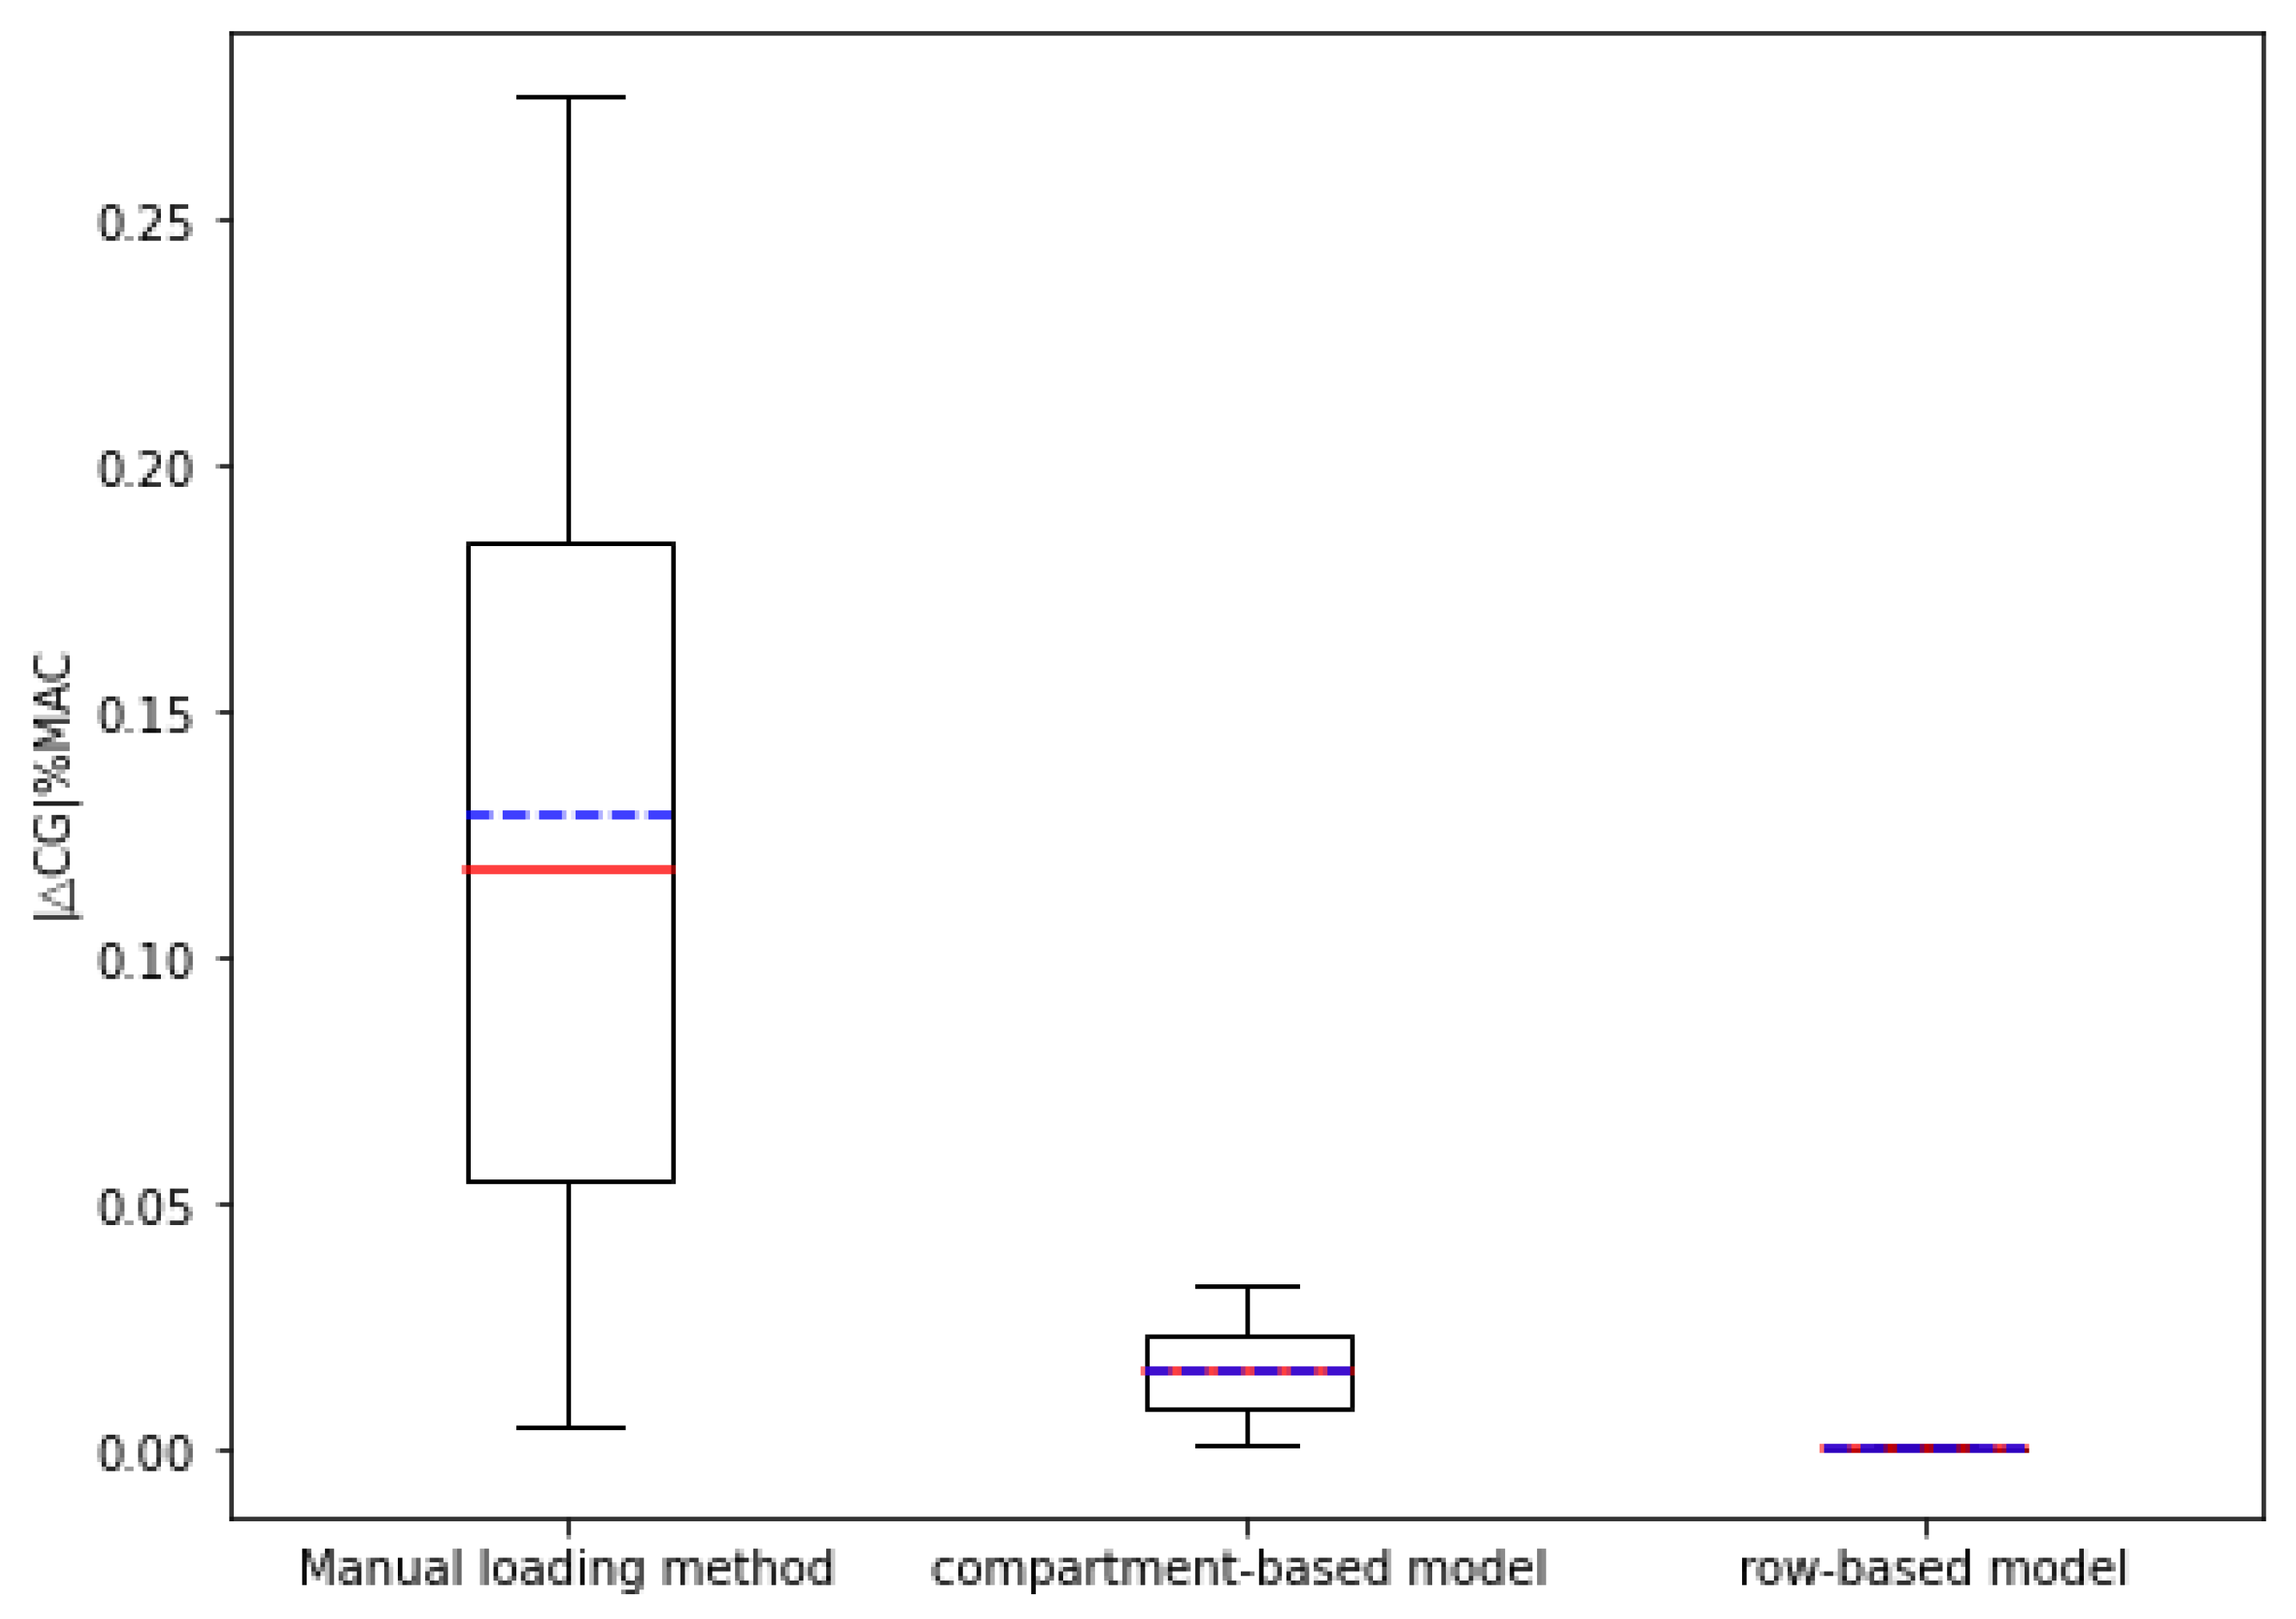
3.1. Comparison of the CG Deviation

We used the commercial solver Gourbi to solve our model. The efficiency of the passenger allocation optimization procedure was evaluated by calculating and analyzing the models of the row-based and compartment-based AWB models. We also provide the results of the traditional manual loading method (using manifests for loading). The test results with the TCG at 20% MAC and passenger counts ranging from 30 to 125 are presented in Table 1 and Figure 5.
The row-based allocation model has the lowest |CG| values and the smallest gap between the real center of gravity and the ideal center of gravity, as Table 1 and Figure 5 illustrate. The traditional manual loading method has the highest |CG| values and the largest gap between the real center of gravity and the ideal center of gravity, as shown in Table 1 and Figure 5. The results from compartment-based allocation range from 0.001% MAC to 0.03% MAC, manual loading results range from 0.005% MAC to 0.3% MAC, and row-based allocation yields the best results from 0.00006% MAC to 0.005% MAC.
Table 2 demonstrates how much faster the compartment-based model produces results than the row-based model. The speed of the row-based model is due to its search space being over ten times larger than that of the compartment-based model.

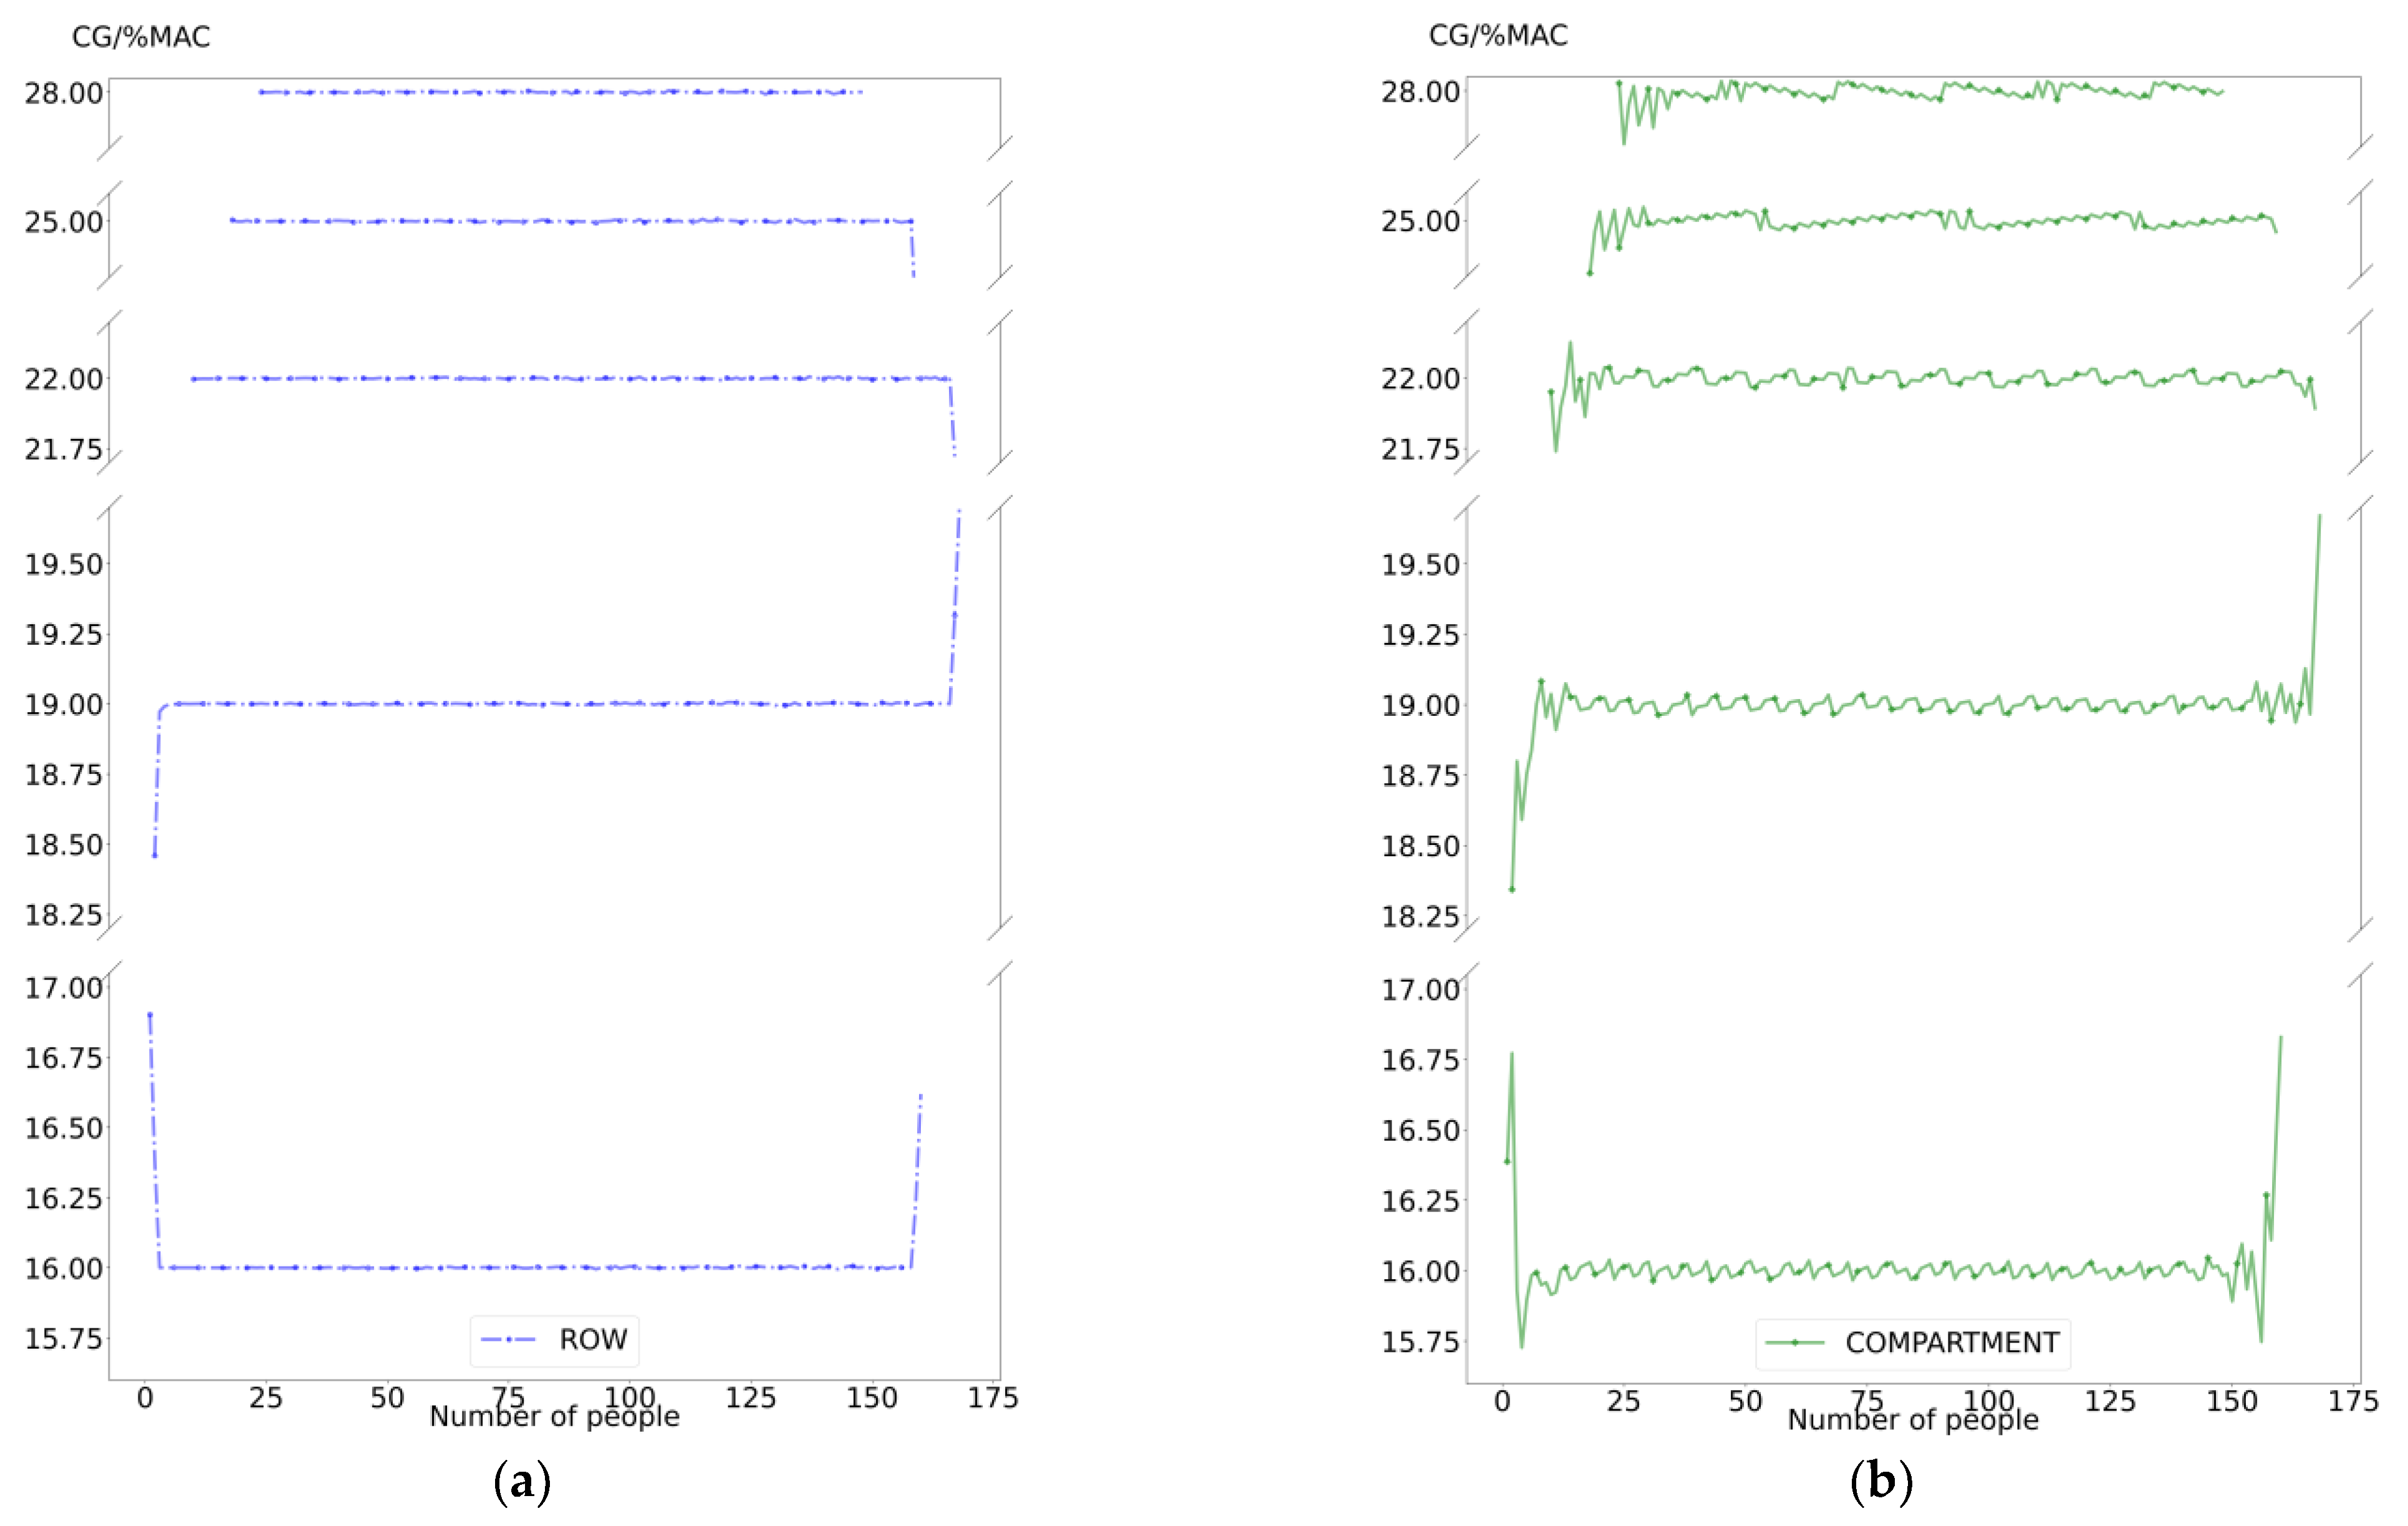
3.2. Comparison of Results with Different TCG

We compared the Δ C G s of compartment-based and row-based models using different TCGs (16%, 19%, 22%, 25%, and 28% MAC) as shown in Figure 6. The allocation methodology utilizing rows results in lower values of Δ C G s compared to the compartment-based method, as depicted in Figure 5. This is due to the fact that the row-based model has 29 rows that can be assigned and about 10 times more sets that can be mobilized than the compartment-based model, which only has three compartments that can be assigned and fewer sets that can be mobilized. The compartment-based model’s failure to handle the CG when the number of passengers increases leads to periodic fluctuations in the Δ C G s. The model is limited to cyclically distributing people between several compartments. Furthermore, as the TCG increases in size, the fluctuations become increasingly prominent and exhibit a higher degree of periodicity. It can also be observed from Figure 5 that the compartment-based allocation technique shows a significant increase in Δ C G s when passenger counts exceed a specific range. The flexibility of compartment-based allocation is significantly constrained by the inherent limitation of controlling only three compartments. The row-based allocation strategy can effectively allocate a broader range of passengers and is superior to the compartment-based allocation technique.

4. The Effect of Variances in Passenger Weight on CG

Most airlines in China use 75 kg as the normal passenger weight for allocation. However, planners rely on calculations that may not adequately represent the current population demographics, and the exact weight of the passengers is unknown (Melis et al. 2019 [29]). The use of standard passenger weights results in an overestimation of the aircraft’s performance characteristics, particularly its change in center of gravity (ΔCG) and fuel cost.
We express the passenger weight distribution as wr~N (75, 15). The passenger weight distribution is represented as a normal distribution with a mean of 75 and a standard deviation of 15. According to the “Aircraft Weight and Balance Control Regulations (CAAC 2019 [30])” and the “2022 China Resident Height and Weight Health Data Report” (as shown in Figure 7), the average weight of passengers and their cabin luggage is 75 kg. The weight fluctuation is 15 kg, considering differences in weight between genders and other aspects such as whether passengers are carrying bags.

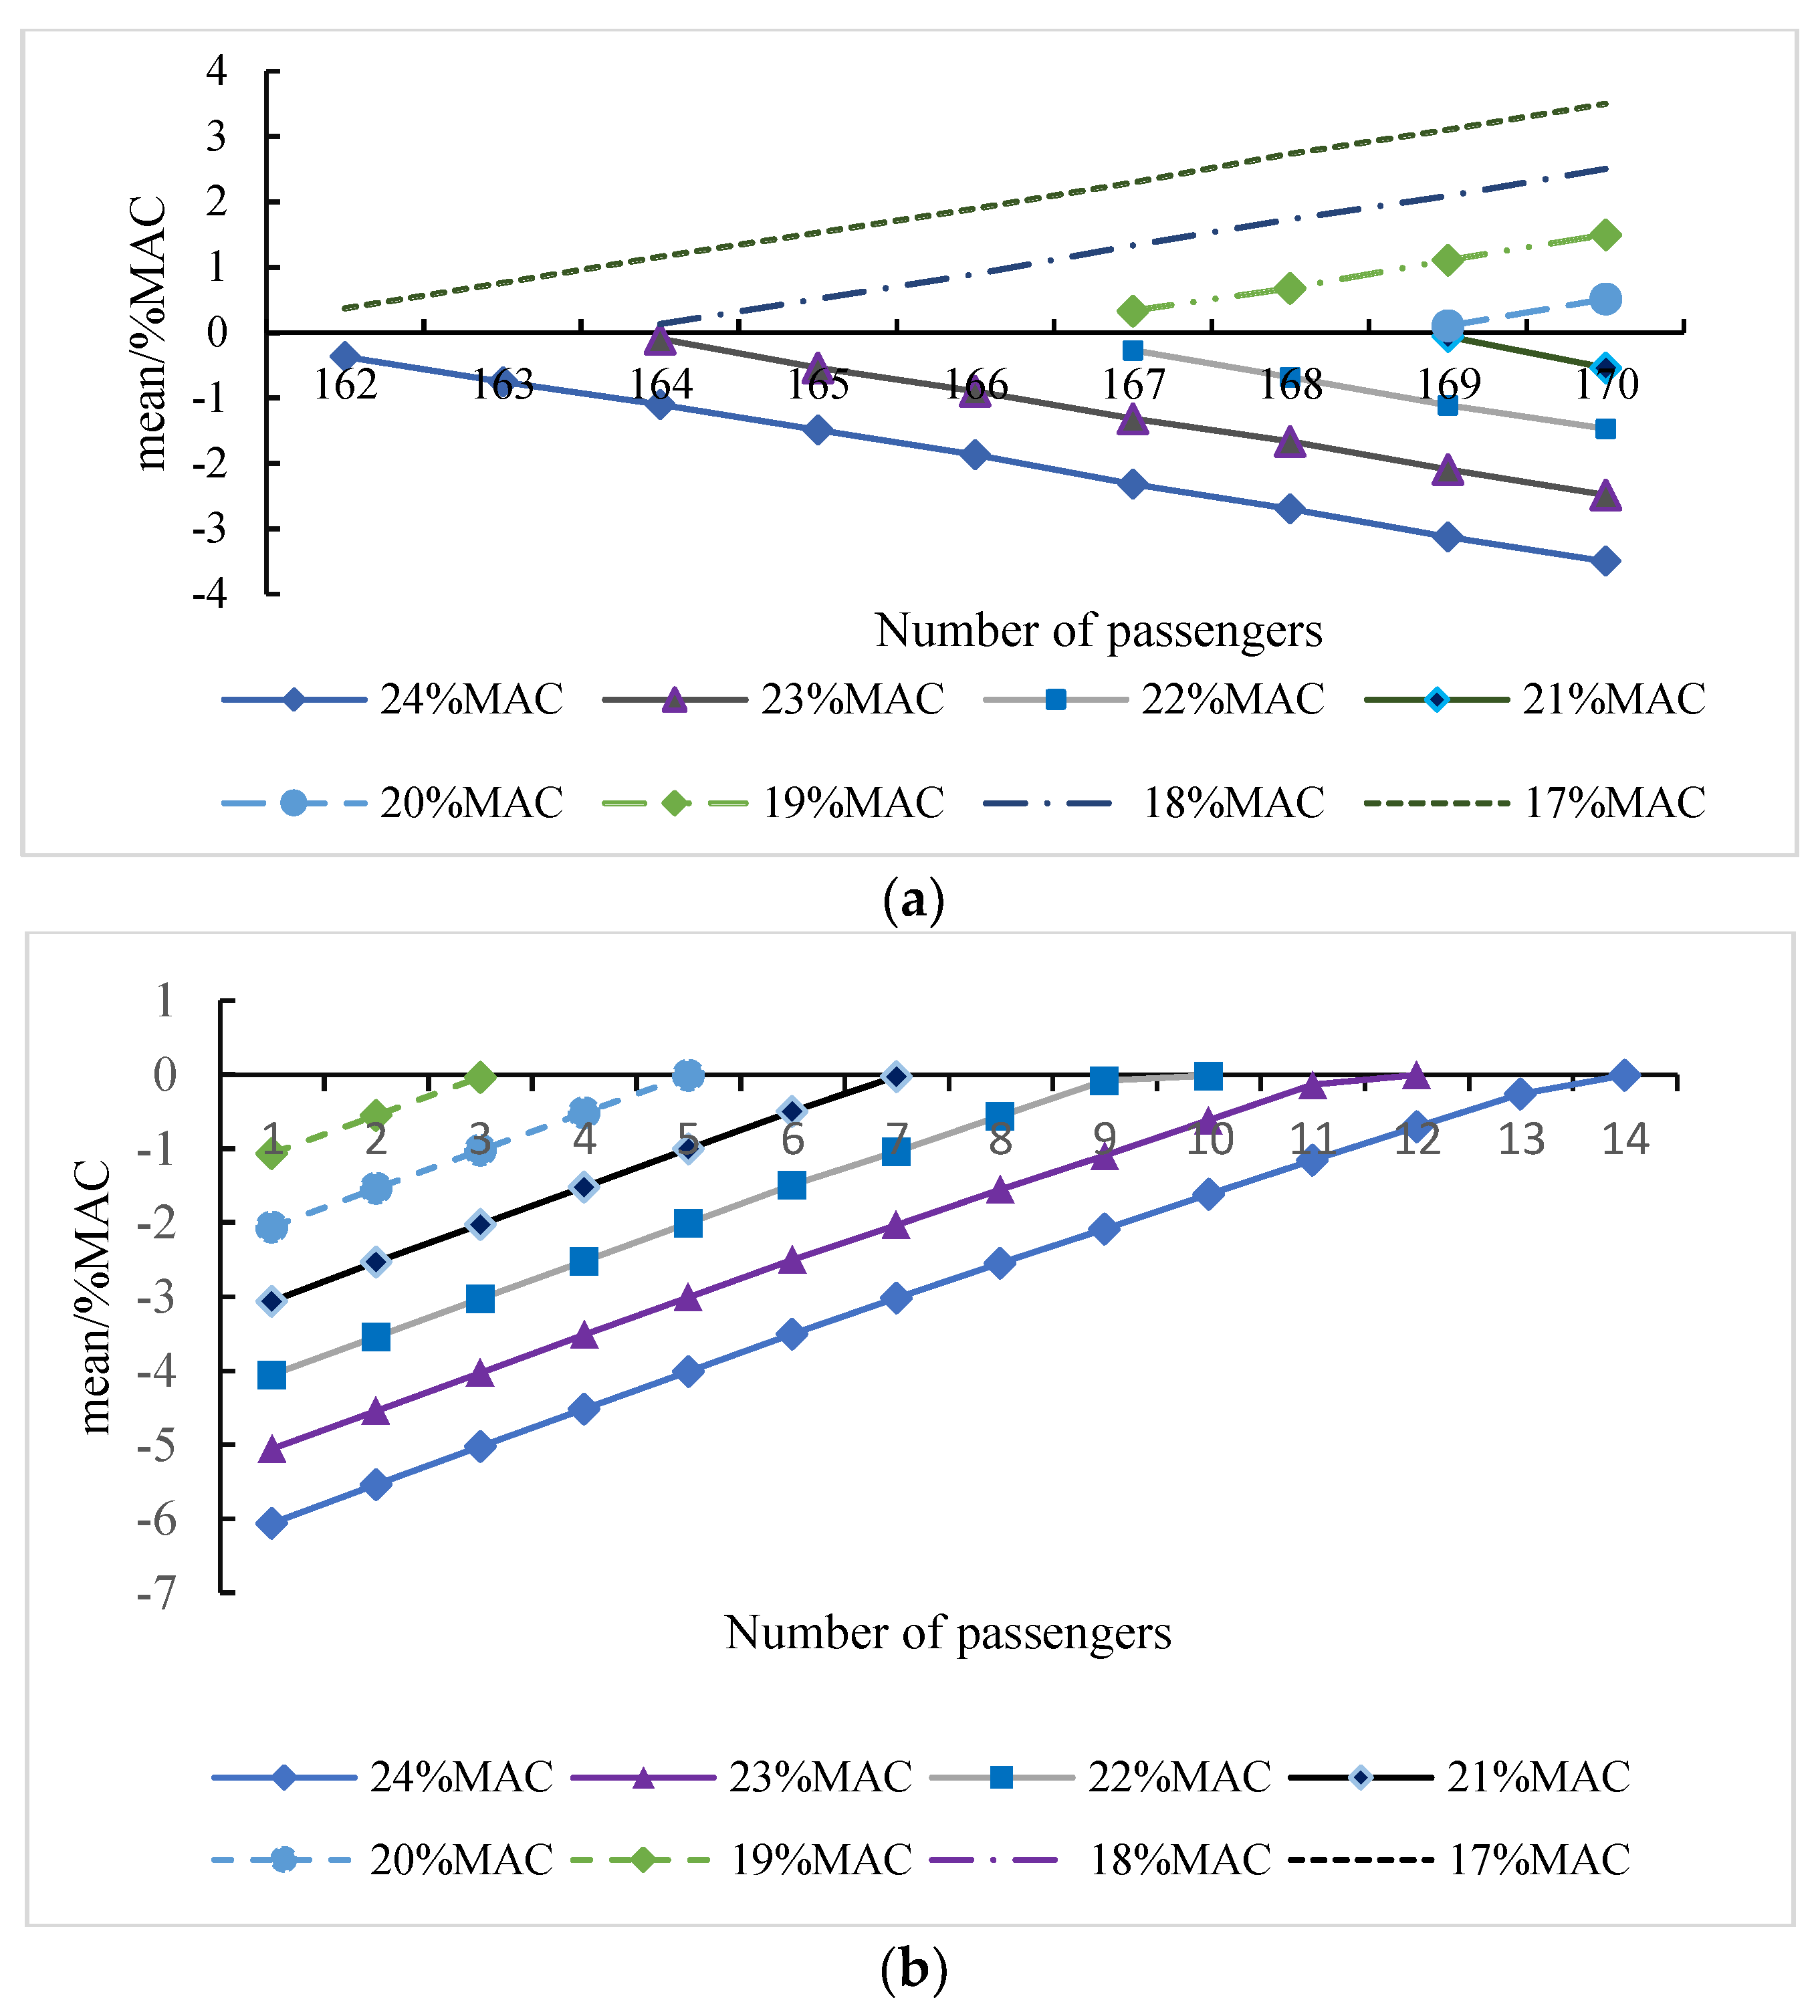
4.1. The Effect on the Mean

We utilized the Monte Carlo method to evaluate the uncertainty linked to passenger weight. The procedures were as follows: Firstly, the row-based model was utilized to ascertain the number of passengers per seat in the cabin. Secondly, a normal distribution was employed to generate random values (wr) for Nr passengers. Subsequently, the previously standardized weight of passengers (75 kg) was replaced. Lastly, the computation of the CG was performed for each substitution. By iteratively substituting the passenger weight, we obtained a posterior distribution of the CG that takes into account the passenger’s uncertainty. Each of the numbers of passengers (120, 140, and 160) was tested 1000 times with the aim of determining the distributions of CG deviation. The TCG of 24% MAC was used for these tests, as shown in Figure 8.
Figure 8 demonstrates that the CG deviation follows a normal distribution as a result of the uncertainty in passenger weight. There is a notable change in the average value of the absolute difference between the CG when the population size approaches 160. This issue arises when the TCG position is set excessively towards the rear (or front), resulting in the row-based allocation model saturation of the seats in either the back or front rows due to an excess of passengers. In this scenario, the model can only allocate passengers in a sequential manner, either starting from the back and moving towards the front or starting from the front and moving towards the back. This results in a significant magnitude of |ΔCG|, leading to a loss of control over the CG. Furthermore, there exists a correlation between the weight of passengers and the quantity of individuals that can be accommodated. In order to incorporate the impact of fluctuations in passenger weight into the CG deviation, it is necessary to consider the effective range of control over the number of passengers.
The bisection approach was used to determine the effective control range of the number of passengers for the model with a TCG of 24% MAC. Two sets of numbers of passengers, specifically (12, 13, 14) and (158, 159, 160), were examined, and the outcome is depicted in Figure 9 and Figure 10. The average value of the distribution of ΔCG deviates from 24% MAC (the average of |ΔCG| > 1% MAC) when the number of passengers exceeds 159 or falls below 13. Therefore, the effective control range of the number of passengers for the model with a TCG of 24% MAC is determined to be between 13 and 159. That is, assuming a TCG of 24% MAC, the row-based allocation model can optimally distribute seats when the passenger count is between 14 and 158.
The TCG is a significant factor in determining the magnitude of |ΔCG|. Thus, we can determine the effective ranges of numbers of passengers by repeating the preceding operation and considering various TCGs and numbers of passengers, as depicted in Figure 11.

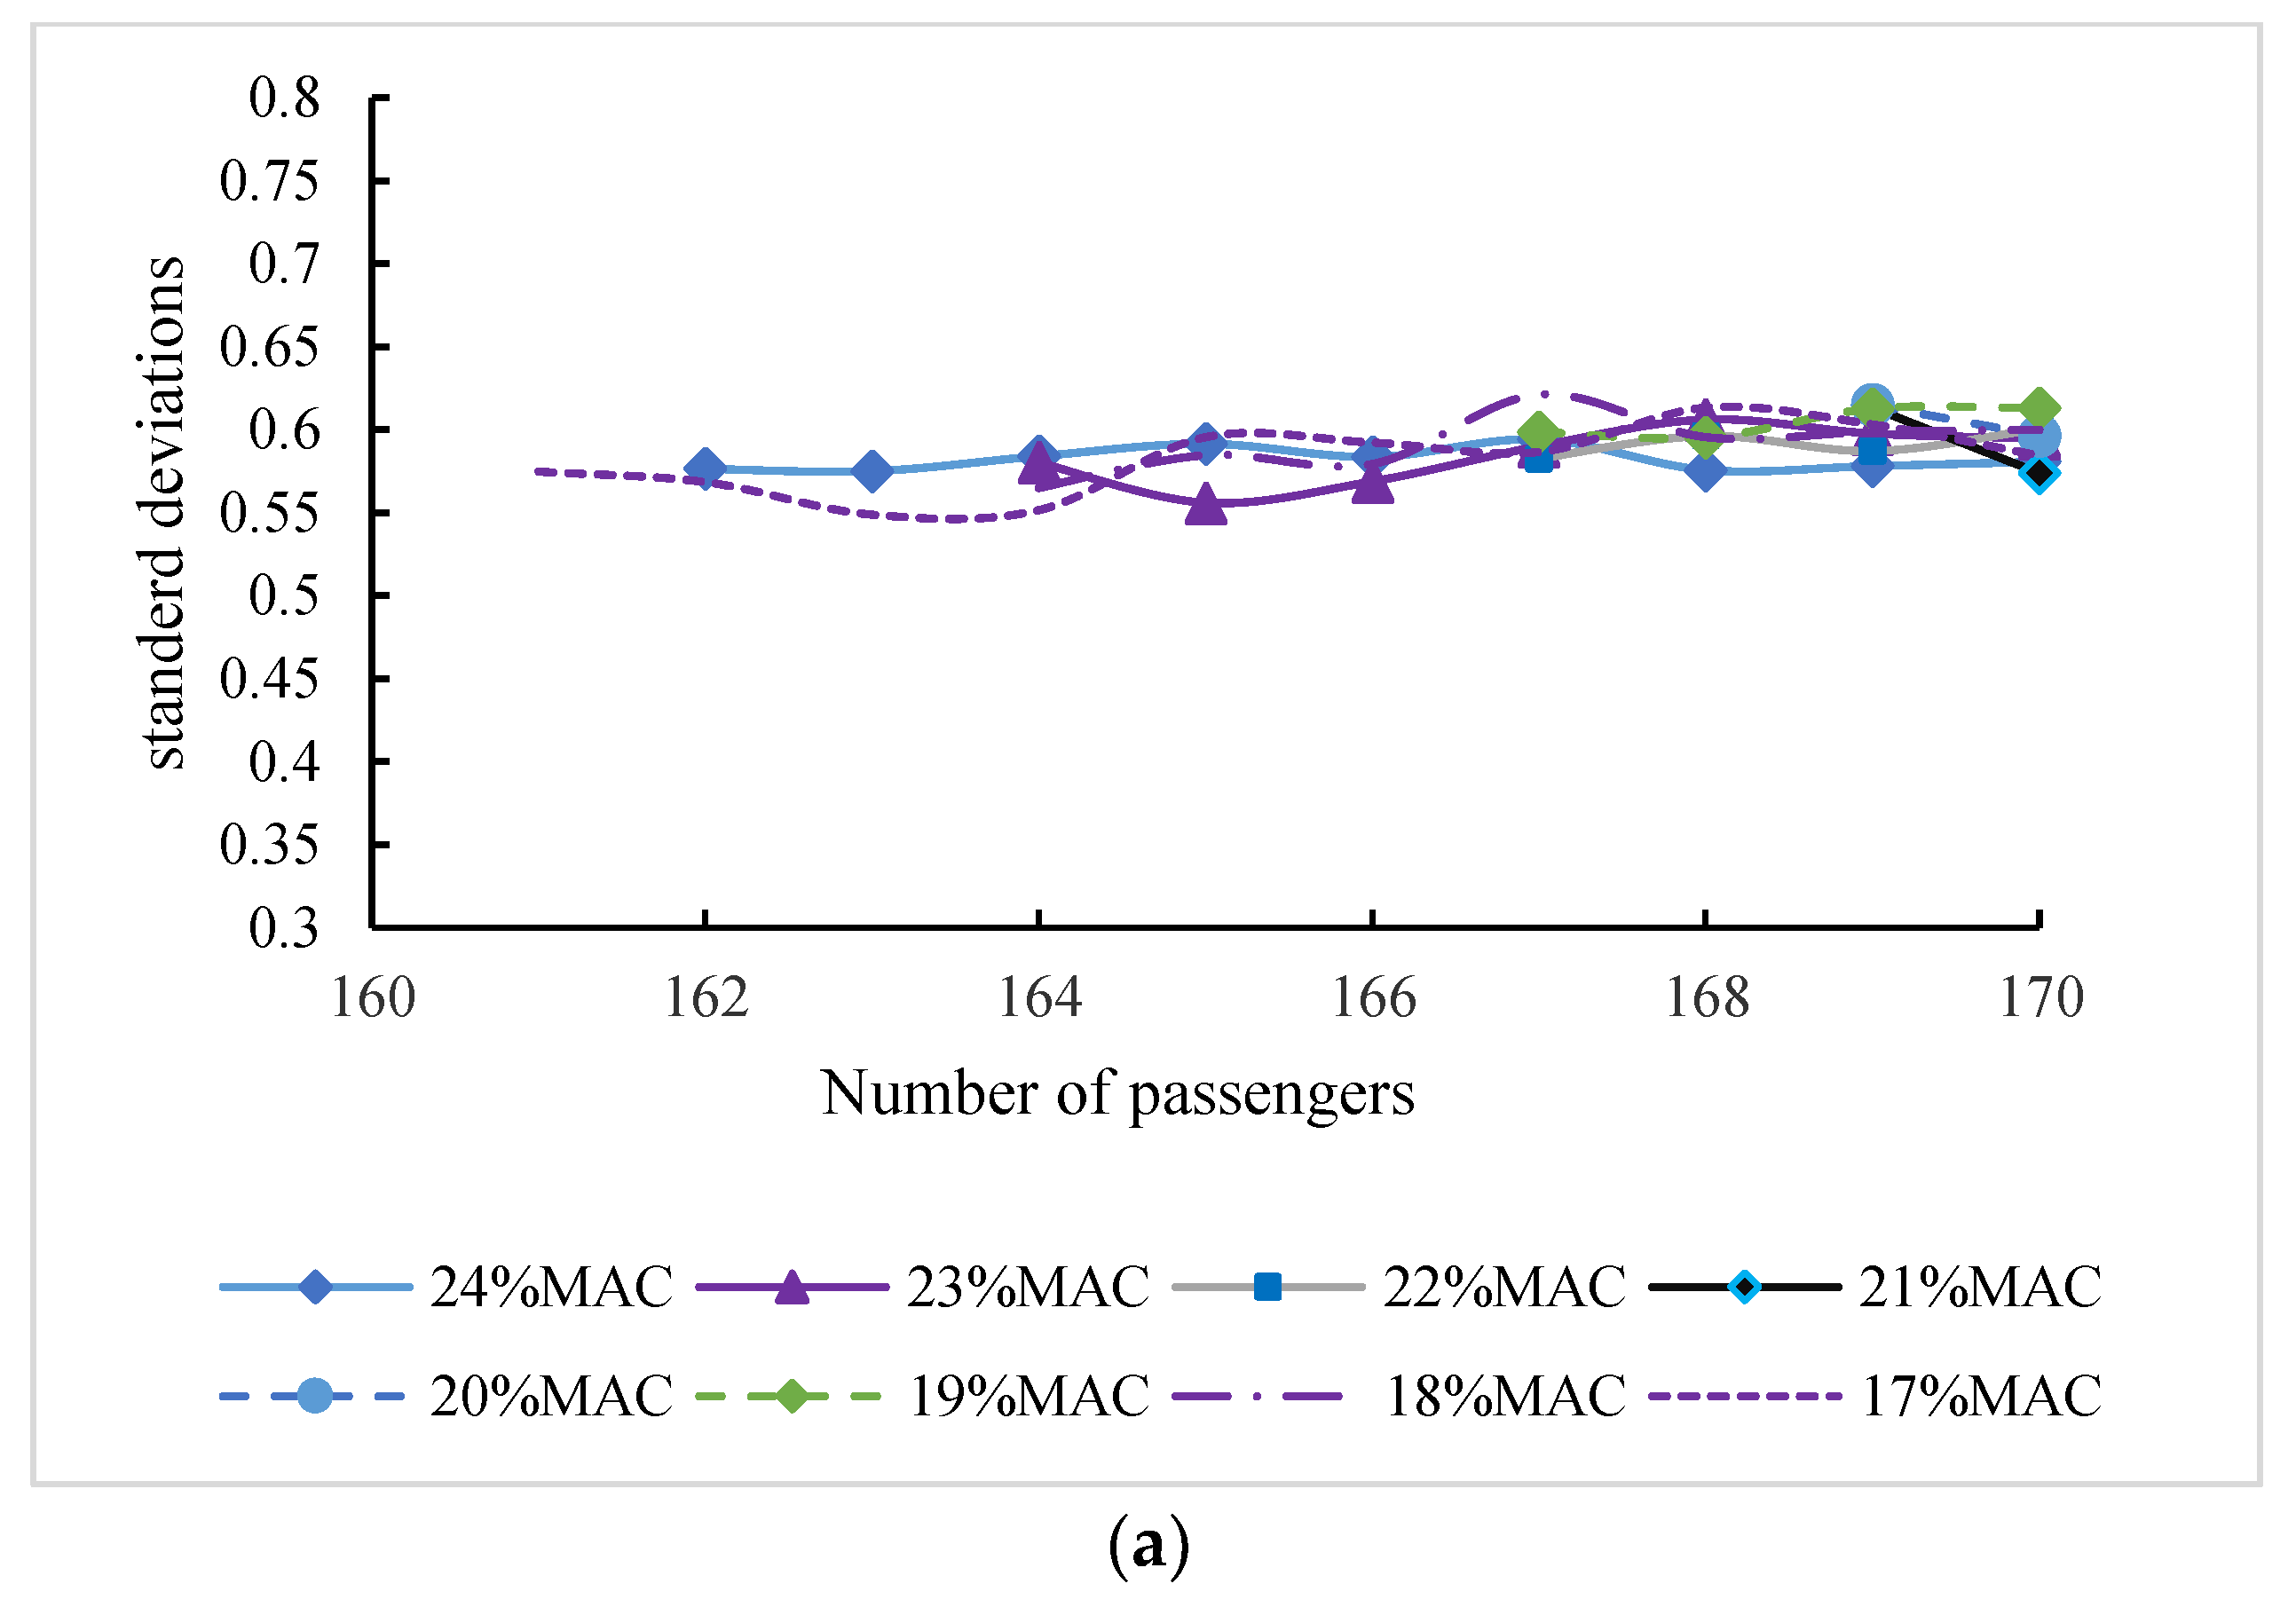
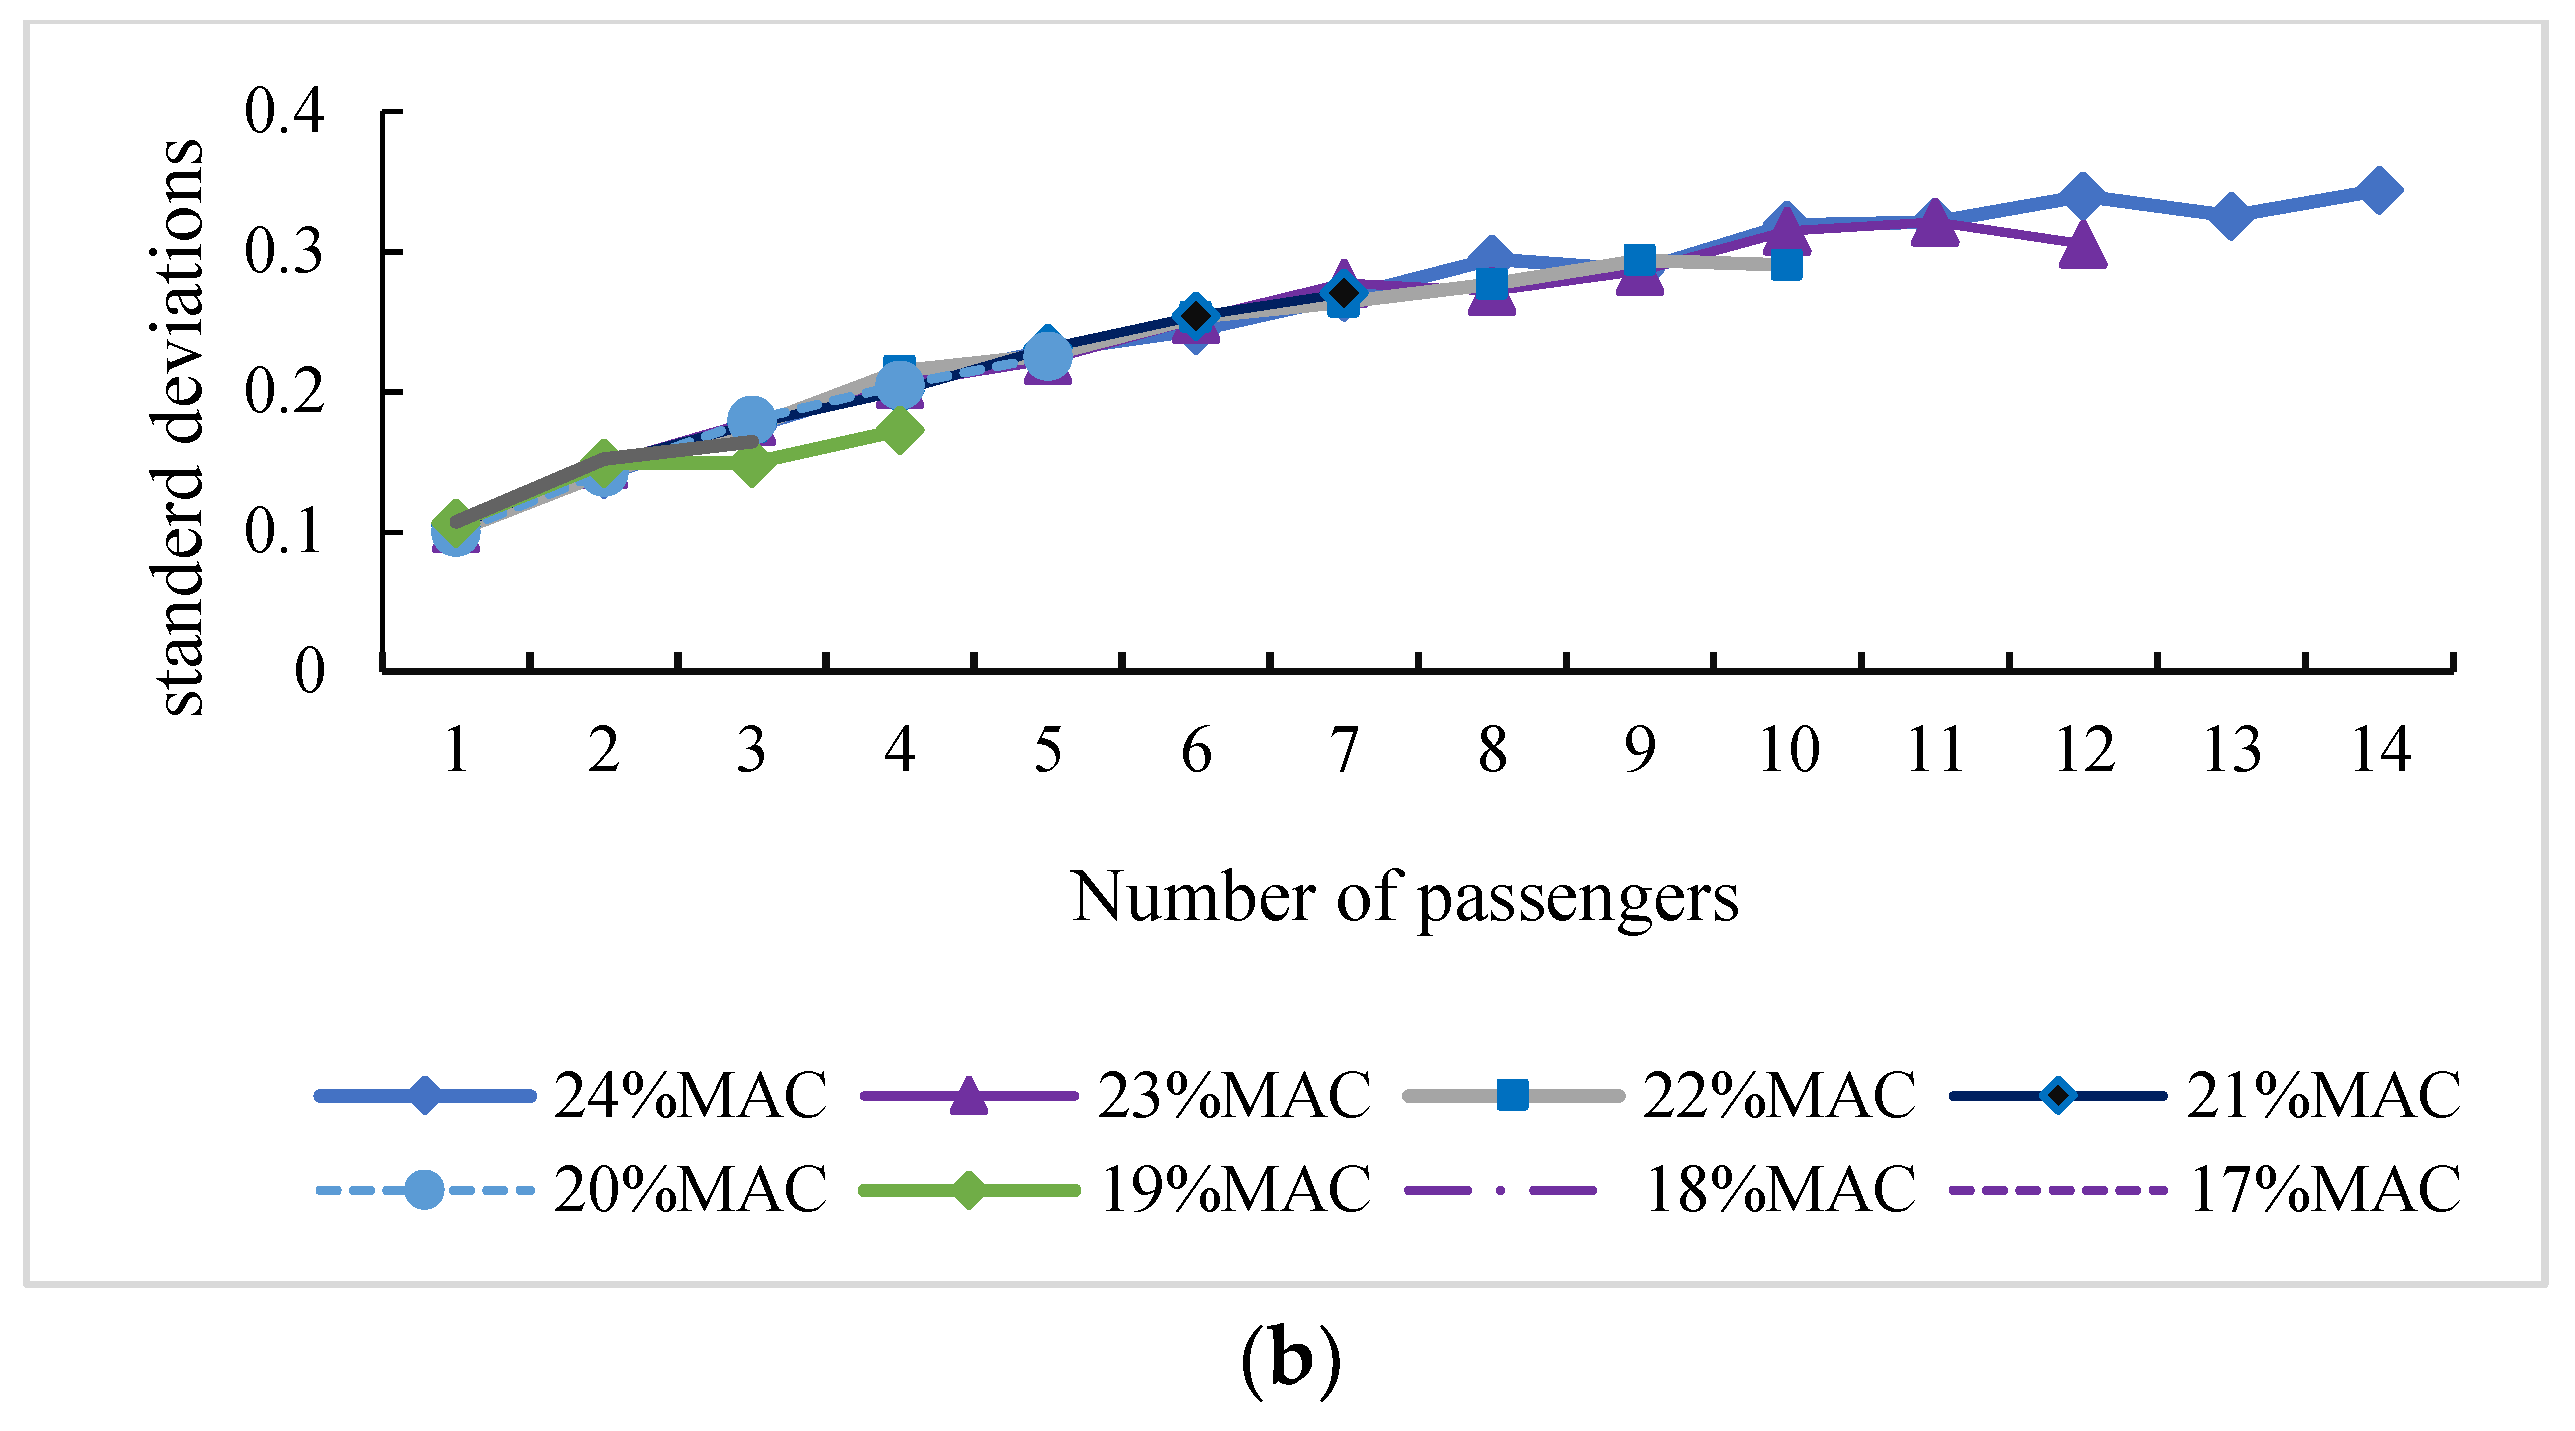
4.2. The Effect on the Standard Deviation

We analyzed the standard deviation of the distributions of |ΔCG|, which are displayed in Figure 12. This analysis was conducted using a TCG of 22% MAC and a number of passengers ranging from 20 to 120. Although the average distribution remains continuous near the TCG, the variability in the absolute difference in the CG (|ΔCG|) is much different.
Further experiments were carried out in order to monitor the fluctuations in the standard deviation values as the number of passengers changed (Figure 13). Research has shown that there is a positive correlation between the standard deviation of ΔCG distributions and the number of passengers. However, this correlation weakens as the number of passengers increases. The correlation between the standard deviation and the number of passengers for other TCGs is comparable to 22% MAC.

4.3. The Confidence Interval of the Mean of ΔCG

All other ΔCGs are uniformly regarded as the same distribution when the number of passengers is within the model’s effective range. According to the principle of maximum entropy, this distribution must encompass all deviations in the center of gravity for passenger counts that are within the effective range of the model (Figure 14). The maximum distribution was chosen to be a normal distribution with a mean (μ) of −0.2% MAC and a standard deviation of 1.1% MAC. Subsequently, the deviations of the center of gravity were calculated for confidence levels of 90%, 95%, and 99%. The findings are displayed in Table 3.
From Table 3, it can be seen that the deviation of the center of gravity within the valid range of the model does not exceed 3.5% MAC. so according to this result the center of gravity envelope is shrunk accordingly.

4.4. The Effect of the Number of Passengers Outside Effective Ranges

While there is a small probability that the number of passengers will fall outside of effective ranges during normal flight operations, the means of the ΔCG distribution show a noticeable change. We calculated the distribution of ΔCG using TCGs ranging from 17% to 24% MAC and passenger counts that were outside of their effective limits. The ΔCG shifts to the left for TCGs ranging from 21 to 24% MAC and to the right for TCGs ranging from 17 to 20% MAC as the number of passengers increases, as depicted in Figure 15. In addition, the means exhibit an arithmetic progression with TCGs for the same number of passengers. More precisely, with every 1% MAC increase in TCGs, the mean varies by approximately 1.01% MAC. When the TCG is constant, the mean shifts by approximately 0.3% of the mean for every additional passenger. When the number of passengers is below the lower limit of the model’s effective number of assignments, the average value of ΔCG approaches zero as the number of people increases. This is because the increase in the number of people improves the adaptability of the model’s assignments.
When the number of passengers achieves the capacity of the cabin, there is variability in the standard deviation within the range of 0.55 to 0.6. When the number of passengers is small, the relationship between the standard deviation and the number of people is more pronounced (Figure 16). Table 4 and Table 5 display the confidence intervals that we computed outside the upper and lower bounds of the model’s effective allocation range.

4.5. The Effect on the Mean

The following findings can be deduced by examining the correlation between the absolute value of the change in center of gravity (|ΔCG|) and the uncertainty in passenger weight: When the number of passengers is within the range that the model can effectively regulate, the change in center of gravity (|ΔCG|) is insignificant. However, as the number of passengers surpasses this range, the distribution of |ΔCG| changes, and the deviation increases. Given that a majority of cases have an occupancy rate of above 80% or 90%, situations that fall below the lower limit of model effectiveness are uncommon. Hence, when addressing the issue of passenger weight uncertainty, the main focus should be on improving the maximum number of passengers that the allocation model can efficiently control. Figure 14 clearly demonstrates that a TCG of 20–21% MAC decreases both the average value of |ΔCG| and the range of numbers of passengers that have no effect. Hence, by establishing the TCG to range from 20 to 21% MAC, the efficiency of the row-based allocation model can be optimized.

5. Discussion

Firstly, the row-based model provides approximately 6 to 16 times greater control of the center of gravity than the compartment-based model and 60 to 80 times greater control than traditional manual loading methods. Therefore, the row-based AWB model can significantly improve the effectiveness of civil passenger transportation allocation. Secondly, the recommended TCG for the row-based model achieves an effective headcount range of 95.29% to 98.23% of the actual range of passengers. This effective range is approximately 4–10 percentage points higher than the least suggested TCG placements (17% MAC effective range at 91.17% and 24% MAC effective range at 86.47%). Moreover, the suggested TCG position has about 2–4 times the center of gravity control of the least recommended TCG position when the number of passengers exceeds the upper boundary of the effective range of the row-based AWB model. However, the level of control that the recommended TCG position has over the least recommended TCG position decreases when the number of passengers falls below the lower boundary of the effective range of the row-based ABW model. Nevertheless, according to the regulations outlined in the relevant legislation, it is highly uncommon for an aircraft with a capacity of 170 individuals to transport so few people. To summarize the above two points, the recommended TCG in the row-based model not only caters to a wider range of numbers of passengers on a flight but also exhibits more effective control over the center of gravity, with general applicability beyond this range.

6. Conclusions

In this study, a linear integer programming methodology was utilized to develop a precise airplane loading and balancing strategy. Passengers in the cabin are allocated in seat rows, while cargo is distributed in the cargo holds. The row-based allocation approach surpasses the conventional compartment-based strategy in terms of achieving precise control over the aircraft’s TCG and having a wider effective control range for the number of passengers. This method enhances the control of the center of gravity (CG) and flexibility of distribution. The row-based allocation model was used in this study to examine the relationship between the ΔCG and the uncertainty in passenger weight. The optimization of the TCG configuration is based on the established upper limits for the number of passengers. The subsequent course of action should involve undertaking further investigation into loading optimization and robust optimization in the presence of uncertainties related to passenger weight, baggage, cargo, mail, and other relevant factors.

Author Contributions

Conceptualization, X.Z.; Methodology, X.Z.; Data curation, W.X.; Writing—original draft, W.X.; Writing—review & editing, X.Z.; Visualization, W.X.; Funding acquisition, X.Z. All authors have read and agreed to the published version of the manuscript.

Funding

National Natural Science Foundation of China (U2333217, 52272356); the Fundamental Research Funds for the Central Universities (3122020049).

Data Availability Statement

The data that support the findings of this study are available from the corresponding author upon reasonable request.

Conflicts of Interest

The authors declare no conflicts of interest.

References

  1. Idan, M.; Iosilevskii, G.; Nazarov, S. In-Flight Weight and Balance Identification Using Neural Networks. J. Aircr. 2004, 41, 137–143. [Google Scholar] [CrossRef]
  2. Zhang, J.; Shen, G.; Yang, L. New Hybrid Adaptive Control Approach for Aircraft with Centre of Gravity Variation. IET Control Theory Appl. 2012, 6, 2179–2187. [Google Scholar] [CrossRef]
  3. Yang, X.; Luo, M.; Zhang, J.; Yang, L. Aircraft Centre-of-Gravity Estimation Using Gaussian Process Regression Models. In Proceedings of the 2016 IEEE/CSAA International Conference on Aircraft Utility Systems (AUS), Beijing, China, 10–12 October 2016; pp. 991–995. [Google Scholar]
  4. Jumat, N.A.; Abdullah, E.J. Development of an Aircraft Load Planning System for Distribution of Passenger Baggage. Int. J. Eng. Technol. 2018, 7, 95–98. [Google Scholar] [CrossRef]
  5. Chaves, F.; Silvestre, M.; Gamboa, P. Preliminary Development of an Onboard Weight and Balance Estimator for Commercial Aircraft. Aerosp. Sci. Technol. 2018, 72, 316–326. [Google Scholar] [CrossRef]
  6. Zhao, X.; Yuan, Y.; Dong, Y.; Zhao, R. Optimization Approach to the Aircraft Weight and Balance Problem with the Centre of Gravity Envelope Constraints. IET Intell. Transp. Syst. 2021, 15, 1269–1286. [Google Scholar] [CrossRef]
  7. Ole, L.; Mikkelsen, G. Danish Operations Research Society Student Competition An Interactive System for the Loading of Cargo Aircraft. Eur. J. Oper. Res. 1980, 4, 367–373. [Google Scholar]
  8. Brosh, I. Optimal Cargo Allocation on Board a Plane: A Sequential Linear Programming Approach. Eur. J. Oper. Res. 1981, 8, 40–46. [Google Scholar] [CrossRef]
  9. Amiouny, S.V.; Bartholdi, J.J.; Vate, J.H.V.; Zhang, J. Balanced Loading. Oper. Res. 1992, 40, 238–246. [Google Scholar] [CrossRef]
  10. John, R.W.; Fadel, G.M. Packing and Optimizing the Center of Gravity Location Using a Genetic Algorithm. J. Comput. Ind. 1994, 11, 2–14. [Google Scholar]
  11. Mathur, K. An Integer-Programming-Based Heuristic for the Balanced Loading Problem. Oper. Res. Lett. 1998, 22, 19–25. [Google Scholar] [CrossRef]
  12. Heidelberg, K.R.; Parnell, G.S.; Ames, E.A., IV. Automated Air Load Planning. Nav. Res. Logist. 1998, 45, 751–768. [Google Scholar] [CrossRef]
  13. Dahmani, N.; Krichen, S. On Solving the Bi-Objective Aircraft Cargo Loading Problem. In Proceedings of the 2013 5th International Conference on Modeling, Simulation and Applied Optimization (ICMSAO 2013), Hammamet, Tunisia, 28–30 April 2013; pp. 1–6. [Google Scholar]
  14. Brandt, F.; Nickel, S. The Air Cargo Load Planning Problem—A Consolidated Problem Definition and Literature Review on Related Problems. Eur. J. Oper. Res. 2019, 275, 399–410. [Google Scholar] [CrossRef]
  15. Schultz, M.; Soolaki, M. Analytical Approach to Solve the Problem of Aircraft Passenger Boarding during the Coronavirus Pandemic. Transp. Res. Part C Emerg. Technol. 2021, 124, 102931. [Google Scholar] [CrossRef] [PubMed]
  16. Ren, X.; Pan, N.; Jiang, H. Differentiated Pricing for Airline Ancillary Services Considering Passenger Choice Behavior Heterogeneity and Willingness to Pay. Transp. Policy 2022, 126, 292–305. [Google Scholar] [CrossRef]
  17. Notomista, G.; Selvaggio, M.; Sbrizzi, F.; Di Maio, G.; Grazioso, S.; Botsch, M. A Fast Airplane Boarding Strategy Using Online Seat Assignment Based on Passenger Classification. J. Air Transp. Manag. 2016, 53, 140–149. [Google Scholar] [CrossRef]
  18. Birolini, S.; Besana, E.; Cattaneo, M.; Redondi, R.; Sallan, J.M. An Integrated Connection Planning and Passenger Allocation Model for Low-Cost Carriers. J. Air Transp. Manag. 2021, 99, 102160. [Google Scholar] [CrossRef]
  19. Wong, W.H.; Zhang, A.; Van Hui, Y.; Leung, L.C. Optimal Baggage-Limit Policy: Airline Passenger and Cargo Allocation. Transp. Sci. 2009, 43, 355–369. [Google Scholar] [CrossRef]
  20. Ma, H.-L.; Sun, Y.; Mo, D.Y.; Wang, Y. Impact of Passenger Unused Baggage Capacity on Air Cargo Delivery. In Annals of Operations Research; Springer: Berlin/Heidelberg, Germany, 2023; pp. 1–17. [Google Scholar] [CrossRef]
  21. Liu, Y.; Cheng, X.; Tang, D.; Wang, X. Optimization of Cabin Seating Arrangement Strategies Based on the Wells-Riley Risk Theory. PLoS ONE 2023, 18, e0294345. [Google Scholar] [CrossRef]
  22. Qiu, J.; Wu, C.-F.; Wu, A.; Liu, L. Smart Airplane Seat Assignment System for Passengers’ Multimedia Preferences. In Proceedings of the 2017 IEEE International Conference on Smart Computing (SMARTCOMP), Hong Kong, China, 29–31 May 2017; pp. 1–6. [Google Scholar]
  23. Castro, J.; Sarachaga, F. An Online Optimization-Based Procedure for the Assignment of Airplane Seats. TOP 2021, 29, 204–247. [Google Scholar] [CrossRef]
  24. Milne, R.J.; Cotfas, L.-A.; Delcea, C.; Crăciun, L.; Molănescu, A.G. Airplane Seating Assignment Greedy Algorithms That Separate Passengers Likely to Be Susceptible to Infectious Disease from Those Likely to Be Infectious. IEEE Access 2024. [Google Scholar] [CrossRef]
  25. Birge, J.R.; Louveaux, F. Introduction to Stochastic Programming; Springer: New York, NY, USA, 2011. [Google Scholar] [CrossRef]
  26. Hannan, M.A.; Faisal, M.; Ker, P.J.; Begum, R.A.; Dong, Z.Y.; Zhang, C. Review of Optimal Methods and Algorithms for Sizing Energy Storage Systems to Achieve Decarbonization in Microgrid Applications. Renew. Sustain. Energy Rev. 2020, 131, 110022. [Google Scholar] [CrossRef]
  27. Crainic, T.G.; Fomeni, F.D.; Rei, W. Multi-Period Bin Packing Model and Effective Constructive Heuristics for Corridor-Based Logistics Capacity Planning. Comput. Oper. Res. 2021, 132, 105308. [Google Scholar] [CrossRef]
  28. Crainic, T.G.; Perboli, G.; Rei, W.; Rosano, M.; Lerma, V. Capacity Planning with Uncertainty on Contract Fulfillment. Eur. J. Oper. Res. 2024, 314, 152–175. [Google Scholar] [CrossRef]
  29. Melis, D.J.; Silva, J.M.; Silvestre, M.A.; Yeun, R. The Effects of Changing Passenger Weight on Aircraft Flight Performance. J. Transp. Health 2019, 13, 41–62. [Google Scholar] [CrossRef]
  30. Civil Aviation Administration of China. Regulations on Aircraft Weight and Balance Control (Civil Aviation Regulation (2019) No. 61) [s]. 2019. Available online: https://www.caac.gov.cn/XXGK/XXGK/GFXWJ/201911/t20191104_199320.html (accessed on 25 March 2024).
Figure 1. Force characteristics of different means of transport.
Mathematics 12 01591 g001
Figure 2. The relationship between the absolute position (BCG) and relative position (PCG).
Mathematics 12 01591 g002
Figure 3. Division of aircraft compartments.
Mathematics 12 01591 g003
Figure 4. Deviation analysis.
Mathematics 12 01591 g004
Figure 5. Comparison of allocation results for three methods.
Mathematics 12 01591 g005
Figure 6. Comparison of control strength at different center of gravity positions: (a) row-based model; (b) compartment-based model.
Mathematics 12 01591 g006
Figure 7. National weight data.
Mathematics 12 01591 g007
Figure 8. Passenger weight uncertainty and aircraft center of gravity bias distribution.
Mathematics 12 01591 g008
Figure 9. Aircraft center of gravity with 158, 159, and 160 passengers.
Mathematics 12 01591 g009
Figure 10. Aircraft center of gravity with 12, 13, and 14 passengers.
Mathematics 12 01591 g010
Figure 11. Effective ranges of numbers of passengers for different TCGs.
Mathematics 12 01591 g011
Figure 12. Distribution of center of gravity deviations for 20 and 120 passengers.
Mathematics 12 01591 g012
Figure 13. Variation in standard deviation with the number of passengers.
Mathematics 12 01591 g013
Figure 14. Set distribution contrast.
Mathematics 12 01591 g014
Figure 15. Change in the mean value of the distribution concerning the number of persons: (a) numerical upper boundary; (b) numerical lower boundary.
Mathematics 12 01591 g015
Figure 16. Changes in the degree of variance of the distribution with the number of people: (a) numerical upper boundary; (b) numerical lower boundary.
Mathematics 12 01591 g016aMathematics 12 01591 g016b
Table 1. Comparison of allocation results for three methods with varying numbers of passengers.
Number of Passengers|ΔCG| (%MAC)
Manual Loading MethodCompartment-Based ModelRow-Based Model
300.1220.005310.000109
350.1050.02110.000215
400.2000.01600.000534
450.05570.004000.000212
500.03390.01800.000104
550.1130.03320.000416
600.0480.02420.000311
650.1840.008905.91 × 10−5
700.1680.02990.000304
750.1760.02610.000404
800.06620.01110.000101
850.05120.00350.000198
900.04620.0180.000492
950.1870.01330.000196
1000.1410.001089.67 × 10−5
1050.09010.01520.000385
1100.2750.02920.000287
1150.2670.02345.46 × 10−5
1200.2520.009410.000282
1250.00430.004430.000375
mean0.129280.01576650.00025677
variance0.0005810.0095315140.000141822
Table 2. Comparison of solution time for two models with varying numbers of passengers.
Number of PassengersSolution Time (s)
The Compartment-Based ModelThe Row-Based Model
300.01301.000
350.02391.010
400.01991.008
450.01701.023
500.01391.036
550.01501.044
600.01991.036
650.02700.0300
700.01801.016
750.01891.026
800.0261.008
850.02691.008
900.01891.013
950.01601.009
1000.02501.009
1050.0331.010
1100.02301.010
1150.02390.0540
1200.02791.009
1250.01691.013
mean0.02120.9186
variance0.0052530.292435
Table 3. Confidence intervals for the center of gravity deviation.
Confidence Level KThe Value of ZConfidence Interval
90%1.5675[−1.9243, 1.5243]
95%1.862[−2.2482, 1.8482]
99%2.576[−3.0336, 2.6336]
Table 4. Confidence intervals for the center of gravity deviation (numerical upper boundary).
Target Center of Gravity (%MAC) Number of PassengersConfidence Levels and Intervals
90%95%99%
17169[−4.0254, −2.2133][−4.1958, −2.0430][−4.6086, −1.6302]
170[−4.4071, −2.5868][−4.5781, −2.4158][−4.9927, −2.0012]
18169[−3.0264, 1.1528][−3.2024, −0.9768][−3.6291, −0.5501]
170[−3.4133, −1.5488][−3.5885, −1.3736][−4.0131, −0.9490]
19169[−2.0250, −0.1844][−2.1979, −0.0115][−2.6171, 0.4077]
170[−2.4089, −0.5266][−2.5857, −0.3498][−3.0144, 0.0789]
20169[−1.0204, 0.9022][−1.2010, 1.0828][−1.6388, 1.5207]
170[−1.4354, 0.3634][−1.6044, 0.5324][−2.0141, 0.9421]
21169[−0.8607, 1.0669][−1.0418, 1.2480][−1.4808, 1.6870]
170[−0.4202, 1.4500][−0.5959, 1.6256][−1.0218, 2.0516]
22169[0.1535, 2.0743][−0.0269, 2.2547][−0.4644, 2.6922]
170[0.5382, 2.4601][0.3577, 2.6406][−0.0800, 3.0783]
23169[1.1520, 3.0292][0.9756, 3.2056][0.5481, 3.6331]
170[1.5648, 3.4454][1.3881, 3.6220][0.9598, 4.0503]
24169[2.1557, 4.0464][1.9780, 4.2240][1.5474, 4.6547]
170[2.5834, 4.4156][2.4113, 4.5877][1.9940, 5.0050]
Table 5. Confidence intervals for the center of gravity deviation (numerical lower boundary).
Target Center of Gravity (%MAC) Number of PassengersConfidence Levels and Intervals
90%95%99%
171[−0.2125, 0.1109][−0.2429, 0.1413][−0.3165, 0.2150]
181[−0.1250, 0.1334][−0.1493, 0.1576][−0.2081, 0.2165]
191[−1.2291, −0.8952][−1.2604, −0.8639][−1.3365, −0.7878]
2[−0.7883, −0.3198][−0.8324, −0.2758][−0.9391, −0.1691]
201[−2.2150, −1.9011][−2.2445, −1.8716][−2.3160, −1.8001]
2[−1.7591, −1.3127][−1.8010, −1.2707][−1.9027, −1.1690]
211[−3.2228, −2.8972][−3.2534, −2.8666][−3.3275, −2.7924]
2[−2.7641, −2.2964][−2.8081, −2.2524][−2.9146, −2.1459]
221[−4.2114, −3.8953][−4.2411, −3.8656][−4.3131, −3.7936]
2[−3.7644, −3.3193][−3.8062, −3.2775][−3.9075, −3.1762]
231[−5.2165, −4.8940][−5.2468, −4.8637][−5.3203, −4.7903]
2[−4.7731, −4.3068][−4.8169, −4.2630][−4.9230, −4.1569]
241[−6.2248, −5.8958][−6.2557, −5.8650][−6.3306, −5.7901]
2[−6.2814, −5.8393][−6.3230, −5.7977][−6.4237, −5.6970]
Disclaimer/Publisher’s Note: The statements, opinions and data contained in all publications are solely those of the individual author(s) and contributor(s) and not of MDPI and/or the editor(s). MDPI and/or the editor(s) disclaim responsibility for any injury to people or property resulting from any ideas, methods, instructions or products referred to in the content.

