Abstract
Globalization and multinational commerce have increased the dynamism and complexity of supply networks, thereby increasing their susceptibility to disruptions along interconnected supply chains. This study aims to tackle the significant concern of supplier selection disruptions in the Thai agri-food industry as a response to the aforementioned challenges. A novel supplier evaluation system, PROMETHEE II, is suggested; it combines the Fuzzy Analytical Hierarchy Process (FAHP) with inferential statistical techniques. This investigation commences with the identification of critical indicators of risk in the sustainable supply chain via three phases of analysis and 315 surveys of management teams. Exploratory factor analysis (EFA) is utilized to ascertain six supply risk criteria and twenty-three sub-criteria. Following this, the parameters are prioritized by FAHP, whereas four prospective suppliers for an agricultural firm are assessed by PROMETHEE II. By integrating optimization techniques into sensitivity analysis, this hybrid approach improves supplier selection criteria by identifying dependable solutions that are customized to risk scenarios and business objectives. The iterative strategy enhances the resilience of the agri-food supply chain by enabling well-informed decision-making amidst evolving market dynamics and chain risks. In addition, this research helps agricultural and other sectors by providing a systematic approach to selecting low-risk suppliers and delineating critical supply chain risk factors. By bridging complexity and facilitating informed decision-making in supplier selection processes, the results of this study fill a significant void in the academic literature concerning sustainable supply chain risk management.
Keywords:
agri-food supply chain (AFSC); Fuzzy Analytical Hierarchy Process (FAHP); exploratory factor analysis (EFA); Hybrid Sensitivity–Optimization Method for Agri-food Supplier Selection (HSOMASS); PROMETHEE II; sustainable supply chain risk management (SSCRM) MSC:
90B50
1. Introduction
A supply chain comprises an interrelated sequence of activities commencing with the acquisition of basic materials and concluding with the generation of value in the form of completed goods and services and their distribution to consumers [,]. Numerous factors, such as globalization [,], supply and demand uncertainty [] and shorter product and technology life cycles [], have increased supply chain management complexity and the resulting difficulties in a variety of industries. Businesses must not only accomplish profit targets but also adhere to regulatory requirements for a sustainable supply chain. Every partner has a distinct role in establishing a resilient supply chain. For the entire supply chain to run sustainably, businesses must offer fully operational stakeholders [].
Supply chains are now more vulnerable to risk due to recent developments like outsourcing and just-in-time tactics []. Organizations are increasingly concerned about risk issues as they strive to survive in a difficult commercial climate. The primary sources of risk in supply chains can be categorized into three main categories: (a) operational fluctuations, such as variations in supply and price, as well as uncertainties in demand; (b) natural disasters, including hurricanes, severe droughts, and the coronavirus pandemic; and (c) catastrophes caused by humans, such as terrorist attacks and terrorist strikes [,].
In a supply chain, risk is defined as unpredictability or unreliable events that could lead to undesirable outcomes [], obstacles, disruptions, or detrimental effects on the product or supply chain profitability []. The result is a more complex, turbulent, and unpredictable corporate environment []. Supply chain malfunctions and disturbances result in company discontinuity, which may cause significant revenue losses. An agricultural supply chain is susceptible to many hazards originating from multiple sources, which may affect the dependability, expenses, and efficiency of processes related to manufacturing, processing, and marketing. For instance, according to USDA reports during the summer of 2012, almost 80% of American agricultural acreage was impacted by drought conditions. Furthermore, the Food and Agriculture Organization [] claimed that COVID-19 had an impact on agricultural supply chains (ASCs) in terms of both demand and supply, which, in turn, affects food security. Civic lockdown to stop the COVID-19 outbreak also severely harmed nine chains, resulting in labor losses and trade restrictions on food commodities [].
In recent times, there has been a growing acknowledgment of and significance placed on supply chain risk management (SCRM) []. Blos et al. [] noted that SCRM was still relatively unrecognized by many organizations. SCRM is, in fact, the interaction of risk management and supply chain management (SCM) []. SCRM’s primary objective is to formulate action plans to prevent, mitigate, or minimize disruptions by developing strategies for identifying potential sources of risk, assessing them, and controlling and responding to them [,].
As the process of market globalization accelerates, organizations must attract additional clients by considering several characteristics such as reliability, flexibility, and quality. The suppliers in an inbound supply chain perform a vital part in determining the operational and financial positions of a business [], particularly for the agricultural items that require special consideration. The crucial links in the supply chain for agricultural products are the suppliers of those products. The goal is to ensure the quantity and quality of fresh commodities, as well as adequate cold storage to maintain quality until the raw materials are packaged or processed []. Supplier selection problems comprise a diverse range of objectives that frequently encounter conflicts. In practice, determining the performance of prospective suppliers requires a set of criteria, including but not limited to cost, quality, organizational parameters, capabilities, and other customer-defined criteria that are presently in use, to identify the optimal supplier from a range of alternatives. Nevertheless, there has been limited attention given to the incorporation of risk criteria, specifically within the agricultural sector []. However, the significance of each element varies greatly and typically relies on the nature of the product or service to be obtained []. Finding the right suppliers and focusing on critical risk factors is becoming harder since every firm has unique plans, capabilities, and scopes that must be considered throughout the selection process []. In addition, all organizations have limited funds and resources to research and consider all possible risks [].
Thailand’s economic growth over the past few decades has been significantly influenced by the agricultural industry. The industry is widely recognized as the backbone of the nation, producing food, and opening up a large number of employment opportunities for the Thai population. Thailand’s economy today evolved from one based on subsistence farming to one centered on agribusiness and eventually industry. Intending to rescue the nation from the middle-income trap, the Thai government unveiled “Thailand 4.0” in 2016. The model aims to boost farmers’ yearly income from THB 56,450 to THB 390,000 by 2037 []. The implementation of this policy would necessitate a significant shift in strategy as well as collaboration with all the partner organizations involved in the supply chain. According to Kumar et al. [], among the primary and essential responsibilities of supply chain management is strategic sourcing, which includes a variety of purchasing schemes.
Choosing a supplier is the initial step in product development that is essential for achieving success in the market and enhancing a company’s competitive advantage in supply chain management []. The selection of raw material suppliers is an essential part of supply chain management that has both immediate and far-reaching consequences for a company’s performance. In agribusiness, good suppliers for raw materials with acceptable costs, quantity, and delivery are needed to ensure the quality and safety of agricultural fresh products compared to competitors. Supplier selection affects long-term commitments and supply chain performance []. In a risky supply chain, adequate criteria, and an effective approach for evaluating suppliers by performance are crucial []. As a result, determining and assessing supply chain risks is crucial for sustainable supplier selection.
The supplier selection process incorporates both quantitative and qualitative elements into the decision-making framework. Various factors are considered, such as financial considerations, technological proficiency, flexibility, capability for improvement, service, relationship, yields, price, and green technology [,,]. This issue is categorized as multiple criteria decision-making (MCDM). Several scholarly investigations have explored supplier selection strategies that incorporate supply chain risk [,,,,,]. However, it was argued that the body of research specifically examining the process of supplier selection in this area is exceedingly scant [,]. Moreover, there has been a lack of evaluation of the elements and methodologies presented in these works in the agri-food sector, especially in Thailand. Furthermore, conventional sustainable supplier selection methods encounter subsequent shortcomings in this study. Prior research has frequently failed to take sustainability issues and supply chain risk into account at the same time, which has resulted in erroneous assessment and poor supplier selection. The significance and weights of various decision-makers (DMs) are frequently ignored in sustainable supplier selection research, which has an impact on the precision and efficacy of decision-making []. Moreover, traditional supplier evaluation and selection research is substantial, but outranking approaches have received less attention in supplier selection despite their importance in other applications. To bridge the gaps in previous research, this study aims to examine the supplier selection problem from the perspective of realistic sustainable supply chain risk. The purpose of this study is to provide a paradigm for assessing and choosing suppliers to encourage long-term collaboration between manufacturers and suppliers.
Several methods have been used to solve these issues, from a simple linear weighting method to a more complex multi-objective method, as well as integrated or mixed models for instance: [,,,,]. Each of them is different and can be used in different ways. A Fuzzy Analytical Hierarchy Process (FAHP) and Preference Ranking Organization METHOd (PROMETHEE) II are two popular MCDM methods. The application of FAHP and PROMETHEE II algorithms was utilized in this context. The FAHP method can be used to assess the uncertainties involved in converting human preferences into a score, particularly when considering several variables in the selection process []. On the other hand, PROMETHEE II selects providers based on their assigned weights, aiming to minimize uncertainties arising from the comparison matrix. The effectiveness of the FAHP-PROMETHEE II method could resolve concerns about judgment inconsistency, accuracy, and weak prioritizing in pairwise procedures. It analyzes problem patterns and measures criteria weight. The FAHP and PROMETHEE methods have been successfully used in many areas, such as outsourcing information systems, choosing tools, policy scenarios, supply chain risk prioritization, and mining method selection []. This research endeavor aims to construct an all-encompassing evaluation framework that efficiently covers every facet of performance. In consideration of numerous selection process-related criteria and hazards, the framework could assist DMs in making informed decisions.
To fill this research gap and guide the sustainable journey of supply chain resilience, we address the following questions, leading to the development of two propositions on the issues identified:
- What are the primary elements and sub-factors that contribute to sustainable supply chain risks in the agri-food industry in Thailand when selecting suppliers?
- What is the practical approach to selecting suppliers in an agri-food firm that can combine these sustainable supply chain risk factors?
Consequently, a three-stage hybrid model combining statistical methods and MCDM approaches was developed for supplier evaluation to address the problem’s complexity. The first stage was to gather elements from the literature and interview five industry experts. Afterward, a comprehensive survey was conducted among 397 purchasing managers operating in the agri-food sector in Thailand to identify the precise components and sub-components that might influence the sustainability of supply chain supplier selection. Those risk variables were then categorized using factor analysis. In the second phase, FAHP was utilized to ascertain the weights and ranks of the sub-factors and factors of sustainability supply chain risk by considering the equivocal and uncertain decision-making environment. Subsequently, PROMETHEE II was suggested as a means of determining which supplier’s solution is most suitable for a practical implementation from among multiple candidates. Finally, the influence of the DM’s preferences for a major impact on the ranking that was received was investigated through sensitivity analysis using the Hybrid Sensitivity–Optimization Method for Agri-food Supplier Selection (HSOMASS).
This paper follows a structured framework. The subsequent section offers a succinct review of the literature evaluation, focusing on the central themes addressed in this study. In Section 3, the methodology is thoroughly described, including the research design, methods of data acquisition, and analytical approaches that were implemented to achieve the objectives of this study. The results obtained from this procedure and the subsequent sensitivity analysis are provided in Section 4. Section 5 combines the discussion and conclusion sections, analyzing the results considering the body of current literature, analyzing their implications. Finally, the most important lessons learned, and outlining possible directions for further investigation are provided in Section 6.
2. Literature Review
2.1. Agri-Food Supply Chain Definition
The agri-food supply chain (AFSC) typically comprises suppliers, growers, cooperatives, middlemen, transporters, processors, wholesalers, retailers, and final customers. It carries out a vitally important duty in providing those goods to satisfy consumer demands []. It also accomplishes business-to-business transactions and partnerships that are accountable for the effective production and distribution of fresh produce, guaranteeing that end users’ needs in terms of quality, quantity, and value are consistently met []. There are multiple definitions of the AFSC, each of which reflects a unique perspective and places emphasis on a distinct facet of the operation. For instance, the Food and Agriculture Organization (FAO) of the United Nations describes the AFSC as “a network of entities that bring food from “farm to fork”, including agricultural production, processing, distribution, consumption, and disposal” []. The above World Bank describes AFSC as “a complex system involving the production, processing, distribution, and consumption of food products, encompassing various stakeholders and activities”. From production to consumption, these definitions highlight the sequential phases, various parties involved, and complexity of the AFSC. The goal is to ensure a dependable, safe, and sustainable supply of agricultural goods to suit consumer nutritional demands while resolving economic, social, and environmental concerns. The AFSC is now addressing multiple uncertainties regarding its existence, encompassing factors such as consumer preferences and environmental considerations. AFSCs possess unique attributes that distinguish them from traditional supply chains and necessitate specialized managerial expertise. These distinct characteristics include hazards associated with supply and demand, weather-related instability, short life-cycle items, price volatility, and food safety and quality [,,].
At present, the AFSC encounters obstacles and risks such as ensuring quality and safety, maintaining traceability, promoting sustainability, and adapting to globalization. Food safety and quality control are crucial for the well-being of individuals. The demand for traceability is growing among consumers who seek to ascertain the provenance of their food products. Blockchain and RFID technologies are utilized to enhance traceability. Resource consumption, waste management, and the environmental impact of agriculture and food production are difficulties for the AFSC when products are sourced, processed, and distributed across different countries. The future of the AFSC relies heavily on advancements in technology and the implementation of environmentally friendly policies. Sustainable practices have evolved into an urgent concern for several industries, including the agri-food sector. To meet higher standards for sustainability, companies in the agri-food industry will have to set social and environmental goals along with their business goals in the coming years. Sustainable AFSCs are now considered essential for food security []. To provide food security and nutrition, food systems must be sustainable, resilient, and efficient. Otherwise, these factors could be compromised. Although well recognized, strategies for promoting sustainable transitions in AFSC remain to be discussed [].
2.2. Supply Chain Risk Factors
Business volatility has been a consequence of internationalization, outsourcing, shortened product lifetimes, intensifying competition, technological advancements, and new legislation over the past few decades. The supply chain (SC) has become more intricate and susceptible to natural disasters, terrorist attacks, and epidemics because of these modifications. As a result, supply chain risk management (SCRM) has attracted heightened attention from both scholars and practitioners in the industry. Given that SCRM involves the proactive identification, evaluation, and resolution of risks to enhance sustainable operations, its effective execution is critical in mitigating the adverse impacts of global supply chains on society, the economy, and the environment. SCRM improves collaboration, transparency, and supplier participation. These alterations promote responsible procurement, ethical labor, and environmental stewardship across the entire supply chain. According to statistical data, supply chain disruptions give rise to financial, environmental, and social hazards; therefore, proactive risk management is deemed a critical element. SCRM is a critical component of sustainability. To enhance the resilience, sustainability, and impact of their supply chains, organizations can implement comprehensive risk management strategies.
Supply chain risk encompasses potential interruptions, uncertainties, and vulnerabilities that can hinder the flow of products, services, and knowledge. Natural disasters, geopolitical crises, economic volatility, regulatory changes, supplier troubles, and technical failures are some of the possible causes. Business and supply chains have always had risk, and it has been hard to control supply chain risk, especially in the last 20 years []. Numerous researchers have carried out thorough reviews of the literature to better understand supply chain risk. The results have greatly increased the amount of information and knowledge about supply chain risk. Globalization of markets and changes in supply and demand have made supply chains more important and complicated, with risks in every part of the chain discussed []. Risks can be put into groups based on how they affect the business and the organization []. Additionally, it can be managed by considering the different types of risk [,], such as variables linked to the organization, the environment, or the supply chain that are hard to predict and influence the chain’s results [].
There are numerous ways to classify and categorize supply chain risks. According to Kleindorfer and Saad [], disruption risks refer to unforeseen and unplanned incidents that cause disturbances to the customary movement of materials and products along a supply chain. Operational risks refer to the inherent uncertainties that disrupt supply chains and have significant implications, such as uncertain costs, consumer demand, and availability. Tang [] separated disruption risks (e.g., political instability, storms) from operational risks (e.g., fluctuating consumer demand, supply unpredictability, and cost fluctuations). Song et al. [] separated risk factors into four groups: environmental, social, operational, and economic. The authors provided a comprehensive overview of the identified supply risk, considering it through the lens of the Triple Bottom Line (TBL), which encompasses social, environmental, and economic dimensions. Behzadi et al. [] divided supply chain risks in agriculture into two categories: (1) supply-side risks including weather variations, sickness, and insects have an impact on supply quantity and timeliness; and (2) demand-side problems have the biggest impact on market capacity and sales prices. However, [] grouped agriculture supply network risks into seven main categories: (1) weather; (2) biological and environmental factors (e.g., pests, diseases, and excessive rainfall); (3) logistical and infrastructure challenges; (4) market dynamics, including labor shortages and unpredictable customer demand; (5) policy and regulatory concerns, (6) economic considerations; and (7) operational and management aspects. Imbiri et al. [] classified the risks in agribusiness supply chains into three distinct categories, i.e., (1) risks linked to organizations, (2) risks related to the environment, and (3) risks related to networks. The logistical/infrastructural, financial, process, control, supply, and demand variables are examples of organizational risk factors. Environmental risk factors encompass both natural and man-made disturbances. Meanwhile, network-related risks encompass risks that arise from collaboration.
2.3. Sustainable Supply Chain Risks
Sustainable Supply Chain Risk Management (SSCRM) is a systematic and tactical approach that places sustainability at the forefront of supply chain risk identification, evaluation, and mitigation. SSCRM involves the identification and management of sustainable supply chain risks in collaboration with stakeholders to reduce overall vulnerability. This entails both operational and strategic components. These possible threats may hinder or cause disturbances in the transmission of data, products, and raw materials from the supplier to the consumer of the company. Kouvelis et al. [] defined SSCRM as managing demand, supply, and cost uncertainty. Carter and Rogers [] described supply chain risk management (SSCRM) as an organization’s ability to control supply chain risks related to finances, the environment, and society through interdependent planning and management. SSCRM is the acronym for supply chain and internal logistics risk management, with an emphasis on preventing external parties—especially upstream and downstream partners—from becoming involved. Tang and Musa [] defined SSCRM as the act of effectively and sustainably managing supply chain connections through collaborative interaction among participants. This approach includes environmental, social, and economic factors in supply chain risk management to reduce human, environmental, and financial impacts.
Sustainable supply chain risks refer to increased susceptibility caused by factors such as sustainability. Sourcing negatively affects economic, social, and environmental sustainability []. According to Hofmann et al. [], sustainability-related risks are conditions or events that may cause negative stakeholder reactions. Traditional risks may cause supply disruptions, but sustainability-related risks may cause strong stakeholder reactions that severely impact the firm. Supply chain sustainability problems could hurt businesses by lowering the worth of the brand, lowering sales, and lowering profits for shareholders. Hofman et al. [] divided sustainability-related risks into three groups: social issues, such as working conditions and pay; ecological issues, such as input- and output-related issues; and environmental risks, such as natural disasters, pollution, and greenhouse gas emissions. Furthermore, ethical business conduct was considered, such as corruption and business connections.
Organizations can ensure that suppliers adhere to sustainable practices by, among other things, identifying and assessing various sustainability-related hazards at the suppliers’ end and elaborating on the suppliers’ sustainability capabilities. The practices are designed to assist suppliers in building greater awareness and implementing more sustainable practices []. Hoejmose et al. [] stated that to reduce reputational risks, the entire organization and supply network must implement sustainable supply chain management techniques.
AFSC challenges and hazards are distinctive on account of seasonality, perishability, and dependence on natural resources, among other factors. Building resilience, ensuring food security, and maintaining sustainable operations in a dynamic and often unexpected environment are all dependent on agri-food firms’ ability to understand and manage these supply chain risk factors. To ensure the AFSC’s resilience and stability, these risks must be recognized and managed.
Nevertheless, there is still a lack of consistency in the literature on risks to supply chain sustainability from various disciplines. As a result, an integrated methodology for evaluating the sustainability risk of an industry’s supply chain when considering supplier selection is developed in this study. Various indicators sourced from the literature are utilized to quantitatively measure different dimensions of supply chain sustainability risk. This study examines the sustainability aspect from five perspectives, i.e., social, environmental, economic, technical, and institutional []. All supply chain participants could experience losses because of these five determined risks. A conceptual framework for this study is presented in Table 1, showcasing the characteristics of sustainability supply chain risk factors in the agri-food business context, covering the period from 2016 to 2023.

Table 1.
Identification of the risk factors of sustainability supply chain in agri-food business.
2.4. Supplier Selection Methods
Today’s competitive market necessitates innovative strategies to enhance quality, lower costs, meet deadlines, manage risks, and stay ahead of disruptions. The process of selecting a supplier is crucial since it entails assessing and selecting potential suppliers according to a range of standards to ensure the purchasing organization can achieve its requirements. The selection process aims to identify reliable, capable, and cost-effective suppliers. Optimal supplier selection is crucial for bolstering firm competitiveness, mitigating risks, and optimizing supply chain performance. Suppliers of superior quality help to achieve cost savings, minimize interruptions, and enhance customer satisfaction. On the other hand, insufficient or inappropriate suppliers might result in problems such as scarcity, delayed shipment, extra financial costs, and customer delivery disruptions [].
To develop supplier selection within a corporation, it is necessary to first establish the problem, proceed to establish the requirements for supplier selection, assess the qualifications of the vendors, and ultimately choose the most suitable suppliers. The quality of the supplier assessment and selection procedure is dependent on the success of the criterion selection []. Many businesses have implemented SSCM techniques to ensure their suppliers perform in an efficient manner that benefits society and the environment []. Previous research rarely examined supply risk from TBL perspectives when finding possible suppliers, resulting in inaccurate supply chain risk assessments and inadequate supplier selection []. As a result, this research aims to address the complicated sustainable supplier selection problem from a risk viewpoint.
Multi-Criteria Decision-Making (MCDM) techniques are frequently applied when evaluating suppliers and choosing the optimal option. By incorporating the preferences and interests of diverse stakeholders into quantitative and qualitative evaluations, these approaches enable DMs to identify the most effective solutions. Agrawal et al. [] and Cinnirella et al. [] contended that sustainable supplier selection by MCDM is critical for long-term performance in a sustainable and responsible business ecosystem. Effective supplier performance assessment is vital, and the process must consider each supplier’s unique qualities to enable a thorough evaluation. The MCDM technique not only fosters strong supplier relationships but also leads to reduced procurement costs, enhanced product quality, and expedited delivery schedules, thereby increasing the company’s competitive position in decision-making. Numerous manufacturing enterprises, including the agri-food sector, have encountered a substantial challenge in discerning the optimal supplier for acquiring input raw materials that offer numerous advantages to consumers. MCDM techniques aid DMs in determining the most favorable solutions through a comprehensive evaluation that incorporates both quantitative and qualitative evaluations while also considering the preferences and interests of different stakeholders.
MCDM comprises a range of different techniques, each based on its theoretical assumptions and used in specific applications. Each MCDM model has unique properties, and no MCDM method is completely superior to the others. According to Karakoc et al. [], the most often used techniques for sustainable supplier selection over five years (2018–2022) were TOPSIS, AHP, VIKOR, BWM, DEA, DEMATEL, and MULTIMOORA, together with their extensions. It has been discovered that very few studies have proposed a solution framework or utilized MCDM methodologies to address the agri-food supplier selection problem. Furthermore, as far as we are aware, no research has used MCDM approaches to the issue of selecting agri-food suppliers while taking sustainable related-risk factors into account in Thailand. Table 2 provides a comprehensive overview of MCDM techniques employed in addressing food supplier selection challenges in recent years.
Table 2.
MCDM approaches regarding food supplier selection issues.
According to the data presented in Table 2, AHP was the predominant approach utilized in the food industry throughout this decade for supplier selection. Additionally, TOPSIS was adopted as a hybrid method when combined with other techniques, which is in agreement with the investigation carried out by [], which discovered that over five years (2018–2023), the methods TOPSIS, AHP, VIKOR, BWM, DEA, DEMATEL, and MULTIMOORA, as well as their extensions, were the most commonly used in sustainable supplier selection in general business.
2.5. Research Gaps and Contributions
The aforementioned scholarly works examine the utilization of diverse indicators to quantify the sustainability risk of supply chains across their various aspects, in addition to the application of MCDM techniques to the selection of food suppliers. There is a body of literature about agri-food supplier selection that considers a variety of risk variables; however, there is a dearth of research that systematically identifies these risk factors based on three pillars (economic, environmental, and social) in the context of the Thai agri-food business and integrates them with a hybrid concept. Both types of research are lacking in practice. This study intends to fill this gap by providing a methodology that combines FAHP and PROMETHEE II to select suppliers, as well as factor analysis to identify risk factors.
Making use of this technique will result in the development of an all-encompassing plan for the reduction in risks in supply chains for agricultural and food products. An additional academic contribution is made by this research study in the form of the introduction of a Hybrid Sensitivity–Optimization Method for Agri-food Supplier Selection (HSOMASS). This method is a strategy that combines mixture design with an expert system. The goal of the HSOMASS is to improve resource efficiency, optimize the supplier selection process in the agri-food industry, and identify complicated variations by gaining an understanding of the deep relationship between these three phenomena. In addition to promoting sustainability and risk management, this method would assist companies in making strategic choices that may assist them in achieving long-term performance in the agri-food market. These decisions would be made possible via the identification of variable interdependencies and the optimization of strategies.
It is also possible that the suggested model and the findings of our research might assist firms in reevaluating possibilities and ensuring the sustainability of their supply chains via resource reconfiguration. This concerns the managerial implications of our study. The technique that has been provided is relevant not just to the agri-food industry, but also to other businesses that are comparable and operate in growing Asian markets as well as in those that are industrialized.
3. Research Methodologies
The framework used in this study combines statistical methodology with MCDM approaches. By incorporating these approaches, DMs can assess prospective outcomes thoroughly and consider sustainable implications when choosing suppliers, in addition to several supply chain risk variables that impact the agri-food manufacturing industry. By integrating statistical methods with MCDM, DMs are empowered to make informed and fair choices that consider multiple dimensions, such as technological, environmental, economic, social, and operational risks. MCDM simplifies supplier assessments by providing a structured framework for evaluating many factors simultaneously. This methodology combines quantitative and qualitative data, allowing for a thorough comparison of options. The use of a systematic approach in the evaluation process enhances transparency, makes it possible to verify results, and gives conclusions that are produced credibly and dependably.
This research constitutes an expansion upon a sequence of our prior publications. First, we emphasized the importance of considering additional and specific criteria when selecting sustainable suppliers for the Thai agri-food industry using a survey study. Factor analysis (FA) was then used to identify the risk variables and their sub-factors that support the supply chain’s sustainability, which, in turn, helps determine its efficacy. Ultimately, it was determined that it is essential to consider the sustainable development goals when choosing a supplier for the agri-food industry. This necessitates the consideration of numerous MCDM-based criteria and factors. Building upon prior investigations, this article concentrates on the implementation of MCDM to establish a system of universal criteria for supplier selection. While considering all conceivable risk factors, the development of the proposed methodologies and model will streamline the procedure for identifying sustainable suppliers. The Hybrid Sensitivity–Optimization Method for Agri-food Supplier Selection (HSOMASS) will also be used to confirm that the model is stable and that the results are still accurate when the order of certain criteria is changed.
3.1. Factor Analysis (FA)
Factor analysis (FA) is a quantitative technique used for statistical analysis employed to uncover and investigate the unobserved elements that contribute to the correlations between a set of variables. The basic purpose of FA is to simplify complex data structures by lowering the number of variables and uncovering the common components that contribute to the observed patterns. By identifying the common factors that contribute to observed patterns and reducing the number of variables, FA seeks to simplify complex data structures. More precisely, its application typically involves condensing an extensive collection of variables or items (X1, X2, X3, …, Xp) into a more manageable collection (F1, F2, F3, …, Fm) of underlying dimensions. These dimensions serve to clarify the interrelationships among the numerous items or variables. Strong correlations are observed between variables belonging to the same category, as opposed to variables that are assigned to distinct dimensions. As a result, “dimension reduction” is an alternative designation for this methodology. However, there are a few assumptions underlying the approach: (a) the variables under observation have a linear relationship; (b) multicollinearity does not exist; and (c) there is a genuine correlation between the variables and the factors [].
In general, FA comprises three stages: (a) factor extraction; (b) factor rotation to facilitate interpretation; and (c) factor labeling and interpretation, which is predicated on estimated factor loading values. Confirmatory factor analysis (CFA) and exploratory factor analysis (EFA) are the two principal types of FA. In contrast to CFA, which evaluates a certain factor structure based on prior knowledge or theory, EFA allows for the identification of factors without the use of any predetermined hypotheses. In consideration of this research, EFA was utilized to categorize supply risk determinants according to the linkages between them.
Regarding research validity, Kaiser [] developed the Kaiser–Meyer–Olkin analysis for determining probable commonality among each assessable criterion in investigated measurements (e.g., questionnaires). Consequently, the Kaiser–Meyer–Olkin examination score approaches 1 and there are more similarities between the criteria that can be used for evaluation, which means that the data collected are better for the FA method.
FA is a sophisticated statistical instrument that facilitates the identification of the underlying structure within complex datasets. Consequently, the FA approach is extensively employed in statistical measurements across a multitude of research disciplines to manage intricate analyses that incorporate complex factors []. This process simplifies data analysis and empowers DMs to make better-informed choices in various practical contexts and research undertakings. Research on supplier selection processes frequently employs FA to improve decision-making in practical situations [,,,,,,].
3.2. Methodology for Identifying Sustainable Supply Chain Risk Factors in Supplier Selection
The following section outlines the approach used to identify sustainable supply chain risk factors for supplier selection in the agri-food business in Thailand. The approach comprises the subsequent steps:
Step 1: This study investigates supplier selection and sustainable supply chain risk factors in the Thai agri-food industry, building upon previous research. Establishing a compilation of selection criteria and discerning pertinent factors, as illustrated in Table 1, comprises a total of 25 variables.
Step 2: To validate these aspects from Step 1 in a practical context, an extensive interview was carried out with the senior management teams of five agri-food enterprises. In doing so, two variables were excluded from the analysis due to their redundancy or relevance to other variables. The variable representing suppliers’ financial standing incorporates insufficient financial support, while the variable representing natural disasters and climate change includes inadvertent disasters.
Step 3: A questionnaire comprising 23 characteristics, validated by five experts from Step II, was subsequently created and distributed to 397 Thai agri-food manufacturers throughout Thailand. All sustainable supply chain risk criteria for supplier selection were assessed using a 5-point Likert scale from 1 (strongly disagree) to 5 (strongly agree), with higher values indicating greater risk.
Step 4: Data analysis from the questionnaires was divided into 2 parts, i.e., (1) general data analysis with percentages, mean, and standard deviation; and (2) using FA to group variables that impact sustainable supply chain risk factors for supplier selection (Supplementary Materials).
3.3. Determination of Criteria and Sub-Criteria Weights Using Fuzzy Analytical Hierarchy Process (FAHP)
The decision factors and sub-factors derived from the EFA conducted in Section 3.1 were used to develop a hierarchical model for supplier selection. The FAHP approach was adopted to estimate the weight of the elements and sub-criteria that influence supplier selection in the Thai agri-food business.
3.3.1. Triangular Fuzzy Number (TFN)
To handle ambiguous, imprecise, or uncertain real-world data, Lotfi Zadeh created fuzzy logic in 1965 []. Conventional binary logic systems could not process this information. By creating a fuzzy set and giving each object a continuous membership grade, Zadeh made it possible to reason in a more sophisticated way. A tilde (~) is used in the mathematical representation of fuzzy sets to signify continuity and flexibility. A triangular fuzzy number (TFN), as shown in Figure 1, is employed to denote a comprehensive fuzzy occurrence. A TFN is represented by the notation P = (l, m, n). The minimum and maximum possible values that characterize a complete fuzzy event are denoted by the parameters l, m, and n, respectively []. The membership function, denoted as is defined by Equation (1).
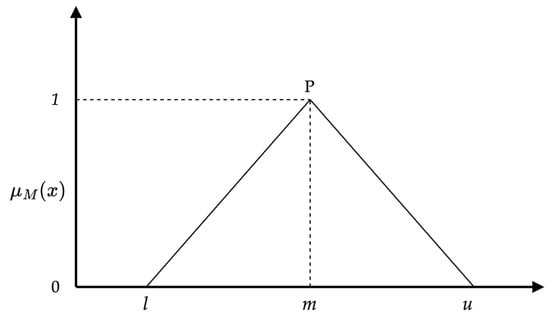
Figure 1.
Triangular fuzzy number.
Fuzzy numbers use membership functions with upper and lower bounds that have any value between 0 and 1 (TFN ∈ [0, 1]), while crisp values use binary logic. Fuzzy numbers can be uniform, triangular, trapezoidal, or other shapes, depending on the situation. Since TFNs are easy to compute, they are used in many practical applications [], including risk factor weight evaluation.
Because traditional MADM is unable to deal with imprecise information in the real world, it is not perfect for fine decision-making models. To solve this problem, a decision-making method known as fuzzy multiple attribute decision-making (FMADM) was created. This method incorporates fuzzy set theory for complex systems. FMADM is simple and well suited for qualitative and quantitative data.
3.3.2. Fuzzy Analytical Hierarchy Process
AHP aids individuals or groups in the formulation of complex decisions using a structured decision-making procedure by first breaking them down into a hierarchical structure and then assessing the relative relevance of various factors within that structure. The AHP, which was initially formulated by Thomas L. Saaty in the 1970s, has been subjected to extensive scrutiny, evaluation, and refinement ever since []. It is a systematic method for arranging and evaluating complicated judgments, based on mathematics and psychology []. AHP serves as a tool for making decisions that hierarchically rank the variables according to their respective importance. This method helps to create a coherent and well-organized framework that may be used to formulate a choice dilemma, express, and quantify its requirements, connect those requirements to overarching goals, and assess potential solutions. It incorporates both qualitative and quantitative factors into a methodical and organized approach to decision-making. AHP is extensively implemented across diverse disciplines such as business, engineering, environmental science, and healthcare, serving as a valuable tool for DMs seeking to assess and contrast intricate alternatives. Cinelli et al. [] stated that rankings are accomplished by the utilization of a variety of decision-making approaches that involve multiple factors. It was asserted that the AHP was the strategy that was utilized the most frequently in actual practice []. Within the context of pairwise comparisons, Saaty designed AHP to methodically evaluate quantitative and qualitative characteristics using an absolute scale that ranged from 1 to 9 [].
To resolve imprecise expert judgments utilizing fuzzy numbers, FAHP, a hybrid of fuzzy logic and AHP, was subsequently introduced []. FAHP approaches are frequently proposed in the literature. Moreover, the FAHP technique makes it possible to express uncertainty more precisely, which is important in complicated decision-making situations where precise values may not sufficiently account for the subjectivity that DMs possess. FAHP can also be used with other decision-making approaches, such as TOPSIS and PROMETHEE, to provide a more comprehensive approach.
There are several different ways to solve the MCDM problem using the FAHP-based structured model. Synthetic extension analysis, fuzzy least square, geometric mean, Mikhailov’s fuzzy preference programming, and two-stage logarithmic programming are all examples of such methods []. By utilizing the triangular membership function to represent pair fuzzy ratios, Buckley [] was the first to develop the method of least squares (subsequently the geometric mean method) for determining partial fuzzy priority. Triangular fuzzy numbers were integrated with Saaty’s AHP-based operation by [] in the context of quality function deployment programs. Through comparisons between the methods from different angles, Buyukozkan et al. [] analyzed the benefits and drawbacks of each. Singh and Sarkar [] implemented fuzzy Delphi to integrate group perspectives into their revision of Saaty’s hierarchical analysis method.
An extension analysis method was proposed by [] to compute crisp weights from the synthetic value ranges of pairwise comparison matrices. Eventually, Mikhailov [] suggested using fuzzy comparison matrices to create crisp weights through a fuzzy prioritization technique based on nonlinear optimization. By utilizing the membership functions of a TFN, pairwise comparisons of decision variables ranging from “Excellent” to “Very poor” were illustrated. The smallest, maximum, and apex values of the fuzzy number Mi are represented by the membership functions Mi = (mi1, mi2, mi3), i ∈ {1, 2, …, n} and mi1, mi2, mi3, respectively. The evaluation of the extent of each objective, denoted as gi, was conducted in accordance with Chang’s extent analysis approach []. Thus, the following symbols were utilized to represent the m extent analysis values for each object:
where are TFNs.
To determine the weight of an FAHP, Bozbura [] establishes several methodologies. The extension analysis method described by [] was used to transform fuzzy numbers into crisp numbers by intersecting two fuzzy numbers and a degree of possibility. The criterion weight for the supplier selection problem is determined in this research by applying Chang’s [] five-step FAHP approach. Below, the steps are outlined [,]:
Step 1: Calculating fuzzy synthetic extent for item i, as follows:
to obtain , perform fuzzy addition of m extent analysis values for a given matrix, s such that:
to calculate , add the numbers of in a fuzzy way so that:
Then, calculate the inverse of the vector in Equation (6):
Step 2: The following defines the degree of possibility that :
which can be equally defined as follows:
where Figure 2 depicts the highest intersection (point d) of and The values of and are required to distinguish between M1 and M2.
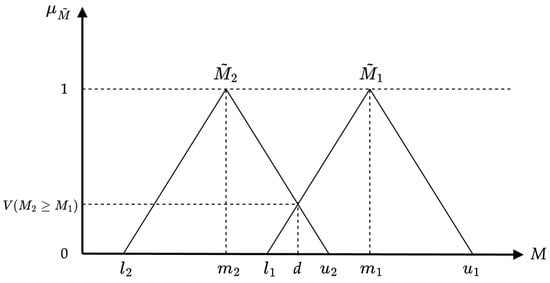
Figure 2.
The intersection of and .
Step 3: The extent to which a convex fuzzy number is superior to k convex fuzzy numbers, can be expressed as follows:
Step 4: The vector of weights is obtained by assuming that:
The weights vector, W′, is obtained from:
Step 5: Normalized weight vectors are calculated as follows:
Table 3 presents fuzzy linguistic concepts along with their Triangular Fuzzy Reciprocal Numbers (TFRNs) and TFNs, which are utilized for pairwise comparisons in the FAHP approach.
Table 3.
The triangular scale of the FAHP.
3.3.3. Consistency Ratio (CR)
It is essential to verify the consistency of the paired matrix results when utilizing the FAHP. The definitions of the terms consistency ratio (CR) and consistency index (CI) are as follows:
The symbol λmax represents the eigenvalue of the matrix, where n is the dimensions of the matrix. RI, however, represents the mean value of randomly developed weights.
The degree of deviation exhibited by the system from the consistent matrix is denoted by the consistency index. A CR value below 0.10 is deemed satisfactorily acceptable. When the CR exceeds this threshold, it indicates that the judgment matrix lacks coherence. The final step is to analyze the judgments to eliminate inconsistency. The RI value is presented in Table 4 in accordance with the size of its matrix.
Table 4.
RI for different matrix sizes.
3.4. Supplier Prioritization and Selection Using the PROMETHEE II Method
The Preference Ranking Organization Method for Enrichment Evaluation, or PROMETHEE, is an outranking strategy utilized to evaluate criteria through the integration of qualitative and quantitative approaches. Brans initially developed the concept in 1982, and Vincke and Brans further developed it in 1985 []. In it, each criterion and the preference structure through the implementation of various preference functions provide decision support after both the partial and complete ranking processes. The goal of this approach is to resolve a Pγ-type problem where a set of chosen alternatives needs to be prioritized. Up until the order is established, these options are further examined concerning each criterion, taking the DM’s degrees of preference into account. It extends the PROMETHEE approach to handle partial or inaccurate information in decision-making. PROMETHEE II is applicable in scenarios when there is insufficient or vague information regarding preferences. It does not need exact numerical data and can handle qualitative evaluations. The method compares options in pairs according to each criterion while taking the DM’s preferences into account. The DM evaluates each alternative’s relative dominance concerning a particular criterion.
PROMETHEE I (partial ranking) and PROMETHEE II (complete ranking) gained scholarly recognition in 1982 during a symposium on supplementary decision-making tools held at Laval University in Canada. Professor Brans and Mareschal improved PROMETHEE procedures over time, including PROMETHEE III (interval ranking) and PROMETHEE IV (continuous case). Successive algorithms included designation and continuous cases. In 1988, Mareschal and Brans developed the visualized GAIA interactive module, which gave a useful graphical representation of this technique. During the 1990s, both individuals developed two extension methods that achieved success: PROMETHEE VI, which represented the human brain; and PROMETHEE V, which incorporated segmentation constraints. Classical approaches such as PROMETHEE I and PROMETHEE II continue to be widely employed owing to their distinct applications [].
According to Veza et al. [], the industrial company was ranked by its strengths. Businesses were ranked using the PROMETHEE II technique according to a distinct set of skills that they developed specifically for the purpose of evaluation. Liu and Guan [] used the PROMETHEE II method to rate the quality of passenger train service. Theodorou et al. [] used the PROMETHEE II approach to investigate Cyprus’s energy supply. To find the best student in college, Fidlina et al. [] used the PROMETHEE II ranking method, which considers skills, performance, grades, and other factors. Govindan et al. [] employed the PROMETHEE approach to help an Indian food company choose a supplier while considering environmentally friendly considerations.
It is suggested that PROMETHEE is a flexible decision-making technique that relies on comparing options in pairs and aggregating preferences. Research and technological progress improve its strength, and more investigation of hybrid methods will expand its comprehension. In the current study, therefore, the PROMETHEE II approach hybridization with FAHP is utilized to ascertain the overall ranking of alternative suppliers for an agri-food industrial application while taking sustainable supply chain risk into account. The PROMETHEE II technique includes the following steps [].
Step 1: Normalize the decision matrix as follows:
where Xij is the alternative’s performance metric in relation to the j-th criterion; The equation can be reformulated for non-beneficial conditions as follows:
Step 2: Conduct pairwise evaluations to measure the differences between alternatives.
Step 3: Calculate the preference function using the following formulas, :
Step 4: Compute the aggregated preference function by assigning weights to each criterion as follows:
where Wj is the weight that indicates how important criterion j is in respect to other criteria.
Step 5: Identification of the “entering (negative) flow” and “leaving (positive) flow” as follows:
Leaving flow for an alternative
Entering flow for an alternative
where n is the number of alternatives involved; the “leaving flow” and the “entering flow” denote the degree to which a particular alternative is, respectively, “dominating” and being “dominated” by the other alternatives.
Step 6: Use the following equation to find the net outranking flow for alternative:
Step 7: Rank the choices according to φ(i) values, the best alternative being indicated by the highest number.
The flow diagram depicting the proposed hybrid methodologies, namely FA-FAHP-PROMETHEE II, for the selection of sustainable agri-food suppliers with a focus on supply chain risk is illustrated in Figure 3.
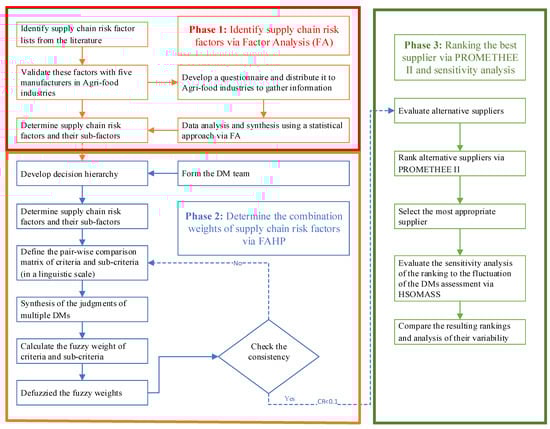
Figure 3.
The proposed hybrid methodologies of the research.
3.5. Sensitivity Analysis via Hybrid Sensitivity–Optimization Method for Agri-Food Supplier Selection (HSOMASS)
Sustainability and supply chain risk management are essential for system robustness and flexibility in the ever-changing agri-food industry. Sustainable suppliers are sought by companies. The hybrid method introduces a new way of thinking about supply chain risks. Sensitivity analysis is crucial in this situation because it shows how parameter changes impact hybrid model performance [,,,,]. This research uses sensitivity analysis for two purposes. First, it enables one to see how changes in each element affect hybrid strategy performance indicators, revealing the relative importance of each risk factor [,,]. Mixture design and expert system design ideas are employed to reveal changeable interconnections and collaborative effects to understand how the system reacts to supply chain risk variations. This study is unique in that it identifies key parameters and optimizes sustainable agri-food supplier selection by understanding their complex relationship.
The findings of this sensitivity study may guide DMs in the agri-food sector toward resilient, adaptable, and environmentally sustainable supply chain solutions. Sensitivity analysis is used to obtain insights beyond supplier selection to strengthen and maintain the agri-food industry []. The HSOMASS framework guides this investigation to overcome supplier selection restrictions. Our mission is to deliver insights that strengthen and maintain the agri-food industry via sensitivity analysis and optimization. In the ever-changing agri-food business, where risk management and sustainability are linked, supplier selection greatly influences supply chain flexibility and resilience. This work uses mixture design to provide a comprehensive sensitivity analysis of supply chain hazards due to their complexity. Mixture design’s ability to modify component ratios in a small experimental area is its main strength.
The hybrid methodology’s sensitivity is determined by creating a mixture design matrix with a unique mix of component proportions for each trial point. This rigorous examination allows us to determine each factor’s effects and their interrelationships and synergies [,]. As we study this unique strategy, we seek to provide agri-food industry DMs with information to make educated choices in complex supply chain dynamics. This undertaking requires sensitivity analysis using the mixture design to understand how the relative magnitudes of key factors affect sustainable agri-food supplier selection. The mixture design framework guides us toward robust and lasting solutions that meet the ever-changing needs of a sustainable and resilient AFSC as we begin our inquiry. Mixture design is useful, but it has limits that should be addressed when performing sensitivity analysis for agri-food supplier selection. Its preference for continuous variables makes it unsuitable for discrete or categorical factors. The complex dynamics of AFSCs may hinder the model’s usefulness by requiring the simultaneous examination of discrete and continuous components.
Another drawback of mixture design is the assumption of linearity between components and responses. The assumption may not match the physical system’s inherent non-linearities. Complex, non-linear relationships among parameters impacting the agri-food sector sustainable supplier selection may weaken the model’s prediction accuracy.
Extreme values or outliers in experimental data may also hinder mixture design. Skewed interpretations and inferior predictions may result from outliers disproportionately affecting model results. The heightened vulnerability to extreme values emphasizes the need for caution when interpreting results, particularly when data points deviate significantly from the mean. To create a robust Hybrid Sensitivity–Optimization Method for Agri-food Supplier Selection (HSOMASS), mixture design and expert system should be used to optimize resource usage. These approaches work together to maximize experimentation, distribute resources wisely, and maintain sensitivity analysis accuracy.
Mixture design’s ability to gradually change component ratios in a small experimental region matches HSOMASS’ resource efficiency goals. Mixture design allows the research team to find major patterns and interdependencies without many experimental rounds by effectively investigating ongoing factor proportion variations. This is important in the agri-food business because limited resources may need efficient and practical experimentation. Orthogonal arrays help optimize resources using mixture design and expert systems. Structured orthogonal arrays allow several components and their interactions to be studied in a few tests. Scientists may learn about the sensitivity of the agri-food supplier selection process without straining experimental capabilities by using this resource-efficient strategy.
HSOMASS synergizes mixture design and expert system strengths and mitigates their flaws. The hybrid method optimizes resource use by combining mixture design for continuous variables with an expert system for discrete components. By methodically and resource-efficiently investigating discrete and continuous changes, HSOMASS may give complete insights for selecting sustainable agri-food suppliers within practical constraints. HSOMASS prioritizes resource efficiency by carefully combining expert system and mixture designs, meeting agri-food industry needs. This hybrid technique reveals the possibilities of nuanced sensitivity analysis and emphasizes a commitment to gaining valuable insights without overusing resources.
The Hybrid Sensitivity–Optimization Method for Agri-food Supplier Selection (HSOMASS) signifies a pioneering effort to reshape the landscape of supplier selection within the intricate dynamics of the agri-food industry. Comprising a series of meticulously orchestrated steps, HSOMASS integrates the strengths of mixture and expert system designs, providing a nuanced understanding of the complex interplay between supply chain risks and sustainability goals. This innovative methodology unfolds systematically, designed to enhance resource efficiency, capture intricate variations, and ultimately optimize the selection of suppliers within the agri-food sector. As this transformative journey unfolds, each step of HSOMASS reveals a strategic progression towards attaining a resilient, adaptive, and sustainable agri-food supply chain. The overall and comprehensive approach of HSOMASS is outlined as follows:
Step 1: Determine the Major (Ma) and Minor (Mi) values of the weights assigned to criteria on both the coded () and natural levels (Wi).
Step 1a: Collect the entire Ma weight of criteria () for all possible simplex–lattice or simplex–centroid mixture designs to form the mixture design.
Step 1b: Assign the remaining weight of the Minor criteria () in order to modify their newly selected levels in accordance with the Ma criteria.
Step 2: Determine the adjusted Ma weight of the criteria in order to meet the constraint of .
Step 3: Determine the updated level of the Mi weight of criteria by utilizing , where 0 ≤ θ ≤ 1, and consider reevaluating the stipulation that the minimum weights of the Ma criteria must be significantly greater than the maximum weights of the Mi criteria.
Step 4: Iterate and converge during the execution of the Step 4 procedure. Upon accomplishment (θ∗), proceed to Step 5.
Step 5: Perform adaptive mixture design and calculate the modified Ma and Mi values of the weights of criteria as follows []:
Step 6: To conduct sensitivity analysis via the mixture design combined with the expert system, select the j-th treatment with difference (Δ) of the maximal and minimal coded levels of adjusted major weights () and the number of major weights of NMa meets the criteria below:
4. Results and Analysis
The accuracy of our model was confirmed in the agricultural food industry in Thailand. A questionnaire was developed based on a literature assessment and input from academics and specialists in the agri-food business and then distributed to 397 companies in Thailand. After that, sustainability supply chain risk categories were grouped using the main component approach of exploratory factor analysis (EFA). Finding a suitable supplier for a major Thai agri-food producer necessitated integrating EFA with FAHP and PROMETHEE II to examine the relative impact of sustainability supply chain risk factors in supplier evaluations. In the subsequent sections, the results were examined considering the various methodologies that were proposed.
4.1. Risk Factors and Sub-Factors for Supply Chain Sustainability in Supplier Evaluation
A 79.3% response rate was achieved with 315 completed questionnaires. Table 5 provides the respondents’ demographics.
Table 5.
Basic characteristics of the respondents.
The results from Table 5 suggest that based on the nature of their firms, most of the respondents are in the soft drinks and juices sector (51.8%), followed by the bakery and confectionery sector (35.2%). Regarding the number of employees or the size of the business, it is evident that most respondents were employed in medium-sized companies with a workforce ranging from 50 to 200 employees (73.3%). The respondents were mostly purchasing department managers (57.8%), followed by senior purchasing officers (36.5%). Most of them (30.8%) had worked for more than 10 to 15 years, and the percentage of those with more than 15 years’ experience was almost equal (30.2%).
Next, the relationships between supply chain risk factors were utilized to categorize them using EFA. The data analysis was performed using the IBM SPSS Statistics 29.0. Assumptions were examined using the Kaiser–Meyer–Olkin Measure of Sampling Adequacyn Measure of Sampling Adequacy (KMO) and Bartlett’s Test of Sphericity before implementing the method []. The survey data were suitable for factor analysis, as shown in Table 6, where the KMO value was 0.845. The hypothesis was examined by applying Bartlett’s Test of Sphericity, which provided the following results: χ2 =3643.314 and p-value < 0.0001. Thus, it was confirmed that the data were captured appropriately, as the null hypothesis (H0) was rejected.
Table 6.
KMO and Bartlett’s test.
Table 6 presents the estimations of variance in each variable provided by the extraction communalities for the 23 variables. Communalities represent the shared variance among components with specified variables. High values suggest that variables should be kept in the analysis because they fit the factor solution well. For effective factor analysis, communalities should be 0.4 or above []. The values of extraction communalities in Table 7 reveal that they all range from 0.481 to 0.848, which is significantly higher than the acceptable threshold of 0.4 or higher.
Table 7.
Communalities (23 items).
After extracting the factors, an EFA comprising 23 variables was utilized to classify the quantity of supply chain risk factors that were considered during sustainable supplier selection. A varimax rotation was performed on orthogonal axes. Eigenvalues larger than one were chosen during the 25th cycle of factor extraction, and six factors were retrieved from the scree plot diagram (refer to Figure 4). Table 8 highlights the six factors that have eigenvalues greater than one.
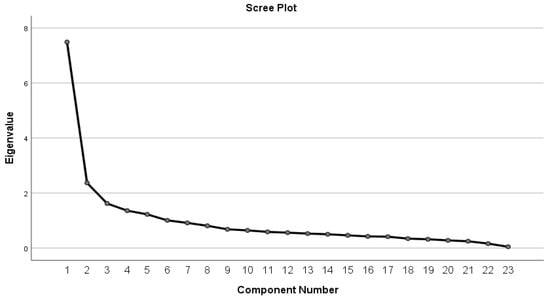
Figure 4.
A scree plot diagram.
Table 8.
Eigenvalues and extraction sums of squared loadings.
The total variance explained by these five criteria equals 65.542%. Table 8 provides a list of factors and their relevant sub-criteria that were obtained by factor loading from the analysis, and each of these six criteria were given their respective names as follows: Criterion 1 contains eleven items classified as “supply chain resilience and adaptability risk” (F1). Technological problems/out-of-date, ineffective methods or technology (F11), change/shift in consumer preference (F12), information sharing/communication system/lack of coordination/information sharing between supply chain actors (F13), disruptions or errors in production or delivery (F14), poor quality management system/insufficient output or quality at the source of supply (F15) and fluctuation in supply (F16) are intricately linked with F1.
Criterion 2 encompasses five variables that have been classified as “workforce safety compliance risk” (F2). These items include the sub-factors of administration of employee risk (F21), workplace safety risk (F22), improper tracking and traceability system (F23), food safety management certificates (F24), and occupational health and safety practices (F25). Criterion 3, denoted as “environmental sustainability and waste management risk” (F3), encompasses three key aspects: waste treatment management and pollution prevention/waste generation (F31), a low level of environmentally friendly technology (F32), and a low level of environmentally friendly material (F33) with low waste, indicating ease of recycling and reuse capability.
Criterion 4 has three elements categorized as “operational resilience and external disruption risk” (F4). These elements include transportation, energy, and communication costs (F41), demand fluctuations (F42), and natural disasters/climate change (F43). The five elements on Criterion 5 was labeled “strategic governance and compliance challenges” (F5) includes problems with strategic sourcing/planning and goals (F51), risk of policy failure (F52) and regulatory issues/standards (F53). Finally, “financial stability and market dynamics risk” (F6) was designated as Criterion 6. Its components are price fluctuation (F61), suppliers’ credit status (F62), exchange rates and interest rate policies (F63).
These criteria and their sub-criteria were then utilized to build into the proposed supplier selection model in the next phase. A summary of the variable members for each criterion and their factor loading is shown in Table 9.
Table 9.
Summary of variables in each criterion.
4.2. Data Analysis of FAHP
The weight of the criteria and sub-criteria was determined using the FAHP technique by taking the main criteria (F1 to F6) and their decomposition into 23 sub-criteria (F11, F12, …, F63) in Table 5, which were obtained from the FA. Consequently, the F1–F6 criteria constitute the top level of the hierarchical model, with the six criteria and sub-criteria forming the following level. Then, in accordance with Table 3, five DMs (E1, E2, E3, and E5) from the Canning and Preserving case company with over 20 years of experience in the business provided linguistic evaluations that facilitated the decision-making process. The determination of the local weights of the sub-criteria was performed utilizing FAHP. The weights of the criteria were multiplied by the group of weights of the sub-criteria once the local weights of the sub-criteria had been defined. The global values were acquired and subsequently utilized in this analysis to assess alternatives using PROMETHEE II in the subsequent stage.
After the decision hierarchy for the supplier selection problem for the case company was created and approved, as shown in Figure 5, the experts were asked to assess the supplier selection criteria’s relative importance weights on nine linguistic terms in relation to a fuzzy nine-level scale, as shown in Table 3. Every membership function in this scale is determined by TFN’s three parameters (l, m, u). The final pairwise comparison matrix was created by aggregating the experts’ individual fuzzy evaluations. The process of aggregating individual judgment matrices is essential to attain a collective consensus among DMs, as each matrix represents the viewpoint of a single DM. Following Buckley’s recommendation [], the geometric mean method was used to calculate the elements of the synthetic pairwise comparison matrix.
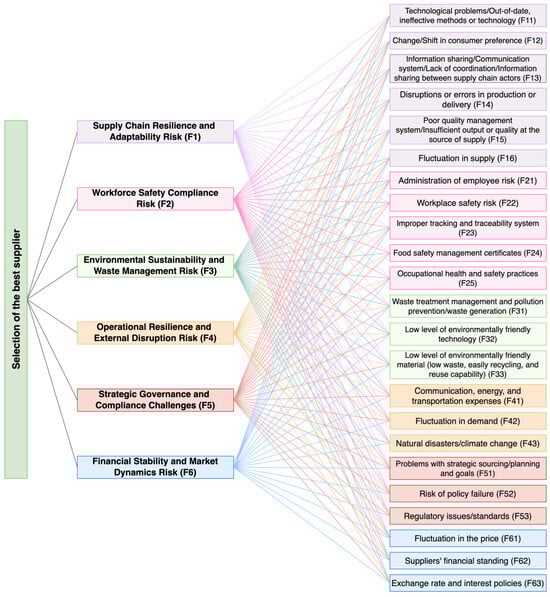
Figure 5.
The proposed criteria and sub-criteria for sustainable agri-food supplier selection.
Table 10, Table 11 and Table 12 display the pairwise comparison matrix, the non-fuzzy comparison matrix, and the normalized comparison matrix of the six primary dimensions. In accordance, the consistency ratio (CR) of the pairwise comparison was computed.
Table 10.
Expert relative opinion on main criteria.
Table 11.
A non-fuzzy comparison matrix of the main criteria.
Table 12.
Main criteria normalized comparison matrix.
Using pessimistic and optimistic values derived from the fuzzy comparison matrix [], the fuzzy number is transformed into a real number to ascertain the rating score CR. In Table 11, the non-fuzzy comparison matrix of the primary criteria is presented.
The outcome indicates that the CR is 0.099, which is below the threshold of 0.1. Since the pairwise comparison matrix is thus consistent, the results are deemed acceptable. As a result, the same process is applied to the calculation of other sub-criteria, and the consistency test results for each matric were all less than 10%. As such, the consistency in each matrix was acceptable. The results of the calculations for the local and global weights of all the criteria and sub-criteria derived from the FAHP model are displayed in Table 13. These weights will be used in the next phase of evaluating the supplier selection of the case company using the PROMETHEE II technique.
Table 13.
Final priorities of supply chain risk factors.
As shown in Table 13, the case company’s top three supplier selection evaluative criteria are as follows: risk associated with supply chain resilience and adaptability or F1 (0.3190), workforce safety compliance risk or F2 (0.2113), and risk associated with environmental sustainability and waste management or F3 (0.1809). On the contrary, financial stability and market dynamics risk or F6 (0.0711) is the least significant. The order of significance observed in the FAHP results aligns with the results obtained from the FA analysis conducted in Phase I.
Additionally, the results showed that the five most critical sub-factors in deciding which supplier to choose are waste treatment management and pollution prevention/waste generation or F31 (0.1272), technological issues such as old or ineffective methods or technology or F11 (0.1086), employee risk management or F21 (0.1076), changes in consumer preferences or F12 (0.0946), and communication, energy, and transportation costs or F41 (0.0744), respectively. Most of these sub-criteria belong to the first or second order of each critical criterion.
4.3. Data Analysis of PROMETHEE II
To deploy PROMETHEE II in the case company, the DMs, criteria, and suppliers are identified. A panel of five experts (E1, E2, E3, E4, E5) was asked to rank and assess four suppliers (S1, S2, S3, S4) using the six criteria (F1, F2, F3, F4, F5, F6) acquired from FA in phase I. During the PROMETHEE II phase, the same group of experts complete a third survey questionnaire to rank supplier measures on a scale of 1–10 regarding risk management. Table 14 constructs the normalized decision matrix using Equation (15). The calculation of the preference function (see Table 15) and the aggregated preference indices was carried out following Equations (16)–(18), respectively. The aggregated-preference indices were then used to determine the entering (negative) flow and leaving (positive) flow using Equations (19) and (20) as demonstrated in Table 16. Finally, the net outranking flow for all alternatives was estimated using Equation (21). Table 17 presents the conclusive findings.
Table 14.
The normalized decision matrix.
Table 15.
The preference function for every pair of alternatives.
Table 16.
Aggregated-preference indices.
Table 17.
The results of PROMETHEE II method with alternatives ranking.
The alternative suppliers are now ordered in descending order by net outranking flow values. It is evident that Supplier 4 option has the lowest value of −0.39 and Supplier 3 has the greatest value of 1.16. Specifically, Supplier 3 was regarded as the most advantageous alternative, whereas Supplier 1 was designated as the second-best option.
4.4. Sensitivity Analysis via HSOMASS
Integrating sustainability concepts with supply chain risk management has become essential in the dynamic agri-food business to maintain system resilience and adaptation. Hybrid approaches bring a new paradigm that incorporates varied supply chain risks as firms aim for sustainability. Sensitivity analysis is essential in this context since it shows how parameter changes affect hybrid model performance. This research uses sensitivity analysis for two purposes. First, it shows how changes in individual components affect hybrid strategy performance measures, revealing the relative importance of each risk factor. Second, mixture design and expert system design principles are used to reveal complex variable relationships and collaborative effects, enabling a full knowledge of how the system reacts to supply chain risk changes.
This study’s new approach identifies essential parameters and optimizes sustainable agri-food supplier selection by analyzing their intricate relationships. The Hybrid Sensitivity–Optimization Method for Agri-food Supplier Selection (HSOMASS) uses sensitivity analysis to improve decision-making and strengthen agri-food supply chains against changing obstacles and uncertainties. HSOMASS sensitivity analysis may help DMs understand how risk dimensions affect supplier selection. This strategy helps firms make strategic choices that promote sustainability, manage risks, and long-term performance in the agri-food market by revealing variable interdependencies and optimizing tactics.
4.4.1. Importance Criteria and Their Impact
When choosing sustainable agri-food suppliers, characteristics that support supply chain resilience, sustainability, and risk management are emphasized. Important and impactful selection factors are included in the following table. Each factor evaluates agri-food suppliers’ suitability, from their capacity to adjust to shocks and maintain worker safety to their environmental sustainability and financial stability. Organizations aiming to develop resilient and sustainable supply chains that can overcome problems and succeed must understand these characteristics and their effects on supplier selection choices.
Sustainable agri-food supplier selection requires examining providers’ robustness and adaptation to different risk scenarios to ensure supply chain resilience. This research uses sensitivity analysis across 12 scenarios to assess supplier performance under various risk situations. Mixture design and expert system design ideas were used to create these scenarios, which illustrate a range of agri-food supply issues and uncertainties. These scenarios reveal how suppliers handle various risk variables by methodically adjusting supply chain resilience, workforce safety compliance, environmental sustainability, operational resilience, strategic governance, and financial stability. These scenarios help DMs mitigate risks and improve AFSC sustainability by revealing the relative relevance of risk aspects and their effects on supplier selection results. We want to provide enterprises with actionable knowledge to make educated supplier selection choices in the face of increasing agri-food sector issues and uncertainties with our thorough sensitivity study.
Agri-food supply networks must prioritize supplier performance across risk scenarios to be resilient and sustainable. We weighted 12 scenarios across six supplier selection factors in this research. Mixture design and expert system design were used to create these scenarios, which include a variety of agri-food supply difficulties and uncertainties. By weighting scenarios across Supply Chain Resilience, Workforce Safety Compliance, Environmental Sustainability, Operational Resilience, Strategic Governance, and Financial Stability, we can assess supplier performance. Table 18 lists the weights for each scenario to help DMs evaluate supplier appropriateness and manage risks in the AFSC. This investigation seeks to uncover key supplier selection criteria and their effects on supply chain resilience and risk management.
Table 18.
Weights of the 12 scenarios across the six criteria from the HSOMASS.
Scenarios 1–3: These scenarios underscore the significance of supply chain resilience, workforce safety compliance, and environmental sustainability, respectively. Suppliers demonstrating strength in these areas exhibit higher rankings, emphasizing the importance of robustness, safety, and sustainability within the AFSC.
Scenarios 4–6: Operational resilience, strategic governance, and financial stability emerge as key determinants of supplier performance here. Suppliers with resilient operational strategies, transparent governance practices, and strong financial standing are preferred, highlighting adaptability, accountability, and financial health in supplier selection.
Scenarios 7–9: These scenarios explore the interplay of supply chain resilience, workforce safety compliance, and environmental sustainability. Sensitivity analysis reveals synergistic effects on supplier performance, indicating the need for integrated risk management and sustainability approaches.
Scenarios 10–12: Strategic governance, financial stability, and operational resilience play pivotal roles in shaping supplier rankings in these scenarios. Suppliers excelling in governance, financial management, and operational efficiency are favored, highlighting their ability to navigate challenges and seize opportunities.
Through sensitivity analysis across these scenarios, valuable insights into supplier performance dynamics and decision-making in sustainable agri-food supplier selection are gained. Understanding sensitivities inherent in each scenario enables organizations to develop targeted strategies for risk mitigation, enhancing supply chain resilience, and fostering partnerships with suppliers committed to sustainability and excellence.
4.4.2. Comparative Analysis with Alternative Scenarios
In comparing alternate situations, we examine supplier rank outcomes across 12 scenarios and six criteria. These rankings reveal AFSC supplier performance across risk parameters. A repeating pattern in rank results suggests supplier performance tendencies across situations. Suppliers score similarly across Supply Chain Resilience, Workforce Safety Compliance, Environmental Sustainability, Operational Resilience, Strategic Governance, and Financial Stability. Suppliers routinely score top or second in Supply Chain Resilience, suggesting a high capacity to tolerate disruptions and respond to market changes. Suppliers also rate lower in Workforce Safety Compliance, indicating they might enhance worker safety. This comparison research emphasizes the need of examining supplier performance across a variety of situations to understand their AFSC capabilities and weaknesses. DMs may make educated choices and adopt focused measures to improve supply chain resilience and manage risks via such analysis.
In Scenario 1, Supply Chain Resilience and Adaptability Risk (F1) is more important than Environmental Sustainability and Waste Management Risk (F3) and Workforce Safety Compliance Risk (F2). Scenario 2 has the same rank assignments but prioritizes Environmental Sustainability and Waste Management Risk (F3). Scenario 3, with similar rank assignments, prioritizes Supply Chain Resilience and Adaptability Risk (F1) above Environmental Sustainability and Waste Management Risk (F3). In Scenario 4, rank assignments (2, 4, 1, 3) emphasize Operational Resilience and External Disruption Risk (F4) above Financial Stability and Market Dynamics Risk (F6). Scenario 5 emphasizes Operational Resilience and External Disruption Risk (F4) with comparable rank allocations. Despite having the same rank assignments, Scenario 6 prioritizes Environmental Sustainability and Waste Management Risk (F3) and Strategic Governance and Compliance Challenges (F5) above Supply Chain Resilience and Adaptability Risk (F1).
Scenario 7 prioritizes Environmental Sustainability and Waste Management Risk (F3) and Strategic Governance and Compliance Challenges (F5) above Supply Chain Resilience and Adaptability Risk. Scenario 8 also prioritizes Environmental Sustainability and Waste Management Risk (F3) and Strategic Governance and Compliance Challenges (F5) above Supply Chain Resilience and Adaptability Risk (F1). Scenario 9, with ranks 1, 4, 2, 3, balances all requirements. Scenario 10 prioritizes supply chain adaptation and safety by emphasizing Supply Chain Resilience and adaptation Risk (F1) and Workforce Safety Compliance Risk (F2). Scenario 11, with identical objectives, prioritizes Supply Chain Resilience and Adaptability Risk (F1) and Workforce Safety Compliance Risk (F2) above Environmental Sustainability and Waste Management Risk (F3). Finally, Scenario 12 ranks Environmental Sustainability and Waste Management Risk (F3) and Strategic Governance and Compliance Challenges (F5) as key supplier selection concerns. These evaluations highlight the relevance of risk aspects and strategic goals when choosing agri-food suppliers, aiding business decision-making.
The sensitivity analysis helps explain agri-food supplier selection, notably how risk considerations are prioritized across scenarios. The approach prioritizes Financial Stability and Market Dynamics Risk (F6) differently. This element may be crucial, indicating a strategic emphasis on suppliers’ financial health and market flexibility. In contrast, other risk indicators may take priority if their weight is reduced, reflecting supply chain strategy goals.
Note the variation in the relevance of Environmental Sustainability and Waste Management Risk (F3). Some supplier selection scenarios emphasize environmental sustainability, while others downplay it, suggesting business principles or strategic goals. The balance between Operational Resilience and External Disruption Risk (F4) and Strategic Governance and Compliance Challenges (F5) is equally important. Governance and compliance are prioritized in certain circumstances above operational resilience and external disruption preparation. This shows that supplier selection choices are complex and need a diversified strategy that includes risk and strategic objectives.
5. Discussion and Managerial Insights
5.1. Discussion of the Obtained Results
To guarantee the safety of the product and reduce the negative effects on the environment, it is necessary to identify and control all potential risks inside the company and its supply chain. The current research included the sustainability idea in the supplier selection process to improve the AFSC’s ability to handle unexpected risks and interruptions, thereby reducing the occurrence of unsatisfied customers. According to [], the procurement process plays a vital and strategically important part in the company’s success. Therefore, it is crucial to precisely define the risk factors that may emerge throughout the cooperation, evaluation, and implementation of improvement efforts between the supplier and receiver. Previous studies on sustainable supplier selection mostly focused on the characteristics of the supply chain, paying little consideration to the supply risk as seen from the perspective of the Triple Bottom Line (TBL) []. This research examines the problem of choosing sustainable suppliers by considering the element of risk, specifically focusing on the Triple Bottom Line (TBL) framework. The theoretical framework for sustainable supplier selection includes the consideration of supply risk. This study uses factor analysis (FA) to detect and classify hazards in the process of selecting suppliers. In addition, it utilizes the FAHP and PROMETHEE II techniques to prioritize the eligible providers according to these risks.
The assessment and criteria for choosing vendors were established using survey-based research. This study consisted of 23 sub-criteria and six risk criteria. A decision was made to establish a hierarchical structure, and the FAHP technique was then used to ascertain the weights of the criteria. The PROMETHEE II technique was used to determine the most optimal option among several alternative providers, considering the weights assigned to the assessment criteria. This research investigated the risk variables linked to sustainable supply chains in 315 samples of agri-food enterprises located in Thailand. The EFA analysis identified a total of 23 variables and categorized them into six distinct components. Based on this study, it was found that the risk factor with the greatest impact, accounting for 13.683% of the observed variation, was “Supply Chain Resilience and Adaptability Risk (F1)”. The emergence of this issue as a significant concern for the agri-food sector’s sustainable supplier selection may be attributed to many causes. Currently, advancements in technology, manufacturing methods, and distribution channels all play a role in the continuous growth of the agri-food business. Failure to adopt and use technology may impede organizations’ ability to compete and fulfill customer demands. To ensure that products are delivered on time and that the supply chain operates well, it is essential to have flawless coordination and communication among all individuals involved. Technological advancement and innovation are considered highly effective solutions for minimizing risks associated with the AFSC [] and improving the overall performance of agri-food enterprises []. Lack of coordination or failure to share information may lead to operational inefficiencies, delays in delivery and manufacturing processes, and mistakes. Suppliers that implement efficient procedures and embrace technology improvements are better equipped to tackle market problems and take advantage of favorable situations. Consumer preferences in the agri-food business are ever-evolving, influenced by factors such as a heightened awareness of health, concerns about sustainability, and shifts in dietary habits. As a result, providers must possess the ability to quickly adapt and respond to changes in customer tastes to stay competitive and maintain their relevance in the market.
“Workforce Safety Compliance Risk (F2)” was discovered to be the second risk element in the Thai agri-food sector, explaining 13.380% of the observed variance. Food safety concerns have expanded dramatically due to major occurrences such as avian flu, mad cow disease, foot-and-mouth disease, chicken salmonella, dairy, berry, and olive oil contamination, and natural and industrial disasters []. Given the inherent risks in this sector involving machinery operations, manual labor, and diverse occupational hazards, ensuring worker safety is paramount to prevent accidents, and injuries, and maintain productivity. In addition, agri-food businesses must adhere to a multitude of laws on food safety, environmental preservation, and labor standards. Noncompliance may result in legal repercussions, penalties, and harm to the organization’s reputation. Emphasizing adherence to food safety and quality standards is critical, as any form of noncompliance can lead to product contamination, recalls, and damage to the organization or sector’s reputation. Suppliers with strong safety management systems offer a more reliable and stable supply chain, eliminating disruptions and ensuring operations. Ensuring workforce safety compliance is crucial for establishing a robust and enduring supply chain. Suppliers who have strong safety management systems are more likely to be part of a stable and dependable supply chain, which lowers the possibility of interruptions and guarantees business continuity. Organizations should therefore investigate the origins of fraud, implement supplier auditing to prevent fraudulent receipts of basic materials, and leverage technological advancements to oversee and trace products throughout the stages of manufacturing and distribution, evaluating the precision of labeling and promptly identifying malfunctions. To safeguard reputation, reduce losses, and avert recurrences, organizations ought to implement established protocols to identify the origins of contaminated products, canceling and returning supplies, and minimizing losses [].
“Environmental Sustainability and Waste Management Risk (F3)” was identified as the third critical risk criterion for supplier selection, explaining 10.617% of the observed variance. Suppliers who promote environmental sustainability are more likely to meet consumer demand while maintaining market competitiveness. Implementing resource-efficient methods, including water conservation, energy efficiency, and waste reduction, can reduce production costs, increase operational efficiency, and reduce environmental impact. Suppliers help to build a more sustainable supply chain by minimizing waste generation and maximizing resource consumption. Furthermore, suppliers who embrace sustainable practices are better positioned to reduce risks related to resource shortages, climate change, and regulatory uncertainty, guaranteeing supply chain continuity and economic resilience in the face of environmental difficulties. These findings also align with recent research by [,], providing congruence and reinforcing the significance of addressing these identified risk factors in the agri-food business.
The supply chain faces several risks, making it difficult to determine the most significant ones. Supply chain risk evaluation for supplier selection is necessary to mitigate higher risks. Proper evaluation and management of these issues are increasingly crucial. The FAHP approach is used to rate hazards, allowing supply chain enterprises to identify larger risks and take measures to mitigate them []. TFNs were employed to analyze ambiguities in linguistic data assessment. Due to the significant number of qualitative risk factors and sub-factors in supply chain evaluation, quantitative assessment is challenging. These fuzzy values could indicate the relative strength of each pair of network members [].
Based on the comprehensive analysis of 23 sub-criteria obtained via the FA method, the findings of this study indicate that the primary risk sub-criterion that significantly impacts the supplier selection process inside a canning and preserving case company is waste treatment management and pollution prevention/waste creation (F31). Preventing pollution and managing waste treatment are critical concerns in the agri-food sector owing to the considerable quantity of waste generated. Contamination of the air, water, and soil can result from inadequate waste management. Suppliers who implement efficient waste management strategies could mitigate environmental harm and guarantee adherence to regulatory requirements, thereby strengthening the sustainability of the supply chain. This research is corroborated by the findings of [], who discovered that ecological indicators on purchasing decisions were deemed to be more significantly impacted by the materials and waste component.
Technological challenges, including outdated or inefficient methods or technology (F11), constituted the second most crucial sub-factor. Modern AFSCs are significantly influenced by technology, which has profound effects on quality, efficiency, and safety. As suggested by [], AFSC may benefit from technologies such as Blockchain and RFID that facilitate monitoring and supply chain tracing, among other responsibilities. Suppliers that utilize technology that is obsolete or inefficient might encounter difficulties in adhering to quality standards, ensuring consistency, and controlling expenses. Improved overall performance, increased productivity, and decreased waste can result from suppliers’ investments in modern, efficient technology.
The third sub-factor identified for hazard risk was employee risk management (F21). Lack of specified personnel specifications, as well as poor skills and training, can lead to losses []. Suppliers that prioritize employee safety and well-being, such as training, safe working conditions, and labor laws, are more likely to contribute to a sustainable and responsible supply chain.
Likewise, it was discovered that the agri-food industry’s supplier selection process considers consumer preferences (F12) as one of the critical risk sub-criteria. Ecological concerns, health trends, and ethical issues are some of the driving forces for the continuous evolution of this industry. Suppliers with the ability to adjust to these shifts and provide raw materials or goods that suit customer tastes have a higher chance of being successful in the marketplace. Selecting suppliers who understand consumer trends minimizes the chance of falling behind in a market that is changing rapidly. Communication, energy, and transportation expenses (F41) were also discovered to be important risk variables in the agri-food sector, influencing suppliers’ competitiveness and overall cost structure, which was ranked fifth in importance. Suppliers with strong communication, energy, and transportation cost management capabilities can lower risks associated with cost variations and supply chain disruptions while providing more dependable service and competitive pricing. To strengthen the supply chain’s ability to withstand disruptions, businesses must be aware of and able to see the most common and serious issues that suppliers encounter. Maintaining operational continuity, preserving reputation, and enhancing overall supply chain resilience all depend on an understanding of and ability to mitigate supplier risk.
A crucial resolution to the supplier selection problem is also proposed in this study: the hybrid FAHP-PROMETHEE methodology combined with FA. The proposed technique enables DMs to efficiently rank supplier options and obtain valuable information for formulating supplier selection strategies. This is achieved through the utilization of the group decision-making process, which facilitates agreement on the ranking of alternative suppliers. This model takes into account the assessments and viewpoints of numerous DMs, whose organizational levels and management functions may vary. Efficiently and rationally, the FAHP was employed to ascertain the accurate weights of DMs. In conclusion, administrators of sustainable supply chains (SSCs) can utilize the proposed model to select the most appropriate sustainable suppliers, thereby reducing supply risk and uncertainty. Furthermore, through the implementation of a PROMETHEE II method and the integration of qualitative and quantitative criteria, the suggested model can aid SSC managers in developing a systematic framework to determine the most appropriate sustainable supplier for a given case company.
The generalizability of the proposed hybrid model for agri-food supplier selection is dependent upon its adaptability and efficacy in different contexts. The applicability of the model extends beyond the agri-food sector and encompasses diverse domains where risk management and supplier selection hold significant importance. By identifying risk factors in various sectors and industries, Factor Analysis can generate industry-specific assessments. The FAHP and PROMETHEE II methodologies offer a systematic framework for making decisions that are flexible enough to be applied in various situations. To ensure the efficacy and dependability of the model, it is critical to validate it in various contexts. The relevance and applicability of the model in diverse contexts can be guaranteed through the inclusion of stakeholders from various industries in its development and validation.
Additionally, sensitivity analysis was utilized to evaluate the performance of ranking suppliers under dynamic environmental conditions. This study concludes that the suggested model demonstrates robustness and strength. Moreover, this model can address various decision management issues, including the selection of production methods, maintenance strategies, and project management.
5.2. Managerial Implication
Supply chain sustainability concerns for supplier selection are vital to research in today’s dynamic world. This article analyzes how management systems affect risk perception, specifically with sustainable supplier selection, a future uncertainty. This study contributes to the limited research on the collaboration between supply chain suppliers and the implementation of standardized management systems. The investigation suggests that supply chain managers should incorporate overlooked risk indicators into their dynamic, sustainable, and crucial plans for manufacturing enterprises.
Supply chain disruptions were most significantly impacted by the risk factors of supply chain adaptability and resilience, according to research; workforce safety compliance risk was subsequently identified as the second most influential factor. Hence, it is imperative for entrepreneurs to contemplate and underscore these risks through the formation of cooperative alliances with suppliers and the execution of preventative measures. Organizations should also use new technology and innovation to streamline their operations and share information throughout the supply chain. Research suggests that concentrating on neglected hazards could enhance supply chain resilience and predict operational risk events [,].
To aid the organization in employing MCDM methodologies to resolve its supplier evaluation and selection challenges, a framework was developed as part of this research. An examination of potential resolutions was undertaken with due consideration for the distinctive industry demands of the Thai company operating in the agri-food sector, for which the methodologies of this study were customized. These are the fundamental differences between the aforementioned inquiries and those found in the literature.
Overall, the implementation emphasizes the importance of proactive risk management in sustainable supply chains and using advanced supplier selection methods. Integration of sustainability criteria into supplier evaluations and reduction in major risk factors can improve supply chain adaptation and resilience, enabling organizations to negotiate today’s complex business landscape [,,,].
6. Conclusions
This paper proposes many essential measures to include sustainability in supplier selection procedures and reduce supply chain vulnerabilities. Firstly, it suggests the creation of procedures to assess risks and work together with suppliers, employing models such as FAHP and PROMETHEE II to choose suppliers based on their level of risk. Additionally, it proposes the possibility of automating these processes using AI or algorithms. Using criterion optimization and FAHP, PROMETHEE II was found to be the most successful approach for making decisions. The organization should also stress how crucial it is to gather qualitative information on customer attitudes and update the assessment process to accurately identify risks.
Furthermore, threat management and sustainability can be enhanced through the incorporation of TBL into the supplier selection matrix. Furthermore, this study suggests that risk management protocols in the food industry should incorporate practical information and methodologies as well as research findings. Additionally, it is recommended that training and capacity-building programs be provided to internal personnel and external suppliers to enhance their understanding of sustainability principles and risk management. This research underscores the importance of consistently evaluating, overseeing, and enhancing processes for selecting sustainable suppliers. To cultivate an environment that values transparency and responsibility, it is imperative to involve essential stakeholders in initiatives related to risk management and sustainability, such as regulatory bodies, suppliers, employees, consumers, and suppliers. In conclusion, by implementing these recommendations, supply chain resilience could be strengthened, risks could be reduced, and sustainability outcomes could be optimized not only in the agri-food industry but also in other sectors.
6.1. Limitations
Similar to numerous other research endeavors, future investigations may aim at addressing certain limitations. Firstly, this study significantly depends on a single example, which restricts its capacity to be applied to a broader population. Subsequent investigations should incorporate a variety of cases. Additionally, the analysis exclusively concentrates on Thailand’s agri-food industry, possibly disregarding sector-specific intricacies. Expanding the inclusion of a wider array of sectors would enhance the level of relevance. Furthermore, the results are limited to Thailand and may not be directly applicable to countries with distinct circumstances. Moreover, this research ignores cross-cultural differences in supplier selection and risk assessments, which may influence supply chain decision-making.
In the hybrid approach, FA for supply chain risk factor identification and FAHP with PROMETHEE II for agri-food supplier selection are beneficial. Possible drawbacks should be considered. Initially, factor analysis requires an extensive amount of data, and data quality might alter outcomes. Secondly, FAHP and PROMETHEE II utilize DMs’ subjective opinions to weigh and prefer factors. Thirdly, the interpretation of the data obtained from FA and the FAHP-PROMETHEE II hybrid model might pose challenges, particularly for stakeholders who lack familiarity with these analytical techniques. Effective communication and a thorough explanation of the findings are crucial to guarantee comprehension and approval. Furthermore, the implementation of the hybrid approach necessitates substantial resources, including time, knowledge, and technology. Organizations must consider these resource requirements while determining whether to implement the model. It is important to exercise caution when extending the findings of this study to other contexts.
Finally, researchers need to be cognizant of and address any potential biases that may arise in the research design, data collection, and analysis to ensure accurate findings.
6.2. Scope of Further Study
Despite the fundamental nature of this research, substantial potential exists for additional advancements. To begin with, a more comprehensive examination of this research would be enlightening, including sectors such as automotive, healthcare, manufacturing, and technology. Additionally, examining the impact of substantial disruptions on suppliers and enterprises may contribute to the mitigation of risks and the improvement in resilience. It is also possible that future studies will investigate the impact that developing technologies have on the resilience of supply chains. Some examples of this study include investigations into the potential of Blockchain technology to increase traceability and transparency in the agri-food supply chain, as well as the application of traceability technologies to improve the source of agricultural goods in a way that is both sustainable and ethical.
In the context of supplier selection, it would be advantageous to investigate additional novel MCDM approaches or alternative forms of fuzzy set theory, such as intuitionistic fuzzy sets. The generalizability of the methodology could be further evaluated through empirical investigations in emerging economies. Finally, in addition to supplier selection, an examination of risk and uncertainty in logistics, inventory control, and distribution networks would enhance the overall resilience of the supply chain.
Supplementary Materials
The following supporting information can be downloaded at: https://www.mdpi.com/article/10.3390/math12101598/s1, File S1: Example of Questionnaire.
Author Contributions
Conceptualization, W.A. and P.L.; methodology, W.A. and P.L.; validation, W.A., P.L., W.C. and P.A.; formal analysis, W.A., P.L. and P.A.; investigation, W.A. and P.L.; data curation, W.A., P.L. and P.A.; writing—original draft preparation, W.A. and P.L.; writing—review and editing, W.A., P.L., W.C. and P.A.; visualization, P.A., W.A. and W.C.; project administration, W.A. and P.L. All authors have read and agreed to the published version of the manuscript.
Funding
P.A. expresses gratitude to the Faculty of Engineering, King Mongkut’s University of Technology North Bangkok, for supporting this research. For P.L., this work was supported by the Thammasat University Research Unit in Industrial Statistics and Operational Research and research funding from the Faculty of Engineering, Thammasat University. W.A. would like to express gratitude to the School of Science, King Mongkut’s Institute of Technology Ladkrabang for all support with this research. For W.C., this research was partially supported by Chiang Mai University.
Data Availability Statement
The data that support the findings of this study are available from the corresponding author, Walailak Atthirawong, upon request.
Acknowledgments
The authors would like to thank all experts for participating in this study by taking the time and sharing their expertise to contribute to scientific knowledge. We also would like to thank Amnuay Saengnoree from King Mongkut’s Institute of Technology Ladkrabang for his valuable comment on this manuscript’s outcomes and discussion.
Conflicts of Interest
The authors declare no conflicts of interest.
References
- Christopher, M. Logistics and Supply Chain Management Creating Value-Adding Networks, 3rd ed.; Pearson Education Limited: Harlow, UK, 2005. [Google Scholar]
- Burgess, K.; Singh, P.J.; Koroglu, R. Supply Chain Management: A Structured Literature Review and Implications for Future Research. Int. J. Oper. Prod. Manag. 2006, 26, 703–729. [Google Scholar] [CrossRef]
- Xiao, C.; Petkova, B.; Molleman, E.; van der Vaart, T. Technology uncertainty in supply chains and supplier involvement: The role of resource dependence. Int. J. Supply Chain Manag. 2019, 24, 697–709. [Google Scholar] [CrossRef]
- Olson, D.L.; Wu, D. Supply Chain Risk Management. In New Frontiers in Enterprise Risk Management; Olson, D.L., Wu, D., Eds.; Springer: Berlin/Heidelberg, Germany, 2008. [Google Scholar] [CrossRef]
- Tang, S. Perspectives in Supply Chain Risk Management. Int. J. Prod. Econ. 2006, 103, 451–488. [Google Scholar] [CrossRef]
- Mehralian, G.; Gatari, A.G.; Morakabati, M.; Vatanpour, H. Developing a suitable model for supplier selection based on supply chain risks: An empirical study from Iranian pharmaceutical companies. Iran. J. Pharm. Res. 2012, 11, 209–219. [Google Scholar] [PubMed]
- Carballo-Penela, A.; Mateo-Mantecon, I.; Alvarez, S.; Castromán-Diz, J.L. The Role of Green Collaborative Strategies in Improving Environmental Sustainability in Supply Chains: Insights from a Case Study. Bus. Strategy Environ. 2018, 27, 728–741. [Google Scholar] [CrossRef]
- Varma, S.; Wadhwa, S.; Deshmukh, S.G. Supply chain characteristics of the petroleum industry: The Indian context. South Asian J. Manag. 2007, 14, 107–122. [Google Scholar]
- Christopher, M.; Lee, H. Mitigating Supply Chain Risk Through Improved Confidence. Int. J. Phys. Distrib. Logist. Manag. 2004, 34, 388–396. [Google Scholar] [CrossRef]
- Kleindorfer, P.R.; Saad, G.H. Managing Disruption Risks in Supply Chains. Prod. Oper. Manag. 2005, 14, 53–68. [Google Scholar] [CrossRef]
- Walker, D.; Hampson, K.; Ashton, S. Developing an innovative culture through Relationship Based procurement systems. In Procurement Strategies: A Relationship—Based Approach; John Wiley & Sons, Inc.: Hoboken, NJ, USA, 2003; pp. 236–257. [Google Scholar]
- Claypool, E.G.; Norman, B.A.; Needy, K.L. Design for Supply Chain: An Analysis of Key Risk Factors. Ind. Eng. Manag. 2015, 4, 156–164. [Google Scholar] [CrossRef]
- Christopher, M. Logistics and Supply Chain Management, 5th ed.; Pearson: London, UK, 2016. [Google Scholar]
- FAO. The State of World Fisheries and Aquaculture 2020. In Sustainability in Action; FAO: Rome, Italy, 2020. [Google Scholar] [CrossRef]
- Deaton, B.J.; Deaton, B.J. Food security and Canada’s agricultural system challenged by COVID-19. Can. J. Agric. Econ. 2020, 68, 143–149. [Google Scholar] [CrossRef]
- Shahbaz, M.S.; Rasi, R.Z.R.; Ahmad, F. A novel classification of supply chain risks: Scale development and validation. J. Ind. Eng. Manag. 2019, 12, 201–218. [Google Scholar] [CrossRef]
- Blos, M.F.; Quaddus, M.; Wee, H.M.; Watanabe, K. Supply Chain Risk Management: A case study on the automotive and electronic industries in Brazil. Int. J. Supply Chain Manag. 2009, 14, 247–252. [Google Scholar] [CrossRef]
- Ganji, S.M.; Hayati, M. Identifying and Assessing the Risks in the Supply Chain. Mod. Appl. Sci. 2016, 10, 74. [Google Scholar] [CrossRef]
- Ho, W.; Zheng, T.; Yildiz, H.; Talluri, S. Supply chain risk management: A literature review. Int. J. Prod. Res. 2015, 53, 5031–5069. [Google Scholar] [CrossRef]
- Sodhi, M.S.; Son, B.G.; Tang, C.S. Researchers’ perspectives on supply chain risk management. Prod. Oper. Manag. 2012, 21, 1–13. [Google Scholar] [CrossRef]
- Thiruchelvam, S.; Tookey, J.E. Evolving Trends of Supplier Selection Criteria and Methods. Int. J. Automot. Mech. Eng. 2011, 4, 437–454. [Google Scholar] [CrossRef]
- Paam, P.; Berretta, R.; Heydar, M.; García-Flores, R. The impact of inventory management on economic and environmental sustainability in the apple industry. Comput. Electron. Agric. 2019, 63, 104848. [Google Scholar] [CrossRef]
- Nyamah, E.Y.; Jiang, Y.; Feng, Y.; Enchill, E. Agri-food supply chain performance: An empirical impact of risk. Manag. Decis. 2017, 55, 872–891. [Google Scholar] [CrossRef]
- Hsu, C.-C.; Kannan, V.R.; Tan, K.-C.; Keong, L.G. Information sharing, buyer-supplier relationships, and firm performance: A multi-region analysis. Int. J. Phys. Distrib. Logist. Manag. 2008, 38, 296–310. [Google Scholar] [CrossRef]
- Govindan, K.; Kaliyan, M.; Kannan, D.; Haq, A.N. Barriers analysis for green supply chain management implementation in Indian industries using analytic hierarchy process. Int. J. Prod. Econ. 2014, 147, 555–568. [Google Scholar] [CrossRef]
- Dias, G.C.; Hernandez, C.T.; Oliveira, U.R. Supply chain risk management and risk ranking in the automotive industry. Gest. Prod. 2020, 27, e3800. [Google Scholar] [CrossRef]
- World Bank Group. Thailand Rural Income Diagnostic: Challenges and Opportunities for Rural Farmers; World Bank: Bangkok, Thailand, 2022. [Google Scholar]
- Kumar, R.; Singh, R.K.; Shankar, R. Critical success factors for implementation of supply chain management in Indian small and medium enterprises and their impact on performance. IIMB Manag. Rev. 2015, 27, 92–104. [Google Scholar] [CrossRef]
- Gencer, C.; Gürpinar, D. Analytic Network Process in Supplier Selection: A Case Study in an Electronic Firm. Appl. Math. Model. 2007, 31, 2475–2486. [Google Scholar] [CrossRef]
- Yayla, A.Y.; Yildiz, A.; Özbek, A. Fuzzy TOPSIS Method in Supplier Selection and Application in the Garment Industry. Fibres Text. East. Eur. 2012, 20, 20–23. [Google Scholar]
- Guneri, A.F.; Yucel, A.; Ayyildiz, G. An integrated fuzzy-lp approach for a supplier selection problem in supply chain management. Expert Syst. Appl. 2009, 36, 9223–9228. [Google Scholar] [CrossRef]
- Dai, L.; Bai, S.; Yang, Z. An approach to selection of agricultural product supplier using pythagorean fuzzy sets. Math. Probl. Eng. 2020, 2020, 1816028. [Google Scholar] [CrossRef]
- Ali, M.R.; Nipu, S.A.; Khan, S.A. A decision support system for classifying supplier selection criteria using machine learning and random forest approach. Decis. Anal. 2023, 7, 100238. [Google Scholar] [CrossRef]
- Schoenherr, T.; Timmala, V.M.R.; Harrison, T.P. Assessing Supply Chain Risks with the Analytic Hierarchy Process: Providing Decision Support for the Offshoring Decision by a US Manufacturing Company. J. Purch. Supply Manag. 2008, 14, 100–111. [Google Scholar] [CrossRef]
- Drakaki, M.; Gören, H.G.; Tzionas, P. Supplier selection problem in fuzzy environment considering risk factors. In Proceedings of the 2019 12th International Conference on Developments in eSystems Engineering (DeSE), Kazan, Russia, 7–10 October 2019; pp. 784–788. [Google Scholar] [CrossRef]
- Chatterjee, K.; Zavadskas, E.K.; Tamošaitiene, J.; Adhikary, K.; Kar, S. A Hybrid MCDM Technique for Risk Management in Construction Projects. Symmetry 2018, 10, 46. [Google Scholar] [CrossRef]
- Başaran, B.; Çakir, S. Evaluation of food safety and halal criteria in supplier selection: An application in food sector with fuzzy COPRAS method. Int. Food Res. J. 2021, 28, 576–585. [Google Scholar] [CrossRef]
- Sabila, N.N.; Profita, A.; Sukmono, Y. The application of fuzzy FMEA and TOPSIS methods in agricultural supply chain risk management (Case Study: Kabupaten Paser). Tek. J. Sains Dan Teknol. 2022, 18, 23–35. [Google Scholar] [CrossRef]
- Wu, C.; Zou, H.; Barnes, D.A. Supply risk perspective integrated sustainable supplier selection model in the intuitionistic fuzzy environment. Soft Comput. 2023, 27, 15133–15151. [Google Scholar] [CrossRef]
- Banaeian, N.; Mobli, H.; Fahimnia, B.; Nielsen, I.E.; Omid, M. Green supplier selection using fuzzy group decision making methods: A case study from the agri-food industry. Comput. Oper. Res. 2018, 89, 337–347. [Google Scholar] [CrossRef]
- Büyükselçuk, E.Ç.; Tozan, H.; Vayvay, Ö. A multi-criteria decision-making approach for greenovative supplier selection. Int. J. Ind. Eng. Theory Appl. Pract. 2022, 29, 283–301. [Google Scholar]
- Wu, T.; Backhurst, J.; Chidambaram, V. A model for inbound supply risk analysis. Comput. Ind. 2006, 57, 350–365. [Google Scholar] [CrossRef]
- Wu, C.; Barnes, D. A dynamic feedback model for partner selection in agile supply chains. Int. J. Oper. Prod. Manag. 2012, 32, 79–103. [Google Scholar] [CrossRef]
- Chai, J.; Liu, J.N.K.; Ngai, E.W.T. Application of decision-making techniques in supplier selection: A systematic review of literature. Expert Syst. Appl. 2013, 40, 3847–4272. [Google Scholar] [CrossRef]
- Awasthi, A.; Govindan, K.; Gold, S. Multi-tier sustainable global supplier selection using a fuzzy AHP-VIKOR based approach. Int. J. Prod. Econ. 2018, 195, 106–117. [Google Scholar] [CrossRef]
- Pourmehdi, M.; Paydar, M.M.; Asadi-Gangraj, E. Reaching sustainability through collection center selection considering risk: Using the integration of Fuzzy ANP-TOPSIS and FMEA. Soft Comput. 2021, 25, 10885–10899. [Google Scholar] [CrossRef]
- Hamidi, J.K.; Shahriar, K.; Rezai, B.; Rostami, J.; Bejari, H. Risk assessment based selection of rock TBM for adverse geological conditions using Fuzzy-AHP. Bull. Eng. Geol. Environ. 2010, 69, 523–532. [Google Scholar] [CrossRef]
- Polat, G. Subcontractor selection using the integration of the AHP and PROMETHEE methods. J. Civ. Eng. Manag. 2016, 22, 1042–1054. Available online: https://journals.vgtu.lt/index.php/JCEM/article/view/1960/1576 (accessed on 15 March 2024). [CrossRef]
- Mangan, J.; Christopher, M. Management development and the supply chain manager of the future. Int. J. Logist. Manag. 2005, 16, 178–191. [Google Scholar] [CrossRef]
- Lambert, D.M.; Cooper, M.C. Issues in Supply Chain Management. Ind. Mark. Manag. 2000, 29, 65–83. [Google Scholar] [CrossRef]
- Food and Agriculture Organization. World Livestock: Transforming the Livestock Sector through the Sustainable Development Goals; Food and Agriculture Organization of the United Nations: Rome, Italy, 2018. [Google Scholar]
- Ahumada, O.; Villalobos, J.R. Application of planning models in the agri-food supply chain: A review. Expert Syst. Appl. 2009, 195, 1–20. [Google Scholar] [CrossRef]
- Guan, G.F.; Dong, Q.L.; Li, C.H. Risk Identification and Evaluation Research on F-AHP Evaluation Based Supply Chain. In Proceedings of the 2011 IEEE 18th International Conference on Industrial Engineering and Engineering Management, Changchun, China, 3–5 September 2011; pp. 1513–1517. [Google Scholar] [CrossRef]
- Septiani, W.; Marimin, I.; Herdiyeni, Y.; Haditjaroko, L. Method and Approach Mapping for Agri-food Supply Chain Risk Management: A literature review. Int. J. Supply Chain Manag. 2016, 5, 51–64. [Google Scholar]
- Buttriss, J.L. Food Reformulation: The Challenges to the Food Industry. Proc. Nutr. Soc. 2013, 72, 61–69. [Google Scholar] [CrossRef] [PubMed]
- Bilali, H.E.; Callenius, C.; Strassner, C. Food and nutrition security and sustainability transitions in food systems. Food Energy Secur. 2019, 8, e00154. [Google Scholar] [CrossRef]
- Zsidisin, G.A.; Henke, M. (Eds.) Revisiting Supply Chain Risk; Springer: Cham, Switzerland, 2019. [Google Scholar] [CrossRef]
- Micheli, G.J.L.; Cagno, E.; Zorzini, M. Supply risk management vs supplier selection to manage the supply risk in the EPC supply chain. Manag. Res. News. 2008, 31, 846–866. [Google Scholar] [CrossRef]
- Harland, C.; Brenchley, R.; Walker, H. Risk in supply networks. J. Purch. Supply Manag. 2003, 9, 51–62. [Google Scholar] [CrossRef]
- Norrman, A.; Jansson, U. Ericsson’s proactive supply chain risk management approach after a serious sub-supplier accident. Int. J. Phys. Distrib. Logist. 2004, 34, 434–456. [Google Scholar] [CrossRef]
- Peck, H. Drivers of supply chain vulnerability: An integrated framework. Int. J. Phys. Distrib. Logist. Manag. 2005, 35, 210–232. [Google Scholar] [CrossRef]
- Juttner, U.; Peck, H.; Christopher, M. Supply chain risk management: Outlining an agenda for future research. Int. J. Logist. Res. Appl. 2003, 6, 197–210. [Google Scholar] [CrossRef]
- Song, W.; Ming, X.; Liu, H.C. Identifying critical risk factors of sustainable supply chain management: A rough strength-relation analysis method. J. Clean Prod. 2017, 143, 100–115. [Google Scholar] [CrossRef]
- Behzadi, G.; O’Sullivan, M.J.; Olsen, T.L.; Zhang, A. Agribusiness supply chain risk management: A review of quantitative decision models. Omega 2018, 79, 21–42. [Google Scholar] [CrossRef]
- Imbiri, S.; Rameezdeen, R.; Chileshe, N.; Statsenko, L. Risk propagation and resilience in the agribusiness supply chain: A systematic literature review. J. Agribus. Dev. Emerg. Econ. 2022. [Google Scholar] [CrossRef]
- Kouvelis, P.; Chambers, C.; Wang, H. Supply chain management research and production and operations management: Review, trends, and opportunities. Prod. Oper. Manag. 2006, 15, 449–469. [Google Scholar] [CrossRef]
- Carter, C.R.; Rogers, D.S. A framework of sustainable supply chain management: Moving toward new theory. Int. J. Phys. Distrib. Logist. Manag. 2008, 38, 360–387. [Google Scholar] [CrossRef]
- Tang, O.; Musa, S.N. Identifying risk issues and research advancements in supply chain risk management. Int. J. Prod. Econ. 2011, 133, 25–34. [Google Scholar] [CrossRef]
- Christopher, M.; Mena, C.; Khan, O.; Yurt, O. Approaches to managing global sourcing risk. Int. J. Supply Chain Manag. 2011, 16, 67–81. [Google Scholar] [CrossRef]
- Hofmann, H.; Busse, C.; Bode, C.; Henke, M. Substainability-related supply chain risks: Conceptualization and management. Bus. Strategy Environ. 2014, 23, 160–172. [Google Scholar] [CrossRef]
- Gouda, S.K.; Saranga, H. Sustainable supply chains for supply chain sustainability impact of sustainability efforts on supply chain risk. Int. J. Prod. Res. 2018, 56, 5820–5835. [Google Scholar] [CrossRef]
- Hoejmose, S.U.; Roehrich, J.K.; Grosvold, J. Is doing more doing better? The relationship between responsible supply chain management and corporate reputation. Ind. Mark. Manag. 2014, 43, 77–90. [Google Scholar] [CrossRef]
- Choirun, A.; Santoso, I.; Astuti, R. Sustainability risk management in the Agri-food supply chain: Literature review. IOP Conference Series. Earth Environ. Sci. 2020, 475, 012050. [Google Scholar] [CrossRef]
- Nurfitriani, E.A.; Dania, W.A.P.; Arif Hidayat, A. Risk facor for sustainable supply chain management (SSCM): A systematic review. Adv. Food Sci. Sustain. Agric. Agroind. Eng. 2023, 19–32. [Google Scholar]
- Leong, C.; Viskin, T.; Stewart, R. Tracing the Supply Chain: How Blockchain Can Enable Traceability in the Food Industry. 2018. Available online: https://www.scribd.com/document/444601327/Accenture-Tracing-Supply-Chain-Blockchain-Study-PoV-pdf (accessed on 15 March 2022).
- Maulida, D.L.; Andriani, D.W.; Muhaimin, A.W.; Setiawan, B.; Maulidah, S. Risk Analysis of Indonesian Mango Sustainable Supply Chain or Singapore Market. Habitat 2022, 33, 263–275. [Google Scholar] [CrossRef]
- Wijaya, D.S.; Widodo, D.S. Evaluation Supplier Involve on Food Safety and Halal Criteria using Fuzzy AHP: A Case Study in Indonesia. J. Tek. Ind. 2022, 23, 67–78. [Google Scholar] [CrossRef]
- Ikinci, M.; Tipi, T. Food supplier selection in the catering industry using the analytic hierarchy process. Food Sci. Technol. 2022, 42, e48420. [Google Scholar] [CrossRef]
- Zandi, P.; Rahmani, M.; Khanian, M.; Mosavi, A. Agricultural Risk Management Using Fuzzy TOPSIS Analytical Hierarchy Process (AHP) and Failure Mode and Effects Analysis (FMEA). Agriculture 2020, 10, 504. [Google Scholar] [CrossRef]
- Radzi, R.F.; Saidon, I.M.; Ghani, N.A. Risk Management in Food Supply Chains by Japanese Food Companies in Malaysia. Int. J. Bus. Manag. Econ. Res. 2016, 7, 778–787. [Google Scholar]
- Montgomery, S.C.; Martin, R.J.; Guppy, C.; Wright, G.C.; Tighe, M.K. Farmer knowledge and perception of production constraints in Northwest Cambodia. J. Rural Stud. 2017, 56, 12–20. [Google Scholar] [CrossRef]
- Waqas, U.; Abd Rahman, A.; Ismail, N.W.; Kamal Basha, N.; Umair, S. Influence of supply chain risk management and its mediating role on supply chain performance: Perspectives from an agri-fresh produce. Ann. Oper. Res. 2023, 324, 1399–1427. [Google Scholar] [CrossRef] [PubMed]
- Das, S.; Myla, A.Y.A.; Barves, A.; Kumar, A.; Sahu, N.C.; Muduli, K.; Luthra, S. Systematic assessment of multi-dimensional risk factors for sustainable development in food grain supply chains: A business strategic prospective analysis. Bus. Strategy Environ. 2023, 32, 5536–5562. [Google Scholar] [CrossRef]
- Kuizinaite, J.; Morkunas, M.; Volkov, A. Assessment of the Most Appropriate Measures for Mitigation of Risks in the Agri-food Supply Chain. Sustainability 2023, 15, 9378. [Google Scholar] [CrossRef]
- Chen, T.; Yu, S. Study on the risk level of food production enterprise based on TOPSIS method. Food Sci. Technol. 2022, 42, e29721. [Google Scholar] [CrossRef]
- Rathore, R.; Thakkar, J.J.; Jha, J.K. A quantitative risk assessment methodology and evaluation of food supply chain. Int. J. Logist. Manag. 2017, 28, 1272–1293. [Google Scholar] [CrossRef]
- Ali, I.; Arslan, A.; Khan, Z.; Tarba, S.Y. The role of industry 4.0 technologies in mitigating supply chain disruption: Empirical evidence from the Australian food processing industry. IEEE Trans. Eng. Manag 2022, 1–11. [Google Scholar] [CrossRef]
- Horita, A. Farming for survival and rice for investment: The intersection of Japanese aid and Cambodian development. Asia Pac. Viewp. 2016, 57, 232–243. [Google Scholar] [CrossRef]
- Cariappa, A.A.; Acharya, K.K.; Adhav, C.A.; Sendhil, R.; Ramasundaram, P. COVID-19 induced lockdown effects on agricultural commodity prices and consumer behaviour in India—Implications for food loss and waste management. Socio-Econ. Plan. Sci. 2022, 82, 101160. [Google Scholar] [CrossRef]
- Levy, D.L. International sourcing and supply chain stability. J. Int. Bus. Stud. 1995, 26, 343–360. [Google Scholar] [CrossRef]
- Rezaei, J.; Davoodi, M.; Tavasszy, L.; Davarynejad, M. A multiobjective model for lot-sizing with supplier selection for an assembly system. Int. J. Logist. Res. Appl. 2016, 19, 125–142. [Google Scholar] [CrossRef]
- Wu, C.; Gao, J.; Barnes, D. Sustainable partner selection and order allocation for strategic items: An integrated multi-stage decision making model. Int. J. Prod. Res. 2023, 61, 1076–1100. [Google Scholar] [CrossRef]
- Agarwal, R.; Nishad, A.K.; Agrawal, A.; Husain, S. Evaluation and Selection of a Green and Sustainable Supplier by Using a Fuzzy ARAS Mathematical Modeling. New Math. Nat. Comput. 2023, 19, 831. [Google Scholar] [CrossRef]
- Cinnirella, V.; Carpitella, S.; Coco, A.; Frangiamore, D.D.M.; de Geronimo, R.P. Sustainable Suppliers Evaluation in the Waste Management Sector: The Case of a Leading Sicilian Enterprise; Ilieva, S., Ed.; IFAC-Papers OnLine; Elsevier B.V.: Amsterdam, The Netherlands, 2022; pp. 66–71. [Google Scholar]
- Karakoç, Ö.; Memiş, S.; Sennaroglu, B. A Review of Sustainable Supplier Selection with Decision-Making Methods from 2018 to 2022. Sustainability 2024, 16, 125. [Google Scholar] [CrossRef]
- Banaeian, N.; Nielsen, I.E.; Mobli, H.; Omid, M. Green Supplier Selection in Edible oil Production by a Hybrid Model Using Delphi Method and Green Data Envelopment Analysis (GDEA). Manag. Prod. Eng. Rev. 2014, 5, 3–8. [Google Scholar] [CrossRef]
- Banaeian, N.; Mobli, H.; Nielsen, I.E.; Omid, M. Criteria definition and approaches in green supplier selection—A case study for raw material and packaging of food industry. Prod. Manuf. Res. 2015, 3, 149–168. [Google Scholar] [CrossRef]
- Ramlan, R.; Bakar, E.M.N.E.A.; Mahmud, F.; Ng, H.K. The Ideal Criteria of Supplier Selection for SMEs Food Processing Industry. MATEC Web Conf. 2016, 7, 05006. [Google Scholar] [CrossRef]
- Govindan, K.; Kadziński, M.; Sivakumar, R. Application of a novel PROMETHEE-based method for construction of a group compromise ranking to prioritization of green suppliers in food supply. Omega 2017, 71, 129–145. [Google Scholar] [CrossRef]
- Yazdani, M.; Chatterjee, P.; Zavadskas, E.K.; Zolfani, S.H. Integrated QFD-MCDM framework for green supplier selection. J. Clean. Prod. 2017, 142, 3728–3740. [Google Scholar] [CrossRef]
- Tavana, M.; Yazdani, M.; Di Caprio, D. An application of an integrated ANP–QFD framework for sustainable supplier selection. Int. J. Logist. Res. Appl. 2017, 20, 254–275. [Google Scholar] [CrossRef]
- Miranda-Ackerman, M.A.; Azzaro-Pantel, C.; Aguilar-Lasserre, A.A. A green supply chain network design framework for the processed food industry: Application to the orange juice agrofood cluster. Comput. Ind. Eng. 2017, 109, 369–389. [Google Scholar] [CrossRef]
- Tian, Z.P.; Zhang, H.-Y.; Wang, J.-Q.; Wang, T.-L. Green Supplier Selection Using Improved TOPSIS and Best-Worst Method Under Intuitionistic Fuzzy Environment. Informatica 2018, 29, 773–800. [Google Scholar] [CrossRef]
- Wang, C.N.; Nguyen, V.T.; Thai, H.T.N.; Tran, N.N.; Tran, T.L.A. Sustainable supplier selection process in edible oil production by a hybrid fuzzy analytical hierarchy process and green data envelopment analysis for the SMEs food processing industry. Mathematics 2018, 6, 302. [Google Scholar] [CrossRef]
- Lau, H.; Nakandala, D.; Shum, P.K. A business process decision model for fresh-food supplier evaluation. Bus. Process Manag. J. 2018, 24, 716–744. [Google Scholar] [CrossRef]
- Jiang, M.; Yang, L.; Zhao, X. Research on risk management of fresh agricultural products supply chain based on fuzzy analytic hierarchy process. Int. J. Asian Soc. Sci. 2019, 9, 516–524. [Google Scholar] [CrossRef]
- Nie, S.; Liao, H.; Wu, X.; Xu, Z. Green Supplier Selection with a Continuous Interval-Valued Linguistic TODIM Method. IEEE Access 2019, 7, 124315–124328. [Google Scholar] [CrossRef]
- Ramos, M.O.; da Silva, E.M.; Lima-Júnior, F.D. A fuzzy AHP approach to select suppliers in the Brazilian food supply chain. Production 2020, 30, e20200013. [Google Scholar] [CrossRef]
- Nguyen, N.B.; Lin, G.-H.; Dang, T.T. A Two Phase Integrated Fuzzy Decision Making Framework for Green Supplier Selection in the Coffee Bean Supply Chain. Mathematics 2021, 9, 1923. [Google Scholar] [CrossRef]
- Khan, A.U.; Ali, Y. Sustainable supplier selection for the cold supply chain (CSC) in the context of a developing country. Environ. Dev. Sustain. 2021, 23, 13135–13164. [Google Scholar] [CrossRef]
- Yazdani, M.; Pamucar, D.; Chatterjee, P.; Torkayesh, A.E. A multi-tier sustainable food supplier selection model under uncertainty. Oper. Manag. Res. 2022, 15, 116–145. [Google Scholar] [CrossRef]
- Leong, W.Y.; Wong, K.Y.; Wong, W.P. A New Integrated Multi-Criteria Decision-Making Model for Resilient Supplier Selection. Appl. Syst. Innov. 2022, 5, 8. [Google Scholar] [CrossRef]
- Ada, N. Sustainable Supplier Selection in Agri-Food Supply Chain Management. Int. J. Math. Eng. Manag. Sci. 2022, 7, 115–130. [Google Scholar] [CrossRef]
- Çaloğlu Büyükselçuk, E.; Sarı, Y.C. The Best Whey Protein Powder Selection via VIKOR Based on Circular Intuitionistic Fuzzy Sets. Symmetry 2023, 15, 1313. [Google Scholar] [CrossRef]
- Çevik, A.D. Fuzzy Trapezoidal DEMATEL Method for Criteria Weights in Supplier Selection: A Case Study of Ice Cream Producer. Intraders Int. Acad. J. 2023, 6, 97–118. [Google Scholar] [CrossRef]
- Hair, J.F.J.; Anderson, R.E.; Tatham, R.L.; Black, W.C. Multivariate Data Analysis, 4th ed.; Prentice Hall: Saddle River, NJ, USA, 1995. [Google Scholar]
- Kaiser, H.F. An index of factorial simplicity. Psychometrika 1974, 39, 31–36. [Google Scholar] [CrossRef]
- Ruscio, J.; Roche, B. Determining the Number of Factors to Retain in an Exploratory Factor Analysis Using Comparison Data of a Known Factorial Structure. Psychol. Assess. 2012, 24, 282–292. [Google Scholar] [CrossRef] [PubMed]
- Sinrat, S.; Atthirawong, W. Integrated Factor Analysis and Fuzzy Analytic Network Process (FANP) Model for Supplier Selection Based on Supply Chain Risk Factors. Res. J. Bus. Manag. 2015, 9, 106–123. [Google Scholar] [CrossRef]
- Tak, K.; Mak, T.K.; Nebebe, F. Factor Analysis and Methods of Supplier Selection. Int. J. Supply Chain. Manag. 2016, 5, e230741413. Available online: https://core.ac.uk/download/pdf/230741413.pdf (accessed on 15 March 2024).
- Öztürk, D. Factors that Influence the Supplier Selection of Manufacturing Businesses. J. Res. Bus. Manag. 2017, 4, 18–24. [Google Scholar]
- He, X.; Zhang, J. Supplier Selection Study under the Respective of Low-Carbon Supply Chain: A Hybrid Evaluation Model Based on FA-DEA-AHP. Sustainability 2018, 10, 564. [Google Scholar] [CrossRef]
- Urbaniak, M.; Zimon, D.; Madzik, P.; Šírová, E. Risk factors in the assessment of suppliers. PLoS ONE 2022, 17, e0272157. [Google Scholar] [CrossRef]
- Wahyuningsih, T.; Ristono, A.; Muhsin, A. The application of factor analysis (FA) in evaluating supplier selection criteria in PT. Wijaya Karya Beton Tbk and ranking suppliers using integration of analytical hierarchy process (AHP) and adaptive ratio assessment (ARAS). Tech. Rom. J. Appl. Sci. Technol. 2022, 4, 11–17. [Google Scholar] [CrossRef]
- Yuniarti, R. Green Supplier Analysis on Entrepreneur Students. J. Career Entrep. 2023, 2, 29–43. [Google Scholar] [CrossRef]
- Zadeh, L.A. Fuzzy Sets. Inf. Control. 1965, 8, 338–353. [Google Scholar] [CrossRef]
- Gupta, V.K.; Massanet, S.; Vemuri, N.R. Novel construction methods of interval-valued fuzzy negations and aggregation functions based on admissible orders. Fuzzy Sets Syst. 2023, 473, 108722473. [Google Scholar] [CrossRef]
- Yeh, C.H.; Deng, H. A practical approach to fuzzy utilities comparison in fuzzy multicriteria analysis. Int. J. Approx. Reason. 2004, 35, 179–194. [Google Scholar] [CrossRef]
- Saaty, T.L. Fundamentals of Decision Making and Priority Theory; RWS Publications: Pittsburgh, PA, USA, 2001. [Google Scholar]
- Saaty, T.L. Decision making with the analytic hierarchy process. Int. J. Serv. Sci. 2008, 1, 83–98. [Google Scholar] [CrossRef]
- Cinelli, M.; Coles, S.R.; Kirwan, K. Analysis of the potentials of multi criteria decision analysis methods to conduct sustainability assessment. Ecol. Indic. 2014, 46, 138–148. [Google Scholar] [CrossRef]
- Podgórski, D. Measuring operational performance of OSH management system—A demonstration of AHP-based selection of leading key performance indicators. Saf. Sci. 2015, 73, 146–166. [Google Scholar] [CrossRef]
- Saaty, T.L. The Analytic Hierarchy Process: Planning, Priority Setting, Resource Allocation; RWS Publications: Pittsburgh, PA, USA, 1980. [Google Scholar]
- Govindan, K.; Khodaverdi, R.; Vafadarnikjoo, A. Intuitionistic fuzzy based DEMATEL method for developing green practices and performances in a green supply chain. Expert Syst. Appl. 2015, 42, 7207–7220. [Google Scholar] [CrossRef]
- Kabir, G.; Hasin, M.A.A. Evaluation of Customer Oriented Success Factors in Mobile Commerce Using Fuzzy AHP. J. Ind. Eng. Manag. 2011, 4, 361–386. [Google Scholar] [CrossRef]
- Buckley, J.J. Fuzzy hierarchical analysis. Fuzzy Sets Syst. 1985, 17, 223–247. [Google Scholar] [CrossRef]
- Kwong, C.K.; Bai, H. A fuzzy AHP approach to the determination of importance weights of customer requirements in quality function deployment. J. Intell. Manuf. 2002, 13, 367–377. [Google Scholar] [CrossRef]
- Büyüközkan, G.; Kabraman, C.; Ruan, D. A fuzzy multi-criteria decision approach for software development strategy selection. Intern. Int. J. Gen. Syst. 2004, 33, 259–280. [Google Scholar] [CrossRef]
- Singh, P.K.; Sarkar, P. A Framework based on fuzzy Delphi and DEMATEL for sustainable product development: A case of Indian automotive industry. J. Clean. Prod. 2020, 246, 118991. [Google Scholar] [CrossRef]
- Chang, D.Y. Applications of the extent analysis method on fuzzy AHP. Eur. J. Oper. Res. 1996, 95, 649–655. [Google Scholar] [CrossRef]
- Mikhailov, L. Fuzzy analytical approach to partnership selection in formation of virtual enterprises. Omega 2002, 30, 393–401. [Google Scholar] [CrossRef]
- Bozbura, F.; Beskese, A.; Kahraman, C. Prioritization of human capital measurement indicators using fuzzy AHP. Expert Syst. Appl. 2007, 32, 1100–1112. [Google Scholar] [CrossRef]
- Efe, B. An integrated fuzzy multi criteria group decision making approach for ERP system selection. Appl. Soft Comput. 2016, 38, 106–117. [Google Scholar] [CrossRef]
- Boutkhou, O.; Hanine, M.; Tikniouine, A.; Agouti, T. Multi-criteria Decisional Approach of the OLAP Analysis by Fuzzy Logic: Green Logistics as a Case Study. Arab. J. Sci. Eng. 2015, 40, 2345–2359. [Google Scholar] [CrossRef]
- Anagnostopoulos, K.P.; Gratziou, M.; Vavatsikos, A.P. Using the fuzzy analytic hierarchy process for selecting wastewater facilities at prefecture level. Eur. Water 2007, 19, 15–24. [Google Scholar]
- Amiri, M.; Kazemi, A.; Sadaghiani, J.S.; Yaghoubi, A.; Mashatzadegan, H. Developing and Solving a New Model for the Location Problems: Fuzzy-Goal Programming Approach. J. Appl. Sci. 2009, 9, 1344–1349. [Google Scholar] [CrossRef]
- Rafi, S.; Yu, W.; Akbar, M.A.; Alsand, A.; Gumaei, A. Prioritization based taxonomy of DevOps security challenges using PROMETHEE. IEEE Access 2017, 8, 105426–105446. [Google Scholar] [CrossRef]
- Veza, I.; Celar, S.; Peronja, I. Competences-based comparison and ranking of industrial enterprises using PROMETHEE method. Procedia Eng. 2015, 100 (Suppl. C), 445–449. [Google Scholar] [CrossRef]
- Liu, P.; Guan, Z. Evaluation Research on the Quality of the Railway Passenger Service Based on the Linguistic Variables and the Improved PROMETHEE-II Method. J. Comput. 2009, 4, 265–270. [Google Scholar] [CrossRef]
- Theodorou, S.; Florides, G.; Tassou, S. The use of multiple criteria decision making methodologies for the promotion of RES through funding schemes in Cyprus, A review. Energy Policy 2010, 38, 7783–7792. [Google Scholar] [CrossRef]
- Fadlina; Sianturi, L.T.; Karim, A.; Mesran; Siahaan, A.P.U. Best Student Selection Using Extended Promethee II Method. Int. J. Recent Trends Eng. Res. 2017, 3, 21–29. [Google Scholar]
- Montajabiha, M. An extended PROMETHE II multi-criteria group decision making technique based on intuitionistic fuzzy logic for sustainable energy planning. Group Decis. Negot. 2016, 25, 221–244. [Google Scholar] [CrossRef]
- Karasneh, S.; Moqbel, S. Priority-Based Decision Model for Rehabilitation of Water Networks Using FAHP. Water Conserv. Manag. 2024, 8, 37–46. [Google Scholar]
- Demircan, B.G.; Yetilmezsoy, K. A Hybrid Fuzzy AHP-TOPSIS Approach for Implementation of Smart Sustainable Waste Management Strategies. Sustainability 2023, 15, 6526. [Google Scholar] [CrossRef]
- Cheng, H.; Zheng, S.; Feng, J. A Fuzzy Multi-Criteria Method for Sustainable Ferry Operator Selection: A Case Study. Sustainability 2022, 14, 6135. [Google Scholar] [CrossRef]
- Phung, L.X.; Do, T.; Tran, P.; Nguyen, T.K. Development of a fuzzy-AHP system to select the printing method for polycaprolactone (PCL)-based scaffolds. J. Adv. Manuf. Technol. 2022, 121, 5971–5990. [Google Scholar] [CrossRef]
- Abdel-Basset, M.; Gamal, A.; Teleb, S.S. Intelligent fuzzy decision-making system of afforestation in new cities: A case study of the New Administrative Capital, Egypt. Intell. Syst. Appl. 2022, 14, 200085. [Google Scholar] [CrossRef]
- Pandey, A.K.; Alsolami, F. Malware analysis in web application security: An investigation and suggestion. Int. J. Adv. Comput. Sci. Appl. 2020, 11, 191–201. [Google Scholar] [CrossRef]
- Ghadernejad, S.; Jafarpour, A.; Ahmadi, P. Application of an integrated decision-making approach based on FDAHP and PROMETHEE for selection of optimal coal seam for mechanization; A case study of the Tazareh coal mine complex, Iran. Int. J. Min. Geo-Eng. 2019, 53, 15–23. [Google Scholar]
- Menekşe, A.; Camgöz Akdağ, H. Information Technology Governance Evaluation Using Spherical Fuzzy AHP ELECTRE. Lect. Notes Netw. Syst. 2022, 308, 757–765. [Google Scholar]
- Kosamia, N.; Sanchez, A.; Rakshit, S. Multi-criteria decision analysis of succinic acid production using hesitant fuzzy analytical hierarchy process. Ind. Crops Prod. 2023, 206, 117620. [Google Scholar] [CrossRef]
- Ben Abdallah, C.; El-Amraoui, A.; Delmotte, F.; Frikha, A. A Hybrid Approach for Sustainable and Resilient Farmer Selection in Food Industry: Tunisian Case Study. Sustainability 2024, 16, 1889. [Google Scholar] [CrossRef]
- Gulcimen, S.; Aydogan, E.K.; Uzal, N. Robust Multicriteria Sustainability Assessment in Urban Transportation. J. Urban Plan. Dev. 2023, 149, 04023010. [Google Scholar] [CrossRef]
- Aungkulanon, P.; Atthirawong, W.; Sangmanee, W.; Luangpaiboon, P. Fuzzy Techniques and Adjusted Mixture Design-Based Scenario Analysis in the CLMV (Cambodia, Lao PDR, Myanmar and Vietnam) Subregion for Multi-Criteria Decision Making in the Apparel Industry. Mathematics 2023, 11, 4743. [Google Scholar] [CrossRef]
- Meyers, L.S.; Gamst, G.; Guarino, A.J. Applied Multivariate Research: Design and Interpretation; Sage Publications Inc.: Thousand Oaks, CA, USA, 2013. [Google Scholar]
- Kara, E.M.; Oktay, F.S.U. Supplier risk assessment based on best-worst method and K means clustering: A case study. Sustainability 2018, 10, 1066. [Google Scholar] [CrossRef]
- Zhao, G.; Liu, S.; Lopez, C.; Lu, H.; Elgueta, S.; Chen, H.; Mileva, B. Blockchain technology in agri-food value chain management: A synthesis of applications, challenges and future research directions. Comput. Ind. 2019, 109, 83–99. [Google Scholar] [CrossRef]
- Apostolopoulos, N.; Ratten, V.; Petropoulos, D.; Liargovas, P.; Anastasopoulou, E. Agri-food sector and entrepreneurship during the COVID-19 crisis: A systematic literature review and research agenda. Strateg. Change 2021, 30, 159–167. [Google Scholar] [CrossRef]
- Bachev, H. Framework for Assessing Efficiency of Farms and Agrarian Organisations. MPRA Pap. 2012, 40136. Available online: https://mpra.ub.uni-muenchen.de/40136/ (accessed on 15 March 2024). [CrossRef]
- Wagner, S.M.; Bode, C. An empirical examination of supply chain performance along several dimensions of risk. J. Bus. Logist. 2008, 29, 307–325. [Google Scholar] [CrossRef]
- Moeinzadeh, P.; Hajfathaliha, A. A Combined Fuzzy Decision Making Approach to Supply Chain Risk Assessment. World Acad. Sci. Int. J. Ind. Manuf. Eng. 2009, 3, 1631–1647. [Google Scholar]
- Paliwoda, B.; Matuszak-Flejszman, A.; Ankiel, M. The Impact of Environmental Indicators on Consumer Purchase Decisions for Food Products. Sustainability 2024, 16, 1834. [Google Scholar] [CrossRef]
- Khan, S.; Kaushik, M.K.; Kumar, R.; Khan, W. Investigating the barriers of blockchain technology integrated food supply chain: A BWM approach. Benchmarking Int. J. 2023, 30, 713–735. [Google Scholar] [CrossRef]
- Becker, K.; Smidt, M. A risk perspective on human resource management: A review and directions for future research. Hum. Resour. Manag. Rev. 2016, 26, 149–165. [Google Scholar] [CrossRef]
- Ritchie, B.; Brindley, C. Supply chain risk management and performance: A guiding framework for future development. Int. J. Oper. Prod. Manag. 2007, 27, 303–322. [Google Scholar] [CrossRef]
- Manuj, I.; Mentzer, J.T. Global supply chain risk management strategies. Int. J. Phys. Distrib. Logist. Manag. 2008, 38, 192–223. [Google Scholar] [CrossRef]
- Pagell, M.; Wu, Z. Building a more complete theory of sustainable supply chain management using case studies of 10 exemplars. J. Supply Chain Manag. 2009, 45, 37–56. [Google Scholar] [CrossRef]
- Ahi, P.; Searcy, C. A comparative literature analysis of definitions for green and sustainable supply chain management. J. Clean. Prod. 2013, 52, 329–341. [Google Scholar] [CrossRef]
- Hsieh, C.-C.; Chen, S.-L.; Huang, C.-C. Investigating the Role of Supply Chain Environmental Risk in Shaping the Nexus of Supply Chain Agility, Resilience, and Performance. Sustainability 2023, 15, 15003. [Google Scholar] [CrossRef]
Disclaimer/Publisher’s Note: The statements, opinions and data contained in all publications are solely those of the individual author(s) and contributor(s) and not of MDPI and/or the editor(s). MDPI and/or the editor(s) disclaim responsibility for any injury to people or property resulting from any ideas, methods, instructions or products referred to in the content. |
© 2024 by the authors. Licensee MDPI, Basel, Switzerland. This article is an open access article distributed under the terms and conditions of the Creative Commons Attribution (CC BY) license (https://creativecommons.org/licenses/by/4.0/).