Article

Height Prediction of Water-Conducting Fracture Zone in Jurassic Coalfield of Ordos Basin Based on Improved Radial Movement Optimization Algorithm Back-Propagation Neural Network

School of Civil Engineering, Central South University, Changsha 410075, China
*
Author to whom correspondence should be addressed.
Mathematics 2024, 12(10), 1602; https://doi.org/10.3390/math12101602
Submission received: 16 April 2024 / Revised: 15 May 2024 / Accepted: 16 May 2024 / Published: 20 May 2024

Abstract

:
The development height of the water-conducting fracture zone (WCFZ) is crucial for the safe production of coal mines. The back-propagation neural network (BP-NN) can be utilized to forecast the WCFZ height, aiding coal mines in water hazard prevention and control efforts. However, the stochastic generation of initial weights and thresholds in BP-NN usually leads to local optima, which might reduce the prediction accuracy. This study thus invokes the excellent global optimization capability of the Improved Radial Movement Optimization (IRMO) algorithm to optimize BP-NN. The influences of mining thickness, coal seam depth, working width, and hard rock lithology proportion coefficient on the height of WCFZ are investigated through 75 groups of in situ data of WCFZ heights measured in the Jurassic coalfield of the Ordos Basin. Consequently, an IRMO-BP-NN model for predicting WCFZ height in the Jurassic coalfield of the Ordos Basin was constructed. The proposed IRMO-BP-NN model was validated through monitoring data from the 4−2216 working faces of Jianbei Coal Mine, followed by a comparative analysis with empirical formulas and conventional BP-NN models. The relative error of the IRMO-BP-NN prediction model is 4.93%, outperforming both the BP-NN prediction model, the SVR prediction model, and empirical formulas. The results demonstrate that the IRMO-BP-NN model enhances the accuracy of predicting WCFZ height, providing an application foundation for predicting such heights in the Jurassic coalfield of the Ordos Basin and protecting the ecological environment of Ordos Basin mining areas.

1. Introduction

The Ordos Basin holds significant importance as a coal-bearing basin in China, with its Jurassic coal resources constituting 31.0% of the national total [1]. In recent years, several mines in the region have experienced coal seam roof water damage accidents, posing serious threats to mine safety [2], compromising water resources, and exacerbating ecological degradation. Roof water damage in the Jurassic coalfield of the Ordos Basin typically presents as sandstone water damage, off-seam water damage, routed water and sand, and burnt rock water damage. The development of fissure zones connecting with overlying aquifers during intense coal mining in the Jurassic coalfield directly triggers these water damage incidents [3]. Therefore, an accurate forecast for the development heights of the water-conducting fracture zone (WCFZ) is pivotal for preventing and managing water damage on coal bed roofs and safeguarding the ecological environment.
Currently, many scholars have extensively researched predicting the WCFZ height. Various methods for predicting the WCFZ height include on-site measurement, theoretical calculation, empirical formulas, numerical simulation, and physical similarity simulation. On-site measurement primarily utilizes methods such as the up-hole segmental water injection side leakage method [4], the borehole flushing fluid leakage method [5], the in-hole peeping method [6], and the physical detection method [7]. While being the most intuitive approach, field measurement is time-consuming, challenging to execute, and entails high costs, particularly in the deep-embedded, thick seams of the Jurassic coalfield in the Ordos Basin, where high-intensity mining occurs. The theoretical calculation method, rooted in solid mechanics, constructs mechanical models of overburden deformation and damage to predict the WCFZ height. Zhu et al. [8], employing the slate–shell theory, calculated rock strata strain and analyzed failure states to determine the WCFZ height. Meanwhile, Wang et al. [9], based on the correlation between WCFZ development laws and rock formation structure and movement characteristics, proposed a new method that combines overburden structure and rock formation tensile deformation calculations to predict the WCFZ height. However, the theoretical calculation method oversimplifies overburden rock structure damage characteristics, resulting in an idealized calculation model that may deviate from reality. Zhang et al. [10] fit the measured data on the site of the Zhuanlongwan coal mine to obtain the empirical formula for the height of WCFZ. Empirical formulas, as seen in the Chinese Code [11], are derived through regression analysis using measured WCFZ height data from the North China mining area. However, these formulas often only consider single factors, such as mining height, leading to significant errors when applied to the Jurassic coalfield of the Ordos Basin [12]. Numerical simulation [13,14,15] utilizes computer software to establish mathematical models of engineering practices, simplifying complex boundary and geological conditions encountered in real coal seam mining situations. Nonetheless, the accuracy of numerical simulation heavily relies on geological condition model parameters, which are challenging to obtain accurately. Lai et al. [16] conducted physical similarity simulations under joint mining of adjacent coal seams and studied fissure development laws. However, the accuracy of physical similarity simulations is contingent upon achieving similar material ratios, which prove difficult under complex working conditions. Given the multiple influencing factors affecting the WCFZ height, empirical formulas and numerical simulations fall short of fully capturing its complexity, quantification challenges, and nonlinearity. In contrast, data-driven methods like neural networks exhibit robust nonlinear mapping and generalization capabilities.
In recent years, numerous scholars have utilized data-driven methodologies, such as analysis of regression and neural networks (NNs), in studying the prediction of WCFZ height, resulting in enhanced prediction accuracy. Li et al. [17] developed a weighted-based multivariate nonlinear regression prediction model for WCFZ height in comprehensive mining, using measured WCFZ height data and incorporating weights of influencing factors. Hu et al. [18], based on measured WCFZ data from comprehensive mining, derived a multivariate nonlinear regression formula correlating WCFZ height with factors such as coal seam height, working face width, and the lithology coefficient of hard rock. Bi et al. [19], considering factors such as coal seam burial depth, inclination angle, overburden rock strength, mining thickness, and length of working face, utilized Factor Analysis (FA) and Radial Basis Function (RBF) NN to construct a prediction model for WCFZ height. Li et al. [20] and Shi et al. [21] developed WCFZ height prediction models using BP-NN based on field measurement data, successfully applying them in engineering practice. Wu et al. [22] constructed a multivariate nonlinear regression prediction model for the Huanglong Jurassic Coalfield, and they optimized the BP-NN using genetic algorithms (GA) to develop a GA-BP-NN prediction model. These variations significantly affect the accuracy of WCFZ height predictions. While the aforementioned research findings are valuable for predicting WCFZ height, establishing a high-precision prediction model applicable to Jurassic coalfields in the Ordos Basin under high-intensity mining remains challenging due to diverse geological conditions. The Improved Radial Movement Optimization (IRMO) algorithm is a meta-heuristic algorithm. It has the advantages of high efficiency and stability, and the algorithm is simple in structure and occupies less memory. At present, the IRMO algorithm has been applied in geotechnical engineering fields such as slope stability analysis and foundation ultimate bearing capacity calculation [23,24].
Therefore, the IRMO algorithm has been implemented in the realm of coal mining to refine the weights and thresholds of the BP-NN, subsequently assigning optimal values to them. Leveraging measured data pertaining to the WCFZ height in the Ordos Jurassic coalfield, this study established an IRMO-BP-NN prediction model to delineate the correlation between WCFZ height and key influencing factors such as mining depth, thickness, width of working face, and proportion coefficient of hard rock. Utilizing Jianbei Coal Mine as our focal point, we employed a combination of borehole washing fluid leakage and TV logging to measure the WCFZ height of the 4−2216 working face. Subsequently, the IRMO-BP-NN prediction model was employed to forecast the WCFZ height in Jianbei Coal Mine, with the predicted values subjected to comparison against measured values to validate the feasibility and accuracy of the model.

2. Height of WCFZ in the Jurassic Coalfields of the Ordos Basin

2.1. Overview of the Jurassic Coalfields in the Ordos Basin

The Ordos Basin (Figure 1), situated in the eastern part of Northwest China, spans across a vast area from the southern foothills of Yinshan Mountain in the north to the northern edge of the Fenwei Fault in the south. It extends westward to the front lines of Helan Mountain and Liupanshan Mountain and eastward to Luliang Mountain. Encompassing five provinces (autonomous regions), including Inner Mongolia, Gansu, Ningxia, Shanxi, and Shaanxi, the basin covers an expansive territory of 370,000 km2. Renowned for its abundant reserves of coal, natural gas, uranium, and petroleum, the Ordos Basin serves as a pivotal hub for energy development in China. Remarkably, the Ordos Basin emerges as the most affluent repository of coal resources in China. Its primary coal strata comprise Jurassic, Carboniferous, Permian, and Triassic coal seams. The Jurassic coal seams within the basin have birthed four expansive coal bases, each approved for billion-ton construction projects by the Chinese government. These include the Shenfu Dongsheng Coal Field, Huanglong Coal Field, Shaanbeiju Jurassic Coal Field, and Ningdong Coal Field.
The coal seams within the Ordos Basin’s Jurassic coalfield exhibit excellent quality and boast abundant reserves. Typically, the inclination angle of these coal seams is less than 10°. Moreover, the primary mining coal seams in this region tend to be deeper than 100 m and exhibit considerable variability. Coal thickness varies from 2 to 15 m across the area. Notably, mining operations predominantly utilize the synthesized mining roof coal discharge method, characterized by its high mining intensity.

2.2. Influencing Factor Analysis of WCFZ Development Height

After analyzing the research findings from previous studies on the regional geological structure and the developmental patterns of WCFZ height and integrating these findings with coal mining practices, this study has discerned a complex nonlinear mapping relationship among the influencing factors affecting WCFZ development height. The primary influencing factors identified are as follows:
(1) Mining Thickness (M): Mining thickness plays a critical role in determining the stress redistribution, deformation, and fracture extent of the roof rock strata following coal seam extraction. Consequently, it stands as the primary influencing factor in forecasting the height of the WCFZ. Under specific circumstances, as the overlying key layer of the coal seam is progressively fractured, the plastic breakage zone of the roof strata expands, resulting in a rise in the height of the WCFZ.
(2) Depth of Burial of Coal Seam (H): The depth of burial of the coal seam impacts the original stress of the surrounding rock. Within a specific range, as the depth of burial increases, the initial stress of the surrounding rock near the working face rises as well. This phenomenon results in heightened vertical and horizontal loads on the overlying rock layers following coal seam excavation. Consequently, the development of joints and fissures is exacerbated, leading to increased fracture and destruction of the overlying rock layers and, consequently, an elevation in the WCFZ height.
(3) Working Face Width (L): The width of the working face significantly impacts the development of the WCFZ height before the coal seam is fully mined. As the width increases, so does the height of the WCFZ. However, once the coal seam is fully extracted, the effect of the working face width on the WCFZ height diminishes.
(4) Hard Rock Lithology Proportion Coefficient (b): The uniaxial compressive strength of the top plate rock layer and the combined structure of soft and hard rock layers are critical factors affecting the WCFZ height. However, there are challenges in statistically determining the uniaxial compressive strength for classifying the top plate type, and the combined structure of the soft and hard rock layers has been overlooked. Therefore, introducing the proportion coefficient of hard rock lithology b helps comprehensively quantify these two influencing factors. This coefficient represents the proportion of cumulative hard rock thickness within the mining influence zone above the coal seam roof to the height of the mining influence zone. The hard rock considered in the statistics mainly includes sandstone (fine, medium, and coarse), mixed rock, and igneous rock, as expressed in the following formula:
b = h 18 ~ 28 M ,
where M represents the mining thickness (m), which typically determines the extent of the coal seam mining influence, ranging from 18 to 28 times the mining thickness based on empirical data. h encompasses the cumulative thickness of hard rock in the mining influence zone.
For a comprehensive analysis of the factors influencing the WCFZ height o, research was conducted on the Jurassic coalfields in the Ordos Basin, and data from 75 sets of measurements regarding the WCFZ and its influencing factors in this area were collected and documented, as presented in Appendix A [25,26,27]. In this article, the distribution properties of the datasets are shown by boxplots, as Figure 2 illustrates. The boxplot simultaneously displays the data’s mean, outliers, 75th and 25th quantiles, and other pertinent information. Next, using the mining thickness (M) boxplot in Figure 2 as an example, we can see that the 25th quantile is 4.5 m and the 75th quantile is 6.2 m. Furthermore, the highest value is 8 m (not abnormal), the average is 5.743 m, and the median is around 5.3 m. The boxplot of M shows that certain coal mines have started to progressively approach high mining thickness. A visual analysis of the relationship and correlation between WCFZ height and all input features is provided by the correlation matrix diagram in Figure 3, which also displays the pairwise relationship and corresponding correlation coefficient of all features and labels in the dataset. This facilitates the exploration of the relationship and degree of contribution between numerous influential factors and WCFZ. Figure 3 shows that WCFZ height and M have a considerable correlation, which is in line with previous study findings and field engineering expertise.

3. IRMO-BP-NN Model

3.1. Overview of BP-NN

The BP-NN, a multilayer feed-forward network trained using error back-propagation, incorporates error back-propagation signals into the multilayer perceptron, enabling it to approximate arbitrary nonlinear mapping relations. This technique finds extensive applications in engineering fields.
The BP-NN topology consists of three layers (input, hidden, and output). A BP-NN with a single hidden layer has the ability to approximate any function’s nonlinear mapping with arbitrary precision [28]. Therefore, the BP-NN utilized in this study adopts a single hidden layer. When a BP-NN with only one hidden node is considered, there are O, P, and Q nodes in the input, hidden, and output layers, respectively. The input of the m-th node in the input layer is represented by xm, the weight from the m-th node in the input layer to the n-th node in the hidden layer is indicated by wmn, and the weight from the nth node in the hidden layer to the k-th node in the output layer is indicated by wnk. θn and γk represent the thresholds in the hidden layer and the output layer, respectively. Furthermore, φ and ψ represent the excitation functions of the hidden output layer, respectively. During data forward propagation, the output yk of the k-th node of the output layer is given as follows [29]:
y k = ψ n = 1 P w m k φ m = 1 O w m n x m + θ n + γ k
To ascertain the output error of the neurons in each layer, error back-propagation is calculated layer by layer from the output layer. Weights and thresholds in the hidden and output layers are adjusted using gradient descent in the direction of the error function’s negative gradient [30]. The goal of this iterative process is to reduce the discrepancy between the desired output and the final output of the corrected network.

3.2. Overview of Improved Radial Movement Algorithm

The IRMO algorithm enhances and optimizes the Radial Movement Optimization (RMO) algorithm, making it a global optimization algorithm capable of efficiently determining the optimal value for nonlinear objective functions. Once the expression and variable range of the nonlinear objective function are defined, the IRMO algorithm conducts a random exploration of feasible solutions within the solution space. It then performs a global search to iteratively update these solutions towards achieving an optimal solution for the nonlinear multi-objective function.
In a V-dimensional solution space, N particles XN are randomly initialized, with each particle representing a solution vector in the space. The position of a particle i is denoted as Xi = (Xi,1, Xi,2, Xi,3, ⋯, Xi,V), where each particle in the j-th dimension of the variable takes values within the range [minxj, maxxj]. Each initial particle is evaluated by a fitness function, Fitness, and the fitness value (optimal solution) of the best initial particle position is used as the initial center position. The N particles are updated by generating offspring near the initial center position, which serve as the new position points for the next generation. By comparing the fitness values of every particle, the generation’s ideal solution—designated as Rbest—is found.
To prevent the new generation of particle swarms from overly relying on the center position and potentially losing valuable information from the previous generation, the IRMO algorithm proposes a solution: the randomly generated new position point is considered the pre-position point Yi,j. The fitness function value of the pre-position point is compared with the optimal solution generated in the previous generation to determine whether the optimal solution needs updating (i.e., whether a radial shift should be performed). The center of the survival space, denoted as Center, is determined by the optimal solution Rbest of the previous generation, the solution Fitness (Yi) of the pre-position point, and the global optimal solution Gbest. With iterative swarm updates, the survival space gradually shrinks, and the optimal solution and center are continually updated by comparing the function values of the new generation’s position points. Consequently, the center of the survival space gradually moves toward global optimality. When the particle swarm’s survival space is reduced to a single point, the final global optimum solution Gbest is achieved. The radial movement principle of the IRMO algorithm is illustrated in Figure 4.

3.3. Establishing the IRMO-BP-NN Model

The IRMO is a global optimization algorithm that enhances convergence and stability by introducing a mutation probability, which increases the mutation rate of variables in the late iteration based on the radial movement algorithm [31]. Nevertheless, the BP-NN possesses robust nonlinear mapping and adaptive learning capabilities; however, it is susceptible to local optima, exhibits slow convergence, and yields unstable prediction results [32].
The IRMO algorithm effectively addresses the BP-NN’s drawbacks, enabling it to perform global optimization searches independent of gradient information, thereby overcoming issues associated with local optima. The IRMO algorithm method is used for optimization once the BP-NN’s weights and thresholds have been initialized. Subsequently, the BP-NN is operationalized with improved weights and thresholds. The following is a breakdown of the individual steps in the IRMO-BP-NN prediction process:
Step 1: Initialize the parameters of the BP-NN and the IRMO algorithms. Determine the number of nodes O, P, and Q for the input, hidden, and output layers of the BP-NN based on the sample data. Here, with P = 1, set the particle swarm population size N and the maximum number of iterations g.
Step 2: Establish the mapping relationship between the weights and thresholds of the BP-NN and the particle dimension V in the IRMO algorithm. Given that this study employs a single hidden layer in the BP-NN, the particle dimension V of the IRMO algorithm can be determined using Equation (3). Subsequently, the establishment of the initial population involves setting the upper and lower limits for each dimensional variable. Following this, N initial location points, Xi (1 < i < N), are randomly generated according to Equation (6) to form the initial population. The population is defined as a vector matrix, XN,V, as shown in Equation (7). The objective function values are computed for each location point, Xi, within the initial population. The position point corresponding to the optimum solution is identified as the current global optimal position, denoted as Gbestx1. This position is further defined as the initial representative center position, Center1, within the initial generation.
M = O P + P Q + P + Q
X min = x min , 1 x min , 2 x min , 2
X max = x max , 1 x max , 2 x max , 2
X i = X min + r a n d ( 0 , 1 ) × ( X max X min )
X = x 1 , 1 x 1 , 2 x 1 , M x 2 , 1 x 2 , 2 x 2 , M x N , 1 x N , 2 x N , M
where Xmax represents a matrix composed of the maximum values restricting each dimensional variable, in which xmax,j denotes the maximum value restricting the j-th dimensional variable. Similarly, Xmin represents a matrix composed of the minimum values restricting each dimensional variable, where xmin,j denotes the minimum value restricting the j-th dimensional variable. Xi represents the i-th generated initial location point, represented in matrix X by the i-th row, as shown in Equation (8).
X i = x i , 1 x i , 2 x i , M
Step 3: Evaluate the adaptation degree. To enhance the prediction performance of the BP-NN by determining the optimal weights and thresholds, the mean square error, serving as the performance function of the BP-NN, is adopted as the objective function for the IRMO algorithm. The specific formula is as follows:
F ( · ) = 1 L i = 1 L Q i y i 2
where L stands for the number of data points in the dataset. The i-th sample’s expected output value is shown by yi. Qi corresponds to the actual value of the i-th observation.
Step 4: Update the current position of the particle swarm and the global optimal position. The location point where the optimal value of F( X i k ) resides is defined as the current best position, denoted as Rbestxk. If the current best position, Rbestxk, is superior to the global best position, Gbestxk, then update the global best position by setting F(Gbestxk) = F(Rbestxk), and Gbestxk = Rbestxk. Otherwise, set F(Gbestxk) = F(Gbestxk−1) and Gbestxk = Gbestxk−1.
Step 5: The movement of the center position, denoted as Centrek. Centrek is determined by the changes in the current best position, Rbestxk, and the global best position, Gbestxk, as expressed by the following equation:
C e n t r e k = C e n t r e k 1 + 0.4 ( G b e s t k C e n t r e k 1 ) + 0.5 ( R b e s t k C e n t r e k 1 )
Step 6: Generate a new generation of the particle swarm at the center position. During the k-th iteration, the generation of the new set of pre-position information for the particle swarm is determined by the following equation:
Y i k = C e n t r e k 1 + r a n d ( 0.5 , 0.5 ) × ( X max X min ) w k ,   if   p 1 < 0.1   or   p 2 < p   Y i k = X i k 1 ,   otherwise
In the equation, p1 and p2 are random numbers generated from the interval [0, 1]. p represents the ratio of the position variable j to the total number of variables V. wk is calculated according to Equation (12), where g represents the maximum number of iterations.
w k = 1 k g
After generating new position information, the fitness function value Fitness ( Y i k ) is calculated and compared with the fitness function value of the previous generation Fitness ( X i k 1 ). If Fitness ( Y i k ) < Fitness ( X i k 1 ), update the position information, and set Fitness ( X i k ) = Fitness ( Y i k ), X i k = Y i k . Otherwise, set Fitness ( X i k ) = Fitness ( X i k 1 ), X i k = X i k 1 , and keep the position information unchanged.
Step 7: Determine whether the IRMO algorithm satisfies the termination condition. The IRMO method ends and outputs the optimum solution, where Gbest stands for the ideal position if it reaches the maximum number of iterations or if the error is smaller than the required error. Go back to step 3 if any of these requirements are not satisfied.
Step 8: Assign the best answer to the BP-NN’s weights and thresholds. Utilizing the optimized weights and thresholds obtained from IRMO, train and predict with the BP-NN. The flow of the IRMO-BP-NN model is illustrated in Figure 5.

4. Predictive Modeling of WCFZ Based on IRMO-BP-NN

4.1. Sample Set Creation and Processing

The IRMO-BP-NN model uses the measured WCFZ height data that were gathered from the Jurassic coalfield of the Ordos Basin as both the training and prediction sample sets. Before proceeding, cleaning the data and addressing any outliers is imperative. Fortunately, no outliers were detected in the dataset using the Matlab(2023b) data processing tool. Given the substantial variance in the variable ranges within the sample set, normalization becomes necessary to mitigate the influence of these differences. The min–max normalization method is employed for this purpose, transforming the sample set of mining thickness (M), coal seam depth (H), working face width (L), and hard rock lithology proportion coefficient (b), along with the WCFZ height (the target output data), into a linear transformation. The range of input and output data is shown in Table 1. This normalization procedure confines the data values within the range [0, 1], thereby enhancing the neural network’s speed of convergence. The normalization formula is as follows:
x = x x min x max x min ,
where x′ represents the normalized data, x represents the measured data, and xmin and xmax indicate the lowest and highest values of each measured data, respectively.

4.2. IRMO-BP-NN Model Training

A single hidden layer is utilized to construct the BP-NN, and the activation function employed from the input layer to the hidden layer is the hyperbolic tangent (Tanh) function, as depicted in the following Equation (14):
f x = 1 e 2 x 1 + e 2 x
The activation function from the hidden layer to the output layer implicitly employs a linear rectifier (ReLU) function, as depicted in the following Equation (15):
f x = max 0 , x
Using the Levenberg–Marquardt method—a combination of the gradient descent and Newton methods—the training algorithm modifies the weights and thresholds of the BP-NN. The empirical formula is utilized to determine the range of nodes in the hidden layer of the BP-NN [3,12]. After training, it was found that minimizing the MSE and MAPE of the training set is achieved with nine nodes in the hidden layer. As a result, a 4-9-1 neural network structure is built, consisting of four input layer nodes, nine hidden layer nodes, and one output layer node. The structure of the IRMO-BP-NN model is shown in Figure 6.
In this study, the BP-NN’s weights and thresholds are optimized using the IRMO method. Setting the population size (N) and the number of iterations (g) for the IRMO algorithm is crucial. After multiple training iterations to assess the optimization effect on convergence speed and solution accuracy, a population size of 30 and 100 iterations are determined as optimal parameters. To improve the IRMO-BP-NN model’s prediction accuracy, 60 datasets from Table 1 are randomly chosen as the training set, while the remaining 15 datasets are designated for prediction.
To validate the reliability and superiority of the IRMO-BP-NN prediction model, we established neural network models optimized by various algorithms using the same training samples, including BP-NN, GA-BP-NN [33,34], Support Vector Machine Regression (SVR) [35], and Bayesian surrogate model (Gaussian Processes (GP)) optimization algorithm [36,37]. SVR, a regression method based on the principles of Support Vector Machines (SVM), is widely used in regression prediction within machine learning. The penalty factor c = 3.0999 and the radial basis function parameter g = 5.5 are used in the SVR model in this study. Wu et al. [22] (2023) constructed a GA-BP-NN model for predicting the WCFZ height in the Huanglong coalfield using a data-driven approach; thus, this study compares our methods with Wu’s. In this study, we configured the GA algorithm with a population size of 55, a genetic evolution generation count of 70, a crossover probability of 0.8, and a mutation probability of 0.2. The GP algorithm has been successfully applied to parameter tuning in neural networks, and this study conducts a comparative analysis between the IRMO algorithm and the GP algorithm. To accurately assess the predictive performance of the aforementioned models, the root mean square error (RMSE), mean absolute error (MAE), and goodness of fit (R2) were introduced as metrics for evaluating model predictive performance.

4.3. Analysis and Prediction Results of the IRMO-BP-NN Model

To validate the trained IRMO-BP-NN, BP-NN, GA-BP-NN, SVR, and GP models for predicting 15 randomly selected sets. To facilitate a comprehensive comparison between the prediction models, various performance indicators, including R2, RMSE, and MAE, among others, are evaluated. The calculated results for each indicator are presented in Figure 7. As shown in Figure 7, the performance of the BP neural network model has been enhanced through optimization with the IRMO algorithm and the GA algorithm. The improvement in the IRMO-BP-NN model is particularly significant, with the R2 increasing from 0.868 to 0.958, the RMSE decreasing from 11.522 to 6.549, and the MAE reducing from 8.573 to 5.228. And the IRMO-BP-NN prediction model is more reliable than the SVR prediction model.
To further compare and evaluate the applicability and reliability of the models developed in this study, we conducted an error analysis of the prediction results, as shown in Figure 8. When comparing the IRMO-BP-NN prediction model to the BP-NN prediction model, it can be seen that the IRMO algorithm has enhanced and optimized the BP-NN, resulting in lower values for R2, RMSE, and MAE when compared to the BP-NN. The IRMO-BP-NN model also outperforms the GA-BP-NN, SVR, and GP models. Consequently, the IRMO-BP-NN demonstrates higher prediction accuracy. Specifically, the error range of the IRMO-BP-NN is [−6.55, 14.38]. It exhibits a smaller range of error fluctuations, indicating greater stability in its prediction results compared to other models.
This study employed the Shapley Additive exPlanations (SHAP) method [35] to analyze and study the complex influencing factors in the prediction of WCFZ height, identifying the intricate relationships between features and outputs. The importance of the features is shown in Figure 9. The X-axis displays the SHAP value range, while the Y-axis lists the input features. The results indicate that M has the greatest impact on the model’s predictions. The remaining input characteristics have a similar effect on the WCFZ height.

5. IRMO-BP-NN WCFZ Height Prediction Model Application

5.1. General Situation of Coal Mine Working Face

The Jianbei Coal Mine, situated in the Huanglong mining area within the southern region of the Ordos Basin, falls administratively under Huangling County, Shaanxi Province, China. It covers an approximate area of 48.15 km2. This study zeroes in on the 4−2 coal seam of the No. 216 working face within the Jianbei Coal Mine, featuring a mining length spanning 2304.80 m and a strike length of 214.60 m. Utilizing a comprehensive mechanized top coal caving approach, the mine extracts the upper section of the first sub-level of the Yan’an Formation, specifically targeting the 4−2 coal seam, with roof control managed through full caving techniques. The 4−2 coal seam is characterized by a simple structure with 1 to 3 layers of intercalated gangue, an average dip angle of 3.5°, and a mean thickness of 7.33 m with little variation in thickness. The burial depth of the seam ranges from 156.95 to 733.75 m. The lithological composition of the study area encompasses formations from the Quaternary (Q4eol), Lower Cretaceous Luohexi Formation (K1l), Lower Cretaceous Yijun Formation (K1y), Middle Jurassic Zhiluo Formation (J2z), and Middle Jurassic Yan’an Formation (J2y). Notably, the Jianbei Coal Mine’s 4−2 coal seam is directly supplied with water by the pore and crack water-bearing layer located in the lowermost portion of the Middle Jurassic Zhiluo Formation.

5.2. Field Measurements and Empirical Formula Calculations

When the 4−2216 working face was being mined, the height of the WCFZ was measured using the ground drilling method in the Jianbei Coal Mine. The actual measurement data for the WCFZ height were obtained by combining observations of drilling fluid loss and downhole TV surveillance. The flushing fluid usage during drilling and the TV logging data for exploration are shown in Figure 10. The determination of the top boundary of the WCFZ was made based on observations of drilling fluid consumption and water level depth, indicating a depth of 219.11 m. On the other hand, the upper border of the WCFZ, determined by downhole TV logging, was identified at a depth of 219.54 m. Integrating both methods yielded a confirmed top boundary position of the WCFZ at 219.54 m. Furthermore, at the JBSD1 borehole, where the coal seam was being extracted, the top plate position was determined to be at a depth of 378.01 m. Thus, the WCFZ height at the JBSD1 borehole location was calculated to be 158.47 m.
Geological exploration data indicate that moderately hard rocks with a steady distribution of hard Yijun conglomerate make up the majority of the roof of the 4−2 coal seam. Integrating the rock composition characteristics of the 4−2 coal seam roof and its engineering geological properties, the WCFZ height is calculated according to the empirical formula for hard rock types specified in the reference [11].
H l i = 30 M + 10 = 86.84 ( m )
where M is the coal seam’s cumulative thickness.

5.3. IRMO-BP-NN Model Prediction

To further validate the accuracy and engineering application value of the IRMO-BP-NN model in predicting the height of the WCFZ, this model was utilized to predict the WCFZ height at the JBSD1 borehole location of the 4−2 coal seam 216 working face in the Jianbei Coal Mine. The 216 working face of the Jianbei Coal Mine has a strike length of 214.60 m, a coal seam thickness of 6.56 m at the JBSD1 borehole location, and a burial depth of 378.01 m. The proportional coefficient of hard rock lithology was calculated as 0.53 according to Equation (1). These parameters were input into the IRMO-BP-NN model and the BP-NN for predicting the WCFZ height at the JBSD1 borehole location. As indicated in Table 2, the anticipated outcomes were then thoroughly contrasted with the empirical formula and the measured values obtained on the spot. The steps for predicting WCFZ height using the IRMO-BP-NN model are as follows:
Step 1: Save the trained IRMO-BP-NN model.
Step 2: Load the saved IRMO-BP-NN model in MATLAB(2023b).
Step 3: Calculate the hard rock lithology ratio coefficient b. Enter the parameters required for prediction and save the prediction results. The data we input in this study are [0.53 378.01 214.6 6.56].
The absolute difference between the IRMO-BP-NN model and the measured values is 7.81 m, with a relative error of 4.93%, as can be seen from the findings in Table 2. For the SVR, the absolute error compared to the measured values is −18.74 m, with a relative error of −11.89%. For the BP-NN, the absolute error compared to the measured values is −22.7 m, with a relative error of −14.32%. In contrast, the empirical formula exhibits an absolute error of −71.63 m and a relative error of −45.20%, significantly higher than both the IRMO-BP-NN and the BP-NN. The absolute and relative errors of the IRMO-BP-NN are superior to those of the BP-NN, indicating a significant improvement in the prediction accuracy of the WCFZ height after optimization by the IRMO. Moreover, the relative error of the IRMO-BP-NN prediction model is less than 5%, demonstrating its precision in meeting the requirements of engineering practice. Hence, it can be applied to predict the WCFZ height in the Jurassic coalfields of the Ordos Basin.

6. Conclusions

To prevent water hazards in coal mining practices, this study proposes a method for predicting the WCFZ height based on the IRMO-BP-NN model. The model is applied to the Jurassic coalfields of the Ordos Basin, with validation conducted using field-measured data from the Jianbei Coal Mine in the Ordos Basin. There are the main conclusions of this study:
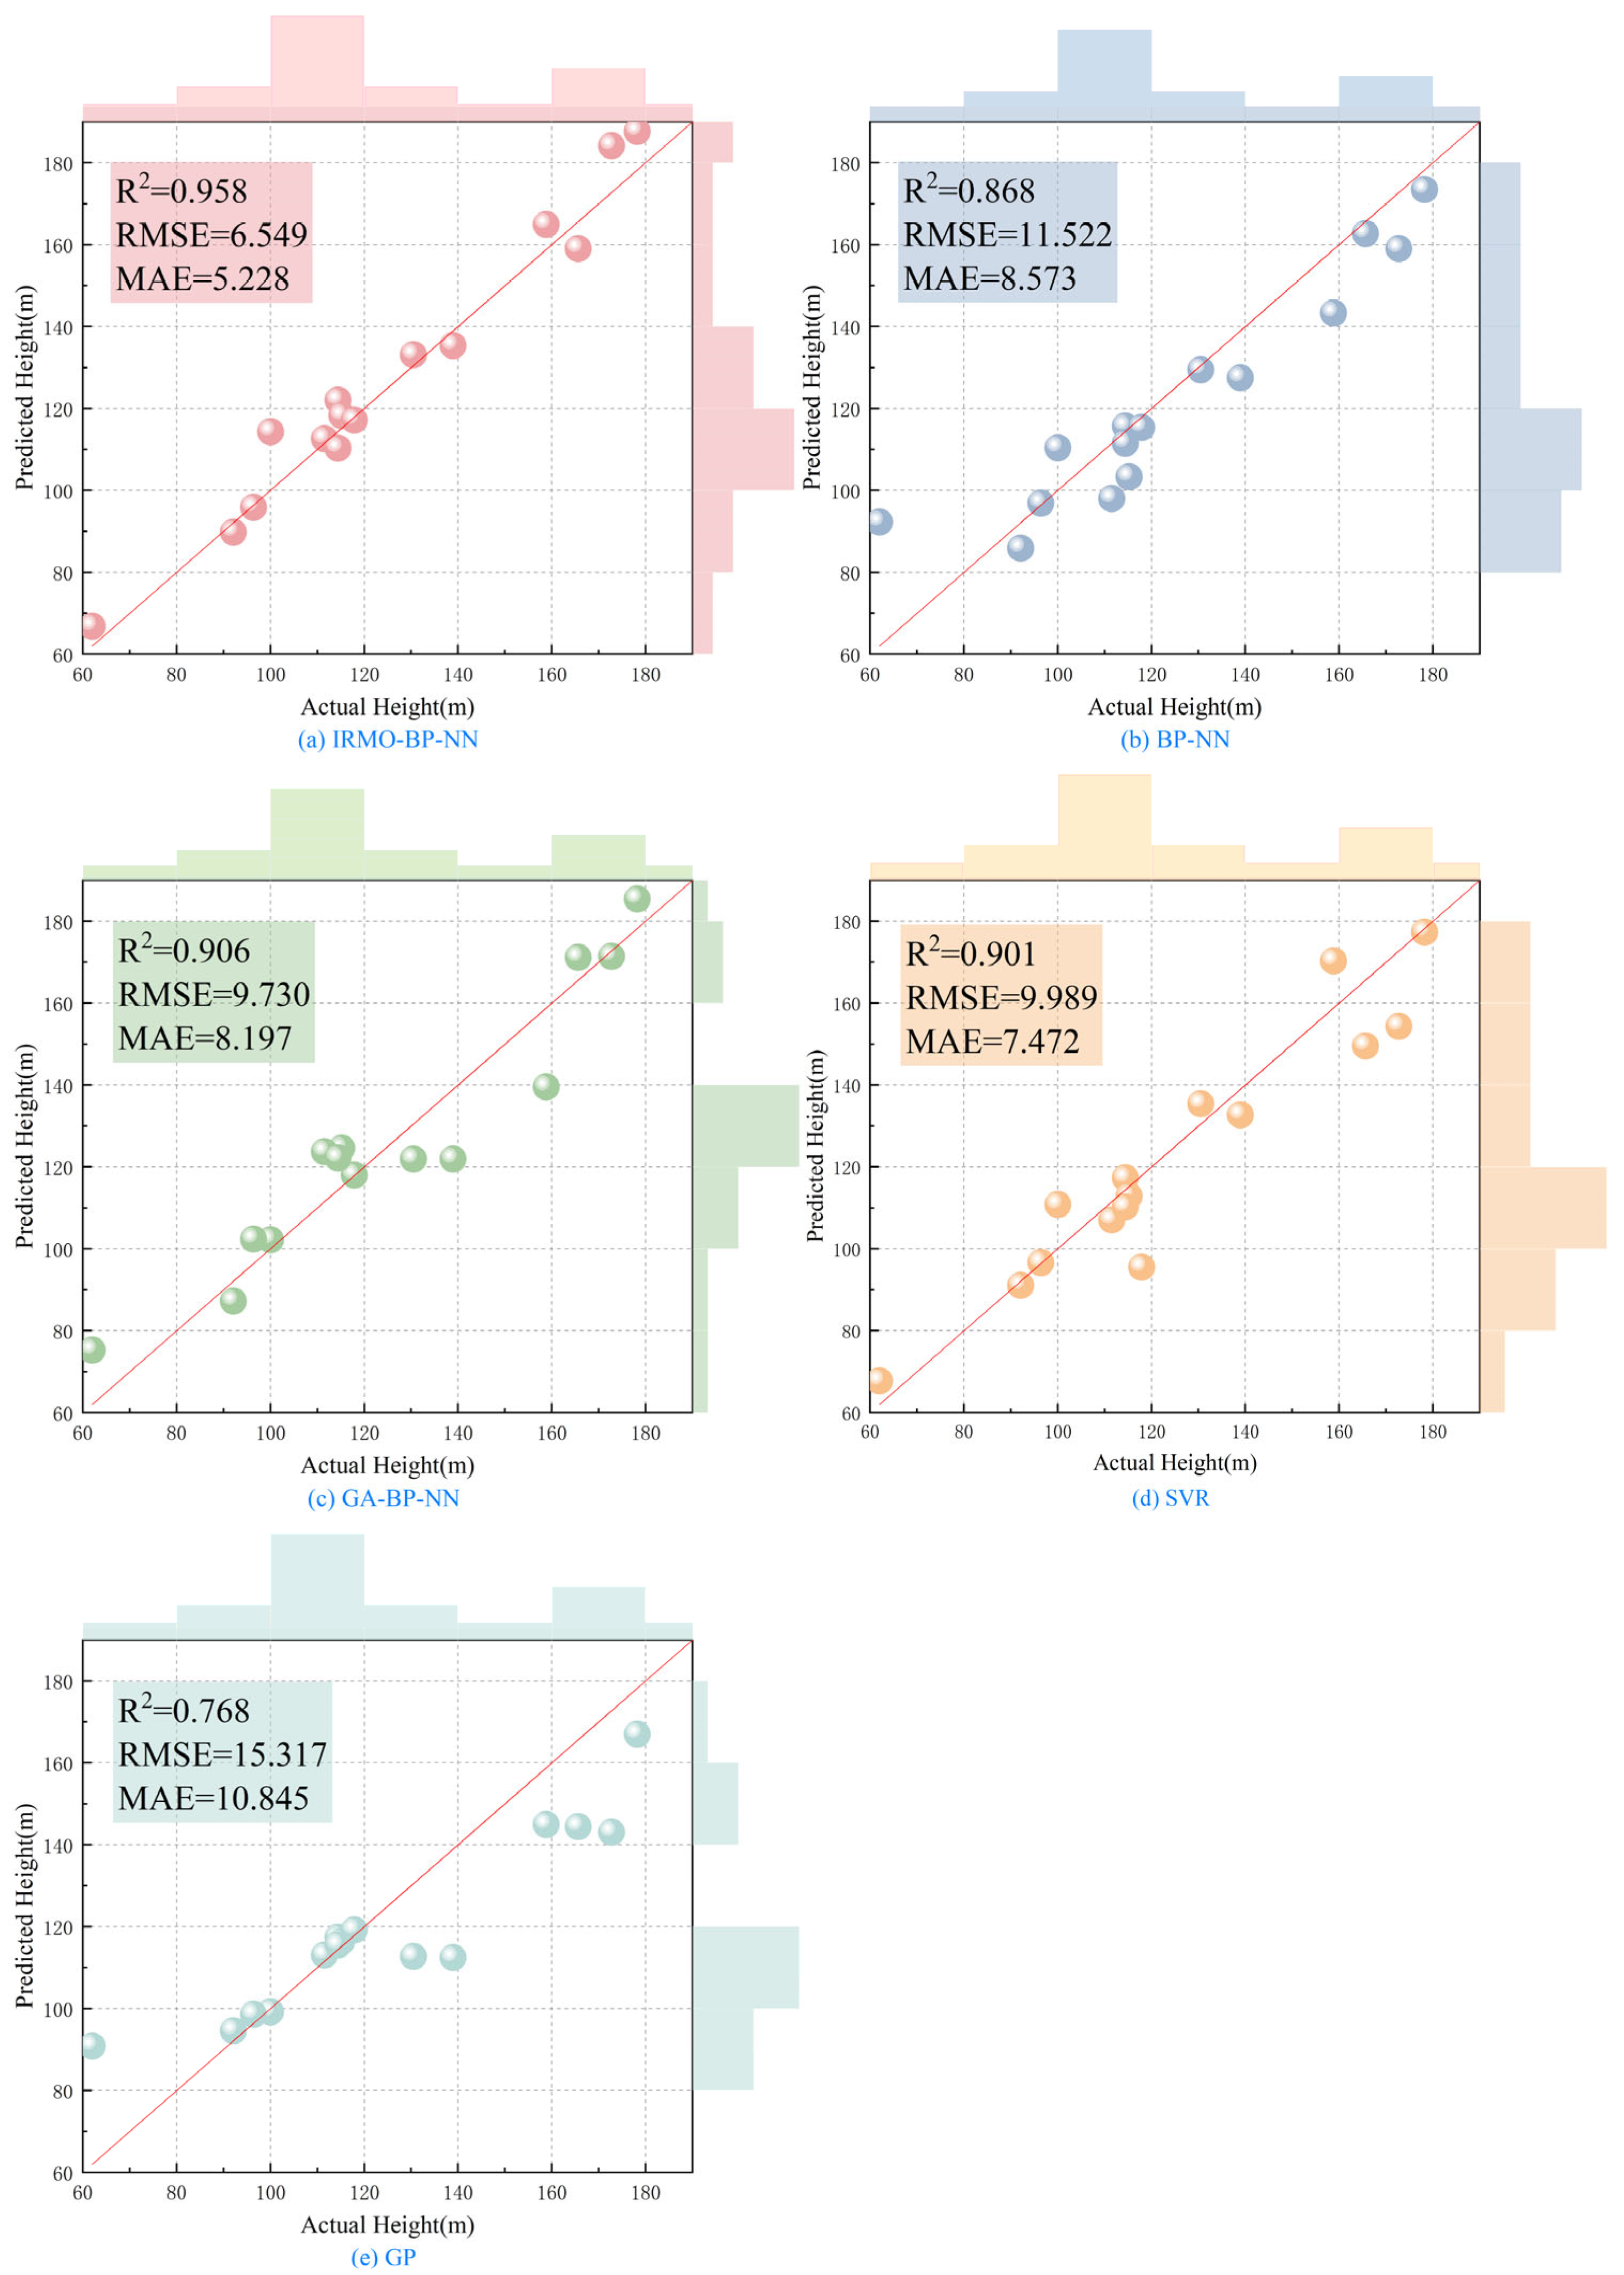
  • This study collected field-measured data from the Jurassic coalfields in the Ordos Basin, considering four influencing factors, namely mining thickness, burial depth of coal seams, width of working faces, and proportion coefficient of hard rock lithology, to establish an IRMO-BP-NN prediction model. This model enhances the accuracy of predicting the height of WCFZ (from R2 = 0.868 to 0.958, RMSE = 11.522 to 6.549, MAE = 8.573 to 5.228);
  • At the 4−2 coal seam of the Jianbei Coal Mine, the No. 216 working face was subjected to the prediction model developed in this study. The predicted height of the WCFZ using the IRMO-BP-NN model was evaluated against the field-measured values. The results show that the forecasted WCFZ height at borehole JBSD1 by the IRMO-BP-NN model is 166.28 m, while the field-measured value is 158.47 m. By contrast, the prediction by the BP-NN is 135.77 m, and the empirical formula comes out to 86.84 m. The relative error of the IRMO-BP-NN prediction model is 4.93%, which indicates significantly higher prediction accuracy compared to both the empirical formula and other prediction models;
  • The IRMO-BP-NN model for predicting WCFZ height, established based on field-measured data in this study, has significant guiding implications for predicting the WCFZ height in the Jurassic coalfields of the Ordos Basin. The SHAP method was employed to analyze the influencing factors in predicting WCFZ height, enabling the identification of input features that significantly contribute to WCFZ height. Based on the results of the SHAP analysis, the conclusion is that coal seam thickness has the greatest impact on WCFZ height. This XAI (Explainable Artificial Intelligence) technology helps us understand the prediction model. Research on the WCFZ height in coal mines should be conducted according to the geological circumstances of different areas. Constructing height prediction models for WCFZ in different regions can improve the accuracy of height prediction.

Author Contributions

Z.G.: investigation, experiment, and writing—original draft. L.J.: supervision and writing—review and editing. P.L.: writing—review and editing. J.W.: writing—review and editing. All authors have read and agreed to the published version of the manuscript.

Funding

This research received no external funding.

Data Availability Statement

The authors confirm that the data supporting the findings of this study are available within the article.

Conflicts of Interest

The authors declare no conflicts of interest.

Appendix A

Table A1. Measured data and influencing factors of WCFZ.
CoalfieldWorking Face/BoreholeH/mL/mM/mbWCFZ Height
Bayangaole311,1016202605.270.78126
Bulianta12,4062003104.50.6989.5
12,4012302654.50.75140.5
12,406207.5300.55.80.6181.5
31,401247265.34.40.91156
Caojiatan122,106279.9935060.91136.1
J126835060.62139.15
Daliu12034913540.5245
Daliuta52,30618030170.9137.32
Gaojiabao30,1013002487.50.67112.6
HanglaiwanH3241.33004.50.69108.32
H42443004.50.74114.38
H4242.93004.50.65107.8
30,1052333004.50.5896.9
GT2240.43004.50.69108.3
H3242.23004.50.69114.4
Hujiahe401,10152518060.62100
Jinjitan102264.983005.50.54111.32
JT6270.230050.912120.25
JKY22603005.50.7122.64
JSD2247.63005.50.44115
JSD4232.383005.50.79146.18
Y628330080.65171.3
Y527530060.52126.4
J12603005.50.46115.2
J32633005.30.42111.5
Sangshuping33033701535.70.1670
Shenshupan 673200100.95120
Shuangshan 71320080.93103.09
Tingnan106463.07116.057.650.6396.45
1074531167.60.6296.4
104550.0220060.60136.2
Y370220090.39148.3
Y1-1533.22007.50.35140.2
204537.820060.43135.2
Xibu 568.4180.42.940.8557
5501802.40.8155.32
4891604.50.4754.79
516206.12.950.7454.5
Yushuwan20,10428025550.75135.4
Y327625550.54130.5
Y4279.325550.62137.3
Y6275.825550.57117.8
H534625550.68137.3
30,101286.925550.67138.9
30,103283.525550.70130.5
Huanglingerkuang2064602303.750.4162
Zhangjiamao320150010411.10.83152.34
ZG11912606.60.57117.9
14,20218029540.3172
15,2011332606.20.4389.6
XuemiaotanDZ12442825.70.63122
Yuandatan11,201332.33003.50.7104.36
Liangshuijing42,1011101203.260.4645.85
42,1021202003.260.5764.18
Longde20519821040.5276.85
Yuyang23041882003.50.5186
Cuimu21,303552.192009 0.4172.75
Wulanmulun12,4031143002.50.6662.9
2207971582.20.6567.2
Halagou220112421060.4356
22,407131284.35.40.47131
Huojituo12,205852353.50.475
ZhuanlongwanY12002604.50.4292.1
Hanjiawan2304320.62684.10.94104.6
DafosiD1229818012.10.52193.8
40,10628718011.20.53178.2
D138418012.60.6191
XiagouX1258909.90.32125.8
2802331.9896.290.5165.61
LiuxiangL1210.41507.90.37117.8
Buertai23,10132730030.68146
Lijiahao31,110343.524040.585.3
Xiaobaodang112,201300.9635060.74158.78
112,201310.3735060.77177.07

References

  1. Wang, S. Coal Accumulation and Coal Resource Evaluation of Ordos Basin; China Coal Industry Publishing House: Beijing, China, 1996. [Google Scholar]
  2. Wu, Q. Progress, Problems and Prospects of Prevention and Control Technology of Mine Water and Reutilization in China. J. China Coal Soc. 2014, 39, 795–805. [Google Scholar] [CrossRef]
  3. Dong, S.; Ji, Y.; Wang, H.; Zhao, H.; Cao, H.; Liu, Y. Prevention and Control Technology and Application of Roof Water Disaster in Jurassic Coal Field of Ordos Basin. J. China Coal Soc. 2020, 7, 2367–2375. [Google Scholar] [CrossRef]
  4. Fan, Z.; Liu, Z. Mud Cover Effect of Mining-Induced Failure of Soft Overburden in Thick Clay Strata. J. Min. Saf. Eng. 2020, 37, 1196–1204. [Google Scholar] [CrossRef]
  5. He, B.; Zhou, X. Study on Distribution Law of Three Overburden Zones in Shallow and Thick Coal Seam Mining of Daliuta Coal Mine. Coal Sci. Technol. 2022, 50, 1–6. [Google Scholar] [CrossRef]
  6. Cheng, J.; Wang, B.; Fan, T.; Wang, Y.; Jiang, B. Typical Application Scenes and Key Technologies of Coal Mine Geological Transparency. Coal Sci. Technol. 2022, 50, 1–12. [Google Scholar] [CrossRef]
  7. Liu, Y.; Li, W.; He, J.; Liu, S.; Cai, L.; Cheng, G. Application of Brillouin Optical Time Domain Reflectometry to Dynamic Monitoring of Overburden Deformation and Failure Caused by Underground Mining. Int. J. Rock Mech. Min. Sci. 2018, 106, 133–143. [Google Scholar] [CrossRef]
  8. Zhu, T.; Li, W.; Wang, Q.; Hu, Y.; Fan, K.; Du, J. Study on the Height of the Mining-Induced Water-Conducting Fracture Zone under the Q2l Loess Cover of the Jurassic Coal Seam in Northern Shaanxi, China. Mine Water Environ. 2020, 39, 57–67. [Google Scholar] [CrossRef]
  9. Huang, W.; Gao, Y.; Wang, B.; Liu, J. Evolution Rule and Development Height of Permeable Fractured Zone under Combined-Strata Structure. J. Min. Saf. Eng. 2017, 34, 330–335. [Google Scholar] [CrossRef]
  10. Zhang, S.; Zhang, D.; Feng, G. Quantitative Evaluation and Planning Method of Shallow Surface Water Response in Multi-Face Mining—Case Study Regarding Zhuanlongwan Coal Mine. J. Clean. Prod. 2022, 373, 133830. [Google Scholar] [CrossRef]
  11. State Administration of Work Safety. National Coal Mine Safety Administration, National Energy Administration Specifications for Coal Pillar Retention and Compressed Coal Mining in Buildings, Water Bodies, Railways and Main Shafts; China Coal Industry Publishing House: Beijing, China, 2017.
  12. Li, C. Characteristics of Height of Water Flowing Fractured Zone in the Roof Caused during Fully-Mechanized Caving Mining in Huanglong Coalfield. Coal Geol. Explor. 2019, 47, 129–136. [Google Scholar]
  13. Yang, D.; Guo, W.; Zhao, G.; Tan, Y.; Yang, W. Height of Water-Conducting Zone in Longwall Top-Coal Caving Mining under Thick Alluvium and Soft Overburden. J. China Coal Soc. 2019, 44, 3308–3316. [Google Scholar] [CrossRef]
  14. Zhao, C.; Jin, D.; Wang, H.; Wang, Q.; Wang, S.; Liu, Y. Construction and Application of Overburden Damage and Aquifer Water Loss Model in Medium-Deep Buried Coal Seam Mining in Yushen Mining Area. J. China Coal Soc. 2019, 44, 2227–2235. [Google Scholar] [CrossRef]
  15. Teng, Y.; Yi, S.; Zhu, W.; Jing, S. Development Patterns of Fractured Water-Conducting Zones under Fully Mechanized Mining in Wet-Collapsible Loess Area. Water 2022, 15, 22. [Google Scholar] [CrossRef]
  16. Lai, X.; Liu, B.; Shan, P.; Cui, F.; Zhang, Y.; Zhang, X.; Bai, R.; Wu, X. Study on the Prediction of the Height of Two Zones in the Overlying Strata under a Strong Shock. Geofluids 2021, 2021, 4237061. [Google Scholar] [CrossRef]
  17. Li, B.; Wu, H.; Li, T. Height Prediction of Water-Conducting Fractured Zone under Fully Mechanized Mining Based on Weighted Multivariate Nonlinear Regression. J. Min. Saf. Eng. 2022, 39, 536–545. [Google Scholar] [CrossRef]
  18. Hu, X.; Li, W.; Cao, D.; Liu, M. Index of Multiple Factors and Expected Height of Fully Mechanized Water Flowing Fractured Zone. J. China Coal Soc. 2012, 37, 613–620. [Google Scholar] [CrossRef]
  19. Bi, Y.; Wu, J.; Zhai, X.; Huang, K. A Prediction Model for the Height of the Water-Conducting Fractured Zone in the Roof of Coal Mines Based on Factor Analysis and RBF Neural Network. Arab. J. Geosci. 2022, 15, 241. [Google Scholar] [CrossRef]
  20. Li, Z.; Xu, Y.; Li, L.; Zhai, C. Forecast of the Height of Water Flowing Fractured Zone Based on BP Neural Networks. J. Min. Saf. Eng. 2015, 32, 905–910. [Google Scholar] [CrossRef]
  21. Shi, L.; Huang, J.; Han, J.; Qin, D.; Guo, W. PCA-BP Model for Height Prediction of Water Conducting Fracture Zone. China Sci. Pap. 2019, 14, 471–475. [Google Scholar]
  22. Wu, J.; Pan, J.; Gao, J.; Yan, Y.; Ma, H. Research on Prediction of the Height of Water-Conducting Fracture Zone in Huanglong Jurassic Coalfield. Coal Sci. Technol. 2023, 51, 231–241. [Google Scholar] [CrossRef]
  23. Jin, L.; Zhang, H.; Feng, Q. Ultimate Bearing Capacity of Strip Footing on Sands under Inclined Loading Based on Improved Radial Movement Optimization. Eng. Optim. 2021, 53, 277–299. [Google Scholar] [CrossRef]
  24. Jin, L.; Wei, J.; Luo, C.; Qin, T. Slope Stability Analysis Based on Improved Radial Movement Optimization Considering Seepage Effect. Alex. Eng. J. 2023, 79, 591–607. [Google Scholar] [CrossRef]
  25. Yin, H.; Dong, F.; Zhang, Y.; Cheng, W.; Zhai, P.; Ren, X.; Liu, Z.; Zhai, Y.; Li, X. Height Prediction and 3D Visualization of Mining-Induced Water-Conducting Fracture Zone in Western Ordos Basin Based on a Multi-Factor Regression Analysis. Energies 2022, 15, 3850. [Google Scholar] [CrossRef]
  26. Feng, D.; Hou, E.; Xie, X.; Hou, P. Research on Water-Conducting Fractured Zone Height under the Condition of Large Mining Height in Yushen Mining Area, China. Lithosphere 2023, 2023, 8918348. [Google Scholar] [CrossRef]
  27. He, X.; Zhao, Y.; Zhang, C.; Han, P. A Model to Estimate the Height of the Water-Conducting Fracture Zone for Longwall Panels in Western China. Mine Water Environ. 2020, 39, 823–838. [Google Scholar] [CrossRef]
  28. Goh, A.T.C.; Lect, S. Pile Driving Records Reanalyzed Using Neural Networks. J. Geotech. Eng. 1996, 122, 492–495. [Google Scholar] [CrossRef]
  29. Wen, Z. MATLAB Smart Algorithm; Tsinghua University Press: Beijing, China, 2017. [Google Scholar]
  30. Lyu, W.; Huang, H.; Chi, S.; Han, B. Neural Network Optimization Algorithm for the Prediction Parameters of Probability Integral Method. Sci. Surv. Mapp. 2019, 44, 35–41. [Google Scholar] [CrossRef]
  31. Pan, Z.; Jin, L.; Cheng, W. Improved Radial Movement Optimization Algorithm for Slope Stability Analysis. Rock Soil Mech. 2016, 37, 2079–2084. [Google Scholar] [CrossRef]
  32. Momeni, E.; Nazir, R.; Jahed Armaghani, D.; Maizir, H. Prediction of Pile Bearing Capacity Using a Hybrid Genetic Algorithm-Based ANN. Measurement 2014, 57, 122–131. [Google Scholar] [CrossRef]
  33. Johari, A.; Javadi, A.; Najafi, H. A genetic-based model to predict maximum lateral displacement of retaining wall in granular soil. Sci. Iran. A 2016, 23, 54–65. [Google Scholar] [CrossRef]
  34. Jouhari, A.; Ghahramani, A.; Habibagahi, G. Prediction of a soil- water characteristic curve using a genetic-based neural network. Sci. Iran. 2006, 13, 284–294. [Google Scholar]
  35. Hou, E.; Wen, Q.; Ye, Z.; Chen, W.; Wei, J. Height prediction of water-flowing fracture zone with a genetic-algorithm support-vector-machine method. Int. J. Coal. Sci. Technol. 2020, 7, 740–751. [Google Scholar] [CrossRef]
  36. Sajjad, U.; Hussain, I.; Sultan, M.; Mehdi, S.; Wang, C.-C.; Rasool, K.; Saleh, S.M.; Elnaggar, A.Y.; Hussein, E.E. Determining the Factors Affecting the Boiling Heat Transfer Coefficient of Sintered Coated Porous Surfaces. Sustainability 2021, 13, 12631. [Google Scholar] [CrossRef]
  37. Uzair, S.; Aqeel, A.; Imtiyaz, H.; Muhammad, S.; Hafiz Muhammad, A.; Wei-Mon, Y. Explainable artificial intelligence-based insights into the corrosion behavior of WS2/AZ91 composites subjected to severe deformation conditions. Results Eng. 2024, 21, 101897. [Google Scholar] [CrossRef]
Figure 1. The Ordos Basin location—(a) China map, (b) schematic coal mine maps.
Mathematics 12 01602 g001
Figure 2. Box plots of the WCFZ dataset.
Mathematics 12 01602 g002
Figure 3. The correlation matrix of WCFZ variables. (“.” indicates marginal significance. “**” indicates significance. “***” indicates high significance.).
Mathematics 12 01602 g003
Figure 4. Schematic diagram of the principle of the improved radial optimization algorithm [23].
Mathematics 12 01602 g004
Figure 5. IRMO-BP-NN model flow chart.
Mathematics 12 01602 g005
Figure 6. IRMO-BP-NN model structure.
Mathematics 12 01602 g006
Figure 7. Comparison of model-predicted heights of WCFZ.
Mathematics 12 01602 g007
Figure 8. The error bar plots for models relate to the predicted WCFZ height.
Mathematics 12 01602 g008
Figure 9. (a) SHAP summary plot for WCFZ height prediction. (b) SHAP feature importance for WCFZ height prediction.
Mathematics 12 01602 g009
Figure 10. WCFZ field measurement. (a) Distribution of water leakage in the borehole. (b) Longitudinal fracture of the hole wall.
Mathematics 12 01602 g010
Table 1. Model prediction accuracy and performance evaluation.
Data RangebH/mM/mL/mWCFZ Height/m
Maximum value0.9562012.6350193.8
Minimum value0.16492.29045
Table 2. Comparison of the height of the WCFZ of drill hole JBSD1 in the 4−2216 working face.
Prediction ModelWCFZ Height (m)Absolute Error (m)Relative Error (%)
IRMO-BP-NN166.287.814.93
SVR139.63−18.74−11.89
BP-NN135.77−22.7−14.32
Empirical formula86.84−71.63−45.20
Disclaimer/Publisher’s Note: The statements, opinions and data contained in all publications are solely those of the individual author(s) and contributor(s) and not of MDPI and/or the editor(s). MDPI and/or the editor(s) disclaim responsibility for any injury to people or property resulting from any ideas, methods, instructions or products referred to in the content.

