Abstract
Clustered data are a special type of correlated data where units within a cluster are correlated while units between different clusters are independent. The number of units in a cluster can be associated with that cluster’s outcome. This is called the informative cluster size (ICS), which is known to impact clustered data inference. However, when comparing the outcomes from multiple groups of units in clustered data, investigating ICS may not be enough. This is because the number of units belonging to a particular group in a cluster can be associated with the outcome from that group in that cluster, leading to an informative intra-cluster group size or IICGS. This phenomenon of IICGS can exist even in the absence of ICS. Ignoring the existence of IICGS can result in a biased inference for group-based outcome comparisons in clustered data. In this article, we mathematically formulate the concept of IICGS while distinguishing it from ICS and propose a nonparametric bootstrap-based statistical hypothesis-testing mechanism for testing any claim of IICGS in a clustered data setting. Through simulations and real data applications, we demonstrate that our proposed statistical testing method can accurately identify IICGS, with substantial power, in clustered data.
Keywords:
binary group; bootstrap test; clustered data; correlated data; distribution function; informative cluster size MSC:
62G10
1. Introduction
Clustered data are correlated data where there exist natural clusters such that the observations within a cluster are correlated while the different clusters can be assumed to be independent. Clustered data can be encountered in different fields of study. These include biomedical studies involving animal litters, patients in different hospitals, or teeth in different individuals, as well as socioeconomic studies involving students from different schools or residents from different geographical locations. Traditional analyses of clustered data assume the number of units in a cluster, i.e., a cluster size, to be a non-random quantity. The limitation of this assumption is that it ignores any possible association between a cluster size and the outcome from that cluster. However, such associations are known to exist in clustered data. For example, the birthweights of pups in an animal litter may be associated with the number of pups born in the same litter; schools with larger numbers of students may be associated with better academic performance; and a few remaining teeth in an aged individual may indicate a serious dental condition or disease. All of the aforementioned situations are examples where a cluster size is associated with the outcome, and, hence, is informative of the outcome from that cluster. This phenomenon is known as an informative cluster size [1]. Ignoring informative cluster size (ICS), if it exists, can lead to a biased inference for clustered data [2,3]. There have been extensions to some classical statistical methods that can account for ICS in clustered data [4,5,6,7]. In the recent past, [8] developed a hypothesis-testing method that can examine the existence of ICS in clustered data, which is a key step in determining whether ICS-adjusted statistical analyses are needed for the data.
In clustered data, besides the outcome of the interest, there can exist binary or categorical covariates within every cluster. Such a covariate creates two or more groups of observations within a cluster. Examples of binary group factors in a cluster include the genders of pups in a litter, jaw-based location of teeth in an individual’s mouth, and genders of students studying in a school, among others. In these cases, it is common to compare outcomes from different groups. When performing such comparisons in clustered data, accounting for ICS may not be enough. This is because there may exist another layer of informativeness in addition to, or even in the absence of, ICS. This is generated from the fact that the outcome from a subunit specific to a group in a typical cluster can be correlated with the number of subunits present in that group in the same cluster [9]. This is a scenario where the number of units (subunits) belonging to a particular group in a cluster, i.e., an intra-cluster group size, is informative of the outcome from that group in the cluster. This is referred to as an informative intra-cluster group size (IICGS) in clustered data [10]. For example, the academic performance of female students in a class may be associated with the number of female students in that class, or a lesser than usual number of teeth in the lower jaw of an aged individual may indicate higher tooth attachment loss in the lower jaw of that individual. Here, the number of female students in a class and the number of lower teeth in an individual’s jaw are the intra-cluster group sizes that are associated with the outcomes of academic performance and teeth attachment loss, respectively. Recently, new statistical testing methods have emerged for comparing continuous outcomes [10], survival outcomes [11,12], and categorical outcomes [13] from multiple groups in clustered data with IICGS. It has been shown that ICS-adjusted statistical methods can produce biased inference for group-based comparisons [10]. Moreover, as shown later in this article, IICGS can exist through at least one group even if ICS is absent in clustered data. Therefore, testing only for the presence of ICS may not be enough for accurate comparison of outcome distributions from multiple groups in clustered data. On the other hand, [14] showed that statistical methods assuming the presence of IICGS for group-based comparisons can be less efficient or low-powered if applied to clustered data where intra-cluster group sizes are not informative. Hence, it is of utmost importance to test the existence of IICGS in clustered data before deciding upon the most appropriate inference procedure for group-based comparisons for that data. There exists no statistical method, in the current literature, for validating an IICGS claim. In this article, we formally introduce the condition for informative intra-cluster group size or IICGS through mathematical exposition, distinguish between ICS and IICGS, and propose bootstrap-based hypothesis testing for detecting IICGS in clustered data.
Ref. [15] first proposed the bootstrap resampling technique, which was later extended to a hypothesis-testing framework. By repeatedly resampling the original data, bootstrap techniques can assist in approximating the null distribution of a test statistic in the context of hypothesis testing. A thorough discussion of bootstrap techniques can be found in [16,17] provide some crucial guidelines for nonparametric bootstrap hypothesis testing for distribution-free inference. While bootstrap-based inference has been widely explored for independent observations, bootstrap techniques for clustered data are relatively less explored in the literature. This is mainly due to the challenges posed by the correlated nature of the observations and the arbitrary dependence structure in a cluster. Ref. [18] described bootstrap techniques that can be used to draw reliable conclusions from clustered data. Recently, [8] discussed a bootstrap resampling technique that can be implemented for testing a hypothesis involving an informative cluster size. In this article, we extend the approach of [8] to develop a bootstrap algorithm for testing whether the intra-cluster group sizes are informative.
The rest of the article is organized as follows. In Section 2, we formulate the concept of IICGS through mathematical notations and a hypothesis-testing framework. In this section, we also distinguish between ICS and IICGS, highlighting how IICGS can exist even without ICS. In Section 3, we propose a test statistic and the associated testing procedure for IICGS testing. Section 4 and Section 5 consist of simulated data results and applications to multiple real-life data sets, respectively. The article ends with a discussion in Section 6.
2. Formulation of Informative Cluster Size (ICS) and Informative Intra-Cluster Group Size (IICGS)
Let the total number of clusters be and a typical cluster have units. Therefore, is the cluster size for the cluster . We consider the possibility of being a random variable. Let be the outcome or response value of the unit in the cluster , where and . Thus, the information in the cluster can be represented through , while the entire data set consists of . Here, ; are assumed to be independently and identically distributed (iid). Suppose is the distribution function of the outcome of interest, . Here, we do not assume any particular distributional form of to keep the resulting inference robust. When the cluster size is not informative, i.e., the outcomes from a cluster are not associated with the corresponding cluster size, then we have , assuming within-cluster exchangeability. On the other hand, under an informative cluster size, , because is not independent of . Therefore, the null hypothesis for testing informative cluster size (ICS) can be written as
where a violation of , i.e., , would imply the existence of ICS. Ref. [8] developed a testing procedure to test this hypothesis.
Suppose we have an additional categorical covariate that induces multiple groups of observations in a cluster where units with the same categorical level of the covariate are said to belong to the same group. In this article, we focus on two-category or binary covariates that result in two groups of observations, noting that the extension to three or more categories is straightforward. Let be the binary group membership indicator of the unit in the cluster , i.e., or . Let be the number of units belonging to the group in the cluster , i.e., , where is either or , and is a binary indicator function. Here, and are the two intra-cluster group sizes for “group 0” and “group 1”, respectively, within the cluster . Note that , implying that the two intra-cluster group sizes add up to the cluster size. In our formulation, we assume the possibility of , and hence , being random quantities. Based on this binary grouping of units, we can now reformulate the outcomes in every cluster. Let be the outcome from group in the cluster, where and . Then, the cluster data can be partitioned into based on the two groups. Here, , where . Note that for , and are assumed to be independent even for the same group , while and can be correlated as they belong to the same cluster .
In the presence of two groups of observations, a popular mode of inference is to compare the outcome distributions from the two groups of units. Statistically, this could be achieved by testing whether or not. As indicated in [10], for this group-based comparison of outcomes in clustered data, multiple interpretations, or empirical analogies, of the “group-specific” marginal distribution function can be considered. These different interpretations depend on whether the outcome distribution depends on cluster size (ICS), intra-cluster group size (IICGS), or neither, with the possibility of producing different conclusions regarding the same data. Therefore, it is not enough to only test for the presence of ICS, and testing for informative intra-cluster group size (IICGS) could be more important for selecting the most appropriate distribution function interpretation for group-based comparison.
If we define the group-specific marginal distribution function to be for outcomes from group , then the informative intra-cluster group size, or IICGS, for group would be equivalent to the condition , as the outcome distribution from group in a typical cluster would depend on the intra-cluster group size . Therefore, the null hypothesis for the absence of IICGS for group can be represented as:
If the above hypothesis is true, then the conditional distribution of an outcome from group in any typical cluster , given the intra-cluster group size , is equal to the unconditional distribution of the outcome from group . This would mean that an outcome from group in a cluster is independent of its intra-cluster group size. Therefore, the group size, for group , is not informative in any cluster. On the other hand, a violation of the above hypothesis would lead to the conclusion that the outcome variable is associated with the intra-cluster group size, and, hence, the intra-cluster group sizes are informative. Therefore, rejecting would imply that there exists IICGS for group . Note that the existence of IICGS needs to be tested separately for group 0 and group 1 by individually testing for and , respectively. Despite the relationship , the validation or the rejection of the null hypothesis would not be enough to decide on the null hypothesis for any group . In fact, there exist possibilities that even if ICS is absent, IICGS may exist for one or more groups in the same data. As an example, consider the hypothetical situation where the cluster size is the same for all of the clusters in the data, i.e., for all . Then, the null hypothesis is trivially true, as the outcome variable is uncorrelated with the constant cluster size, and ICS does not exist. However, even in this case, the intra-cluster group size , for any cluster , can be a random quantity, with , while being associated with the outcome variable through a cluster-specific effect . Therefore, this situation would imply that is trivially true but is false and needs to be rejected. Such situations can persist even with random cluster sizes. On the other hand, for some clustered data with two groups, may be rejected for the group while not being rejected for the group or vice versa. This would imply the possibility of only one intra-cluster group size out of the possible two being informative of the outcome in the clustered data without indicating whether the cluster size, i.e., the sum of the two intra-cluster group sizes, can be considered informative for the same data. These interesting possibilities, to be explored in more detail in later sections, further highlight the limitation of a test for ICS and the need to develop a separate hypothesis-testing method for IICGS. In the next section, we focus on developing a procedure for testing the null hypothesis for and .
3. Test Statistic and Bootstrap-Testing Algorithm for IICGS
To test the null hypothesis against the alternative for a specific group or , we use the test statistic
which is similar to the Kolmogorov–Smirnov test statistic. Here,
and
Here, is an empirical distribution function for outcomes in group , which is a suitable estimator of the distribution function when the null is true, while is an alternative empirical distribution for outcomes in group , which is appropriate under IICGS, i.e., the alternative hypothesis [10]. In the construction of , all of the group units contribute equally, irrespective of their cluster membership, leading to unequal contributions from different clusters. Hence, a cluster with a larger intra-cluster group size would be overrepresented in compared to a cluster with a smaller intra-cluster group size. Under IICGS, this larger contribution from clusters with higher intra-cluster group sizes would bias the empirical distribution function towards larger or smaller values of the outcomes depending on the direction of association between the intra-cluster group size and the outcome from that group. Therefore, would not be an appropriate estimate of the population distribution function under IICGS. On the other hand, the contribution of any unit from group to the construction of the alternative depends on its cluster membership, as its contribution is weighted by the inverse of the group size in the cluster to which it belongs. Consequently, is obtained as the proportion of outcome values not exceeding in each of the individual clusters and by taking the average of these proportions over the clusters. Therefore, clusters with different intra-cluster group sizes are equally represented in , making an IICGS-adjusted empirical distribution function.
The original Kolmogorov–Smirnov test [19,20] was introduced as a nonparametric test that compares distributions using empirical distribution functions. While [21] has discussed the exact distribution of the Kolmogorov–Smirnov (K-S) test statistic, results of the asymptotic properties of the K-S test statistic have been limited to only certain specific choices of parametric distributions [22]. The challenge of working with a distribution-free K-S test in a general setting led [23] to propose permutation and bootstrap tests based on the K-S statistic to compare two distributions. This class of tests is highly adaptable, incorporating suggestions from [24,25] as well as encompassing tests that were not traditionally associated with the K-S framework. Most of the existing studies on the K-S test, including the ones referenced above, assume independent observations for the construction of the test statistic. In our study, the situation is more complicated due to the presence of correlated, specifically clustered observations. It is not feasible to obtain the exact sampling distribution of the test statistic analytically, even under the null hypothesis. Therefore, we extend the balanced bootstrap resampling method of [8] to approximate the null distribution of the test statistic and calculate the associated p-values. The detailed steps of the null bootstrap using a balanced bootstrap algorithm are described below.
Step 1: The test statistic is calculated separately for groups (0 or 1) and , based on the original clustered data. Here, , where is the set of all of the information for group obtained from the clusters. Note that , where and can be regarded as two sub-clusters, due to the two groups, in the cluster.
Step 2: Resample bootstrap samples, where the bootstrap sampling ) involves repeating the following steps.
- 2.1
- Permute the members belonging to the same group in a cluster. This creates permutated data, maintaining the original group membership of every unit in a cluster.
- 2.2
- Resample clusters from the permuted data by repeating the following for Draw a random cluster , where . One of the following three scenarios occurs.
- If and , then the sub-clusters within the cluster, for the bootstrap, are obtained as and . The corresponding bootstrap cluster is , with the same intra-cluster group sizes and .
- If but , i.e., one of the groups in the cluster has less members compared to the same group in the original cluster , then the deficiency in this intra-cluster group size is balanced by borrowing observations from the same group from another cluster with a “similar structure” for group to cluster . Then, the bootstrap sub-clusters are and , while the corresponding bootstrap cluster is .
- If and , i.e., both groups in the cluster have less members compared to the corresponding groups in the original cluster, then the deficiencies in and intra-cluster group sizes are balanced by borrowing observations from clusters and , respectively, having a “similar structure” for groups and to that of cluster . The bootstrap sub-clusters, then, become and , while the bootstrap cluster is .
Here, and are the indices of the clusters that are determined to have a “similar structure” to that of cluster for groups and , respectively, in terms of having a minimum distance. Mathematically, we have,
and = ; .
Step 3: Compute the p-value as
The balancing of the intra-cluster group sizes in bootstrapping step 2.2 preserves the intra-cluster group sizes of the original clusters in their resampled counterparts. This prevents the violation of the conditionality principle of by fixing for a group in cluster . Borrowing observations from minimum-distance clusters, to maintain the original intra-cluster group sizes in the resampled counterparts also allows for the preservation of the dependence structure largely under exchangeability. Moreover, the permutation in step 2.1 of the algorithm allows for different compositions of the resampled counterpart of an original sub-cluster in different bootstrap samples .
We can also extend the IICGS testing procedure to situations where more than two groups exist in every cluster. Suppose there are groups in each cluster . Then, the intra-cluster group sizes are …, such that the cluster size … . Then, we can use the same null hypothesis
for testing the IICGS in each group . If the value of is large, multiple testing correction, e.g., Bonferroni correction, can be applied. While most of the steps of the null bootstrap from the previously discussed balanced bootstrap algorithm remain similar under groups, an important generalization can be noted in step 2.2. Instead of three possible scenarios under binary grouping, we now consider () scenarios in step 2.2 to match the resampled version of the clustered data sample with the original version of the clustered data sample.
4. Simulation Studies
In this section, we examine the performance of our proposed bootstrap test through empirical size (type-I error rate) and power (1-type-II error rate) computations in multiple simulated clustered data settings with IICGS. In each of these settings, we also investigate how ICS may or may not be present despite IICGS, and the results based on the test for ICS [8], henceforth referred to as the ICS test, are explored and contrasted with our proposed test results. For each of the simulated scenarios with IICGS, we vary the number of clusters () to highlight the changes in power performances of the tests with increasing number of clusters. The results shown in this section for the bootstrap tests are based on a bootstrap sample size () of 1000, although a smaller bootstrap sample size of 500 was also investigated, which resulted in nearly similar outputs. The empirical size and the power of each of the tests under study are calculated based on 500 Monte Carlo iterations. The nominal size or the target type-I error rate is 0.05 in every case.
4.1. Simulation Setting I
In this simulation setting, we consider clustered data where the cluster size for each cluster is randomly distributed. Specifically, , the cluster size for a cluster , is generated as , where , independently for . Then, given , we generate the intra-cluster group size for group 1, i.e., , as a random variable from a binomial distribution, where )). This immediately implies the other intra-cluster group size to be . The response or the outcome variable from group in cluster is generated through a random effects model as ; Here, , and , independently, which allows the distribution of the outcome variable to differ between group 0 and group 1. We generate as a random cluster effect such that , independently for , while being related to through the equation . Here, is a constant. Here, we have considered only a small mean difference between the distributions of the outcome variable from the two groups based on the small mean difference between and . This is because the proposed test is aimed at testing the informativeness of the intra-cluster group sizes, rather than testing actual group differences. Note that the proposed IICGS testing method can be used as pre-analysis before embarking on a group-based comparison of outcomes in clustered data.
Therefore, in this simulated clustered data, the intra-cluster group size for a specific group in a cluster is associated with the outcome variable from that group and that cluster through the random cluster effect , although such an association does not exist between the cluster size and the outcome variable for the same cluster. This is a scenario where IICGS exists in clustered data but ICS does not. Note that the constant is a key factor influencing the strength of the association between intra-cluster group size and the outcome, where larger values of tend to produce a stronger association or greater informativeness of the intra-cluster group size. We considered several values of , namely, , to explore the power curve of the tests. Here, implies , i.e., no association between and , and, hence, no IICGS. All other values of would lead to IICGS, with varying degrees of informativeness. In addition to the varying choices for , we considered different values of the number of clusters () to investigate the small and large sample performances of the proposed test.
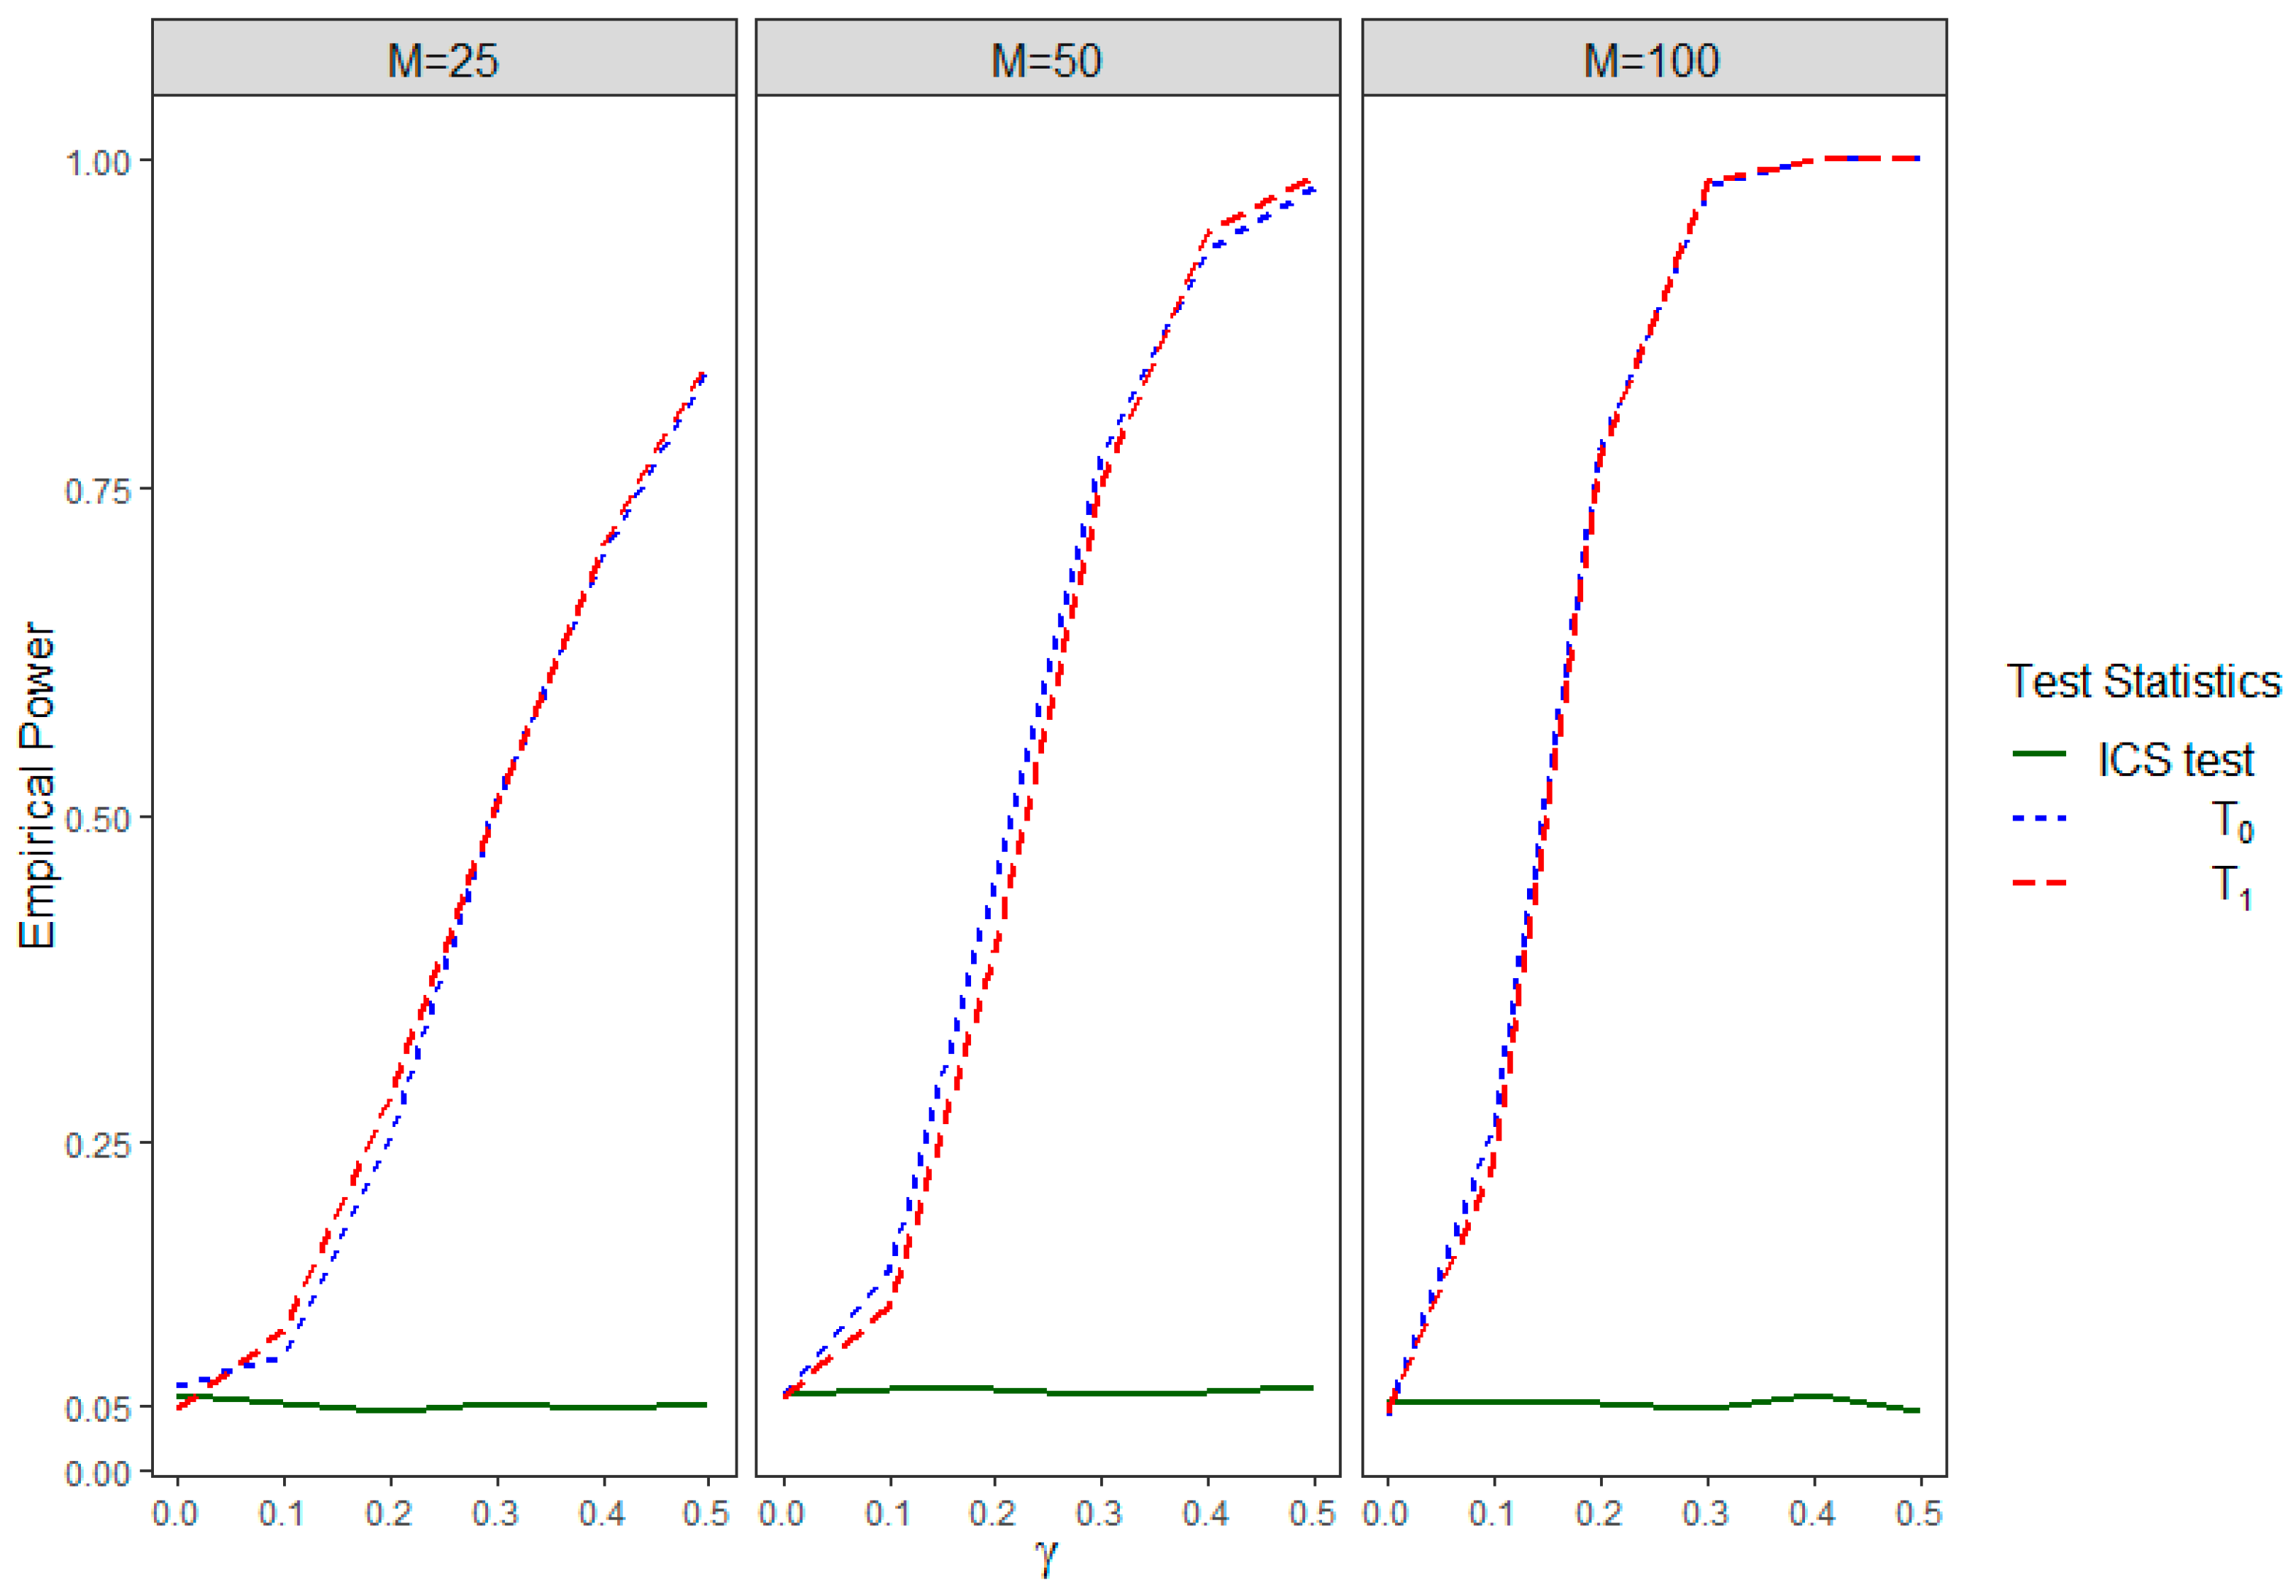
Table 1 shows the empirical rejection rates of the two test statistics, and , corresponding to the two groups, under , i.e., under the null hypothesis condition for both and . We observe that these empirical rejection rates under the null condition are close to 0.05 for all of the tests. This is true for small (), moderate (), and large () number of clusters. Therefore, the proposed tests closely maintain the nominal significance level of 0.05. Figure 1 shows the empirical power curves for our proposed IICGS test statistics, and , corresponding to the two groups. This figure also shows the behavior of the ICS test in this simulated setting. The power of and increase with increases in the values until they reach the maximum power of 1. Therefore, the power of our proposed test increases with the increase in the informativeness of the intra-cluster group sizes. Also, for any fixed value of , we see that the powers of both and tend to increase with the increase in the number of clusters (). On the other hand, the power curve for the ICS test starts around 0.05, corresponding to , but it remains mostly constant around this value of 0.05, even with the increase in the value of . In other words, the ICS test does not have the power to detect the existence of IICGS, and it is powerless even under the increasing informativeness of the intra-cluster group sizes. This behavior of the ICS test is, however, not surprising, and it is rather consistent with the fact that the ICS test only looks to test the null and not the null . Therefore, the results from this simulation scenario demonstrate that the ICS test cannot capture the informativeness of groups sizes within a cluster and, our proposed test is needed for accurate and complete identification of the IICGS.

Table 1.
Table showing the empirical rejection rates under the null for and for different values of the number of clusters (M) with the nominal level of significance being 0.050.
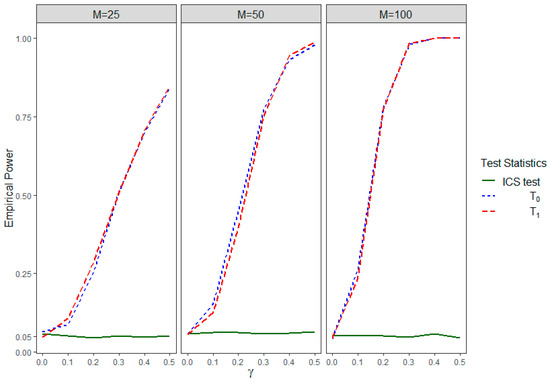
Figure 1.
Empirical power of , , and the ICS test for different values of and different numbers of clusters () in Simulation Setting I.
4.2. Simulation Setting II
In this simulation setting, we first generate the two random intra-cluster group sizes, and , independently, for a cluster . Here, the intra-cluster group size from group 0, , is generated as , where distribution independently for . The random cluster effect is generated as a variable, while is a constant value, as before. The other intra-cluster group sizes are generated in such a way that some of the clusters may not have observations from group 1, i.e., for some . This is achieved by generating and, subsequently, , where is a binary indicator function taking value 1 if is true or 0 otherwise. The clusters with only one of the two possible groups are known to have incomplete intra-cluster group structures (Dutta and Datta, 2016). In this setting, the outcome variable from group in cluster is generated through the same random effects model as ; , where and independently. An outcome from a specific group in a cluster is associated with the corresponding intra-cluster group size through the cluster effect . Therefore, we have IICGS for both groups 0 and 1 in this data. Moreover, in this setting, the cluster size is also associated with the outcome variable, since is the sum of two independently generated and , each of which is associated with the outcome variable from the respective groups. Therefore, we have clustered data where the cluster size, in addition to the intra-cluster group sizes, are correlated with the outcome. This is a scenario where both ICS and IICGS exist.
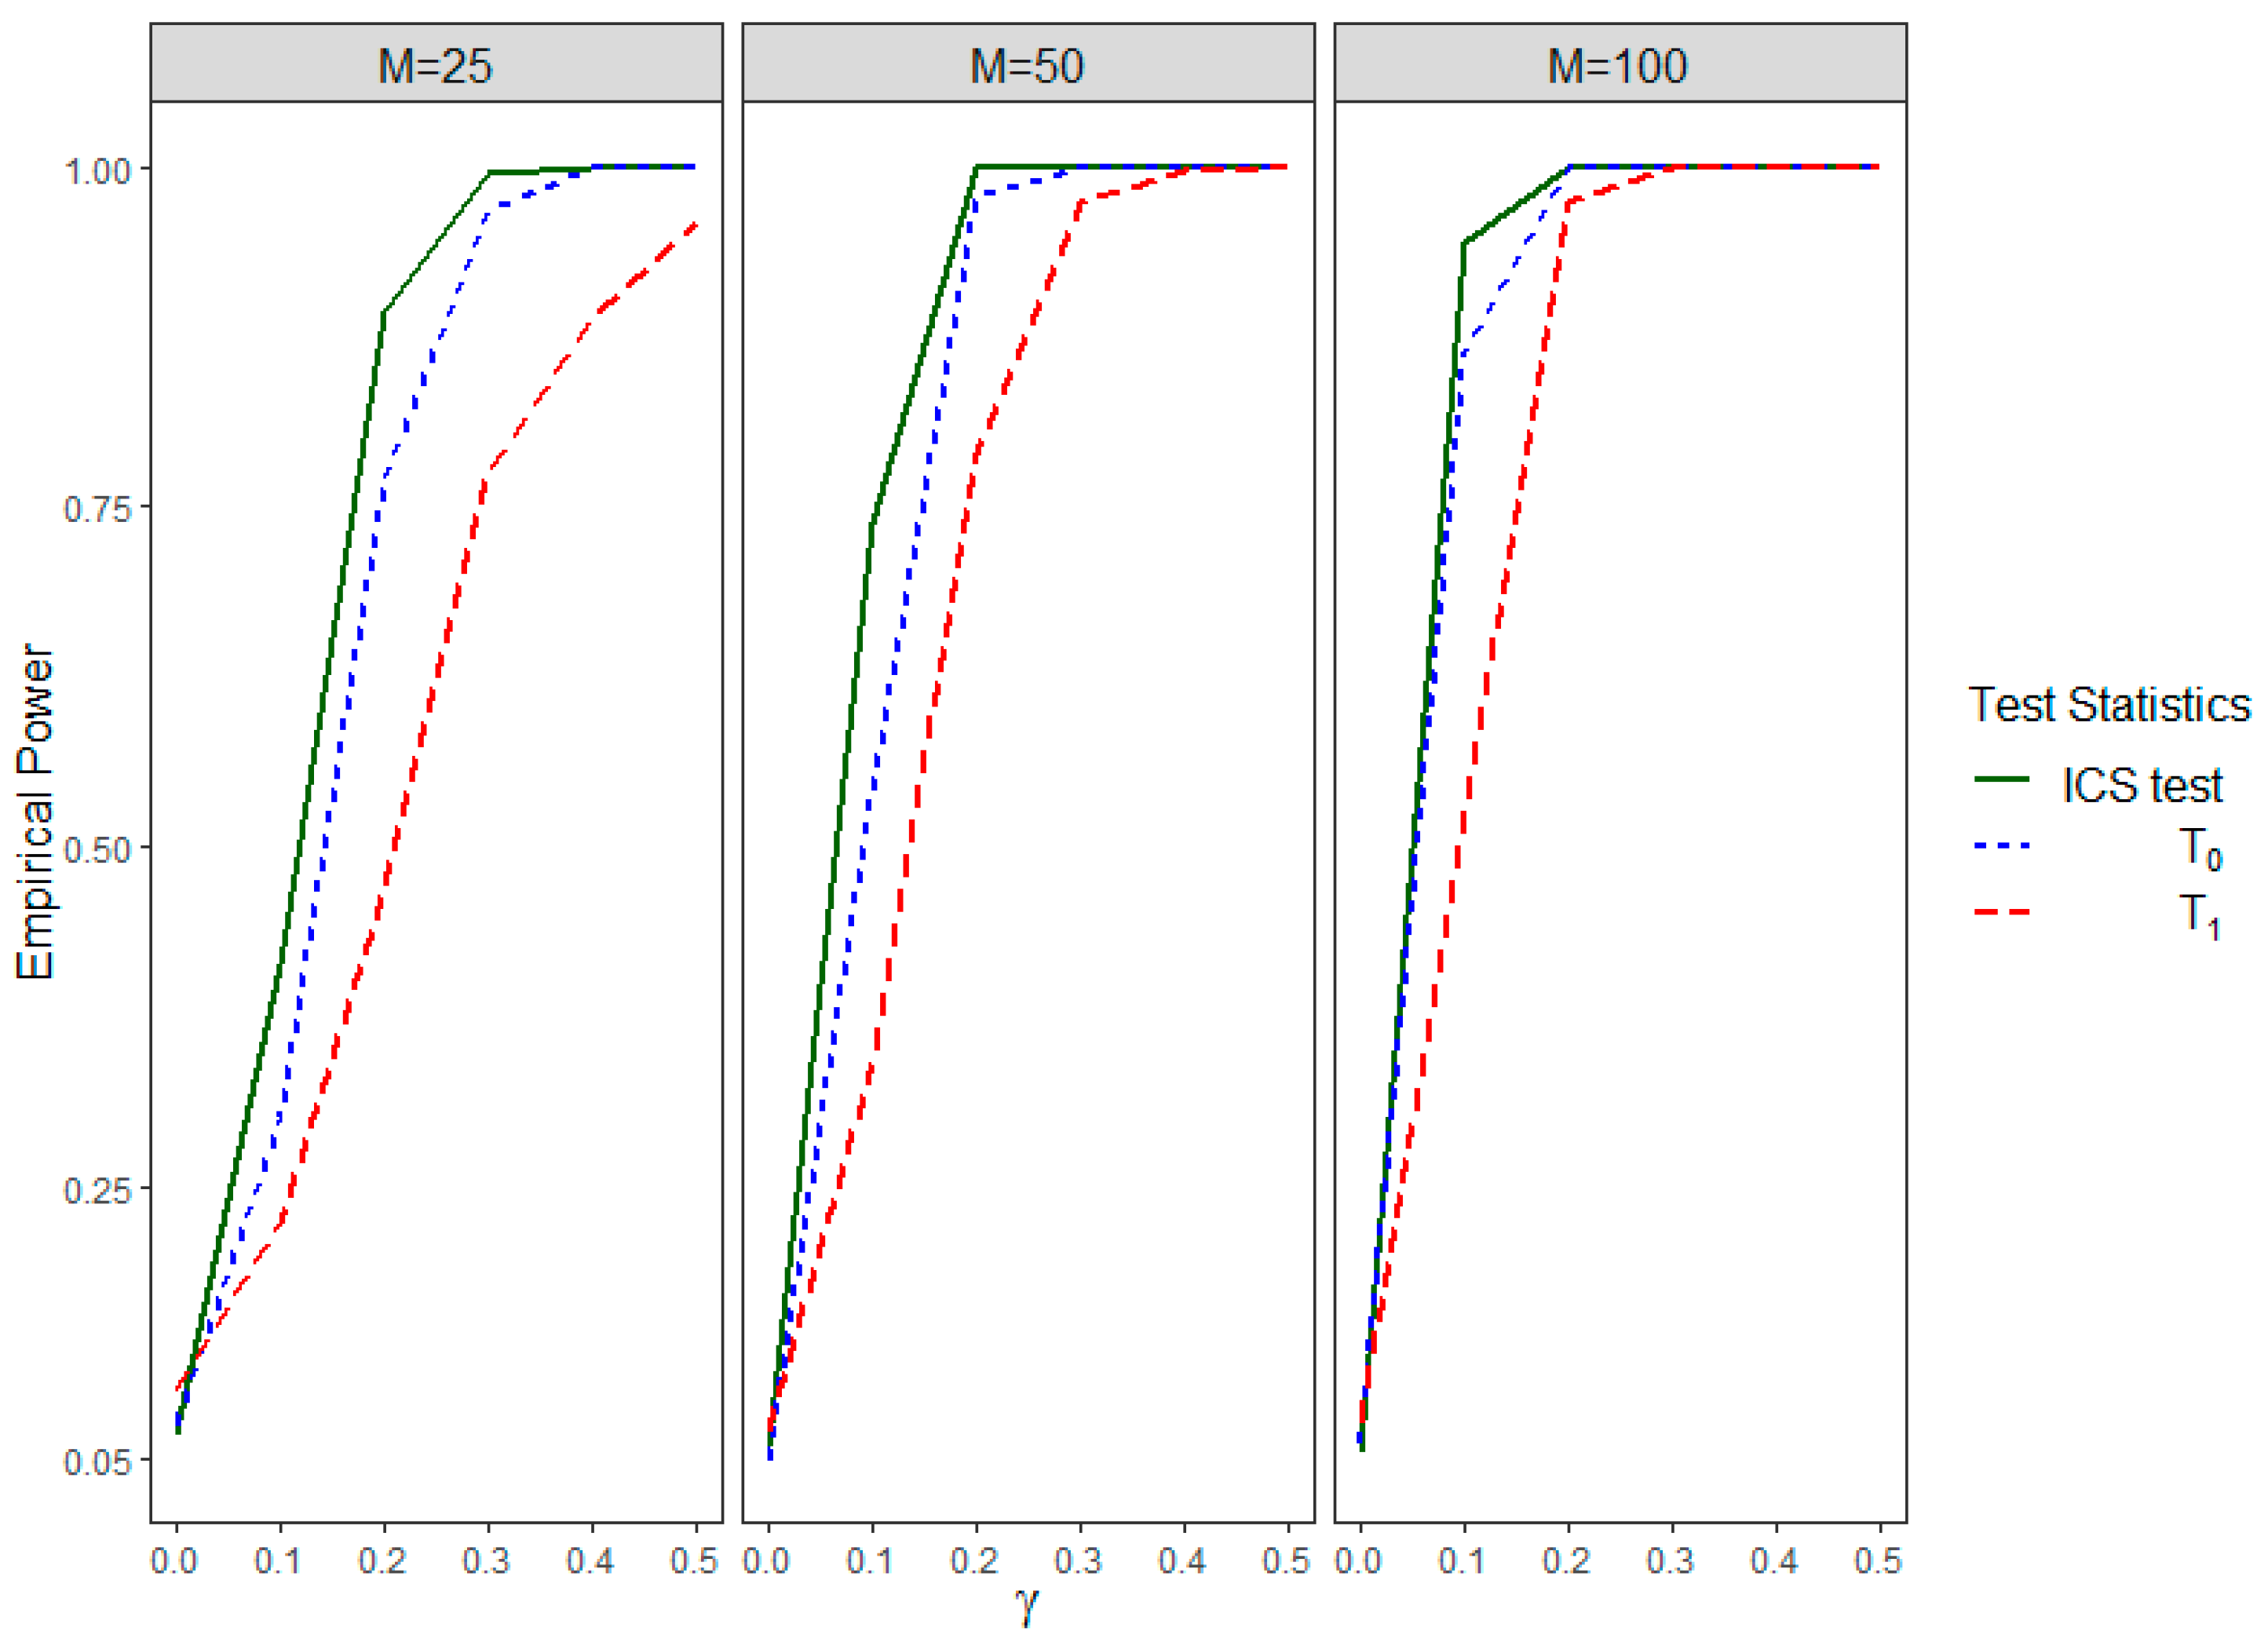
Figure 2 shows the power curves for the IICGS tests, i.e., and , and the ICS test for different numbers of clusters. All of the tests closely maintain the nominal significance level of 0.05 as the empirical power values of all of the tests are around 0.05 for , which is equivalent to both null hypotheses of no ICS () and no IICGS (). With the increase in the strength of association (), the power values of the ICS test and the IICGS tests for both groups 0 and 1 tend to increase. The power curves of all of the tests also increase with the increase in the number of clusters (). In cases of small and moderate , the power of is higher than that of for most values, which may be attributed to the fact that is based on a smaller number of clusters, as some of the clusters have missing group 1 observations. Overall, this set of results suggests that both the ICS and the IICGS tests can be powerful in detecting informativeness for the same clustered data, although the nature of the informativeness tested by them is different.
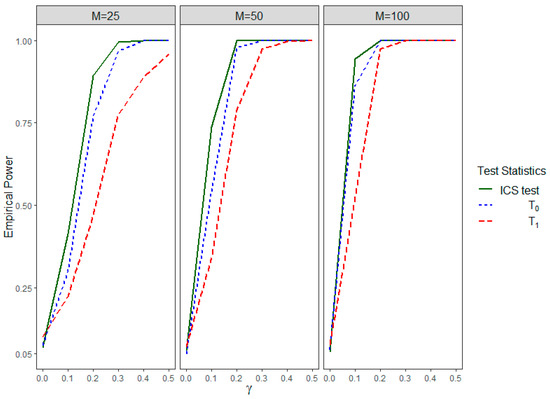
Figure 2.
Empirical power of , , and the ICS test for different values of and different numbers of clusters () in Simulation Setting II.
4.3. Simulation Setting III
In this simulation setting, we generate the two random intra-cluster group sizes, and , independently for a cluster . Here, the intra-cluster group size from group 1, , is generated as distribution independently for . The other intra-cluster group size is generated as . The cluster-specific random effect is generated as a variable, while is a constant, as before. The cluster size, , for a cluster is obtained as . The outcome variable from group in the cluster is generated through the model ; , where the distributions of and are similar to the previous simulation settings. Hence, the group 1 intra-cluster group size in a cluster is associated with the outcome from that group in the same cluster through the cluster-specific random effect . However, there is no such association between the other intra-cluster group size, , and the outcome variable from group 0 in the same cluster, as evidenced by the distribution of . Therefore, these clustered data represent a scenario where only one group (group 1) exhibits an informative intra-cluster group size while the other group (group 0) does not.
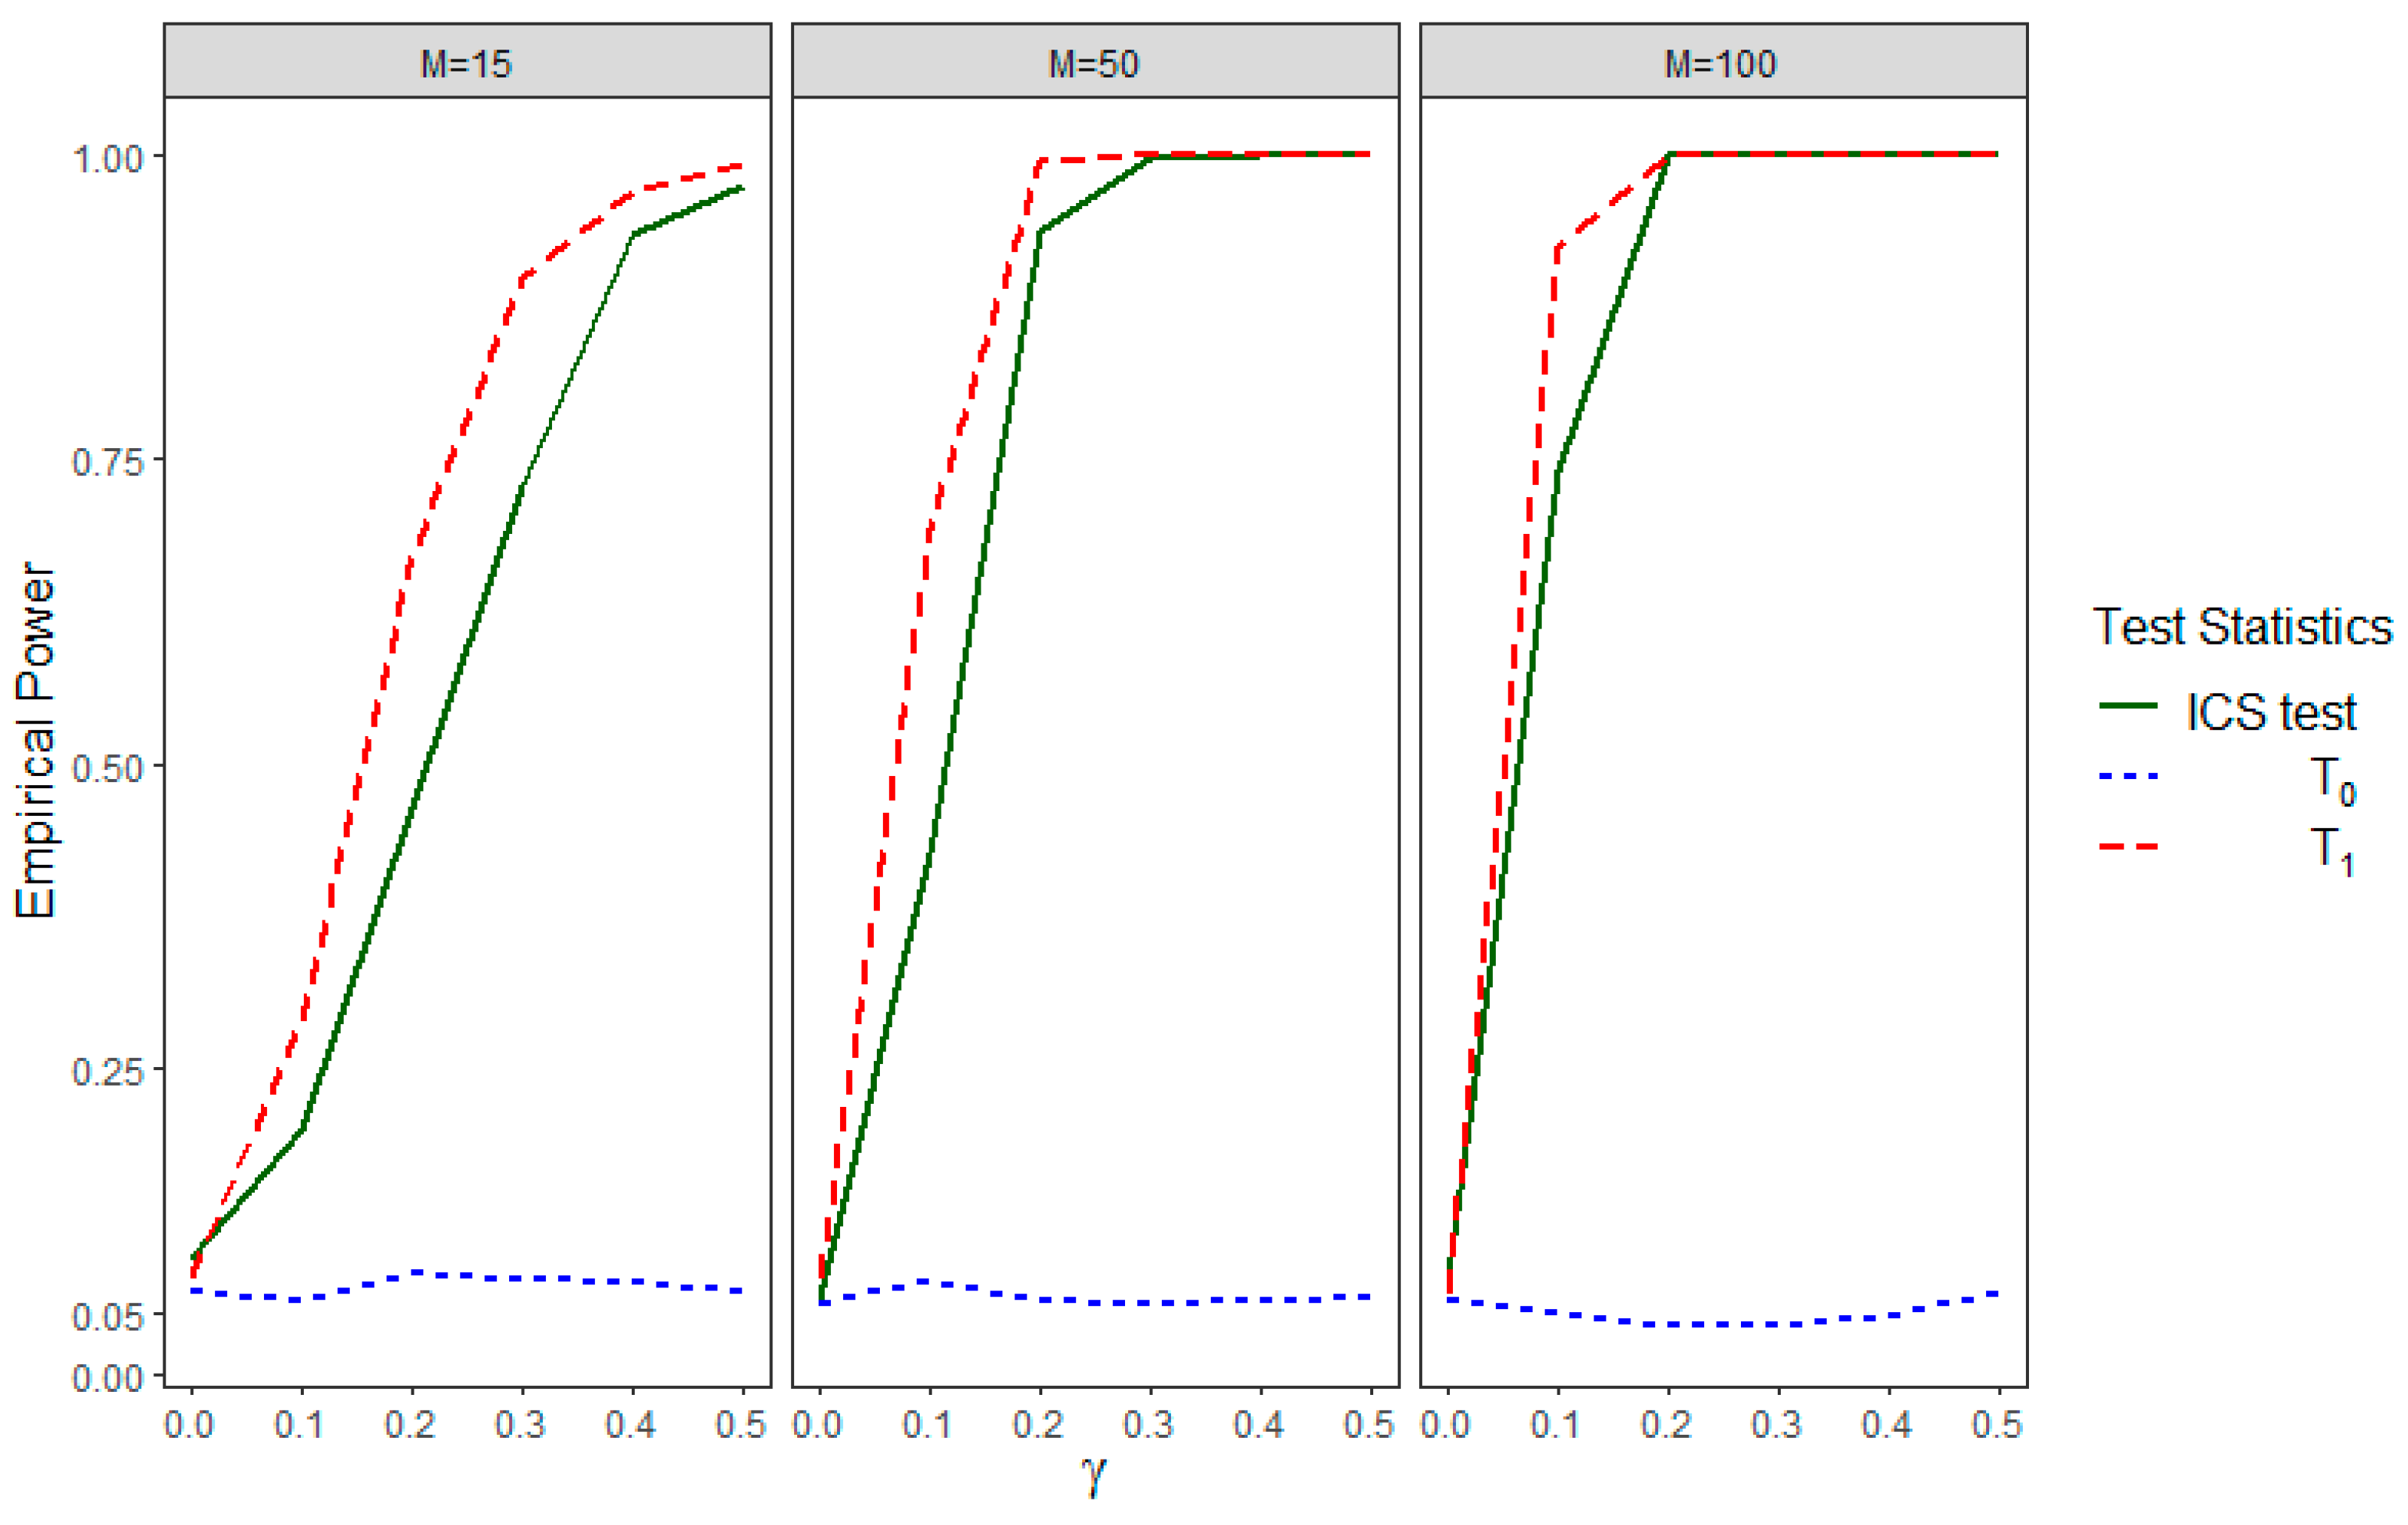
Figure 3 shows the empirical power performance for both IICGS tests, and , as well as that of the ICS test for different choices of and . Under , which is equivalent to both null hypotheses of no ICS and no IICGS, we find the empirical power of all three test statistics to be near 0.05. This implies that all of the tests maintain the nominal level of significance of 0.05. However, the power curve of tends to be constant around the value 0.05, while the power of rapidly increases with the increase in the values. This is because the null hypothesis of IICGS for group 0, i.e., , is actually true, and the corresponding IICGS test statistic is making the correct inference by not rejecting the null hypothesis. On the other hand, the null hypothesis of IICGS for group 1, i.e., , is false, and the group 1 IICGS test statistic is rejecting with high power depending on , the parameter for the strength of informativeness. Interestingly, the ICS test shows power in this setting indicating that the null hypothesis of no ICS () is being rejected. But, the power of the ICS test remains substantially lower than that of for the same value of , especially under small () to moderate () numbers of clusters. This may be due to the fact that , being the sum of and , has its strength of informativeness reduced, as one of the components is uninformative for the outcome. As a result, the ICS test can be less powerful than the IICGS test of the informative group when the other intra-cluster group size is uninformative.
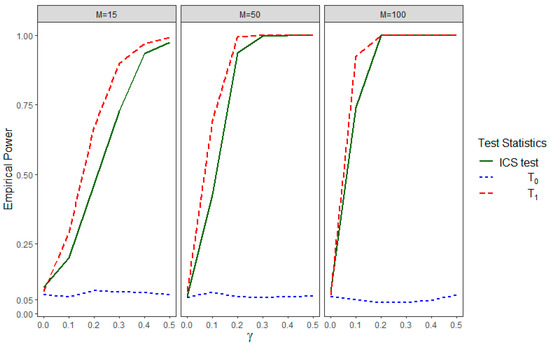
Figure 3.
Empirical power of , , and the ICS test for different values of and different numbers of clusters () in Simulation Setting III.
5. Real Data Applications
5.1. Students’ Academic Success Data
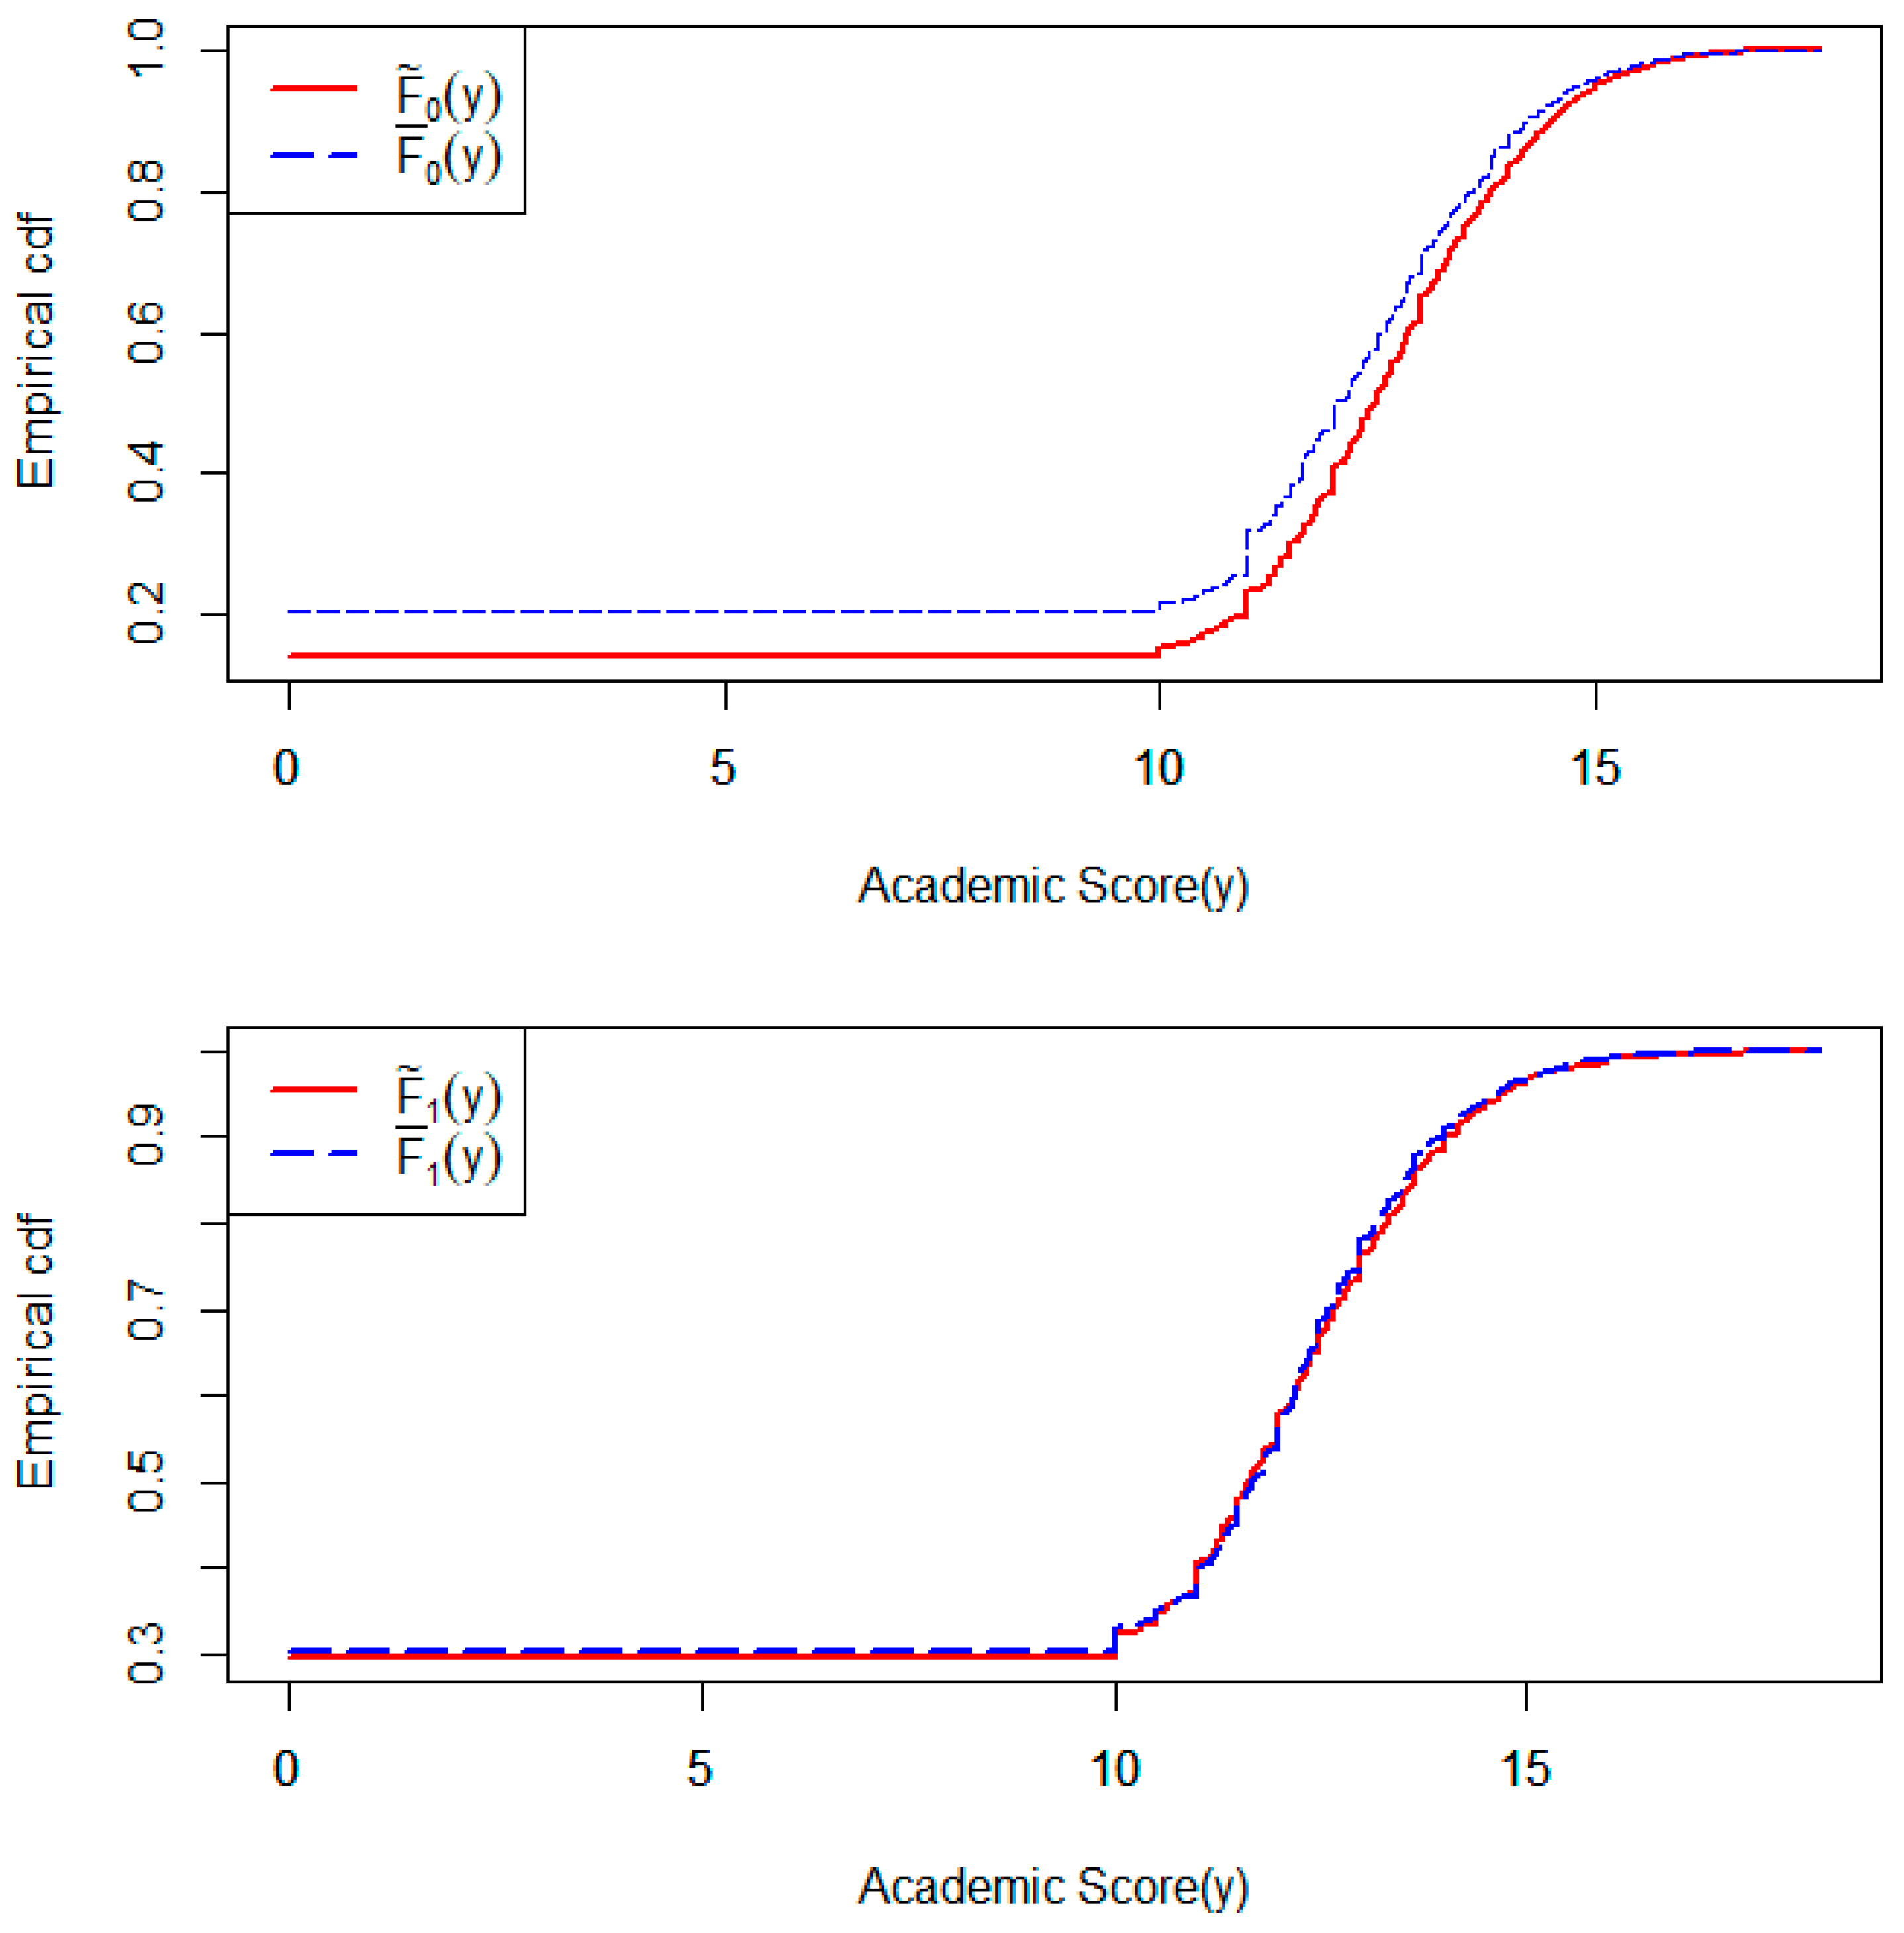
Ref. [26] compiled a dataset consisting of enrollments, academic performances, and dropout information of students from 17 undergraduate degree programs in a higher education institute in Portugal. This dataset also includes information on demographic, socioeconomic, and macroeconomic variables of the students under study, with the aim of understanding the factors majorly contributing to students’ successful degree completion. The academic performance data were recorded for all of the students enrolled in the degree programs from the academic year 2008–2009 to the year 2018–2019. In each of the degree programs, male and female students were enrolled. The comparison between the overall academic performances of these two gender groups tends to be a popular mode of analyzing these data to make inferences about students’ success based on gender. However, an important factor that needs to be considered in such a comparison is that the number of students from a specific gender group remaining in a degree program, after potential dropouts in the first few semesters, may be associated with the academic performance of that gender in that degree program. In that case, a prior analysis is needed to investigate whether the present number of students belonging to a specific gender is informative about the academic performance of that gender in a degree program. This can be performed using our proposed testing method for IICGS by considering each of the 17 degree programs as a separate cluster and gender as the intra-cluster grouping factor. We have considered the academic scores (grades) at the end of the second semester as the outcome for our analysis. We have applied our test separately for the two gender groups, female and male. The p-value obtained from our IICGS test for the female group was 0.078, while the same test applied on the male group generated a p-value of 0.739. Therefore, we obtain contrasting results from the two gender groups. The association between the number of females in a typical undergraduate degree program and their academic performance appears to be marginally significant, whereas no such association exists for the male students in the same degree programs. This is further supported by the upper panel of Figure 4, which shows that the two empirical distribution functions and , discussed in Section 3, are substantially different, with representing the female group. Here, appears to be stochastically larger than when programs (clusters) with higher numbers of female students tend to have better academic performance from the females. However, the lower panel of the same figure shows that and , where denotes the male group, are identical, indicating no informativeness of the intra-cluster male group sizes. Moreover, we considered the total number of students, male and female combined, in a degree program as the cluster size to check if the cluster size was informative for the students’ success outcome. Application of the ICS test for this purpose generated a p-value of 0.141. Therefore, the ICS test could not identify any strong evidence of informativeness of the cluster size. These results highlight a possible real-life extension of our simulation setting III, where only one intra-cluster group size is informative and the ICS test may not be powerful enough to detect any informativeness of the cluster size.
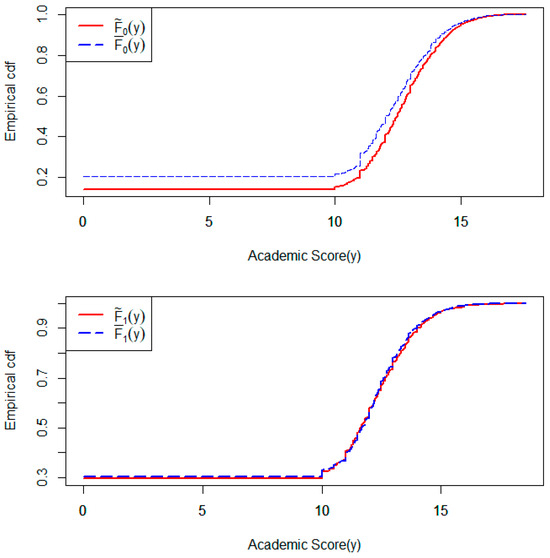
Figure 4.
Empirical cumulative distribution functions (cdf) and for academic scores in females () and males (). The upper panel is for the females and the lower panel is for the males.
5.2. Rat Pup Data
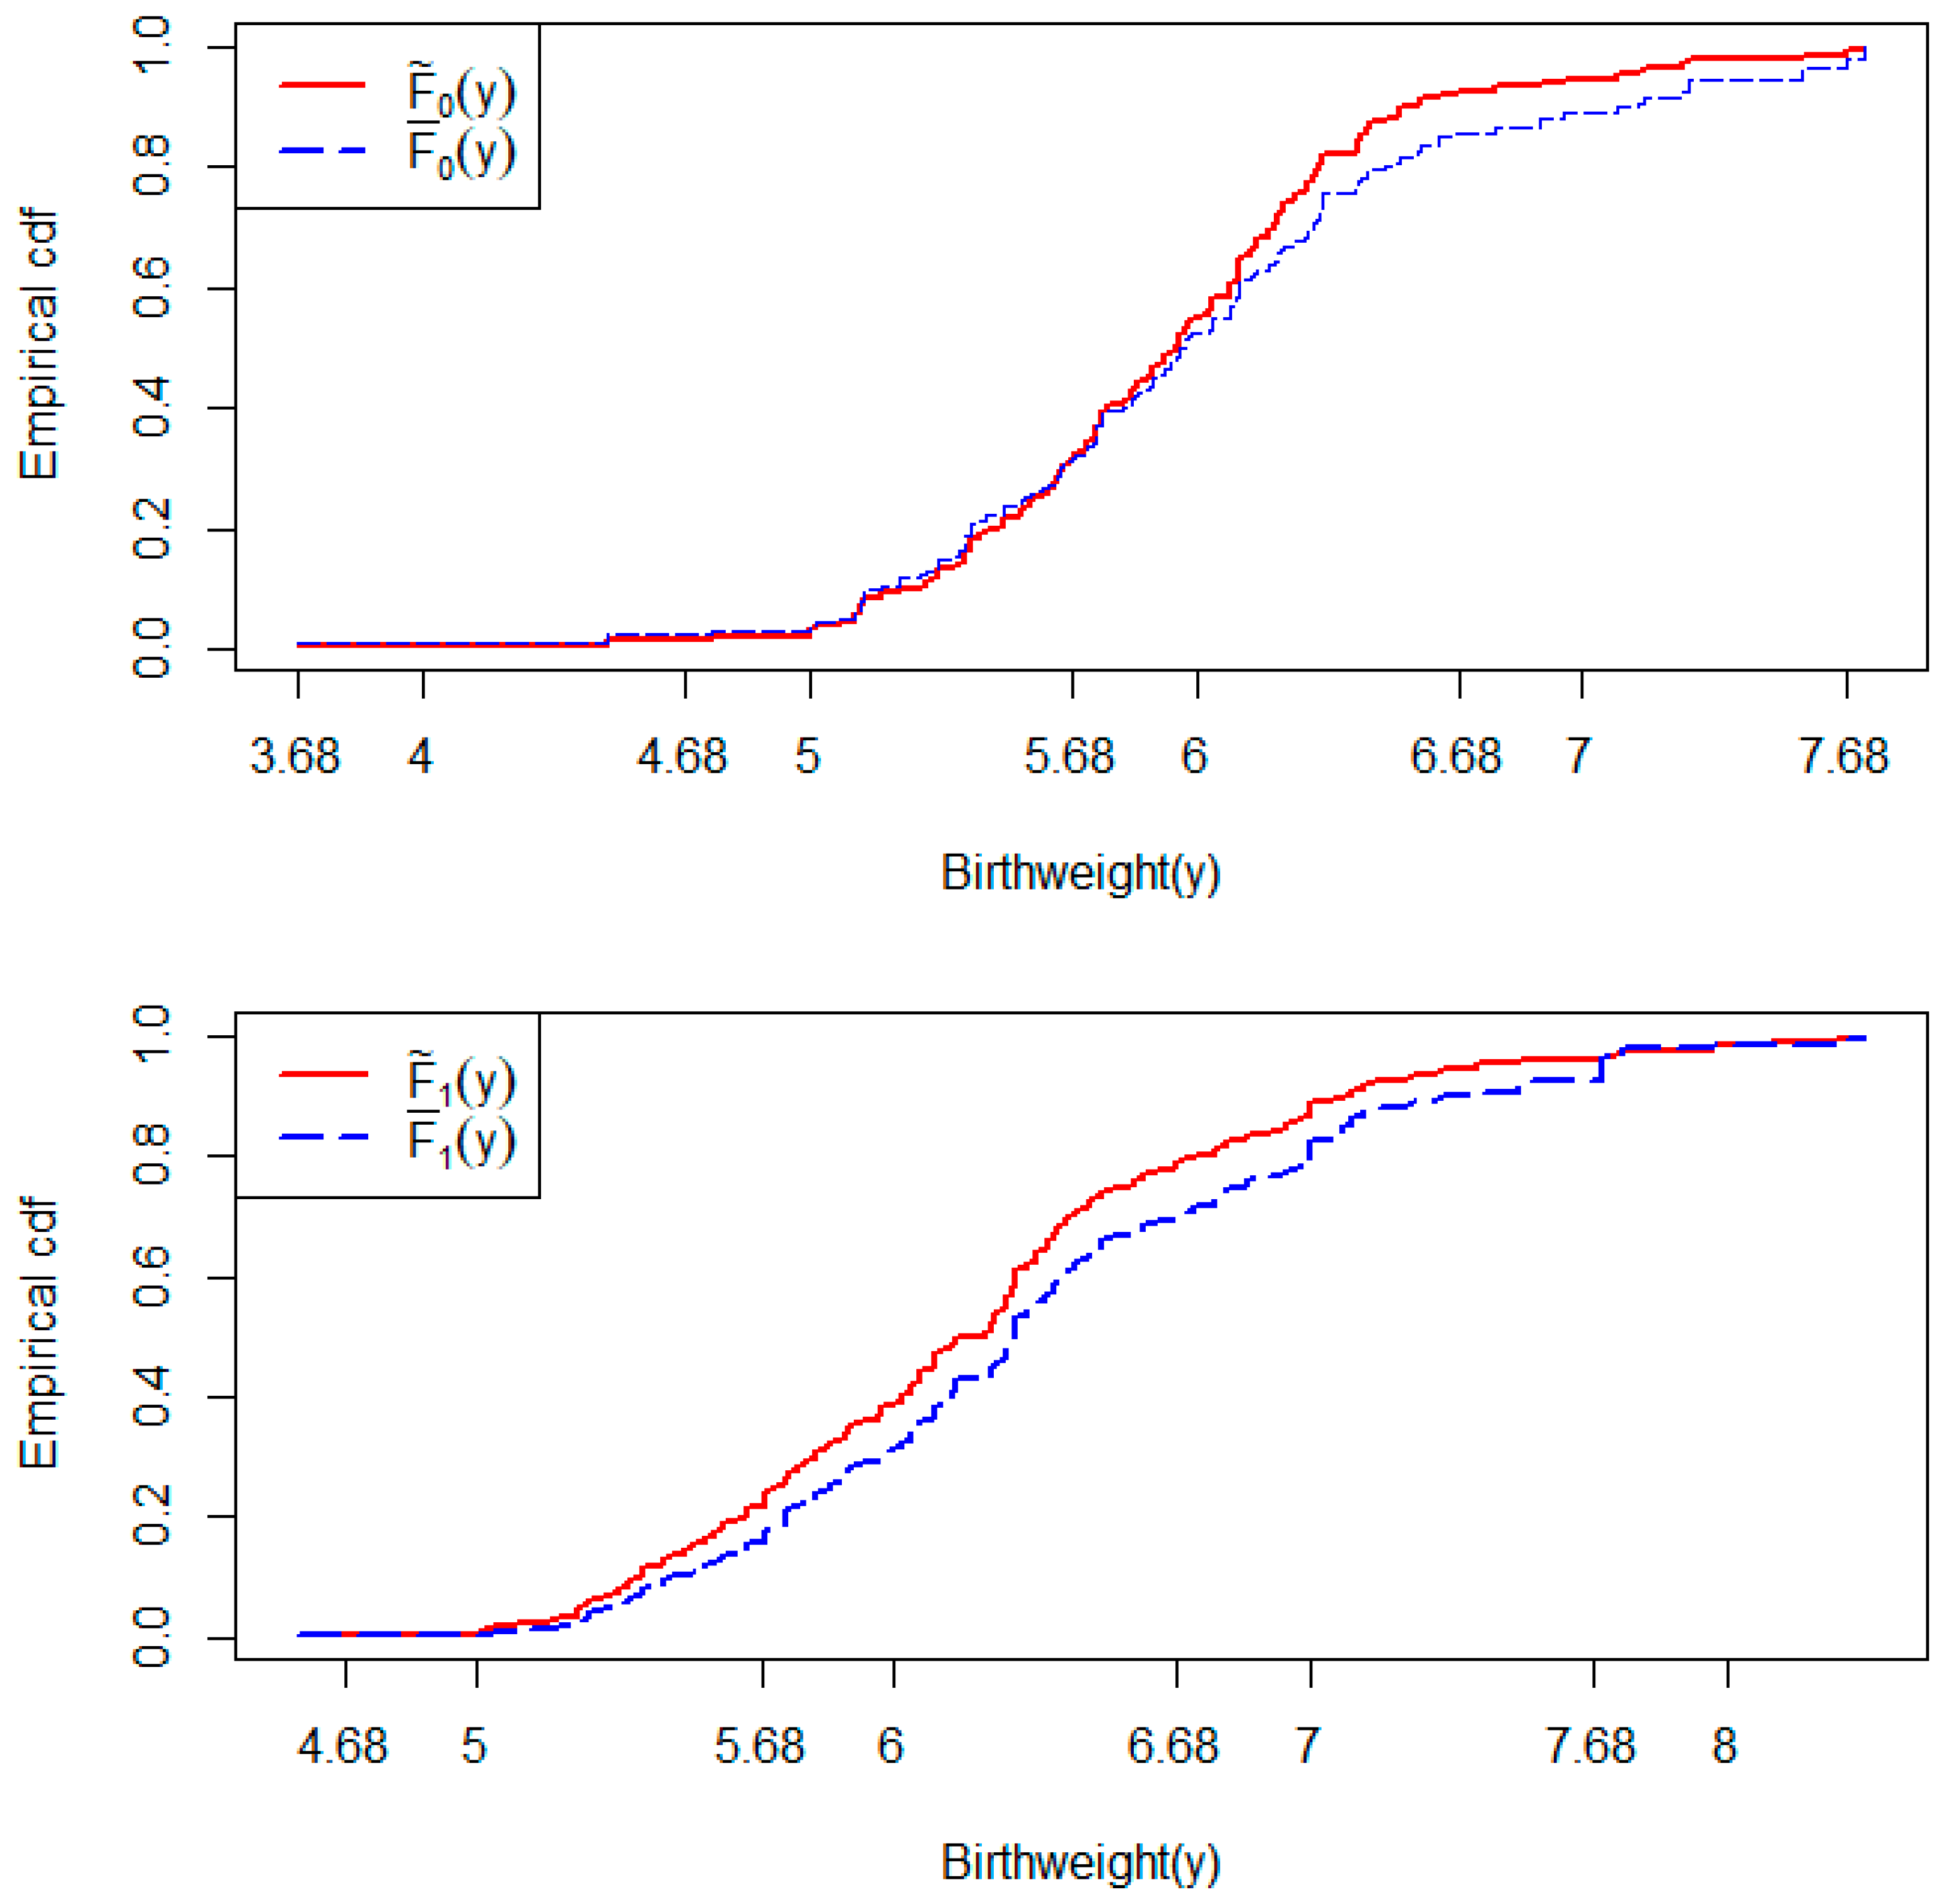
This data [27] provides details from a study of 27 female rats who were under a treatment before giving birth to rat pups. The main outcome of interest is the birthweight of the rat pups. The data can be expressed in a clustered data format where a litter, or a mother rat, is a cluster and the rat pups born to the same mother (same litter) are units within the same cluster. When the comparison between the birthweights of male and female pups is an aim of the study, the number of male and female pups born in a litter (cluster) can play an important role. This is because the birthweights of pups from a specific gender group can be associated with the number of same-gender pups born in the same litter. Therefore, if we consider the gender of a newborn pup as a binary grouping factor, then the number of male pups and the number of female pups in a litter are the two intra-cluster group sizes that can be hypothesized to be associated with the outcome of birthweight. This would be equivalent to hypothesizing IICGS for the data, and, to test IICGS, we used our proposed method separately for female and male groups. While all of the litters had male pups, there was one litter with no female pups. The p-value obtained from the IICGS test for the female group was 0.015, while the same IICGS test p-value for the male groups was 0.068. These indicate that both male and female intra-cluster group sizes are significantly associated with the birthweights from the respective groups, even if that significance is marginal for the male pup group. This is further supported by the upper and lower panels of Figure 5, which show that the two empirical distribution functions and are substantially different in female and male groups.
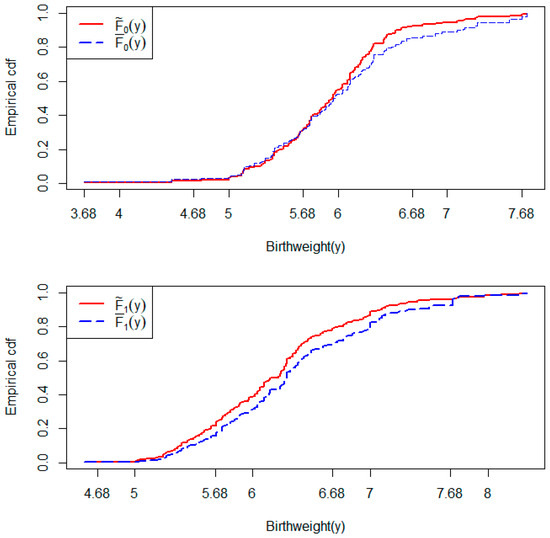
Figure 5.
Empirical cumulative distribution functions (cdf) and for birthweight in females () and males (). The upper panel is for the females and the lower panel is for the males.
Now, if we consider the total number of pups, including both males and females, born in a litter as the cluster size, then we can also test whether the cluster size is informative for this data. We applied the ICS test for this, which generated a significant p-value of 0.001. Therefore, the number of rat pups in a litter, i.e., the cluster size, also turned out to be informative for this data. This is a real-life example of our simulation setting II, where ICS and IICGS can exist simultaneously in the same clustered data.
6. Discussion
In this article, we have focused on a complicated scenario of informative intra-cluster group size (IICGS), which has been less explored in the literature of clustered data analysis. While some recently developed methods for clustered data do assume the presence of IICGS, there is no known method for statistically validating or testing the presence of IICGS in clustered data. Therefore, we proposed a nonparametric statistical test for IICGS. Moreover, we showed that an existing test for informative cluster size (ICS), developed by [8] is not enough to detect IICGS, as it is unable to capture group-based informativeness. This further highlights the utility of our developed method, as it fills an existing gap in the literature of clustered data methods. Through simulated and real-life data examples, we have shown how IICGS can occur in conjunction with, or even in the absence of, ICS. We have also evaluated the proposed nonparametric hypothesis-testing method in terms of its accuracy in detecting IICGS in clustered data.
In the proposed test statistic, we have used an extended version of the Kolmogorov–Smirnov type test statistic, which has the advantage of being robust to the choice of the alternative hypothesis without being limited to a specific alternative (e.g., a shift in location or a change in scale of the distribution). While this article, including, specifically, the IICGS testing method, focuses on a two-group outcome scenario derived from a binary covariate in clustered data, extension to the situation of a multi-category covariate leading to multi-group outcomes in the same cluster is relatively straightforward.
In most of the simulated or real data examples covered in this article, the intra-cluster group sizes were treated as random variables that can assume a large number of possible values. While this situation is very commonly encountered in clustered data, as indicated before, there can be an alternative situation where the intra-cluster group sizes, although random, can assume only a few unique values. The hypothesis-testing method discussed in this article can still maintain the nominal level and have reasonable power in detecting IICGS. However, in that situation, there could exist other test statistics, e.g., the multi-sample Cramér von Mises test statistic [28], that can be possible alternatives to our Kolmogorov–Smirnov-type test statistic in producing powerful inference. In the future, we plan to investigate the performances of such alternative test statistics in clustered data with only a few unique intra-cluster group sizes.
Author Contributions
Conceptualization, S.D.; methodology, S.D. and H.K.W.S.; software, H.K.W.S.; formal analysis, H.K.W.S.; writing—original draft preparation, H.K.W.S.; writing—review and editing, S.D.; supervision, S.D. All authors have read and agreed to the published version of the manuscript.
Funding
This research received no external funding.
Data Availability Statement
The Students’ Academic Success Data is available through https://archive.ics.uci.edu/dataset/697/predict+students+dropout+and+academic+success. The Rat Pup Data is available from the authors upon reasonable request.
Acknowledgments
The authors would like to thank all of the reviewers for their constructive and thoughtful comments, which have led to an improved manuscript.
Conflicts of Interest
The authors declare no conflict of interest.
References
- Williamson, J.M.; Datta, S.; Satten, G.A. Marginal analysis of clustered data when cluster size is informative. Biometrics 2003, 59, 36–42. [Google Scholar] [CrossRef] [PubMed]
- Benhin, E.; Rao, J.N.K.; Scott, A.J. Mean estimating equation approach to analyzing cluster-correlated data with nonignorable cluster sizes. Biometrika 2005, 92, 435–450. [Google Scholar] [CrossRef]
- Seaman, S.; Pavlou, M.; Copas, A. Review of methods for handling confounding by cluster and informative cluster size in clustered data. Stat. Med. 2014, 33, 5371–5387. [Google Scholar] [CrossRef] [PubMed]
- Datta, S.; Satten, G.A. Rank-sum tests for clustered data. J. Am. Stat. Assoc. 2005, 100, 908–915. [Google Scholar] [CrossRef]
- Datta, S.; Satten, G.A. A Signed-Rank Test for Clustered Data. Biometrics 2008, 64, 501–507. [Google Scholar] [CrossRef] [PubMed]
- Nevalainen, J.; Datta, S.; Oja, H. Inference on the marginal distribution of clustered data with informative cluster size. Stat. Pap. 2014, 55, 71–92. [Google Scholar] [CrossRef] [PubMed]
- Dutta, S. Robust Testing of Paired Outcomes Incorporating Covariate Effects in Clustered Data with Informative Cluster Size. Stats 2022, 5, 1321–1333. [Google Scholar] [CrossRef]
- Nevalainen, J.; Oja, H.; Datta, S. Tests for informative cluster size using a novel balanced bootstrap scheme. Stat. Med. 2017, 36, 2630–2640. [Google Scholar] [CrossRef] [PubMed]
- Huang, Y.; Leroux, B. Informative Cluster Sizes for Subcluster-Level Covariates and Weighted Generalized Estimating Equations. Biometrics 2011, 67, 843–851. [Google Scholar] [CrossRef]
- Dutta, S.; Datta, S. A Rank-Sum Test for Clustered Data When the Number of Subjects in a Group within a Cluster is Informative. Biometrics 2016, 72, 432–440. [Google Scholar] [CrossRef]
- Gregg, M.E.; Datta, S.; Lorenz, D. A log rank test for clustered data with informative within-cluster group size. Stat. Med. 2018, 37, 4071–4082. [Google Scholar] [CrossRef] [PubMed]
- Anyaso-Samuel, S.; Datta, S. Adjusting for informative cluster size in pseudo-value-based regression approaches with clustered time to event data. Stat. Med. 2023, 42, 2162–2178. [Google Scholar] [CrossRef] [PubMed]
- Gregg, M.; Datta, S.; Lorenz, D. Variance estimation in tests of clustered categorical data with informative cluster size. Stat. Methods Med. Res. 2020, 29, 3396–3408. [Google Scholar] [CrossRef] [PubMed]
- Dutta, S.; Datta, S. Rank-based inference for covariate and group effects in clustered data in presence of informative intra-cluster group size. Stat. Med. 2018, 37, 4807–4822. [Google Scholar] [CrossRef] [PubMed]
- Efron, B. Bootstrap Methods: Another Look at the Jackknife. Ann. Stat. 1979, 7, 569–593. [Google Scholar] [CrossRef]
- Hinkley, D.V. Bootstrap Methods. J. R. Stat. Soc. Ser. B Stat. Methodol. 1988, 50, 321–337. [Google Scholar] [CrossRef]
- Hall, P.; Wilson, S.R. Two Guidelines for Bootstrap Hypothesis Testing. Biometrics 1991, 47, 757. [Google Scholar] [CrossRef]
- Field, C.A.; Welsh, A.H. Bootstrapping Clustered Data. J. R. Stat. Soc. Ser. B Stat. Methodol. 2007, 69, 369–390. [Google Scholar] [CrossRef]
- Kolmogorov, A.N. Sulla determinazione empirica di una legge didistribuzione. Giorn. Dell’inst. Ital. Degli Att. 1933, 4, 89–91. [Google Scholar]
- Smirnov, N. Sur les écarts de la courbe de distribution empirique. Recl. Mathématique 1939, 6, 3–26. [Google Scholar]
- Feller, W. On the Kolmogorov-Smirnov Limit Theorems for Empirical Distributions. Ann. Math. Stat. 1948, 19, 177–189. [Google Scholar] [CrossRef]
- Capon, J. On the Asymptotic Efficiency of the Kolmogorov-Smirnov Test. J. Am. Stat. Assoc. 1965, 60, 843–853. [Google Scholar] [CrossRef]
- Praestgaard, J.T. Permutation and bootstrap Kolmogorov-Smirnov tests for the equality of two distributions. Scand. J. Stat. 1995, 22, 305–322. [Google Scholar]
- Bickel, P.J. A Distribution Free Version of the Smirnov Two Sample Test in the p-Variate Case. Ann. Math. Stat. 1969, 40, 1–23. [Google Scholar] [CrossRef]
- Romano, J.P. Bootstrap and Randomization Tests of some Nonparametric Hypotheses. Ann. Stat. 1989, 17, 141–159. [Google Scholar] [CrossRef]
- Realinho, V.; Machado, J.; Baptista, L.; Martins, M.V. Predicting Student Dropout and Academic Success. Data 2022, 7, 146. [Google Scholar] [CrossRef]
- Pinheiro, J.; Bates, D. Mixed-Effects Models in S and S-PLUS; Springer Science & Business Media: Berlin/Heidelberg, Germany, 2006. [Google Scholar]
- Kiefer, J. K-sample analogues of the Kolmogorov-Smirnov and Cramer-V. Mises tests. Ann. Math. Stat. 1959, 30, 420–447. [Google Scholar] [CrossRef]
Disclaimer/Publisher’s Note: The statements, opinions and data contained in all publications are solely those of the individual author(s) and contributor(s) and not of MDPI and/or the editor(s). MDPI and/or the editor(s) disclaim responsibility for any injury to people or property resulting from any ideas, methods, instructions or products referred to in the content. |
© 2024 by the authors. Licensee MDPI, Basel, Switzerland. This article is an open access article distributed under the terms and conditions of the Creative Commons Attribution (CC BY) license (https://creativecommons.org/licenses/by/4.0/).