Article

Contracting Supply Chains Considering Retailers’ Marketing Efforts

1
School of Transportation and Logistics, Southwest Jiaotong University, Chengdu 611756, China
2
National Engineering Laboratory of Integrated Transportation Big Data Application Technology, Southwest Jiaotong University, Chengdu 611756, China
3
School of Management and Economics, Changji Vocational and Technical College, Changji 831100, China
4
Department of Management, Macquarie Business School, Macquarie University, Sydney, NSW 2109, Australia
*
Authors to whom correspondence should be addressed.
Mathematics 2024, 12(11), 1635; https://doi.org/10.3390/math12111635
Submission received: 21 April 2024 / Revised: 14 May 2024 / Accepted: 18 May 2024 / Published: 23 May 2024

Abstract

:
Strategic cooperation has garnered significant attention in business. In this study, we explored the operating mechanisms of supply chains utilizing three Stackelberg models, in the following ascending order of cooperation level: price only, marketing cost sharing, and cross-shareholding. Further, we investigated the impact of cooperation on prices, marketing efforts, and profits, and analyzed the strategic cooperation preferences of different supply chain members. The results show that the influence of the level of cooperation on the wholesale and selling price is nonlinear. Interestingly, increased levels of cooperation do not always result in better outcomes. The marketing cost-sharing strategy aggravates the marketing burden on retailers. In contrast, the cross-shareholding strategy not only increases the total marketing effort level, but also efficiently reduces the burden of marketing on retailers. Moreover, all cooperation strategies solely benefit manufacturers rather than retailers, and not all of them improve the supply chain’s performance. Finally, the cross-shareholding cooperation strategy only maximizes the consumer surplus and social welfare under certain conditions. Overall, our study describes the operational mechanisms of diverse cooperative strategies and provides managerial guidance for those seeking to enhance marketing efforts and economic and social performance using a cooperation strategy.

1. Introduction

Marketing is highly valued by enterprises because the purchasing behavior of consumers is linked to their inner cognition of the product, which is partly influenced by marketing [1,2,3]. In a two-echelon supply chain, producers and retailers are the most basic subjects [4,5]. Specifically, retailers’ marketing efforts receive more attention because they are more familiar with consumer purchasing behavior. Their marketing strategies typically include advertising, expanding sales channels, price reductions, and promotions [6]. Statistics confirm that price promotions can increase sales by 15% alone, by 19% when combined with advertising, and by up to 24% when combined with both product display and advertising. However, manufacturers can benefit from retailers’ marketing efforts without incurring additional costs, creating a “free-riding” effect that may undermine retailers’ incentives to sell more of specific manufacturers’ products [4,7]. Consequently, this challenges manufacturers who want to incentivize retailers to increase their marketing efforts to drive sales.
A strategic alliance between a manufacturer and a retailer in a supply chain through cooperation strategies is an effective solution to solve the “free-riding” problem [4]. In business, various forms of cooperation strategies have emerged in supply chains. Some manufacturers sign a marketing cost-sharing contract with retailers to establish non-equity strategic alliances. In this strategy, manufacturers voluntarily pay a portion of the marketing costs to retailers to increase cooperation and capture the market. For example, Intel paid approximately USD 1.5 billion to retailers to boost sales in 2001 alone, and Walmart also received up to USD 100 million in marketing fees paid by manufacturers [5]. Other manufacturers sign a cross-shareholding contract with retailers to establish strategic equity alliances. In this strategy, they hold a certain percentage of each other’s stock and create a community of shared interest that promotes cooperation and builds stable relationships. For example, Gree, China’s largest air-conditioning manufacturer, and its main distributor, Jinghai, established a strategic alliance through a cross-shareholding strategy, yielding positive outcomes [4]. In Germany, Porsche and Volkswagen have established cross-shareholding cooperation with their partners [8]. Both of these alliance strategies are commonly utilized in practice.
However, the rapid growth rate of strategic alliances is accompanied by a high failure rate, commonly referred to as the “alliance paradox” [9]. Specifically, relevant industry statistics indicate that the number of strategic alliances has grown at an average rate of nearly 25% per year since 1987. Still, their failure rate remains high, ranging from 60% to 70% [10]. Non-equity strategic alliances are known for their flexibility, while equity strategic alliances are known for their greater stability, and both of these two strategies have been widely used. However, which collaborative strategy works better from an operational perspective has not been thoroughly studied. Therefore, the operating mechanisms behind them deserve in-depth exploration. Based on this discussion, this paper aims to answer the following questions: What are the decision-making and profit-sharing mechanisms for each model at different levels of cooperation? Can improving the level of cooperation enhance marketing efforts and reduce the marketing burden on retailers? What cooperation strategy can result in overall Pareto improvements in a supply chain? Can increased levels of cooperation lead to mutual benefits for all members of a supply chain? Can increasing cooperation among supply chain members enhance the consumer surplus and social welfare?
To address the aforementioned questions, we constructed three models, namely price only, marketing cost sharing, and cross-shareholding, in order to increase cooperation. Moreover, we analyzed the impact of cooperation, among members, on the decision-making mechanism and profit distribution mechanism of the supply chain. The results are as follows: First, in the cross-shareholding model, a retailer’s increased stake in a manufacturer elevates the purchasing cost itself, whereas the effect of increasing the manufacturer’s shareholding in the retailer on wholesale prices is proportional to the magnitude of backward shareholding. Furthermore, the manufacturer may decide to raise prices after sharing the retailer’s marketing costs in a marketing cost-sharing model. Second, both the cross-shareholding and marketing cost-sharing strategies can amplify the marketing efforts of retailers, but the latter yields superior results. Retailers experience the least (greatest) marketing burden in the cross-shareholding (marketing cost-sharing) strategy. The cross-shareholding strategy can effectively reduce the cost for consumers, who face the highest price in the cost-sharing model. Third, the cross-shareholding strategy (marketing cost-sharing strategy) increases (decreases) the efficiency of the supply chain, and manufacturers (retailers) always benefit (suffer) from the two cooperation strategies. If a manufacturer can give a retailer a certain sales rebate, the cross-shareholding strategy can take care of the interests of all members of the supply chain. Finally, a cross-shareholding strategy creates the maximum consumer surplus and social welfare if the manufacturer’s shareholding in the retailer exceeds a certain threshold.
The most pertinent literature to this study is Ren et al. [4] and Hong and Guo [5]. Our study differs significantly from theirs. Ren et al. [4] explored the shareholding behavior of platform retailers, compared and analyzed the advantages and disadvantages of cross-shareholding strategies with single-way shareholding strategies, and provided the shareholding intervals for upstream and downstream firms to choose cross-shareholding strategies. However, given the prevalence of non-shareholding cooperative strategies, in this study, we constructed a marketing cost-sharing model and compared it with the cross-shareholding model to address the challenge of managers’ divergent preferences for cooperative models. While Hong and Guo [5] analyzed the role of cost-sharing models in green supply chains, we quantitatively analyzed the role of increasing the level of cooperation in improving retailers’ marketing efforts by comparing a price-only model, a cost-sharing model, and a cross-sharing model. The main contributions from our study are as follows: First, we contribute to the knowledge on how the cooperation between manufacturers and retailers helps supply chains improve the economic and social benefits by analyzing the decision-making and profit-sharing mechanisms of three models: price-only, marketing cost-sharing, and cross-shareholding models. The impact of increasing the level of cooperation on a supply chain is quantitatively analyzed. Second, we reveal the cooperation path to increasing retailers’ marketing efforts and mitigating their marketing costs. Third, we establish the quantitative conditions under which the cross-shareholding strategy outperforms the marketing cost-sharing strategy regarding the consumer surplus and social welfare. The conclusions drawn from this study provide clear strategic guidance for managers who want to establish strategic alliances to improve the effectiveness of their firms by increasing cooperation.
The following sections in this paper are organized as follows. Section 2 reviews the literature on cross-shareholding, cost sharing, and marketing. Section 3 presents the three models and the equilibrium analysis. Section 4 analyzes the decision-making behavior of supply chain members. Then, Section 5 investigates the profit-sharing mechanism. Section 6 discusses social welfare in cooperation models. Finally, we present the paper’s conclusions and future research directions in Section 7.

2. Literature Review

Based on the above discussion, three primary categories of studies are relevant to the research in this paper: (1) cross-shareholding, (2) cost sharing, and (3) marketing.

2.1. Cross-Shareholding

Existing research shows that stable shareholdings can improve the level of inter-firm cooperation [10,11]. Obviously, cross-shareholding is a common partnering strategy in financial markets, and its integrative effect on supply chains is widely recognized [12,13,14]. Three main streams of research have emerged in this area. One focuses on the influence of power structures on cross-shareholding, one examines the role of cross-shareholding in green supply chains, and another discusses the effect of cross-shareholding on the level of inter-firm cooperation.
For the influence of power structures on cross-shareholding, Chen et al. [15] examined the impact of cross-shareholdings in pull and push supply chains, showing that enhancing the leader’s shareholding in the follower benefits the supply chain and the leader. Similarly, Fu and Ma [16] analyzed the efficiency of cross-shareholding under different power structures and provided specific methods that can harmonize the cross-shareholding supply chain. Green development has generated significant interest, as such Xia et al. [17] incorporate the cross-shareholding strategy into a green supply chain. They found that implementing this strategy helps manufacturers achieve greater reductions in carbon emissions. The green platform economy is expanding quickly; Ren et al. [4] analyzed the issue of choice in terms of the shareholding strategy between manufacturers and platform retailers and found that the cross-shareholding strategy can maximize profits when both forward and backward shareholding ratios are low. For the effect of cross-shareholding on cooperation, Brooks et al. [18] found that cross-shareholding can enhance long-term cooperation between firms. Recently, Wang et al. [19] discovered that retailers are more willing to share their demand information when the cross-shareholding ratio is moderate, which is beneficial to both partners. It is worth noting that there are existing papers that extend this area by considering capital-constrained firms, such as Wu et al. [20], who conducted a study to examine the impact of cross-shareholding and external financing on capital-constrained retailers. Their findings revealed that retailers tend to order more in the cross-shareholding model if they have sufficient financing available. In addition, other studies have also considered market creation [13], customer relationships [21], and financing strategies [22].
Summarizing the existing research on cross-shareholding, it is rare for studies to consider the impact of retailers’ marketing efforts. However, downstream marketing investments combined with shareholdings are prevalent in business and require further investigation.

2.2. Marketing Cost Sharing

Marketing cost-sharing strategies have been widely used in practice and are of great interest to academics [8,23,24], and there is a wealth of relevant research.
Advertising is a primary method used in a retailer’s marketing efforts [25,26]. Studies regarding the advertising cost-sharing strategies of retailers are prolific. For example, Chutani and Sethi [27] examined the cooperative advertising strategy between manufacturers and retailers and proposed a marketing approach in which manufacturers share the cost of retailers’ advertising. Farshbaf-Geranmayeh and Zaccour [28] investigated the relationship between pricing and advertising decisions and found that manufacturers can influence retailers’ decisions by sharing their advertising costs.
The green supply chain is a hot issue. Echoing this phenomenon, Zhou et al. [29] examined the strategic choice of manufacturers and retailers sharing advertising and abatement costs in a low-carbon supply chain. This study offers a new perspective on cooperation in low-carbon supply chains. Similarly, Hong and Guo [5] constructed a cost-sharing model and discovered that cooperative strategies can improve environmental benefits.
In addition, Phan et al. [30] designed four collaboration models to explore collaboration methods in supply chains based on retailer marketing efforts, using revenue-sharing and cost-sharing strategies. Li et al. [31] compared the cost-sharing contract and the revenue-sharing contract, showing that the cost-sharing strategy is optimal for partners when marketing efforts are more effective. Wu et al. [32] studied the cost-sharing mechanism between a manufacturer and two asymmetric retailers. They found that the manufacturer can benefit from a cost-sharing strategy, as long as at least one retailer exerts marketing efforts. Other scholars have considered sharing the cost of failure [33], the impact of information sharing on consumer demand [34], and the issue of horizontal cooperation [35], in studying this problem.
Most of the existing research focuses on the impact of cost sharing on supply chain members’ decisions and profits. We compare the marketing cost-sharing strategy with the cross-shareholding strategy to explore the response of supply chain members to an increased level of cooperation. As a result, we also obtained some novel conclusions.

2.3. Marketing

Retailer marketing efforts have a significant impact on sales [36,37]. Driven by this motivation, Du et al. [38] explored the management of retailers’ marketing efforts considering all-win or all-lose constraints. In practice, some manufacturers hire sales managers to enhance their sales force at the terminal. Duan et al. [39] conducted detailed analysis of this matter and found that sales volume is not always negatively correlated with the cost of sales. Decision-makers may be risk averse, so Li et al. [40] focused on what risk factors should be considered in supply chain pricing and marketing effort decisions. Retailers frequently encounter financial constraints, and Xu et al. [41] researched the influence of trade credit financing on retailers’ pricing and marketing decisions. In addition, Taylor’s [42] study showed that appropriate sales rebates are beneficial in promoting increased sales. Rastogi et al. [43] investigated the relationship between sustainable marketing and consumer loyalty, offering managers novel strategies for enhancing consumer loyalty.
The growth of the internet economy has provided new application scenarios for marketing. For example, the outbreak of COVID-19 has accelerated the growth of community group buying, prompting several internet giants, such as Meituan Select of Meituan and Duoduomaicai by Pinduoduo, to enter the market. Li et al. [44] investigated the marketing strategy problem of community group buying on the supply chain, showing that network externalities and the marketing efforts by the platform are important factors affecting the revenue of the platform and the head of the group. Other scholars have considered retailers’ sales efforts along with manufacturers’ quality improvements [45], carbon emission reductions [46], organic subsidies [47], and social learning [48].
The existing research on retailers’ marketing efforts is abundant, and the difference between this paper and the existing studies is that we introduce cross-shareholding into the supply chain that considers retailers’ marketing efforts and develop a marketing cost-sharing model to further study the operation mechanism of the two strategies. We analyze in detail the impact of increasing the level of cooperation on the decision-making mechanism and the profit-sharing mechanism, thereby deriving practically useful findings and filling the knowledge gap between the literature and practical application. The differences and main contributions of this paper and the other papers are given in Table 1.

3. Modeling and Equilibrium Analysis

3.1. Model Description

In a two-tier decentralized decision-making supply chain consisting of a manufacturer (he) and a retailer (she), the manufacturer is responsible for producing the products and selling them wholesale to the retailer, and the retailer sells the products to consumers in the market. Furthermore, we assume that both the manufacturer and the retailer are rational and seek to maximize their own interests [4,5,39]. Previous research has demonstrated that market demand is significantly influenced by both the price of the product and the marketing efforts of retailers. Thus, the demand function is described as q = D ε p + δ v in this paper [4,38,39]. Here, D represents the maximum market demand, while ε and δ represent the price sensitivity and market effort sensitivity of the consumer, respectively. In addition, v represents the level of retailer marketing effort. We use 1 2 h v 2 to denote the cost of a retailer’s marketing efforts, where h denotes the cost rate of the marketing effort. The quadratic form indicates that there is a diminishing marginal utility of the marketing effort, and retailers need to pay more to achieve better marketing results [5,39]. In particular, if the retailer’s marketing efforts are zero, then q = D ε p > 0 . The definitions of the variables and parameters involved are shown in Table 2, and the units of the decision variables and parameters are industry defaults [4,5,38,39].
In a price-only contract, the upstream manufacturer and downstream retailer are solely linked by the wholesale price. Obviously, if the retailer invests more in her marketing efforts, the manufacturer can make more profit without having to incur additional costs, which is called “free riding”. This may harm the motivation of the retailer to sell the goods of the specific manufacturer, leading to inefficiency. To incentivize retailers to sell more of their goods, manufacturers often choose to form strategic alliances with retailers, and there are various ways to cooperate. One type of cooperation is the formation of strategic alliances between manufacturers and retailers through a marketing cost-sharing contract (e.g., Intel paid USD 1.5 billion in marketing expenses to its retailers in 2001, and Walmart received a marketing fee of USD 100 million from its suppliers); the other type of cooperation involves equity. The manufacturer and retailer establish a shared interest community through a cross-shareholding contract, meaning that they each own a certain amount of the other’s shares (e.g., the equity cooperation between Volkswagen and its suppliers, and Gree has a cross-shareholding partnership with Jinghai). For the sake of clarity, we will use the following symbols to represent the price-only strategy ( N S ), the marketing cost-sharing strategy ( C M ), and the cross-shareholding strategy ( C S ). Figure 1 specifically depicts the three strategies.
In this study, we do not consider the transaction costs. This approach has been proven to be effective in examining the operation mechanisms of the shareholding supply chain [4,18,22]. To ensure the independence of all firms, we assume that the firm’s shareholding ratio is no more than 50% [4,18,22]. The sequence of decisions for the three strategies mentioned above is as follows: the manufacturer first determines the wholesale price, and then the retailer determines both the product price and the marketing effort level.

3.2. Equilibrium Analysis

For the three strategies discussed in the previous section, this section will construct and solve these models.

3.2.1. Price-Only Model

The manufacturer and the retailer are two completely independent decision-makers in the supply chain. As the leader of the supply chain, the manufacturer makes the decision w N S first, and then the retailer makes her own optimal decisions p N S and v N S . Thus, their profit functions are shown below:
Π m N S w = ( w c ) ( D ε p + δ v )
Π r N S p , v = p w ( D ε p + δ v ) 1 2 h v 2
The price-only model is the basic model in this research. Proposition 1 shows the optimal wholesale price of the manufacturer, as well as the optimal selling price and marketing effort level of the retailer. The proof of Proposition 1 and Inference 1 are provided in Appendix A.
Proposition 1.
w N S = D + ε c 2 ε ,  p N S = 3 ε h δ 2 D + ( ε h δ 2 ) ε c 2 ε ( 2 ε h δ 2 ) , and  v N S = δ ( D ε c ) 2 ( 2 ε h δ 2 ) .
Substituting the optimal decisions in Proposition 1 into Equations (1) and (2), we obtain the optimal profits for the manufacturer and the retailer.
Inference 1.
Π m N S w = h ( D ε c ) 2 4 ( 2 ε h δ 2 ) ,  Π r N S p , v = h ( D ε c ) 2 8 ( 2 ε h δ 2 ) .

3.2.2. Cross-Shareholding Model

The manufacturer and retailer establish an equity strategic alliance through a cross-shareholding strategy. The manufacturer holds 1 φ r of its own shares and φ m of the retailer’s shares, and the remaining shares of both are held by the retailer. The profit objective functions of the manufacturer and the retailer in the cross-shareholding model are shown as follows:
Π m C S w = 1 φ r w c D ε p + δ v + φ m p w ( D ε p + δ v ) φ m 1 2 h v 2
Π r C S p , v = ( 1 φ m ) p w ( D ε p + δ v ) ( 1 φ m ) 1 2 h v 2 + φ r ( w c ) ( D ε p + δ v )
Applying the same methodology as in the previous subsection to solve the cross-shareholding model, we obtain the optimal wholesale price of the manufacturer, as well as the optimal selling price and marketing effort level of the retailer. Correspondingly, Proposition 2 provides the result, and the proof is located in Appendix A.
Proposition 2.
w C S = ( 1 φ m ) 2 D + [ 1 φ m 1 φ r φ r ] ε c ( 2 φ m ) ( 1 φ m φ r ) ε ,  p C S = 3 2 φ m ε h 1 φ m δ 2 D + ( ε h δ 2 ) ε c ( 2 φ m ) ( 2 ε h δ 2 ) ε , and  v C S = δ ( D ε c ) ( 2 φ m ) ( 2 ε h δ 2 ) .
Inference 2 provides the optimal profits for both the manufacturer and retailer in the C S model, and Appendix A provides the proof process.
Inference 2.
Π m C S w = h ( D ε c ) 2 2 ( 2 φ m ) ( 2 ε h δ 2 ) ,  Π r C S p , v = ( 1 φ m ) h ( D ε c ) 2 2 ( 2 φ m ) 2 ( 2 ε h δ 2 ) .

3.2.3. Marketing Cost-Sharing Model

In practice, a manufacturer may choose to share part of a retailer’s marketing costs in order to increase the retailer’s marketing efforts and thereby increase sales. This type of non-equity strategic alliance through a marketing cost-sharing strategy is widely used because of the advantage of high flexibility. As the supply chain leader, the manufacturer decides the marketing cost sharing ratio α ( 0 < α < 1 ) . The total marketing cost of the retailer is 1 2 h v 2 , the marketing cost borne by the manufacturer is 1 2 α h v 2 , and the remaining marketing cost is borne by the retailer. After applying this strategy, the profit functions of the manufacturer and the retailer are:
Π m C M w , α = ( w c ) ( D ε p + δ v ) 1 2 α h v 2
Π r C M p , v = p w ( D ε p + δ v ) 1 2 ( 1 α ) h v 2
Proposition 3 provides the optimal decisions for both the manufacturer and retailer in the C M model, and the proof is provided in Appendix A.
Proposition 3.
w C M = 8 ε h 3 δ 2 D + 8 ε h 6 δ 2 ε c ( 16 ε h 9 δ 2 ) ε ,  p C M = 3 4 ε h δ 2 D + 2 2 ε h 3 δ 2 ε c ( 16 ε h 9 δ 2 ) ε ,  v C M = 6 δ ( D ε c ) 16 ε h 9 δ 2 , and   α C M = 1 3 .
The optimal outcomes in Proposition 3 are inserted into Equations (5) and (6) to ascertain the best profit for each decision-maker. The proof of Inference 3 is shown in Appendix A.
Inference 3.
Π m C M w = 2 h ( D ε c ) 2 16 ε h 9 δ 2 ,  Π r C M p , v = 4 h ( 4 ε h 3 δ 2 ) ( D ε c ) 2 ( 16 ε h 9 δ 2 ) 2 .
In a decentralized supply chain, the profit of the entire supply chain is equal to the manufacturer’s profit plus the retailer’s profit.
Π t n w , p , v = Π m n w + Π r n ( p , v ) ,   where   n { N S , C S , C M } .

4. Optimal Decisions of The Players

Based on the results in the previous section, this section explores the decision mechanisms of manufacturers and retailers under three strategies. In addition, we will verify the validity of the model and conclusions with a case study. The values of the relevant variables and parameters are D = 200 , c = 5 , ε = 1.2 , δ = 1 , and h = 1.2 [17].

4.1. Manufacturer’s Optimal Decisions

In this subsection, we analyze the manufacturer’s decision-making mechanism in terms of three strategies.
Proposition 4.
(1) If  φ r 1 φ m 3 φ m , then  w C S φ m 0 , otherwise  w C S φ m > 0 ;  w C S φ r > 0 .
(2) (i) If  0 < φ r < φ m ( 1 φ m ) 2 φ m , then  w C S < w N S < w C M ;
(ii) If  φ m ( 1 φ m ) 2 φ m φ r < 8 φ m 1 φ m ε h + 3 ( 2 φ m 2 3 φ m + 1 ) δ 2 ( 2 φ m ) ( 8 ε h 3 δ 2 ) , then  w N S w C S < w C M ;
(iii) If  8 φ m 1 φ m ε h + 3 ( 2 φ m 2 3 φ m + 1 ) δ 2 ( 2 φ m ) ( 8 ε h 3 δ 2 ) φ r < 50 % , then  w N S < w C M w C S .
Proposition 4 (1) indicates that the wholesale price responds distinctively to variations in forward and backward shareholding ratios in a cross-shareholding model. An increase in the retailer’s ownership of the manufacturer causes the manufacturer to raise his wholesale price. The retailer’s ownership will lead to the manufacturer being penalized and the manufacturer will increase the wholesale price to maintain profitability. In contrast, if the backward shareholding ratio is small, an increase in the forward shareholding ratio will result in lower wholesale prices. At this point, the manufacturer benefits from his shareholding in the retailer and, thus, has an incentive to lower the wholesale prices to boost sales. However, if the backward shareholding ratio exceeds a certain threshold, the manufacturer needs to increase the wholesale price to ensure his own marginal profit when the forward shareholding ratio increases.
Proposition 4 (2) compares the wholesale prices under three strategies. The wholesale price under the marketing cost-sharing strategy is always greater than that in the price-only strategy. The reason for this is that the manufacturer shares some of the marketing costs of the retailer, and he will choose to increase the wholesale price to a certain extent in order to ensure his profit. Wholesale prices in a cross-shareholding strategy do not respond linearly to changes in holdings, resulting in a more complex trend in their price changes. If the backward shareholding ratio is small, the manufacturer can obtain sufficient profit margins to give the retailer a certain price preference through his shareholding in the retailer, and the wholesale price in the cross-shareholding model is the smallest among the three. A higher backward shareholding ratio means that the retailer takes a larger portion of the manufacturer’s profits. At this point, even if the forward shareholding ratio is increased, the manufacturer still needs to increase the wholesale price to ensure his profit, making the wholesale price in the cross-shareholding model the maximum possible. If the backward shareholding ratio falls within the middle range, the manufacturer experiences a greater cost pressure in the marketing cost-sharing model than in the cross-shareholding model, resulting in relatively higher pricing for the former (see Figure 2).

4.2. Retailer’s Optimal Decisions

In this section, we analyze the decision mechanisms of retailers under different strategies.

4.2.1. Retailer’s Optimal Marketing Effort Level

In this subsection, we examine the effect of different strategies on the level of marketing effort of retailers.
Proposition 5.
(1)  v C S φ m > 0 ;  v C S φ r = 0 .
(2) Total marketing effort paid by retailers:  v N S < v C S < v C M .
(3)   Δ v C S N S h < 0 ,  Δ v C M N S h < 0 , where  Δ v C S N S = v C S v N S ,  Δ v C M N S = v C M v N S .
(4) (i) Marketing efforts undertaken by retailers:  v r C S < v r N S < v r C M ; (ii)  v r C S φ m < 0 ,  v r C S φ r = 0 , where  v r C S = ( 1 φ m ) v C S ,  v r C M = ( 1 α C M ) v C M .
Proposition 5 (1) suggests that in a cross-shareholding model, when a manufacturer increases his shareholding in a retailer, it leads to an increase in the retailer’s marketing efforts. However, when a retailer increases her shareholding in a manufacturer, it does not have an effect on the level of marketing effort. Proposition 5 (2) suggests that both cross-shareholding and marketing cost-sharing strategies are effective in increasing the level of marketing effort of retailers, because in both strategies the manufacturer shares part of the marketing costs on behalf of the retailer, and the higher level of cooperation induces the retailer to exert more effort. Meanwhile, we find that marketing cost-sharing strategies are more effective than cross-shareholding strategies in boosting retailers’ marketing efforts (see Figure 3).
Proposition 5 (3) shows that as the unit cost of the marketing effort increases, the incentive for retailers in the cross-shareholding and marketing cost-sharing models to increase the level of marketing effort decreases because the marginal utility of the marketing effort invested declines. Proposition 5 (4) finds that the marketing cost borne by the retailer in the cost-sharing model is still higher than that in the price-only model; the cross-shareholding strategy can indeed mitigate the retailer’s marketing costs, while simultaneously increasing the overall level of marketing effort. Additionally, the pressure on the retailer is further reduced as the percentage of the manufacturer’s shareholding increases (see Figure 4).

4.2.2. Retailer’s Optimal Selling Price

In this subsection, we examine the pricing mechanism of retailers.
Proposition 6.
(1)  p C S φ m < 0 ;  p C S φ r = 0 . (2)   p C S < p N S < p C M .
(3)     Δ p C S N S h < 0 ,  Δ p C M N S h < 0 , where  Δ p N S C S = p N S p C S ,  Δ p C M N S = p C M p N S .
Combined with Proposition 5, it can be seen that the effect of backward shareholding on the selling price is the same as that on the marketing effort level, and that an increase in the forward shareholding ratio can incentivize the retailer to reduce the selling price while increasing her marketing effort, which will ultimately benefit consumers. In the marketing cost-sharing model, the retailer’s pricing is the highest. The manufacturer must increase the wholesale price to ensure his revenue because he bears part of the cost of the marketing effort. The pressure of the price increase is then transmitted to the retailer and ultimately, the consumer pays for it. We also find that when the unit cost of the marketing effort rises, the price difference between the pricing decisions of the retailer in the cross-shareholding and marketing cost-sharing strategies decreases, and both converge to the prices in the benchmark model (see Figure 5).

5. Optimal Profits of The Players

This section focuses on the profit distribution mechanism under different strategies.

5.1. Supply Chain Profit

Whether the cross-shareholding strategy or the marketing cost-sharing strategy can improve the overall effectiveness of the supply chain will be analyzed in this subsection.
Proposition 7.
(1)   Π t C S ( w , p , v ) φ m > 0 ;  Π t C S ( w , p , v ) φ r = 0 .
(2)   Π t C M ( w , p , v ) < Π t N S ( w , p , v ) < Π t C S ( w , p , v ) .
Proposition 7 compares the supply chain profits under the three strategies. Compared to the benchmark model, the marketing cost-sharing strategy does not improve the overall profitability of the supply chain. From Proposition 6, it is evident that despite the retailer ordering more and selling the product at a higher price in the marketing cost-sharing model, the increased marketing investment leads to a decrease in the net profit. And in the cross-shareholding model, the retailer can achieve greater sales and profit growth by reducing the prices. From the perspective of the supply chain, the cross-shareholding strategy is the optimal strategy, and its advantage can be further extended by the manufacturer increasing his shareholding in the retailer (see Figure 6).

5.2. Manufacturer’s Profit

This subsection analyzes what strategies would benefit manufacturers.
Proposition 8.
(1)   Π m C S ( w ) φ m > 0 ;  Π m C S ( w ) φ r = 0 . (2) (i) If  0 < φ m < δ 2 4 ( 2 ε h δ 2 ) , then  Π m N S ( w ) < Π m C S ( w ) < Π m C M ( w ) ; (ii) If  δ 2 4 ( 2 ε h δ 2 ) φ m < 50 % ,  Π m N S ( w ) < Π m C M ( w ) Π m C S ( w ) .
Proposition 8 (1) shows that increasing the forward shareholding ratio in a cross-shareholding model results in higher profits for the manufacturer and changing the backward shareholding has no effect on the manufacturer’s profits. Proposition 8 (2) indicates that applying either a cross-shareholding strategy or a marketing cost-sharing strategy benefits the manufacturer. When the forward shareholding ratio is low, the marketing cost-sharing strategy is most favorable to the manufacturer. However, when the forward shareholding ratio exceeds a certain threshold, the manufacturer benefits most from the cross-shareholding strategy compared with other strategies (see Figure 7).

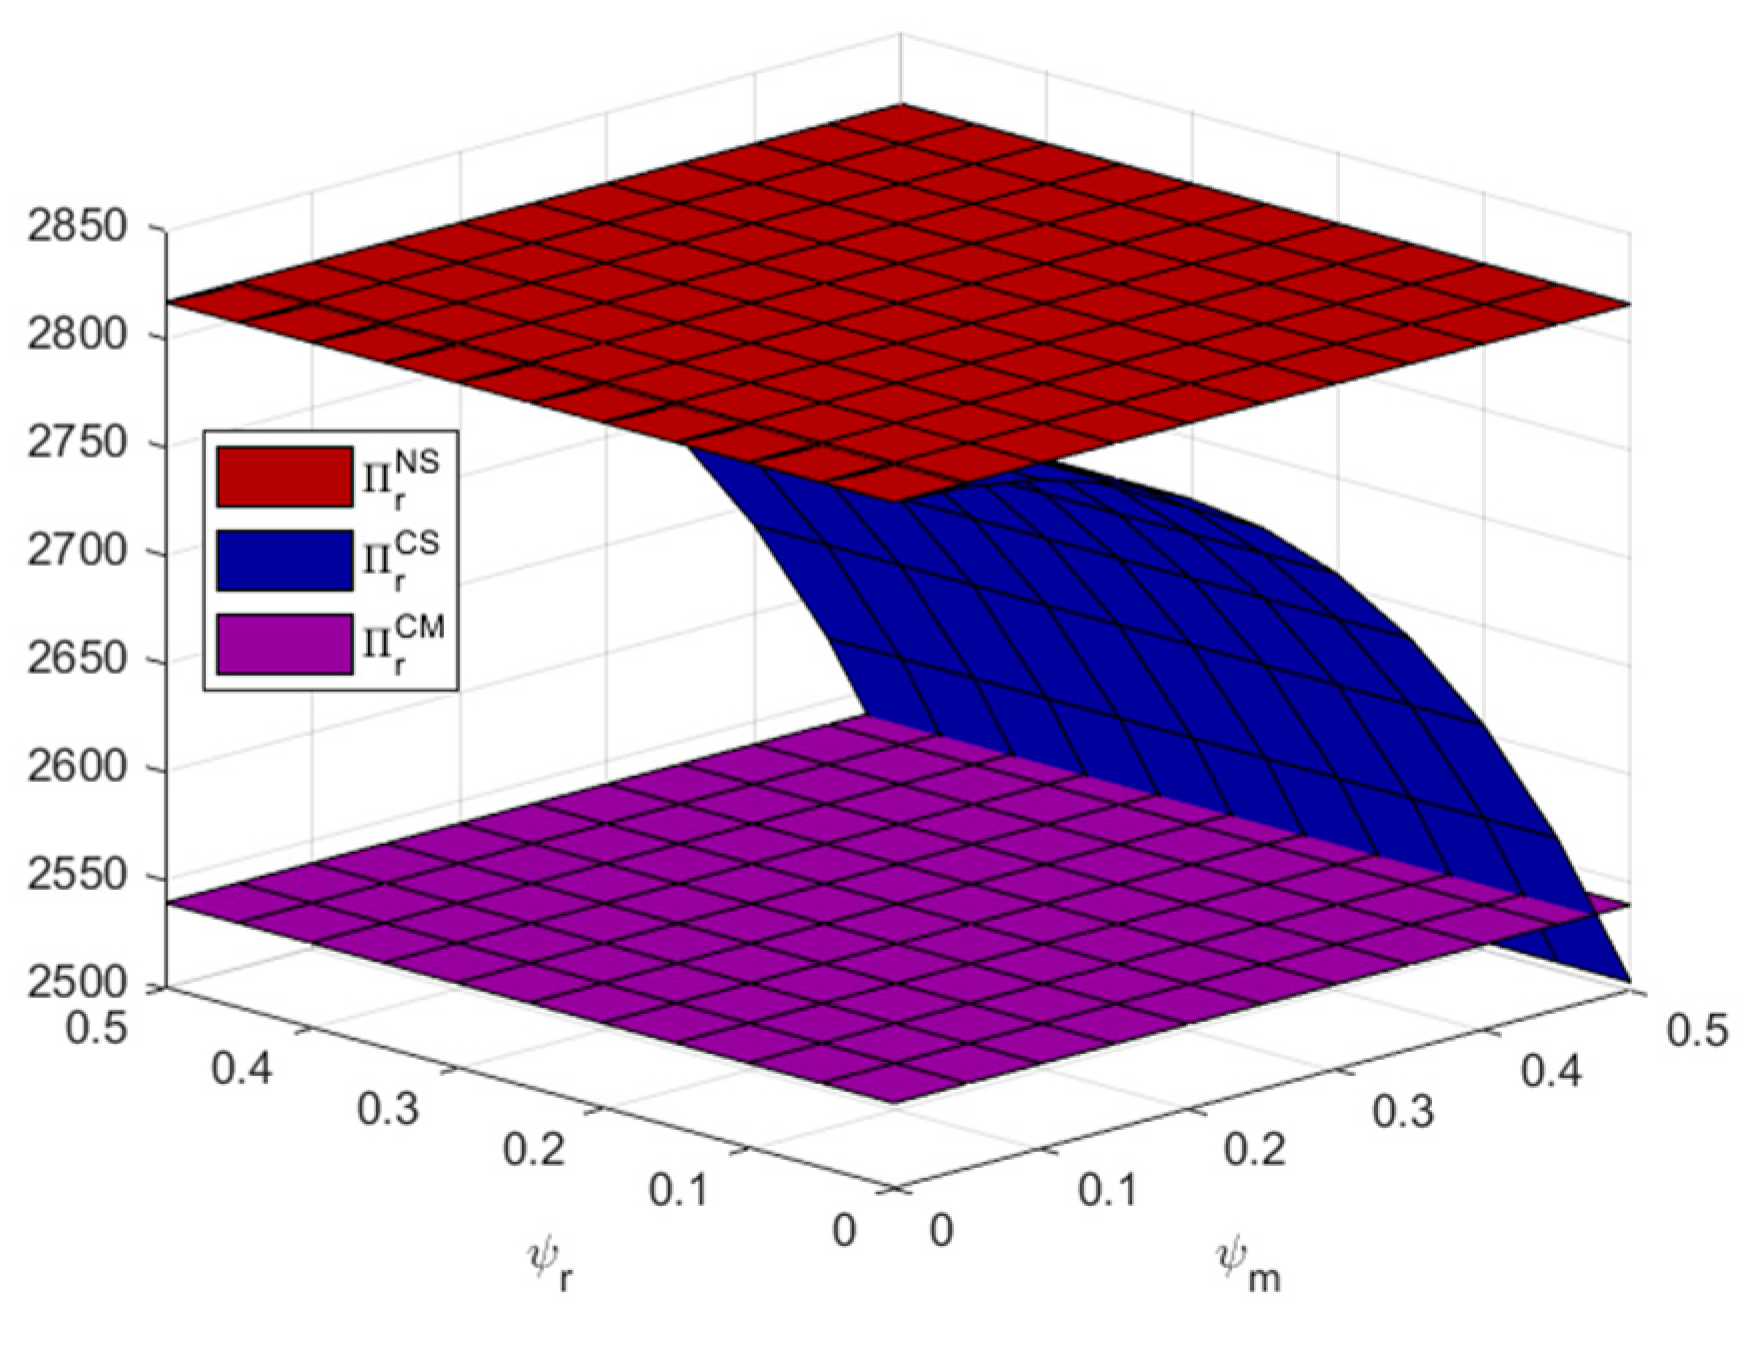
5.3. Retailer’s Profit
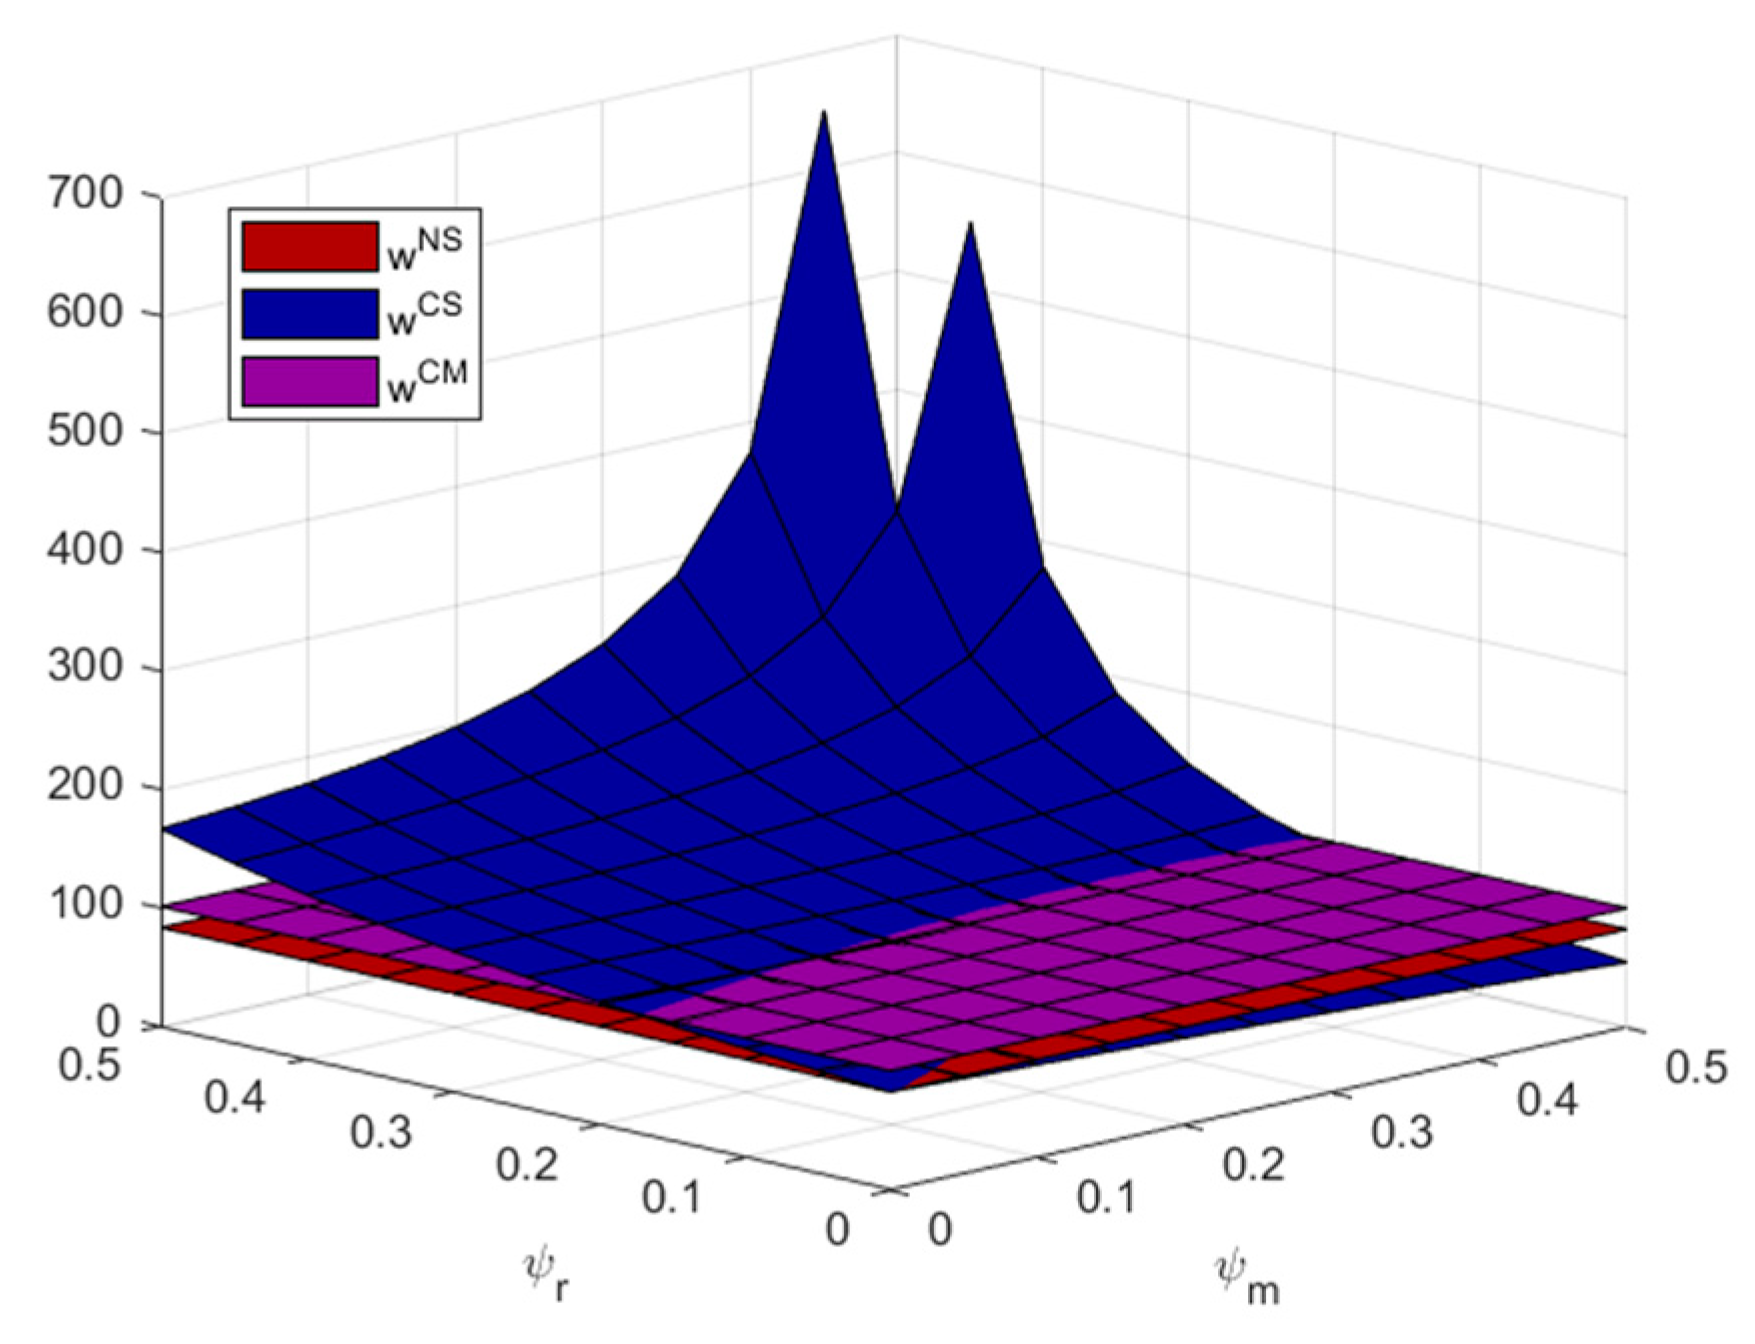
This subsection examines strategy preferences for retailers.
Proposition 9.
(1)  Π r C S ( p , v ) φ m < 0 ;  Π r C S ( p , v ) φ r = 0 . (2)  1 φ m w C S w C S ( φ r = 0 ) q C S = φ r Π m C S ( w ) . (3) (i) If  0 < φ m < φ m 4 , then  Π r C M ( p , v ) < Π r C S ( p , v ) < Π r N S ( p , v ) ; (ii) If  φ m 4 φ m < 50 % , then  Π r C S ( p , v ) < Π r C M ( p , v ) < Π r N S ( p , v ) . where  φ m 4 = 32 ε h 15 δ 2 δ 2 + 8192 ε 3 h 3 13056 ε 2 h 2 δ 4 + 6912 ε h δ 6 1215 δ 8 128 ε 2 h 2 160 ε h δ 2 + 48 δ 4 .
Proposition 9 (1) suggests that a manufacturer’s shareholding in a retailer causes a loss of profits for the latter, while a retailer’s shareholding in a manufacturer does not change her own profits. From Proposition 7, it is clear that although the cross-shareholding strategy leads to an increase in supply chain profits, the manufacturer captures more of the benefits from the shareholding strategy. Even more counterintuitive is the fact that the retailer’s shareholding in the manufacturer does not lead to an increase in earnings, because when the retailer holds a stake in the manufacturer, the manufacturer uses his power to redistribute his profits by adjusting the wholesale price in order to offset the losses caused by being held, which ultimately makes it impossible for the retailer to reap the benefits of its shareholding, see Proposition 9 (2). This also explains why the retailer does not change the marketing and pricing decisions as a result of her shareholding in the manufacturer. Thus, when the manufacturer’s shareholding in the retailer is above (below) a certain threshold, the marketing cost-sharing strategy (cross-shareholding strategy) results in the least benefit for the retailer. Neither strategy is optimal from the retailer’s perspective (see Figure 8).
Proposition 7 suggests that implementing a cross-shareholding strategy can enhance the efficiency of the supply chain. However, Propositions 8 and 9 indicate that the interests of the manufacturer and the retailer do not currently align, resulting in opposition from downstream retailers when implementing the shareholding strategy. To resolve this issue, this paper proposes a reasonable rebate policy as outlined in Lemma 1.
Lemma 1.
In a cross-shareholding model, the manufacturer can give the retailer an appropriate unit sales rebate  k C S  to achieve a Pareto improvement for all members of the supply chain.
(1)  k m i n C S < k C S < k m a x C S   i n   C S   m o d e l .
(2) (i) k m i n C S φ m > 0 , k m i n C S φ r = 0 ; (ii) k m a x C S φ m > 0 , k m a x C S φ r = 0 .
where: k m i n C S = [ 2 φ m 2 4 ( 1 φ m ) ] ( D ε c ) 8 ( 2 φ m ) ε , k m a x C S = φ m ( D ε c ) 4 ε .
When the manufacturer applies the cross-shareholding strategy, if he can give the retailer a sales rebate k C S , it can ensure that the retailer’s profit is not lower than that in the price-only model and, at the same time, realize the growth of his own profit, which clears the obstacles for advancing the cross-shareholding strategy. Furthermore, an increase in a manufacturer’s ownership of a retailer results in an overall upward movement of the upper and lower limits of the unit rebate k C S .

6. Social Welfare

Firms are not only concerned with their own economic interests, but also with the welfare they bring to consumers and the value they create for society, which are all social responsibilities that firms should assume. Therefore, in this section we focus on the consumer surplus and social welfare under different strategies. In reference to an existing study [49], consumer welfare in this paper is given by the following equation:
C S q = p m i n p m a x q d p = D + δ v q ε D + δ v ε D ε p + δ v d p = q 2 2 ε
In an economic system manufacturers and retailers earn profits by producing and selling goods, and consumers receive consumer surplus by purchasing goods. Thus, we seek to achieve total social welfare through the operation of the supply chain. Social welfare consists of three components: the manufacturer’s profit, the retailer’s profit, and the consumer surplus. This is given by the following equation:
S W = Π m w + Π r p , v + C S ( q )
Using Equation (8), we calculate the consumer surplus under the three strategies and obtain the relevant conclusions.
Lemma 2.
(1) (i)   C S N S q = ε h 2 ( D ε c ) 2 8 ( 2 ε h δ 2 ) 2 ,  C S C S q = ε h 2 ( D ε c ) 2 2 ( 2 φ m ) 2 ( 2 ε h δ 2 ) 2 ,  C S C M q = 8 ε h 2 ( D ε c ) 2 ( 16 ε h 9 δ 2 ) 2 ; (ii)   C S C S ( q ) φ m > 0 ,  C S C S ( q ) φ r = 0 .
(2) (i) If  0 < φ m < δ 2 4 ( 2 ε h δ 2 ) , then  C S N S q < C S C S q < C S C M q ; (ii) If  δ 2 4 ( 2 ε h δ 2 ) φ m < 50 % , then  C S N S q < C S C M q C S C S q .
Lemma 2 (1) presents the consumer surplus for the three strategies, and we also observe that raising the forward shareholding ratio in the cross-shareholding model leads to a growth in the consumer surplus. The reason for this is that an increase in a manufacturer’s shareholding in a retailer prompts the retailer to lower the selling price of the product and invest more in marketing efforts, which in turn increases sales, ultimately benefiting the consumer more. Lemma 2 (2) compares the size of the consumer surplus under different strategies, and the consumer surplus created in the benchmark model is always the smallest; the cross-shareholding strategy creates the largest consumer surplus when the forward shareholding ratio exceeds a certain threshold (see Figure 9).
Next, we utilize Equation (8) to calculate the overall social welfare for the three strategies.
Lemma 3.
(1) (i)   S W N S = ( 7 ε h 3 δ 2 ) h ( D ε c ) 2 8 ( 2 ε h δ 2 ) 2 ,  S W C S = [ ( 7 4 φ m ) ε h ( 3 2 φ m ) δ 2 ] h ( D ε c ) 2 2 ( 2 φ m ) 2 ( 2 ε h δ 2 ) 2 ,  S W C M = 2 ( 28 ε h 15 δ 2 ) h ( D ε c ) 2 ( 16 ε h 9 δ 2 ) 2 ; (ii)  S W C S φ m > 0 ;  S W C S φ r = 0 .
(2) (i) If 0 < φ m < φ m 5 , S W N S < S W C S < S W C M ; (ii) If  φ m 5 φ m < 50 % , then  S W N S < S W C M S W C S , where
φ m 5 = 768 ε 3 h 3 1088 ε 2 h 2 δ 2 + 517 ε h δ 4 18 δ 6 ( 768 ε 3 h 3 1088 ε 2 h 2 δ 2 + 517 ε h δ 4 18 δ 6 ) 2 4 688 ε 2 h 2 δ 2 448 ε 3 h 3 352 ε h δ 4 23 ε h δ 4 32 ε 2 h 2 δ 2 3 δ 6 2 ( 448 ε 3 h 3 688 ε 2 h 2 δ 2 + 352 ε h δ 4 ) .
Lemma 3 (1) provides the social welfare of the three strategies. Additionally, we discover that in the cross-shareholding model, social welfare increases with forward shareholding, while backward shareholding does not affect social welfare. It is further shown that the increased control of the manufacturer over the retailer is conducive to increasing the overall cooperation level, but the effect of the retailer’s shareholding in the manufacturer is always offset by the latter’s position of power (see Figure 10).

7. Conclusions and Implications

7.1. Conclusions

Marketing is an essential component of any successful business and a crucial factor in gaining a competitive edge. In business, retailers’ marketing efforts are highly valued because they are closer to the consumer. However, retailers must balance the costs and benefits of marketing, and manufacturers are challenged with enhancing retailers’ marketing efforts. We found that forming strategic alliances in the supply chain has become a popular way to address this dilemma. Consequently, we constructed three models in ascending order of cooperation, namely price only, marketing cost sharing, and cross-shareholding, to depict the dual dilemma and determine the optimal cooperation strategy.
First, the degree of cooperation has a more complex impact on manufacturers’ decision-making mechanisms. Specifically, the effect of cross-shareholding strategies on manufacturers’ pricing decisions is nonlinear and is related to the percentage of the shareholding, while marketing cost-sharing strategies inflate wholesale prices. In the cross-shareholding model, an increase in the retailer’s shareholding in the manufacturer is associated with an increase in wholesale prices. The effect of increasing the manufacturer’s shareholding in the retailer on wholesale prices is contingent on the backward shareholding ratio. When the backward shareholding ratio is small (large), the wholesale price decreases (increases) as the forward shareholding ratio increases. It is the complexity of the impact of forward and backward shareholding ratios on wholesale prices that makes the cross-shareholding strategy offer both the lowest and the highest wholesale prices, depending on whether the backward shareholding ratio is in the low range or the high range.
Second, the degree of cooperation has a different mechanism of influencing retailers’ decision-making compared to that of manufacturers. Specifically, both cross-shareholding and marketing cost-sharing strategies increase the level of total marketing effort compared to the base model, but the latter has a more pronounced effect. From the retailer’s point of view, the cross-shareholding strategy helps to reduce the marketing costs she has to bear. In the marketing cost-sharing model, although the manufacturer shares some of the marketing costs, rising wholesale prices force the retailer to secure its profits by exerting more selling efforts. Furthermore, the pricing decisions of retailers are relatively simple, and the application of a cross-shareholding strategy allows consumers to take advantage of price concessions, while consumers have to bear the pressure of price increases after the application of a marketing cost-sharing strategy.
Third, increasing the level of cooperation does not necessarily increase the overall effectiveness of the supply chain. Specifically, the cross-shareholding strategy can increase the overall effectiveness of the supply chain, but the marketing cost-sharing strategy can cause the overall effectiveness of the supply chain to decrease. Nonetheless, manufacturers are beneficiaries in both cooperation strategies. Therefore, manufacturers should increase the level of cooperation with retailers. In particular, in the case of cooperation using a cross-shareholding strategy, manufacturers should maximize their shareholding in the retailer. Both cooperation strategies have the effect of impeding the ability of retailers to compete effectively. Furthermore, it is futile for retailers to hold shares in manufacturers, who exploit their position of power to redistribute benefits. Consequently, when a manufacturer establishes a relationship with the retailer through a cross-shareholding strategy, it is prudent for the retailer to request that the manufacturer provide a reasonable rebate strategy.
Finally, enhancing the level of cooperation among supply chain members can increase the consumer surplus and social welfare. In the cross-shareholding model, the supply chain creates the maximum consumer surplus and social welfare when the forward shareholding ratio exceeds the corresponding threshold because both of them grow with the forward shareholding ratio.

7.2. Managerial Insights

Based on the aforementioned findings, we derive the following management insights. First, from the perspective of the manufacturer, he as a leader in a supply chain can increase his benefits by adopting both a cross-shareholding strategy and a marketing cost-sharing strategy. Therefore, manufacturers should enhance collaboration with retailers. Furthermore, if cross-shareholding is the chosen strategy, the manufacturer should maximize his shareholding in the retailer.
Second, from the perspective of the retailer, a retailer can modify her shareholding ratio in a manufacturer to ease the burden of the costs associated with purchased goods. Regarding the cooperation strategy, if a manufacturer seeks to establish a partnership with her through a cross-shareholding strategy, she should request a fair rebate strategy from the manufacturer or confidently decline the offer.
Third, from a societal perspective, the government should formulate policies to encourage cooperation among supply chain firms to increase the consumer surplus and social welfare.

7.3. Future Research

Overall, this study investigated the effects of different forms of cooperation on supply chain members’ decisions and profits. Our research provides valuable insights into vertical cooperation in supply chains from an operational and optimization standpoint. However, this study has some limitations, which can inform future research directions. First, our study did not consider diverse market scenarios; however, market environments are competitive and variable. Therefore, future research should consider varying market environments, such as those with high competition and economic downturns. Second, we explored the cooperation problem in a two-echelon supply chain, while considering a retailer’s marketing efforts. However, the marketing role of third-party and fourth-party logistics companies in the supply chain cannot be ignored. Therefore, future research should consider their influence on marketing. Third, cultures have an important impact on shareholding partnerships. Therefore, we should take different cultural and regulatory landscapes into account in future shareholding research.

Author Contributions

Conceptualization, W.L. and J.H.; methodology, W.L. and J.H.; software, W.L.; validation, W.L., J.H. and Y.S.; writing—original draft preparation, W.L.; writing—review and editing, W.L., J.H. and Y.S.; funding acquisition, J.H. All authors have read and agreed to the published version of the manuscript.

Funding

This research was funded by the National Natural Science Foundation of China (No. 71873111, 71273214), the Ministry of Education of Humanities and Social Science Project (18YJAZH024), and the China National Railway Group Science and Technology Research and Development Program (JGYJS-2023-0026).

Data Availability Statement

The data presented in this study are available within the article.

Conflicts of Interest

The authors declare no conflicts of interest.

Appendix A

Proof of Proposition 1 and Inference 1.
In the N S model, from Π r N S ( p , v ) , we obtain 2 Π r N S ( p , v ) p 2 = 2 ε , 2 Π r N S ( p , v ) p v = 2 Π r N S ( p , v ) v p = δ , 2 Π r N S ( p , v ) v 2 = h . Then, the Hessian matrix can be demonstrated as H N S = Π r N S ( p , v ) p 2 Π r N S ( p , v ) p v Π r N S ( p , v ) v p Π r N S ( p , v ) v 2 = 2 ε h δ 2 > 0 . Therefore, the retailer has the optimal selling price and marketing effort level. Let Π r N S ( p , v ) p = 0 and Π r N S ( p , v ) v = 0 , and we obtain p N S w = h D + ( ε h δ 2 ) w 2 ε h δ 2 , v N S w = δ ( D ε w ) 2 ε h δ 2 . We replace p N S w and v N S w in Π m N S ( w ) , and we obtain 2 Π m N S ( w ) w 2 = 2 ε 2 h 2 ε h δ 2 < 0 . Let Π m N S ( w ) w = 0 , and we get w N S = D + ε c 2 ε . Then, we replace w N S in p N S w and v N S w , respectively. By performing this calculation, we obtain p N S = 3 ε h δ 2 D + ( ε h δ 2 ) ε c 2 ε ( 2 ε h δ 2 ) , v N S = δ ( D ε c ) 2 ε ( 2 ε h δ 2 ) . In addition, we get q N S = ε h ( D ε c ) 2 ( 2 ε h δ 2 ) , Π m N S w = h ( D ε c ) 2 4 ( 2 ε h δ 2 ) , and Π r N S p , v = h ( D ε c ) 2 8 ( 2 ε h δ 2 ) . □
Proof of Proposition 2 and Inference 2.
In the C S model, from Π r C S ( p , v ) , we obtain 2 Π r C S ( p , v ) p 2 = 2 ( 1 φ m ) ε , 2 Π r C S ( p , v ) p v = 2 Π r C S ( p , v ) v p = ( 1 φ m ) δ , and 2 Π r C S ( p , v ) v 2 = ( 1 φ m ) h . Then, we get the Hessian matrix H C S = Π r C S ( p , v ) p 2 Π r C S ( p , v ) p v Π r C S ( p , v ) v p Π r C S ( p , v ) v 2 = ( 1 φ m ) 2 ( 2 ε h δ 2 ) > 0 . Let Π r C S ( p , v ) p = 0 and Π r C S ( p , v ) v = 0 , we have p C S w = 1 φ m h D + 1 φ m φ r ε h δ 2 w + φ r ε h δ 2 c ( 1 φ m ) ( 2 ε h δ 2 ) and v C S w = 1 φ m δ D 1 φ m φ r δ ε w φ r δ ε c ( 1 φ m ) ( 2 ε h δ 2 ) . We replace p C S w and v C S w in Π m C S ( w ) , and we obtain 2 Π m C S ( w ) w 2 = 1 φ m φ r ε 2 h { 1 φ r 1 φ m φ m 1 φ m + [ 1 φ r 1 φ m φ r φ m ] } ( 1 φ m ) 2 ( 2 ε h δ 2 ) < 0 . Let Π m F S ( w ) w = 0 , and we have w C S = ( 1 φ m ) 2 D + [ 1 φ m 1 φ r φ r ] ε c ( 2 φ m ) ( 1 φ m φ r ) ε . Substituting w C S into p C S w and v C S w , and we obtain p C S = 3 2 φ m ε h 1 φ m δ 2 D + ( ε h δ 2 ) ε c ( 2 φ m ) ( 2 ε h δ 2 ) ε and v C S = δ ( D ε c ) ( 2 φ m ) ( 2 ε h δ 2 ) . By performing this calculation, we can obtain the following results: q C S = ε h ( D ε c ) ( 2 φ m ) ( 2 ε h δ 2 ) , Π m C S w = h ( D ε c ) 2 2 ( 2 φ m ) ( 2 ε h δ 2 ) and Π r C S p , v = ( 1 φ m ) h ( D ε c ) 2 2 ( 2 φ m ) 2 ( 2 ε h δ 2 ) . □
Proof of Proposition 3 and Inference 3.
In the C M model, from Π r C M ( p , v ) , and we have 2 Π r C M ( p , v ) p 2 = 2 ε , 2 Π r C M ( p , v ) p v = 2 Π r C M ( p , v ) v p = δ and 2 Π r C M ( p , v ) v 2 = ( 1 α ) h . Then, the Hessian matrix can be demonstrated as H C M = Π r C M ( p , v ) p 2 Π r C M ( p , v ) p v Π r C M ( p , v ) v p Π r C M ( p , v ) v 2 = ( 1 α ) 2 ε h δ 2 > 0 . Let Π r C M ( p , v ) p = 0 and Π r C M ( p , v ) v = 0 , and we obtain p C M w = 1 α h D + [ ( 1 α ) ε h δ 2 ] w ( 1 α ) 2 ε h δ 2 and v C M w = δ ( D ε w ) ( 1 α ) 2 ε h δ 2 . We replace p C M w and v C M w in Π m C M ( w ) , and we obtain 2 Π m C M ( w ) w 2 = ε 2 h { 2 1 α ( 1 α ) 2 ε h δ 2 + α δ 2 } [ ( 1 α ) 2 ε h δ 2 ] 2 < 0 . Let Π m C M ( w ) w = 0 , and we have w C M = 1 α 1 α 2 ε h δ 2 ( D + ε c ) + α δ 2 D { 2 1 α ( 1 α ) 2 ε h δ 2 + α δ 2 } ε . Then, we replace w C M in p C M w and v C M w , and we have p C M = 3 ( 1 α ) 2 ε h ( 1 2 α ) δ 2 D + ( 1 α ) 1 α 2 ε h δ 2 ε c { 2 1 α 1 α 2 ε h δ 2 + α δ 2 } ε and v C M = 1 α δ ( D ε c ) 2 1 α 1 α 2 ε h δ 2 + α δ 2 . By performing this calculation, we can obtain the following results: q C M = ( 1 α ) 2 ε h ( D ε c ) 2 1 α 1 α 2 ε h δ 2 + α δ 2 , Π m C M w = 1 α 2 h ( D ε c ) 2 2 { 2 1 α 1 α 2 ε h δ 2 + α δ 2 } and Π r C M p , v = 1 α 3 1 α 2 ε h δ 2 h ( D ε c ) 2 2 { 2 1 α 1 α 2 ε h δ 2 + α δ 2 } 2 . The objective of maximizing the manufacturer’s profit can be found as α C M = 1 3 . Then, we have w C M = 8 ε h 3 δ 2 D + 8 ε h 6 δ 2 ε c ( 16 ε h 9 δ 2 ) ε , p C M = 3 4 ε h δ 2 D + 2 2 ε h 3 δ 2 ε c ( 16 ε h 9 δ 2 ) ε , v C M = 6 δ ( D ε c ) 16 ε h 9 δ 2 , Π m C M w = 2 h ( D ε c ) 2 16 ε h 9 δ 2 , and Π r C M p , v = 4 h ( 4 ε h 3 δ 2 ) ( D ε c ) 2 ( 16 ε h 9 δ 2 ) 2 . □
Proof of Proposition 4.
(1) In the cross-shareholding model, the first partial derivatives of the optimal wholesale price with the corresponding shareholding ratios are as follows:
w C S φ m = ( 1 φ m ) ( D ε c ) [ 1 3 φ r ( 1 φ r ) φ m ] ( 1 φ m φ r ) 2 ( 2 φ m ) 2 ε , the positive or negative of w C S φ m is determined by [ 1 3 φ r ( 1 φ r ) φ m ] . We obtain if φ r 1 φ m 3 φ m , then w C S φ m 0 , otherwise w C S φ m > 0 ; w C S φ r = ( 2 φ m ) ( 1 φ m ) 2 ε D ( 1 φ m φ r ) 2 ( 2 φ m ) 2 ε 2 > 0 .
(2) The wholesale price comparisons are as follows:
w C M w N S = 3 δ 2 ( D ε c ) 2 ( 16 ε h 9 δ 2 ) ε > 0 , w C S w N S = [ φ r 2 φ m φ m 1 φ m ] ( D ε c ) 2 ( 2 φ m ) ( 1 φ m φ r ) ε , and the size relationship between w C S and w N S is determined by φ r 2 φ m φ m 1 φ m , thus if φ r φ m 1 φ m 2 φ m , then w C S w N S ; if φ r > φ m 1 φ m 2 φ m , then w C S > w N S .
From w C S w C M = 8 ε h φ m + φ m 2 + 2 φ r φ m φ r 3 δ 2 1 3 φ m + 2 φ m 2 + 2 φ r φ m φ r D ε c 2 φ m 1 φ m φ r 16 ε h 9 δ 2 ε , we know that the size relationship between w C S and w C M is determined by 8 ε h φ m + φ m 2 + 2 φ r φ m φ r 3 δ 2 1 3 φ m + 2 φ m 2 + 2 φ r φ m φ r , thus if φ r < 8 φ m 1 φ m ε h + 3 2 φ m 2 3 φ m + 1 δ 2 2 φ m 8 ε h 3 δ 2 , then w C S < w C M , otherwise w C S w C M . In addition, we have 8 φ m 1 φ m ε h + 3 2 φ m 2 3 φ m + 1 δ 2 2 φ m 8 ε h 3 δ 2 φ m 1 φ m 2 φ m = 3 1 φ m 2 δ 2 2 φ m 8 ε h 3 δ 2 > 0 , and 1 2 8 φ m 1 φ m ε h + 3 2 φ m 2 3 φ m + 1 δ 2 2 φ m 8 ε h 3 δ 2 =   16 ε h 12 δ 2 1 + φ m 2 ( 24 ε h 21 δ 2 ) φ m 2 ( 2 φ m ) ( 8 ε h 3 δ 2 ) > 16 ε h 12 δ 2 φ m 2 + ( 4 ε h 1.5 δ 2 ) 2 ( 2 φ m ) ( 8 ε h 3 δ 2 ) > 0 ,
i.e., 0 < φ m ( 1 φ m ) 2 φ m < 8 φ m 1 φ m ε h + 3 2 φ m 2 3 φ m + 1 δ 2 2 φ m 8 ε h 3 δ 2 < 1 2 .
In summary there are:
(i)
If 0 < φ r < φ m ( 1 φ m ) 2 φ m , then w C S < w N S < w C M ;
(ii)
if φ m ( 1 φ m ) 2 φ m φ r < 8 φ m 1 φ m ε h + 3 ( 2 φ m 2 3 φ m + 1 ) δ 2 ( 2 φ m ) ( 8 ε h 3 δ 2 ) , then w N S w C S < w C M ;
(iii)
if 8 φ m 1 φ m ε h + 3 ( 2 φ m 2 3 φ m + 1 ) δ 2 ( 2 φ m ) ( 8 ε h 3 δ 2 ) φ r < 1 2 , then w N S < w C M w C S . □
Proof of Proposition 5.
(1) In the cross-shareholding model, the first partial derivatives of the optimal marketing effort level with the corresponding shareholding ratios are as follows:
v C S φ m = δ ( D ε c ) 2 φ m 2 ( 2 ε h δ 2 ) > 0 , v C S φ r = 0 .
(2)   v C S v N S = φ m δ ( D ε c ) 2 ( 2 φ m ) ( 2 ε h δ 2 ) > 0 , v C M v N S = 8 ε h 3 δ 2 δ ( D ε c ) 2 ( 2 ε h δ 2 ) 16 ε h 9 δ 2 > 0 ,
v C S v C M = [ 4 2 3 φ m ε h + 3 ( 1 2 φ m ) δ 2 ] δ ( D ε c ) ( 2 φ m ) ( 2 ε h δ 2 ) 16 ε h 9 δ 2 , and the size relationship between v C S and v C M is determined by 4 2 3 φ m ε h + 3 ( 1 2 φ m ) δ 2 . By performing the calculation, we find that if φ m < 8 ε h 3 δ 2 6 ( 2 ε h δ 2 ) , then v C S < v C M . Because 8 ε h 3 δ 2 6 ( 2 ε h δ 2 ) > 1 2 and 0 < φ m < 1 2 , then v C S < v C M .
To sum up, we obtain v N S < v C S < v C M .
(3)   v C S N S h = φ m ε δ ( D ε c ) ( 2 φ m ) ( 2 ε h δ 2 ) < 0 ;
v C M N S h = ε δ D ε c [ 8 ε h 3 δ 2 32 ε h 8 δ 2 8 ε h 4 δ 2 16 ε h 9 δ 2 ] ( 2 ε h δ 2 ) 2 ( 16 ε h 9 δ 2 ) 2 < 0 .
(4) In the cross-shareholding model, the marketing effort borne by the manufacturer is φ m v C S , and the remaining marketing effort borne by the retailer is ( 1 φ m ) v C S , denoted as v r C S , then v r C S = 1 φ m v C S = 1 φ m δ D ε c 2 φ m ( 2 ε h δ 2 ) . In the price-only model, all the marketing costs are borne by the retailer itself, then v r N S = v N S . In the marketing cost-sharing model, the marketing effort borne by the manufacturer is α C M v C M , and the remaining marketing efforts borne by the retailer is ( 1 α C M ) v C M , denoted as v r C M , then v r C M = ( 1 α C M ) v C M = 4 δ D ε c 16 ε h 9 δ 2 . In addition, we have v r C M v r N S = δ 3 D ε c 2 ( 2 ε h δ 2 ) ( 16 ε h 9 δ 2 ) > 0 , v r C S v r N S = φ m δ D ε c 2 2 φ m ( 2 ε h δ 2 ) < 0 , and then v r C S < v r N S < v r C M ; v r C S φ m = δ D ε c 2 φ m 2 ( 2 ε h δ 2 ) < 0 . □
Proof of Proposition 6.
(1) In the cross-shareholding model, the first partial derivatives of the optimal selling price with the corresponding shareholding ratios are as follows: p C S φ r = 0 ; p C S φ m = ( ε h δ 2 ) D ε c 2 φ m 2 ε ( 2 ε h δ 2 ) < 0 .(2) Because p C S p N S = φ m ( ε h δ 2 ) D ε c 2 ε ( 2 φ m ) ( 2 ε h δ 2 ) < 0 and p C M p N S = ( 7 ε h 3 δ 2 ) δ 2 D ε c 2 ε ( 2 ε h δ 2 ) ( 16 ε h 9 δ 2 ) > 0 , we have p C S < p N S < p C M .
(3) p C M N S h = δ 2 D ε c [ δ 2 16 ε h 9 δ 2 + 16 ( 2 ε h δ 2 ) ( 7 ε h 3 δ 2 ) ] 2 ( 2 ε h δ 2 ) 2 ( 16 ε h 9 δ 2 ) 2 < 0 , p C S N S h = φ m ε h D ε c 2 ( 2 φ m ) ( 2 ε h δ 2 ) 2 < 0 . □
Proof of Proposition 7.
The total profit for each of the three models is Π t N S w , p , v = 3 h ( D ε c ) 2 8 ( 2 ε h δ 2 ) , Π t C S w , p , v = ( 3 2 φ m ) h ( D ε c ) 2 2 ( 2 φ m ) 2 ( 2 ε h δ 2 ) and Π t C M w , p , v = 2 ( 24 ε h 15 δ 2 ) h ( D ε c ) 2 ( 16 ε h 9 δ 2 ) 2 .
(1) In the cross-shareholding model, the first partial derivatives of the supply chain profit with the corresponding shareholding ratios are as follows:
Π t C S w , p , v φ m = ( φ m 2 3 φ m + 2 ) h ( D ε c ) 2 ( 2 φ m ) 4 ( 2 ε h δ 2 ) > 0 ; Π t C S w , p , v φ r = 0 .
Let f 1 φ m = φ m 2 3 φ m + 2 , when 0 < φ m < 1 2 , f 1 φ m > 0 absolutely holds, i.e., Π t C S w , p , v φ m > 0 .
(2) Π t C S w , p , v Π t N S w , p , v = φ m ( 4 3 φ m ) h ( D ε c ) 2 8 ( 2 φ m ) 2 ( 2 ε h δ 2 ) > 0 ,
Π t C M w , p , v Π t N S w , p , v = 3 δ 4 h ( D ε c ) 2 8 ( 2 ε h δ 2 ) ( 16 ε h 9 δ 2 ) 2 < 0 .
In summary, we have Π t C M ( w , p , v ) < Π t N S ( w , p , v ) < Π t C S ( w , p , v ) . □
Proof of Proposition 8.
(1) In the cross-shareholding model, the first partial derivatives of the manufacturer profit with the corresponding shareholding ratios are as follows:
Π m C S w φ m = h ( D ε c ) 2 2 ( 2 φ m ) 2 ( 2 ε h δ 2 ) > 0 ; Π m C S ( w ) φ r = 0 .
(2)     Π m C S w Π m N S w = φ m h ( D ε c ) 2 4 ( 2 φ m ) ( 2 ε h δ 2 ) > 0 ,
Π m C M w Π m N S w = δ 2 h ( D ε c ) 2 4 ( 16 ε h 9 δ 2 ) ( 2 ε h δ 2 ) > 0 ,
Π m C S w Π m C M w = [ 8 φ m ε h ( 1 + 4 φ m ) δ 2 ] h ( D ε c ) 2 2 ( 2 φ m ) ( 16 ε h 9 δ 2 ) ( 2 ε h δ 2 ) , which means the size relationship between Π m C S w and Π m C M w is determined by 8 φ m ε h ( 1 + 4 φ m ) δ 2 , because 0 < δ 2 4 ( 2 ε h δ 2 ) < 1 2 , when 0 < φ m < δ 2 4 ( 2 ε h δ 2 ) , we have Π m C S ( w ) < Π m C M ( w ) ; when δ 2 4 ( 2 ε h δ 2 ) φ m < 1 2 , then Π m C M ( w ) Π m C S ( w ) .
In summary, we have:
(i)
if 0 < φ m < δ 2 4 ( 2 ε h δ 2 ) , then Π m N S ( w ) < Π m C S ( w ) < Π m C M ( w ) ;
(ii)
if δ 2 4 ( 2 ε h δ 2 ) φ m < 1 2 , then Π m N S ( w ) < Π m C M ( w ) Π m C S ( w ) . □
Proof of Proposition 9.
(1) In the cross-shareholding model, the first partial derivatives of the retailer profit with the corresponding shareholding ratios are as follows:
Π r C S p , v φ m = φ m h ( D ε c ) 2 2 ( 2 φ m ) 3 ( 2 ε h δ 2 ) < 0 ; Π r C S ( p , v ) φ r = 0 .
(3)   Π r C S p , v Π r N S p , v = φ m 2 h ( D ε c ) 2 8 ( 2 φ m ) 2 ( 2 ε h δ 2 ) < 0 ,
Π r C M p , v Π r N S p , v = ( 32 ε h 15 δ 2 ) δ 2 h ( D ε c ) 2 8 ( 2 ε h δ 2 ) ( 16 ε h 9 δ 2 ) 2 < 0 ,
Π r C S p , v Π r C M p , v = [ 64 ε 2 h 2 + 80 ε h δ 2 24 δ 2 φ m 2 32 ε h δ 2 15 δ 4 φ m + ( 32 ε h δ 2 15 δ 4 ) ] h ( D ε c ) 2 2 ( 2 φ m ) 2 ( 2 ε h δ 2 ) ( 16 ε h 9 δ 2 ) 2 , let
f 2 φ m = 64 ε 2 h 2 + 80 ε h δ 2 24 δ 2 φ m 2 32 ε h δ 2 15 δ 4 φ m + ( 32 ε h δ 2 15 δ 4 ) . The quadratic coefficient of f 2 φ m is 8 [ 2 ε h 4 ε h δ 2 δ 2 ( 2 ε h 3 δ 2 ) ] < 0 , and we have f 2 φ m = 0 > 0 , f 2 φ m = 1 2 < 0 and the axis of symmetry of a quadratic function f 2 φ m is δ 2 ( 32 ε h 15 δ 2 ) 16 [ 8 ε h ε h δ 2 δ 2 ( 2 ε h 3 δ 2 ) ] < 0 . We know that f 2 φ m must have two foci with respect to the x-axis.
Let f 2 φ m = 0 , we have:
φ m 3 = 32 ε h 15 δ 2 δ 2 8192 ε 3 h 3 13056 ε 2 h 2 δ 4 + 6912 ε h δ 6 1215 δ 8 128 ε 2 h 2 160 ε h δ 2 + 48 δ 4 < 0 (Abandon),
φ m 4 = 32 ε h 15 δ 2 δ 2 + 8192 ε 3 h 3 13056 ε 2 h 2 δ 4 + 6912 ε h δ 6 1215 δ 8 128 ε 2 h 2 160 ε h δ 2 + 48 δ 4 .
In summary, we have
(i)
if 0 < φ m < φ m 4 , then Π r C M ( p , v ) < Π r C S ( p , v ) < Π r N S ( p , v ) ;
(ii)
if φ m 4 φ m < 1 2 , then Π r C S ( p , v ) < Π r C M ( p , v ) < Π r N S ( p , v ) . □
Proof of Lemma 1.
(1) In the C S model, to enable the retailer to accept the manufacturer’s shareholding strategy, the rebate from the manufacturer to the retailer should make the retailer’s profit no less than the profit in the price-only model.
k m i n C S = Π r N S p , v Π r C S p , v q C S = [ 2 φ m 2 4 ( 1 φ m ) ] ( D ε c ) 8 ( 2 φ m ) ε
The manufacturer’s rebate to the retailer should be less than the extra profit it makes.
k m a x 1 C S = Π m C S w Π m N S w q C S = φ m ( D ε c ) 4 ε
As the leader of the supply chain, the manufacturer always keeps its own profit higher than that of the retailer. Therefore, there are:
Π m C S w k C S q C S Π r C S p , v + k C S q C S > 0
Then, we obtain:
k m a x 2 C S = ( D ε c ) 4 ( 2 φ m ) ε
Then, compare the size between k m a x 1 C S and k m a x 2 C S .
k m a x 1 C S k m a x 2 C S = [ φ m 2 φ m 1 ] ( D ε c ) 4 ( 2 φ m ) ε
Let f 1 φ m = φ m 2 φ m 1 , the following figure shows that k m a x 1 C S is less than k m a x 2 C S .
From k m i n C S < k C S < m i n ( k m a x 1 C S , k m a x 2 C S ) , we obtain
[ 2 φ m 2 4 ( 1 φ m ) ] ( D ε c ) 8 ( 2 φ m ) ε < k C S < φ m ( D ε c ) 4 ε
(2) (i) k m i n C S φ m = φ m ( D ε c ) 4 ε ( 2 φ m ) 2 > 0 , k m i n C S φ r = 0 ; (ii) k m a x C S φ m = D ε c 4 ε > 0 , k m a x C S φ r = 0 . □
Proof of Lemma 2.
(1) In the cross-shareholding model, the first partial derivatives of the consumer surplus with the corresponding shareholding ratios are as follows:
C S C S ( q ) φ m = ε h 2 ( D ε c ) 2 ( 2 φ m ) 3 ( 2 ε h δ 2 ) 2 > 0 ; C S C S ( q ) φ r = 0 .
(2)   C S C S q C S N S q = φ m ( 4 φ m ) ε h 2 ( D ε c ) 2 8 ( 2 φ m ) 2 ( 2 ε h δ 2 ) 2 > 0 ,
C S C M q C S N S q = ( 32 ε h 17 δ 2 ) δ 2 ε h 2 ( D ε c ) 2 8 ( 2 ε h δ 2 ) 2 ( 16 ε h 9 δ 2 ) 2 > 0 ;
C S C S q C S C M q = [ 16 ε h 9 δ 2 2 16 ( 2 φ m ) 2 ( 2 ε h δ 2 ) 2 ] ε h 2 ( D ε c ) 2 2 ( 2 φ m ) 2 ( 2 ε h δ 2 ) 2 ( 16 ε h 9 δ 2 ) 2 , which means the size relationship between C S C S q and C S C M q is determined by 16 ε h 9 δ 2 2 16 ( 2 φ m ) 2 ( 2 ε h δ 2 ) 2 . By calculating, we have 0 < δ 2 4 ( 2 ε h δ 2 ) < 1 2 , if φ m < δ 2 4 ( 2 ε h δ 2 ) , then C S C S q < C S C M q ; if φ m δ 2 4 ( 2 ε h δ 2 ) , then C S C S q < C S C M q .
To sum up, we get
(i)
if 0 < φ m < δ 2 4 ( 2 ε h δ 2 ) , then C S N S q < C S C S q < C S C M q ;
(ii)
if δ 2 4 ( 2 ε h δ 2 ) φ m < 1 2 , then C S N S q < C S C M q C S C S q . □
Proof of Lemma 3.
(1) In the cross-shareholding model, the first partial derivatives of the social welfare with the corresponding shareholding ratios are as follows:
S W C S φ m = ( 1 φ m ) h 2 ( D ε c ) 2 ( 2 φ m ) 3 ( 2 ε h δ 2 ) 2 > 0 ; S W C S φ r = 0 .
(2)   S W C S S W N S = [ 8 7 φ m ε h ( 4 3 φ m ) δ 2 ] φ m h ( D ε c ) 2 8 ( 2 φ m ) 2 ( 2 ε h δ 2 ) 2 > 0 ,
S W C M S W N S = [ 32 ε h δ 2 ε h δ 2 + 3 δ 6 ] h ( D ε c ) 2 8 ( 2 ε h δ 2 ) 2 ( 16 ε h 9 δ 2 ) 2 ;
S W C S S W C M = [ 688 ε 2 h 2 δ 2 448 ε 3 h 3 352 ε h δ 4 φ m 2 + 768 ε 3 h 3 1088 ε 2 h 2 δ 2 + 517 ε h δ 4 18 δ 6 φ m + 23 ε h δ 4 32 ε 2 h 2 δ 2 3 δ 6 ] h ( D ε c ) 2 2 ( 2 φ m ) 2 ( 2 ε h δ 2 ) 2 ( 16 ε h 9 δ 2 ) 2 , which means the size relationship between S W C S and S W C M is determined by 688 ε 2 h 2 δ 2 448 ε 3 h 3 352 ε h δ 4 φ m 2 + 768 ε 3 h 3 1088 ε 2 h 2 δ 2 + 517 ε h δ 4 18 δ 6 φ m + 23 ε h δ 4 32 ε 2 h 2 δ 2 3 δ 6 . Let f 4 φ m = 688 ε 2 h 2 δ 2 448 ε 3 h 3 352 ε h δ 4 φ m 2 + 768 ε 3 h 3 1088 ε 2 h 2 δ 2 + 517 ε h δ 4 18 δ 6 φ m + 23 ε h δ 4 32 ε 2 h 2 δ 2 3 δ 6 . The quadratic coefficient of f 4 φ m is ε h [ ε h 448 ε h δ 2 δ 2 ( 240 ε h 352 δ 2 ) ] < 0 , because f 4 φ m = 0 < 0 and f 4 φ m = 1 2 > 0 , we know that the transverse coordinates of the axis of symmetry of f 4 φ m minus 1 2 equals ε h ε h δ 2 320 ε h 80 δ 2 + 85 ε h 18 δ 2 δ 4 2 ε h [ 448 ε h ε h δ 2 ( 240 ε h 352 δ 2 ) δ 2 ] > 0 , so the function f 4 φ m has an axis of symmetry to the right of 1 2 , and f 4 φ m must have two intersections with the x-axis. Let f 4 φ m = 0 , we have:
φ m 5 = 768 ε 3 h 3 1088 ε 2 h 2 δ 2 + 517 ε h δ 4 18 δ 6 ( 768 ε 3 h 3 1088 ε 2 h 2 δ 2 + 517 ε h δ 4 18 δ 6 ) 2 4 688 ε 2 h 2 δ 2 448 ε 3 h 3 352 ε h δ 4 23 ε h δ 4 32 ε 2 h 2 δ 2 3 δ 6 2 ( 448 ε 3 h 3 688 ε 2 h 2 δ 2 + 352 ε h δ 4 )
,
φ m 6 = 768 ε 3 h 3 1088 ε 2 h 2 δ 2 + 517 ε h δ 4 18 δ 6 + ( 768 ε 3 h 3 1088 ε 2 h 2 δ 2 + 517 ε h δ 4 18 δ 6 ) 2 4 688 ε 2 h 2 δ 2 448 ε 3 h 3 352 ε h δ 4 23 ε h δ 4 32 ε 2 h 2 δ 2 3 δ 6 2 ( 448 ε 3 h 3 688 ε 2 h 2 δ 2 + 352 ε h δ 4 ) .
After this judgment, φ m 6 is not eligible and is abandoned. Therefore, if 0 < φ m < φ m 5 , then S W C S < S W C M ; if φ m 5 φ m < 1 2 , then S W C M S W C S .
To sum up, we get:
(i)
if 0 < φ m < φ m 5 , then S W N S < S W C S < S W C M ;
(ii)
if φ m 5 φ m < 1 2 , then S W N S < S W C M S W C S . □

References

  1. Hassan, M.; Prabhu, J.; Chandy, R.; Narasimhan, O. When bulldozers loom: Informal property rights and marketing practice innovation among emerging market microentrepreneurs. Mark. Sci. 2022, 41, 137–165. [Google Scholar] [CrossRef]
  2. Shulman, J.D.; Toubia, O.; Saddler, R. Editorial: Marketing’s role in the evolving discipline of product management. Mark. Sci. 2023, 42, 1–5. [Google Scholar] [CrossRef]
  3. Chiu, Y.-J.; Hong, L.-S.; Song, S.-R.; Cheng, Y.-C. Unveiling the dynamics of consumer attention: A two-stage hybrid MCDM analysis of key factors and interrelationships in influencer marketing. Mathematics 2024, 12, 981. [Google Scholar] [CrossRef]
  4. Ren, D.; Guo, R.; Lan, Y.; Shang, C. Shareholding strategies for selling green products on online platforms in a two-echelon supply chain. Transp. Res. E—Logist. Transp. Rev. 2021, 149, 102261. [Google Scholar] [CrossRef]
  5. Hong, Z.; Guo, X. Green product supply chain contracts considering environmental responsibilities. Omega 2019, 83, 155–166. [Google Scholar] [CrossRef]
  6. Rhouma, T.B.; Zaccour, G. Optimal marketing strategies for the acquisition and retention of service subscribers. Mark. Sci. 2017, 64, 2609–2627. [Google Scholar] [CrossRef]
  7. Zhou, Y.-W.; Guo, J.; Zhou, W. Pricing/service strategies for a dual-channel supply chain with free riding and service-cost sharing. Int. J. Prod. Econ. 2018, 196, 198–210. [Google Scholar] [CrossRef]
  8. Li, W.; He, J.; Shi, Y. Research on operation mechanisms of shareholding supply chains considering retailers’ marketing efforts. J. Bus. Ind. Mark. 2024. [Google Scholar] [CrossRef]
  9. Kale, P.; Singh, H. Managing strategic alliances: What do we know now, and where do wo go from here? Acad. Manag. Perspect. 2009, 23, 45–62. [Google Scholar] [CrossRef]
  10. Cabral, L.; Pacheco-de-Almeida, G. Alliance formation and firm value. Manag. Sci. 2018, 65, 879–895. [Google Scholar] [CrossRef]
  11. Sueyoshi, T.; Goto, M.; Omi, Y. Corporate governance and firm performance: Evidence from Japanese manufacturing industries after the lost decade. Eur. J. Oper. Res. 2010, 203, 724–736. [Google Scholar] [CrossRef]
  12. Chen, C.-C.; Chen, C.-D.; Lien, D. Financial distress prediction model: The effects of corporate governance indicators. J. Forecast. 2020, 39, 1238–1252. [Google Scholar] [CrossRef]
  13. Engez, A.; Aarikka-Stenroos, L. Stakeholder contributions to commercialization and market creation of a radical innovation: Bridging the micro- and macro levels. J. Bus. Ind. Mark. 2023, 38, 31–44. [Google Scholar] [CrossRef]
  14. Liu, R.; Huang, Y. Structural analysis of projected networks of shareholders and stocks based on the data of large shareholders’ shareholding in China’s Stocks. Mathematics 2023, 11, 1545. [Google Scholar] [CrossRef]
  15. Chen, J.; Hu, Q.; Song, J.-S. Effect of partial cross ownership on supply chain performance. Eur. J. Oper. Res. 2017, 258, 525–536. [Google Scholar] [CrossRef]
  16. Fu, H.; Ma, Y. Optimization and coordination of decentralized supply chains with vertical cross-shareholding. Comput. Ind. Eng. 2019, 132, 23–35. [Google Scholar] [CrossRef]
  17. Xia, Q.; Zhi, B.; Wang, X. The role of cross-shareholding in the green supply chain: Green contribution, power structure and coordination. Int. J. Prod. Econ. 2021, 234, 108037. [Google Scholar] [CrossRef]
  18. Brooks, C.; Chen, Z.; Zeng, Y. Institutional cross-ownership and corporate strategy: The case of mergers and acquisitions. J. Corp. Financ. 2018, 48, 187–216. [Google Scholar] [CrossRef]
  19. Wang, J.; Zhu, K.; Peng, J.; Zhuo, W. Strategic demand information sharing under partial cross ownership. Int. J. Prod. Econ. 2023, 61, 604–631. [Google Scholar] [CrossRef]
  20. Wu, D.; Zhang, C.; Pan, Y.; Dolgui, A. The supply chain effects on order strategy of cross-shareholdings. Int. J. Prod. Res. 2021, 59, 6848–6863. [Google Scholar] [CrossRef]
  21. Bathke, H.; Birkel, H.; Gracht, H.A.; Kisgen, S. The power of connecting experience data and operational data: More than the sum of its parts? J. Bus. Ind. Mark. 2023, 38, 2604–2625. [Google Scholar] [CrossRef]
  22. He, M.; Kang, K.; Wei, X.; Li, Y. Financing strategy of transnational supply chain with vertical shareholding under tax system difference: Creditor or guarantor? Transp. Res. E—Logist. Transp. Rev. 2023, 169, 102973. [Google Scholar] [CrossRef]
  23. Wang, X.; Baesens, B.; Zhu, Z. On the optimal marketing aggressiveness level of C2C sellers in social media: Evidence from China. Omega 2019, 85, 83–93. [Google Scholar] [CrossRef]
  24. Yao, D.; Tang, C.; Chu, J. A dynamic model of owner acceptance in peer-to-peer sharing markets. Mark. Sci. 2022, 42, 166–188. [Google Scholar] [CrossRef]
  25. Cheng, M.-C.; Chang, C.-T.; Hsieh, T.-P. An inventory model with advertisement- and customer- relationship-management-sensitive demand for a product’s life cycle. Mathematics 2023, 11, 1555. [Google Scholar] [CrossRef]
  26. Huang, Z.; Li, S.; Mahajan, V. An analysis of manufacturer-retailer supply chain coordination in cooperative advertising. Decis. Sci. 2007, 33, 469–494. [Google Scholar] [CrossRef]
  27. Chutani, A.; Sethi, S.P. Dynamic cooperative advertising under manufacturer and retailer level competition. Eur. J. Oper. Res. 2018, 268, 635–652. [Google Scholar] [CrossRef]
  28. Farshbaf-Geranmayeh, A.; Zaccour, G. Pricing and advertising in a supply chain in the presence of strategic consumers. Omega 2021, 101, 102239. [Google Scholar] [CrossRef]
  29. Zhou, Y.; Bao, M.; Chen, X.; Xu, X. Co-op advertising and emission reduction cost sharing contracts and coordination in low-carbon supply chain based on fairness concerns. J. Clean. Prod. 2016, 133, 402–413. [Google Scholar] [CrossRef]
  30. Phan, D.A.; Hoa Vo, T.L.; Lai, A.N.; Nguyen, T.L.A. Coordinating contracts for VMI systems under manufacturer-CSR and retailer-marketing efforts. Int. J. Prod. Econ. 2019, 211, 98–118. [Google Scholar] [CrossRef]
  31. Li, G.; Wu, H.; Sethi, S.P.; Zhang, X. Contracting green product supply chains considering marketing efforts in the circular economy era. Int. J. Prod. Econ. 2021, 234, 108041. [Google Scholar] [CrossRef]
  32. Wu, X.; Zha, Y.; Yu, Y. Asymmetric retailers’ sales effort competition in the presence of a manufacturer’s help. Transp. Res. E—Logist. Transp. Rev. 2022, 159, 102625. [Google Scholar] [CrossRef]
  33. Zang, L.; Liu, M.; Wang, Z.; Wen, D. Coordinating a two-stage supply chain with external failure cost-sharing and risk-averse agents. J. Clean. Prod. 2022, 334, 130012. [Google Scholar] [CrossRef]
  34. Ha, A.Y.; Tian, Q.; Tong, S. Information sharing in competing supply chains with production cost reduction. Mark. Sci. 2017, 19, 246–262. [Google Scholar] [CrossRef]
  35. Guo, Y.; Yu, J.; Allaoui, H.; Choudhary, A. Lateral collaboration with cost-sharing in sustainable supply chain optimization: A combinatorial framework. Transp. Res. E—Logist. Transp. Rev. 2022, 157, 102593. [Google Scholar] [CrossRef]
  36. Sarkees, M.; Luchs, R. The influence of marketing and innovation investments on alliance type choice. J. Bus. Ind. Mark. 2015, 30, 626–636. [Google Scholar] [CrossRef]
  37. Schiavone, F.; Simoni, M. Strategic marketing approaches for the diffusion of innovation in highly regulated industrial markets: The value of market access. J. Bus. Ind. Mark. 2019, 34, 905–929. [Google Scholar] [CrossRef]
  38. Du, L.; Hu, M.; Wu, J. Sales effort management under all-or-nothing constraint. Manag. Sci. 2022, 68, 5109–5126. [Google Scholar] [CrossRef]
  39. Duan, H.; Deng, S.; Song, H.; Xu, J. The impacts of sales efforts and mode of payment on the competition between agent and retailer. Omega 2021, 103, 102416. [Google Scholar] [CrossRef]
  40. Li, X.; Qi, X.; Li, Y. On sales effort and pricing decisions under alternative risk criteria. Eur. J. Oper. Res. 2021, 293, 603–614. [Google Scholar] [CrossRef]
  41. Xu, S.; Tang, H.; Lin, Z.; Lu, J. Pricing and sales-effort analysis of dual-channel supply chain with channel preference, cross-channel return and free riding behavior based on revenue-sharing contract. Int. J. Prod. Econ. 2022, 249, 108506. [Google Scholar] [CrossRef]
  42. Taylor, T.A. Supply chain coordination under channel rebates with sales effort effects. Manag. Sci. 2002, 48, 992–1007. [Google Scholar] [CrossRef]
  43. Rastogi, T.; Agarwal, B.; Gopal, G. Exploring the nexus between sustainable marketing and customer loyalty with the mediating role of brand image. J. Clean. Prod. 2024, 440, 140808. [Google Scholar] [CrossRef]
  44. Li, Q.; Zhang, J.; Huang, Y.; Qi, E. Research on the marketing strategy of community group buying supply chain based on network externality. Chin. J. Manag. Sci. 2022, 32, 75–86. [Google Scholar] [CrossRef]
  45. Ma, P.; Wang, H.; Shang, J. Contract design for two-stage supply chain coordination: Integrating manufacturer-quality and retailer-marketing efforts. Int. J. Prod. Econ. 2013, 146, 745–755. [Google Scholar] [CrossRef]
  46. Sun, H.; Zhong, Y. Carbon emission reduction and green marketing decisions in a two-echelon low-carbon supply chain considering fairness concern. J. Bus. Ind. Mark. 2023, 38, 905–929. [Google Scholar] [CrossRef]
  47. Li, C.; Yang, T.; Shi, Y. Blockchain adoption and organic subsidy in an agricultural supply chain considering market segmentation. Mathematics 2024, 12, 106. [Google Scholar] [CrossRef]
  48. Fan, H.; Khouja, M.; Gao, J.; Zhou, J. Incorporating social learning into the optimal return and pricing decisions of online retailers. Omega 2023, 118, 102861. [Google Scholar] [CrossRef]
  49. Raj, A.; Modak, N.M.; Kelle, P.; Singh, B. Analysis of a dyadic sustainable supply chain under asymmetric information. Eur. J. Oper. Res. 2021, 289, 582–594. [Google Scholar] [CrossRef]
Figure 1. The three strategies.
Mathematics 12 01635 g001
Figure 2. A comparison of the wholesale prices.
Mathematics 12 01635 g002
Figure 3. The marketing effort made by the retailer.
Mathematics 12 01635 g003
Figure 4. The part of the marketing effort cost borne by the retailer.
Mathematics 12 01635 g004
Figure 5. A comparison of the selling prices.
Mathematics 12 01635 g005
Figure 6. A comparison of the supply chain profits.
Mathematics 12 01635 g006
Figure 7. A comparison of the manufacturers’ profits.
Mathematics 12 01635 g007
Figure 8. A comparison of the retailers’ profits.
Mathematics 12 01635 g008
Figure 9. A comparison of the consumer surplus.
Mathematics 12 01635 g009
Figure 10. A comparison of the social welfare.
Mathematics 12 01635 g010
Table 1. Summary of the literature review.
ArticlesCross-
Shareholding
Cost SharingMarketing EffortTwo-Echelon
Supply Chain
Du et al. (2022) [38]
Duan et al. (2021) [39]
Li et al. (2021) [31]
Xu et al. (2022) [41]
Li et al. (2022) [44]
Chutani and Sethi (2018) [27]
Zhou et al. (2016) [29]
Phan et al. (2019) [30]
Hong and Guo (2019) [5]
Wu et al. (2022) [32]
Chen et al. (2017) [15]
Xia et al. (2021) [17]
Ren et al. (2021) [4]
Wang et al. (2023) [19]
This paper
Table 2. Parameters and variables.
Decision VariablesDescriptions
p The   selling   price   ( p > w )
w The   wholesale   price   ( w > c )
v The   marketing   effort   level   of   the   retailer   ( v > 0 )
Parameters
α The   cos t   shared   coefficient   ( 0 < α < 1 )
D The   maximum   market   demand   ( D > 0 )
c The   production   cos t   ( c > 0 )
ε The   price   sensitivity   of   the   consumer   ( ε > 0 )
δ The   market   effort   sensitivity   of   the   consumer   ( δ > 0 )
h The   cos t   rate   of   the   marketing   effort   ( h > 0 )
φ m The   proportion   of   the   retailer s   shares   held   by   the   manufacturer   ( 0 < φ m < 50 % )
φ r The   proportion   of   the   manufacturer s   shares   held   by   the   retailer   ( 0 < φ r < 50 % )
k The sales rebate
Π m The profit of the manufacturer
Π r The profit of the retailer
Π t The profit of the supply chain
Disclaimer/Publisher’s Note: The statements, opinions and data contained in all publications are solely those of the individual author(s) and contributor(s) and not of MDPI and/or the editor(s). MDPI and/or the editor(s) disclaim responsibility for any injury to people or property resulting from any ideas, methods, instructions or products referred to in the content.

