Article

Predicting Scientific Breakthroughs Based on Structural Dynamic of Citation Cascades

School of Information Management, Sun Yat-sen University, Guangzhou 510006, China
*
Author to whom correspondence should be addressed.
Mathematics 2024, 12(11), 1741; https://doi.org/10.3390/math12111741
Submission received: 7 May 2024 / Revised: 29 May 2024 / Accepted: 31 May 2024 / Published: 3 June 2024
(This article belongs to the Special Issue Application of Machine Learning and Data Mining)

Abstract

:
Predicting breakthrough papers holds great significance; however, prior studies encountered challenges in this task, indicating a need for substantial improvement. We propose that the failure to capture the dynamic structural-evolutionary features of citation networks is one of the major reasons. To overcome this limitation, this paper introduces a new method for constructing citation cascades of focus papers, allowing the creation of a time-series-like set of citation cascades. Then, through a thorough review, three types of structural indicators in these citation networks that could reflect breakthroughs are identified, including certain basic topological metrics, PageRank values, and the von Neumann graph entropy. Based on the time-series-like set of citation cascades, the dynamic trajectories of these indicators are calculated and employed as predictors. Using the Nobel Prize-winning papers as a landmark dataset, our prediction method yields approximately a 7% improvement in the ROC-AUC score compared to static-based prior methods. Additionally, our method advances in achieving earlier predictions than other previous methods. The main contribution of this paper is proposing a novel method for creating citation cascades in chronological order and confirming the significance of predicting breakthroughs from a dynamic structural perspective.
MSC:
05C82; 68T20

1. Introduction

Scientific breakthroughs often imply the new emergence and growth of science or society [1]. Many recent studies have focused on capturing the characteristics of breakthroughs and trying to predict them. One of the characteristics drawn from classical and widely acknowledged theories exhibits potential power in predictions: breakthrough discoveries often lead to dramatic changes in knowledge evolution [2]. Certain theories, like the theory of disruptive innovation [3], Kuhn’s concept of paradigm shift [4], and other classical theories, all share this perspective.
In this perspective, the variation in the knowledge structure represents one important dimension of the so-called “dramatic changes”, which is accessible and easy to quantify compared to other dimensions. In recent years, this idea has attracted great interest, and several works of literature have been designed based on it. They benefit from the advancement of complex network technology, which allows them to model the knowledge evolution structure. Among them, there is one kind of complex network, the citation cascades [5], showing power in breakthrough predictions. Citation cascades refer to a type of citation structure that involves the constitution of a series of subsequent citing events initiated by a focus paper (more details are in the reference [6]). Using the citing cascades, Min et al. [2] predicted the Nobel Prize-winning papers based on their topological metrics and achieved a performance that exceeded prior methods. Theoretically, they also confirmed that the variation in knowledge structure indicated scientific breakthroughs.
However, despite numerous methods proposed to predict scientific breakthroughs, accurately predicting them remains very hard, as confirmed consistently [2,7,8]. They claim that it is challenging to identify scientific breakthroughs, with predicting them being even more difficult. The aforementioned prediction, based on the basic topological metrics of citation cascades by Min et al. [2], only achieved less than 70% of the highest AUC score, indicating great room for improvement and a long distance to go before practical application. Through a literature review, we conclude that the static nature of prior methods, which are based mostly on a particular snapshot of the structure of knowledge evolution, impedes the prediction performance, while intuitively, the “dramatic change in knowledge structure” exhibits a strong dynamic nature.
We argue that the dynamic structure of knowledge evolution can reveal further information beyond static topological metrics, enhancing the prediction of breakthrough papers. One possibility, for example, is that different structural features may exhibit distinct characteristics at earlier and later stages of knowledge evolution. Nevertheless, capturing information about the dynamic evolution of citation cascades poses a challenge. This is closely related to the construction methods of citation cascades (more details in Section 2.2 and Section 3.3). Due to the explosive growth potential of citation cascade networks, certain restrictions are necessary. Previous studies limit the time span of citation cascades (for example, restricting the cascades within 2, 3, or 4 years after the focus paper’s publication year), and though it is effective to some extent, this also poses difficulties in capturing the dynamic properties of citation cascades. Hence, we aim to adjust the construction method of cascade citations to capture their dynamic nature for predicting scientific breakthroughs.
In this paper, we modify the construction of citation cascades. Under this construction method, the citation cascades grow the edges in a chronological order and have a limited number of edges. By considering the citation cascades at various growth stages, a series of snapshots is generated. Then, specific structure metrics of these snapshots are calculated, thereby leading to time-series-like data, and they serve as the raw predictors. In the experiment of this study, the structure metrics involve the basic topological metrics, PageRank values, and the von Neumann graph entropy. Finally, we extract certain features as predictors from this time-series-like data and utilize them to predict scientific breakthroughs.
In summary, we aim to quantify the dynamic evolution of knowledge structure to predict scientific breakthroughs, with citation cascades as the agents. Using the Nobel Prize-winning papers as a landmark dataset of scientific breakthroughs, prediction experiments are performed; it is anticipated that our method surpasses the static approach and achieves a higher prediction performance.
In Section 2, we provide a brief overview of scientific breakthroughs, predicting breakthroughs, and citation cascades. Section 3 illustrates our forecasting method and modeling process. Section 4 shows the prediction performance and compares our method with previous approaches. The final Section 5 addresses our contributions, implications, and future directions.

2. Background

2.1. Definition and Prediction of Breakthroughs

2.1.1. Scientific Breakthroughs

Scientific breakthroughs do not have a widely accepted definition. Some studies in recent years have defined them as scientific advancements that can override and significantly expand existing knowledge and even create new fields [9]. Many studies that predict or identify breakthroughs often root in this idea.
A breakthrough drives new growth [10]. And scientific breakthroughs are more transformative, triggering new growth in wide ranges and involving academic, social, and economic aspects. Therefore, forecasting and nurturing scientific breakthroughs are crucial. Especially in the post-epidemic era, the COVID-19 pandemic not only threatens human health but also profoundly changes the socioeconomic structure [11]. Scientific breakthroughs hold more significance. They are the key to offering novel solutions to some global challenges, drawing new growth points to stimulate economics, and providing the potential to address development disparities.
Some scholars categorize scientific breakthroughs into different types. For instance, the well-known cha-cha-cha theory [12]. It argues that scientific breakthroughs can be divided into three types: “solving obvious but previously unsolvable problems”, “addressing some accidental but crucial problems”, and “some discoveries challenge or cannot be explained by existing knowledge”. While the types of scientific breakthroughs are well explored, where and when they occur remains unclear. Some studies have identified correlations with scientific breakthroughs, such as diverse knowledge [13] and scientists’ characteristics [14], but none of these can predict them. For example, in datasets with artificially constructed control groups, atypical combination index is not able to differentiate Nobel Prize-winning papers [15]. It is challenging to pinpoint when and where a scientific breakthrough happens in a vast dataset instead of with artificially constructed control groups. In short, predicting scientific breakthroughs is a challenging task. In the following section, we will also highlight this point.

2.1.2. Predicting Breakthroughs

In this section, the primary methods for identifying or predicting scientific breakthroughs are outlined.
From the perspective of knowledge structure variation to predict scientific breakthroughs, there are various methods. The most famous one is the Disruption Index [16,17], which has been featured in papers published in some reputed journals like Nature or Science several times [18,19]. Figure 1 illustrates its basic idea and computation method. This method evaluates the breakthrough of a focus paper by checking if the citing papers (of the focus paper) cite the focus paper’s references. There are numerous variations of this method, including adjustments to the detailed calculation process and integrated knowledge entities in it [7,20]. However, all these methods have significant difficulty predicting scientific breakthroughs effectively. The Disruptive Index fails to differentiate Nobel Prize-winning papers, and its enhanced methodology also struggles with this task [7,21].
Another approach based on knowledge structure variation utilizes the citation cascades as an agent for scientific evolution. The topological indicators of them are employed to predict breakthroughs, and they achieve promising outcomes [2,8]. However, only certain topological indicators are effective in predicting, including the average clustering coefficient, average degree, maximum closeness centrality, and number of components. They discover that papers with distinct characteristics of the above indicators indicate breakthroughs, which may suggest that breakthrough findings lead to greater knowledge structure variation. These effective indicators also hold theoretical significance. In the citation structure, the node’s degree indicates its influence on knowledge diffusion [22], and the closeness centrality reflects the effectiveness of knowledge dissemination [23], among other factors. However, the highest AUC scores in their papers on breakthrough predictions are only 69% in economics science and 67.5% in natural science, indicating the great challenge of predicting them. One of the reasons may be that they rely solely on static characteristics; they only use some topological metrics of citation cascades within a specific fixed time (a snapshot).
Other algorithms based on knowledge structure perspectives have also been proposed, in addition to the Disruption Index and the topological metrics of citation cascades. PageRank is a classical algorithm that measures the importance of a node and is commonly utilized in the information retrieval field [24]. Some literature has also used it to identify breakthrough patents, suggesting that an important node in a citation network may indicate a breakthrough [25].
However, these above indicators may remain limited. Other indicators may still be worth considering, especially those from complex network techniques. Entropy, for instance. Entropy is a crucial concept for complex networks, representing a wealth of information. The structure entropy of a graph can serve as an indicator of the complexity of a network. We believe that it is related to the “dramatic change” brought about by scientific breakthroughs. Therefore, we incorporate the von Neumann graph entropy [26] into our experiment.
Besides the method based on structure information, there are also many other dimensional methods. These approaches include expert-manual selection, content-based identification, and citation-count-based methods. (1) Manual selection is an effective but relatively inefficient method, yet it remains important [27]. Some examples are the selection of breakthroughs by the Science journal, the MIT press, and others. (2) At the content-based identification level, studies often analyze the topic distribution of focus papers using a topic model and assess their breakthroughs by examining the extent to which they cover previous and subsequent topics [28,29]. In the field of business, breakthrough patents are those that significantly differ from previous patents but are similar to subsequent patents [30]. Alternatively, keyword networks can be created, and their entropy is used to detect the surge in topic evolution [27]. Those that led to sudden topic evolution may be breakthroughs. (3) Citation count is often used as a proxy for breakthroughs [31], particularly in defining patent breakthroughs [32]. However, it exhibits obvious shortcomings. For example, review papers have higher citation counts but lack breakthroughs. Some studies point out its limitations: it may lead to bias [1], and it is proven to be challenging to identify scientific breakthroughs [2].

2.2. Citation Cascades

From the perspective of forecasting breakthroughs through the structure variation features, proxying knowledge structure is a challenging task. Citation behavior, or citation structure, is a crucial tool for analyzing the evolution of knowledge. Citation behavior is often viewed as a form of knowledge diffusion [33]. Then, these citations interact, forming a network-like citation structure. These network structures provide a strong foundation for modeling knowledge structures and creating advanced models to predict and improve organizational outcomes [34]. Since the whole citation network, being a huge complex graph, is challenging to use directly. The variational methods based on it are more practical. Among them, citation cascades have become a prominent one in recent years [5,6,35]. It is utilized for various tasks such as technology forecasting [2], agent knowledge structure [36] or intelligence structure [37], impact evaluation [38], scientific evaluation [39], topic detection or hot spot prediction [6], and cascade information exploration in social media [40]. A typical example of citation cascades is illustrated in Figure 2B.
We specifically explain the citation cascades, as they are a feasible and promising tool for forecasting scientific breakthroughs [5]. Citation cascades are created from a focus paper to represent the knowledge flow it initiates. Initially, the generation of citations is defined as “the collection of papers that cite a focus paper either directly (first generation) or indirectly (through a path in the citation graph originating from a citing paper and ending at the focus paper)” [41]. Min et al. develop this idea and use it to predict breakthroughs [2]. It is notable that each focus paper spans its citation cascade networks, which occur individually, as depicted in Figure 2A. They utilize the basic topological metrics of these citation cascades to predict which focus paper is a scientific breakthrough.
However, as mentioned in Section 1, the growth of citation cascade networks is inherently explosive. For a simple example, if each generation has 20 citations, there will be millions of citations with only five generations. Therefore, certain restrictions are typically necessary when using them. Create citation cascades with a limited number of generations, and in Figure 2C, three generations are selected. However, this approach remains limited by the highly uneven distribution of the number of papers in the citation cascades. Min et al. address this issue by restricting their growth time, such as limiting them to 2–4 years after the publication of the focus paper. An example can be seen in Figure 2D. While this approach is effective in some cases, it is static and struggles to capture the dynamic nature of knowledge structures. Additionally, this approach may lead to an uneven distribution of citation sizes among papers: some papers may experience rapid growth in the cascades, while others, known as “sleeping beauty literature” [42], may remain dormant for a long time. Hence, we adjust the structure of cascading citations to reflect their dynamic nature, as detailed in Section 3.3.
The citation structure not only involves the citation cascades but also includes various forms like main path analysis [43], the max-min method to identify core nodes in the network [44,45], and others. These technologies, especially their combination with intelligence algorithms like deep learning and machine learning, are potential methods for future studies.

3. Methodology

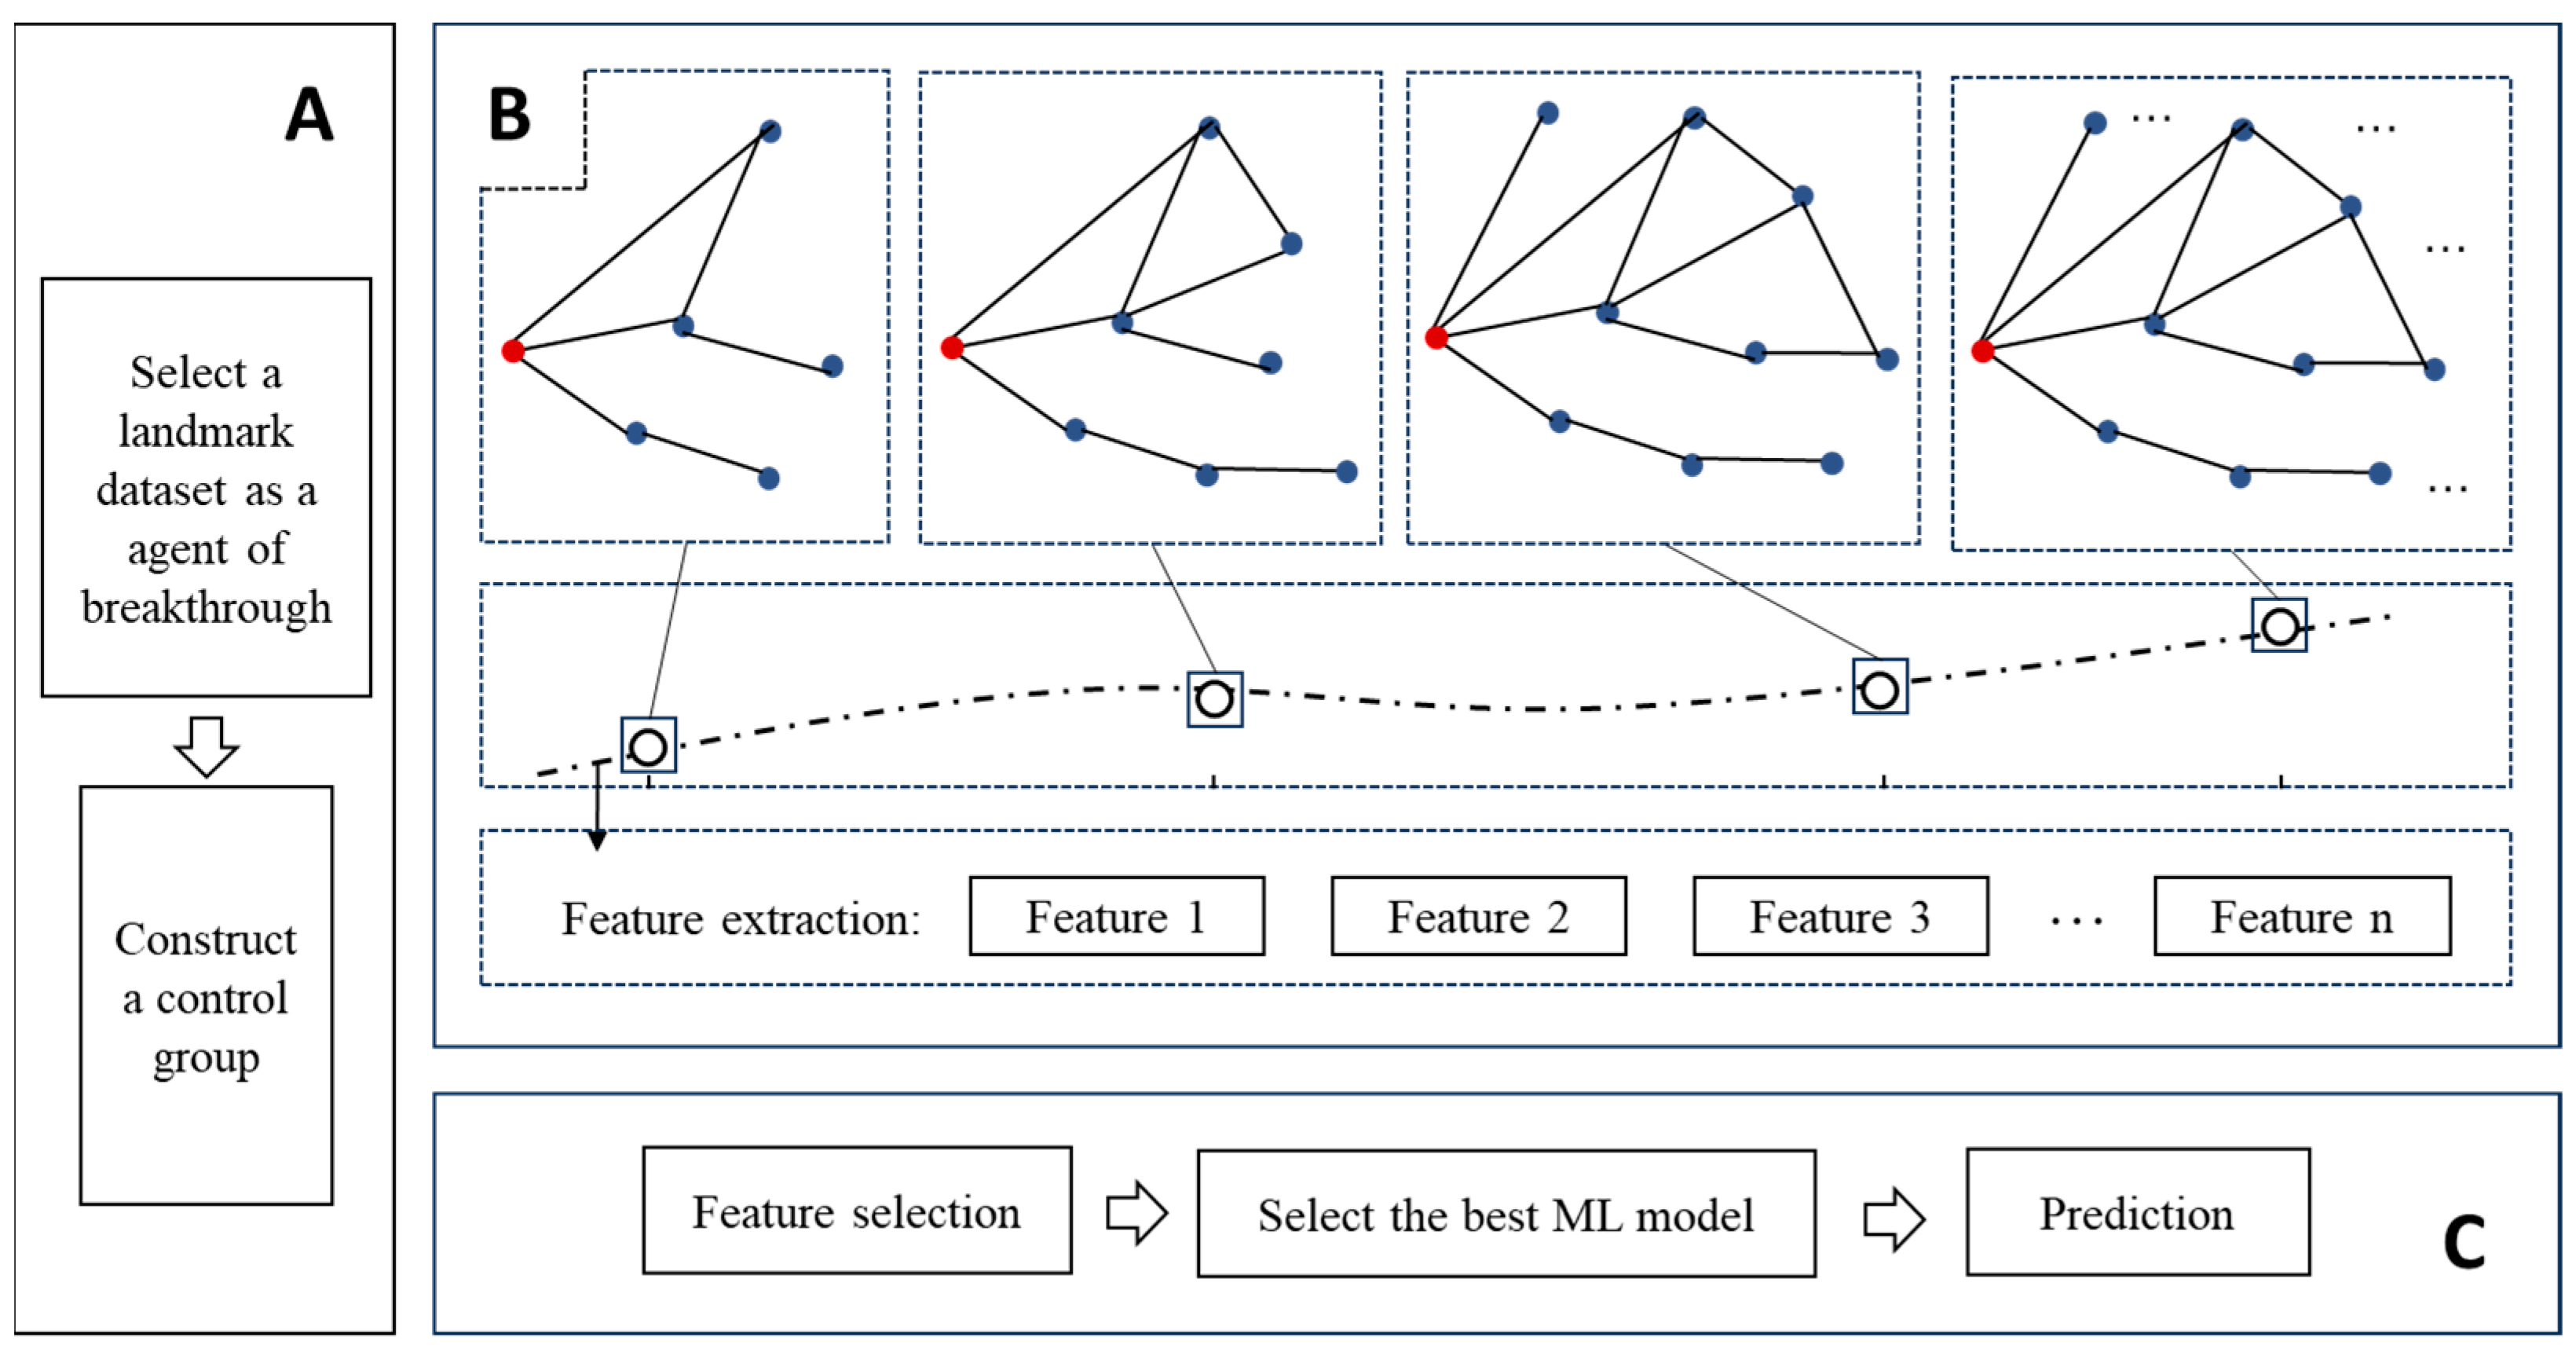
3.1. Overviews of the Research Processs

The following paragraphs describe the methodology used in this study. The basic process is illustrated in Figure 3, and further details are presented in the following Sections (Section 3.2, Section 3.3, Section 3.4, Section 3.5 and Section 3.6).
(1)
The dataset of Nobel Prize-winning papers is chosen as a landmark of scientific breakthroughs. (More details are shown in Section 3.2).
(2)
Find a control group for the breakthrough dataset, representing the non-breakthrough papers. (More details are shown in Section 3.2).
(3)
Construct citation cascade networks for each paper using our method. After that, a series of snapshots of the cascade networks is generated. (More details are shown in Section 3.3).
(4)
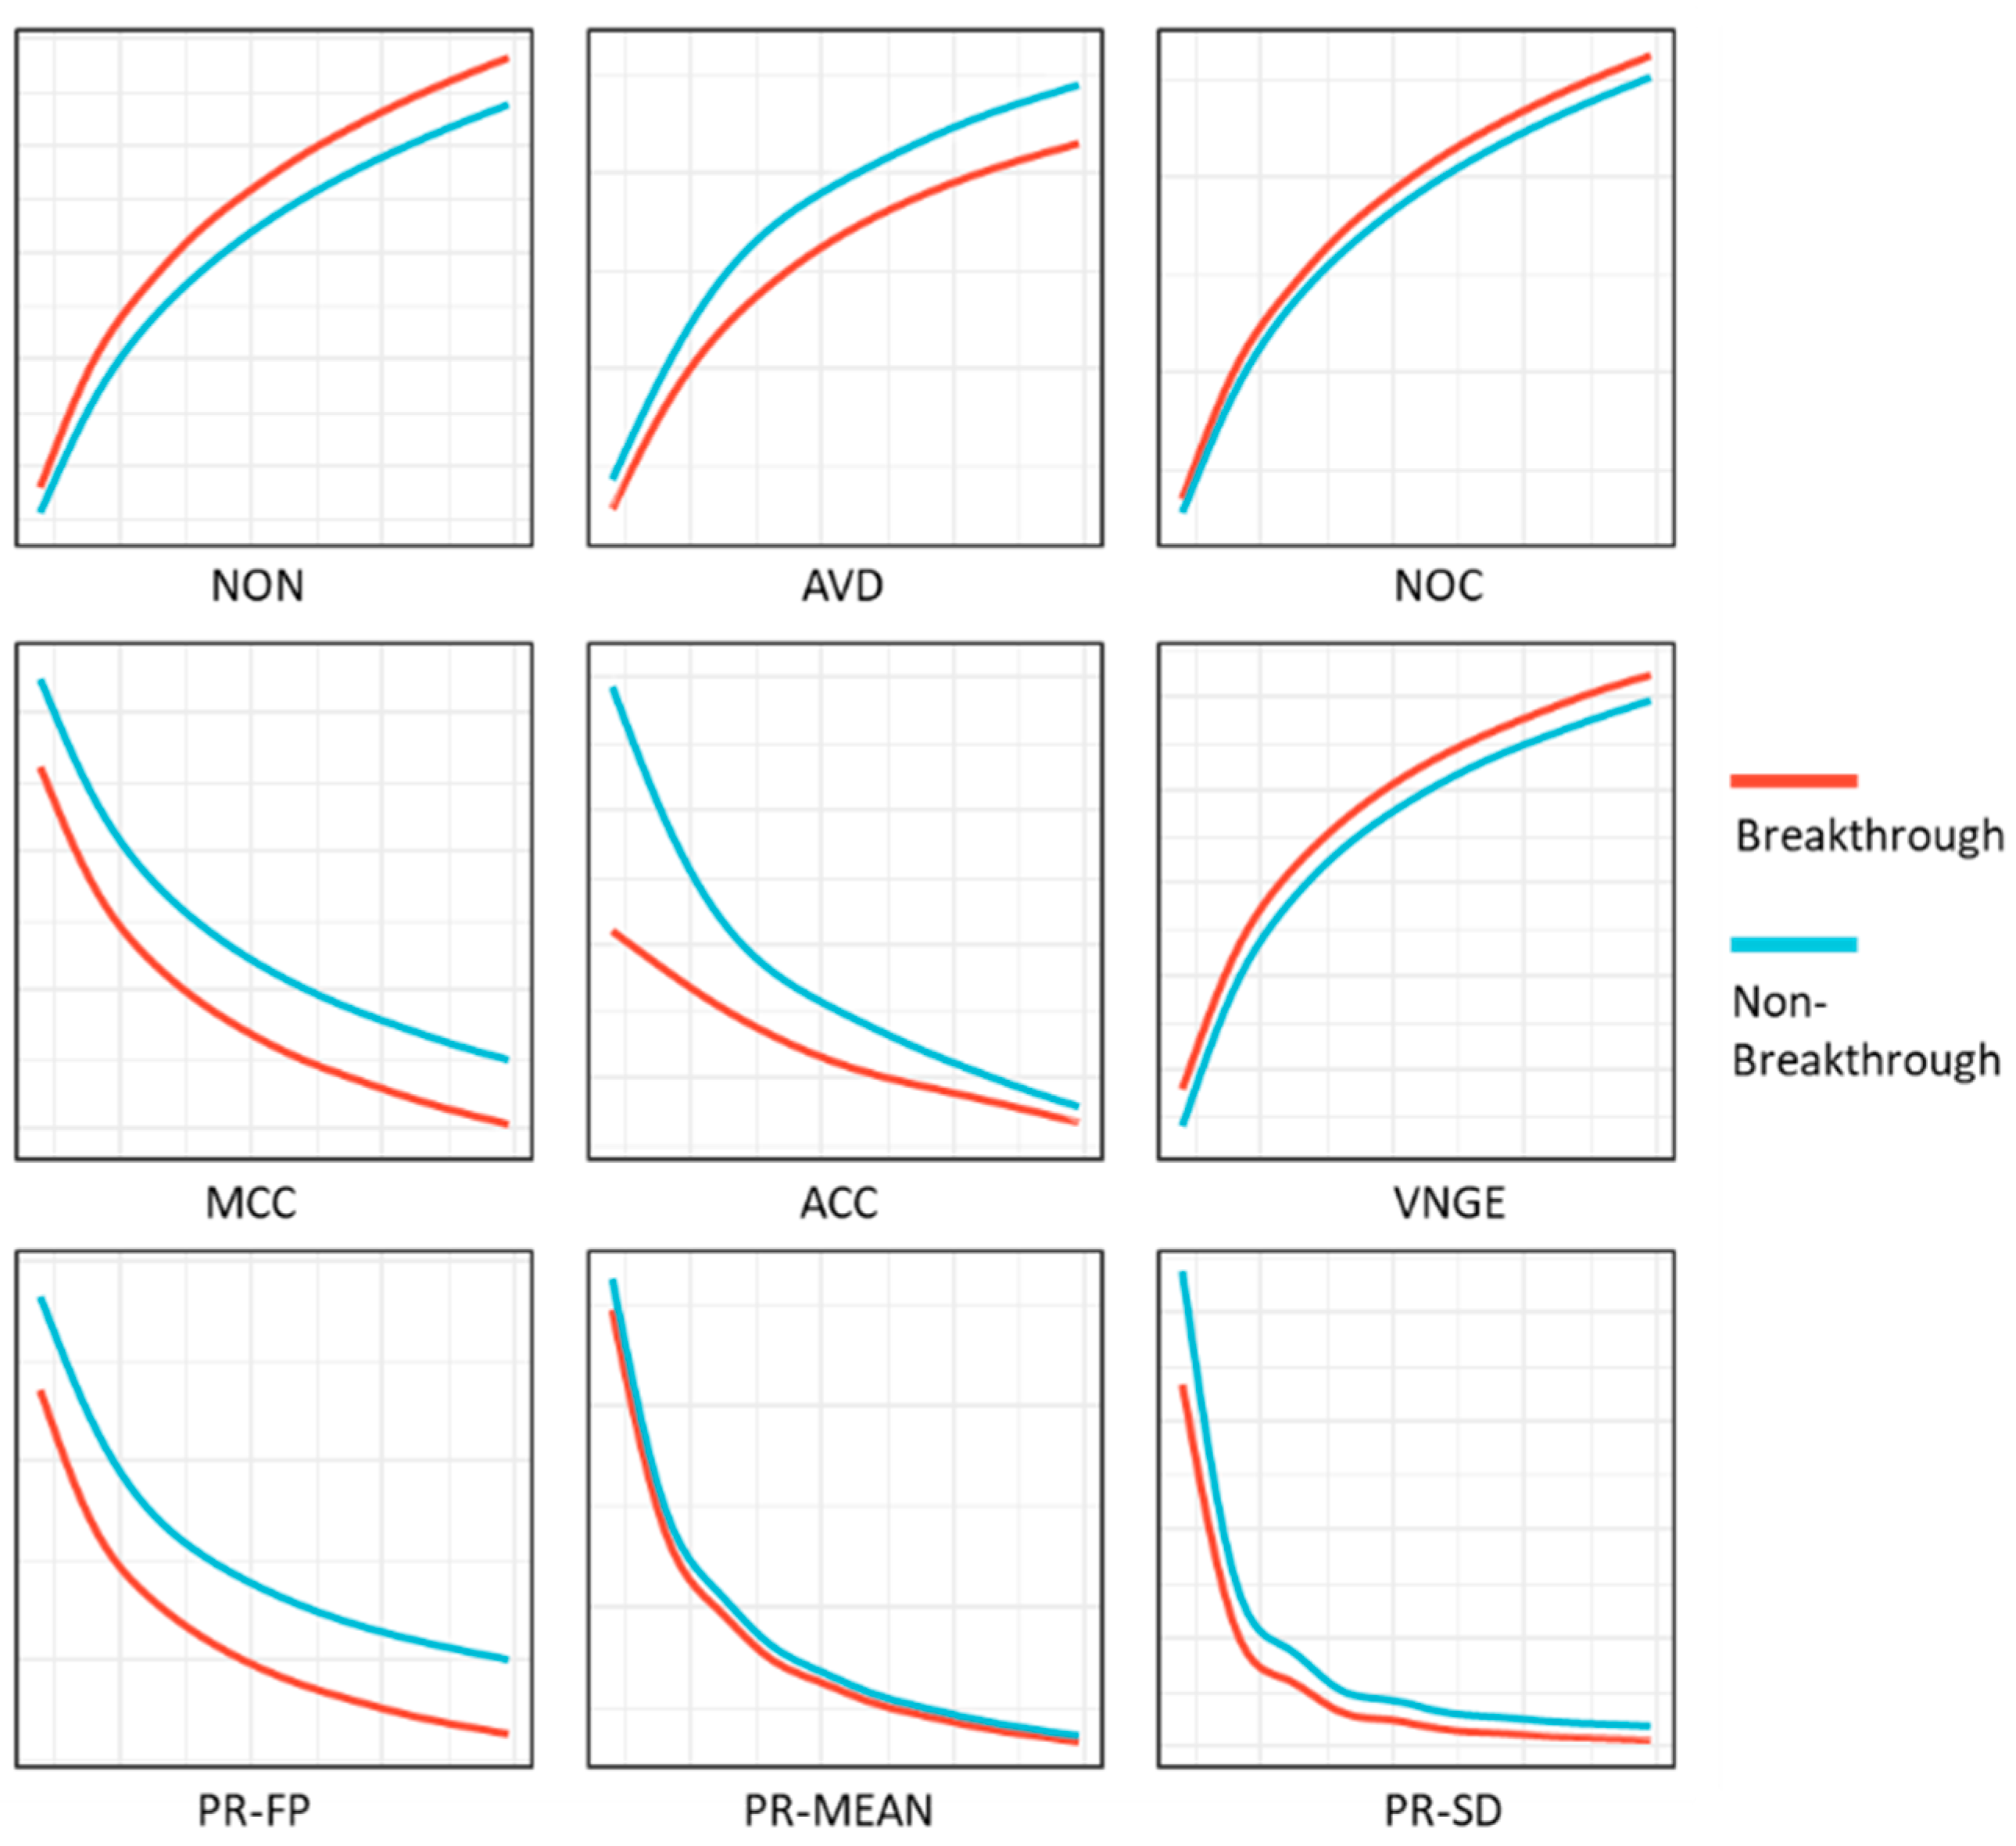
Calculate specific structural indicators for these series of citation cascade network snapshots. The indicators include the number of nodes, average clustering coefficient, average degree, maximum closeness centrality, number of components, PageRank value of the focus paper, mean value and variance of PageRank, and the von Neumann graph entropy. In this step, the series data for these metrics is then generated. (More details are shown in Section 3.4 and Section 3.5).
(5)
Feature selections: extract certain features from the series data. (More details are shown in Section 3.5).
(6)
Finally, the extracted features are utilized to forecast scientific breakthroughs using machine learning algorithms. (More details are shown in Section 3.5).

3.2. Landmark Dataset

With increased attention to scientific breakthroughs, landmark datasets have been created. Among them, the most widely used and acknowledged are the Nobel Prize-winning papers. The Nobel Prize signifies broad recognition within the academic community, often acknowledging the scientists who discover breakthrough findings. Though the Nobel Prize is awarded to individual scientists, it is primarily based on one or a few specific paper(s) by those winners. Hence, scholars have manually identified a dataset of Nobel Prize-winning papers [46], which is published in Scientific Data. According to this work, we compile a dataset of Nobel Prize-winning papers published after 1960, totaling 648 papers.
In the work of [46], the prize-winning papers are determined by the laureate’s speech. In general, winning papers are cited as references in the lectures. The paper that meets all the following criteria is considered a Nobel Prize-winning paper: (1) has at least one author with the same name as a Nobel Prize winner; (2) is published in the same period as the winning paper; (3) has consistent institution and co-author information with the award-winning paper; and (4) has a subject consistent with the motivation of the Nobel Prize.
To enable a prediction, it is necessary to establish a suitable control group. Based on previous research, certain variables need to be controlled [2,7]. According to previous literature, the citation count, team size (the number of authors of a paper), publication year, and academic discipline all influence breakthroughs and should be involved. Then, we ensure that the breakthrough and non-breakthrough paper groups have similar citation counts, which differ by 20% or less, are authored by the same number of individuals, published in the same year, and belong to the same discipline. Only one paper is randomly selected from the control papers that meet these criteria, thereby creating a one-to-one paired dataset.
The Matthew effect is significant, as Nobel Prize-winning papers tend to receive a high number of citations. Therefore, we ensure that the citation cascade networks for each Nobel Prize-winning paper have a shorter span than the prize year. Those who do not meet this criterion are excluded, and then 335 papers remain.
The metadata and citation data of papers in this study are sourced from the SciSciNet [47] and OpenAlex databases [48]. These databases are built on the well-known MAG (Microsoft academic graph) database, and their quality has also been checked by several studies.

3.3. Construction of Citation Cascades

As discussed earlier, constructing a citation cascade network for modeling scientific evolution is challenging due to its explosive nature. Previous studies have restricted cascading citation networks to 2–4 years after the focus paper publication. However, this approach leads to a static nature, making it hard to capture their dynamic structure characteristics for prediction.
To tackle the aforementioned issues, we suggest a new approach to constructing citation cascade networks. This method creates cascade citations by controlling the number of edges and selecting a fixed number (threshold) of edges in a chronological sequence. See Figure 4 for details. Firstly, we obtain the citation time for each citation, and all the citations are then sorted chronologically. Then, a threshold is set, and a fixed number of edges with the earliest citation time are chosen to build the citation cascade network. These processes can be executed using a graph traversal algorithm. With this construction method, it is possible to ensure an equal number of edges for each paper’s citation cascades. Most importantly, this method is able to capture citation cascade networks at different temporal snapshots. For instance, the snapshots of a cascade network have thresholds for the number of edges at 100, 200, 500, and 1000.
In our study, we set the maximum number of edges threshold at 1000. Starting with the 100 edges, every 10th edge increases, creating a snapshot until reaching 1000 edges. So, in total, this process yields 90 snapshots of the citation cascade networks. In the following sections, certain structure features of these snapshots are computed, then forming the time-series-like predictors.
The construction of cascade networks for the entire dataset, including the Nobel Prize-winning papers dataset and its control group, consists of 327,245 papers and 752,849 citations.
Formally, the pseudocode creating the citation cascades in chronological order is provided in Algorithm 1.
Algorithm 1. Create citation cascade network.
Input:  P f  (Focus paper).
Output: Citation cascade in chronological order.
1:
   P PotentialPapers
2:
   P SelectedPapers
3:
   I n d e x   0
4:
   T h r e s h o u l d 1000
5:
  Add all papers that cite t o   P PotentialPapers
6:
  while  I n d e x < 1000   a n d   P PotentialPapers do
7:
    Select paper P Index   w i t h   t h e e   a r l i e s t   c i t a t i o n   d a t e   f r o m   P PotentialPaper
8:
    Add P Index   t o   P SelectedPapers
9:
    Remove P Index   f r o m   P PotentialPapers
10:
    Add all papers that cite P Index   t o   P PotentialPaper
11:
     I n d e x   I n d e x + 1
12:
end while
13:
return  P SelectedPapers
In Algorithm 1, start by initializing the input focus papers. Create empty sets for the potential paper set and the selected paper set, and set the index to zero. Define a threshold of 1000 and include all papers citing the focus paper in the potential paper set. If the index is below 1000 and there are papers in the potential paper set, choose the paper with the earliest citation date, add it to the selected paper set, and remove it from the potential paper set. Add all articles citing this paper to the potential paper set and increment the index value by one. Finally, return the selected papers, which constitute the citation cascades.

3.4. Predictors

In this step, we calculate various metrics for each snapshot (cascade networks generated from every 10 edges increased), including the number of nodes, average clustering coefficient, average degree, maximum closeness centrality, number of components, PageRank value of the focus paper, average of PageRank values, variance of PageRank values, and the von Neumann graph entropy. The calculation of von Neumann graph entropy is detailed in a paper [49]. For each network structural metric abovementioned, time-series-like data are generated.
There are numerous mature algorithms available for extracting features from time-series data. Python’s tsfresh package [50] is one of them, and we extract features of the metrics time series using it. For the time series of indicators mentioned, a total of 1602 features were extracted.

3.4.1. Topological Indicators

The formal calculations of certain topological indicators used above are explained in this section.
Average degree:
A V D = 1 N i = 1 N k i
Average clustering coefficient:
A C C = 1 N i = 1 N C i
Maximum closeness centrality:
M C C = C C c max = max 1 j i d i , j
where the C i is defined as:
C i = 2 E i k i k i 1
Number of components (NOC): the number of connected components in a network.
In the Formulas (1)–(4), E i is the actual number of edges between the neighbors of node ( i ), k i is the degree of node ( i ) like the number of neighbor nodes directly connected to node ( i ), N is the number of nodes of the network, C i is the clustering coefficient of node ( i ), and d ( i ,   j ) denotes the shortest path between node ( i ) and node ( j ).

3.4.2. PageRank Indicator

The calculation of the PageRank value is defined by the Formula (5).
P i = 1 d N + d j M i P j L j
In Formula (5), P ( i ) is the PageRank value of the node ( i ), d is the damping factor (usually takes the value 0.85), N is the total number of pages in the network, M ( i ) is the set of all pages pointing to page ( i ), P ( j ) is the PageRank value of page ( j ), and L ( j ) is the number of outgoing links on page ( j ).

3.4.3. Graph Entropy Indicator

This section introduces some detail on the calculation of the von-Neumann graph entropy. Given a first unweighted graph G = V , E , A , where A is the symmetric adjacency matrix. The degree matrix is defined as D = diag d 1 , , d n , and its Laplacian matrix is L = D A . Its eigenvalues λ i are called the Laplacian spectrum. Here, H v n G   is the von Neumann graph entropy.
H v n G = i = 1 n λ i vol G l o g λ i vol G
The volume of the graph is:
vol G = i = 1 n λ i = trace L
However, the time complexity of computing the von-Neumann graph entropy directly is relatively high, which is O n 3 . The approximation is necessary. It is worth noting that Chen et al. have proposed an approximation method called FINGER [35], which reduces the cubic complexity to a linear complexity concerning the number of nodes and edges. The pseudocode is displayed in Algorithm 2.
Algorithm 2. Approximate Von-Neumann Graph Entropy (VNGE).
Input: Adjacency matrix A .
Output: Approximate von Neumann graph entropy  H v n .
1:
A a d j a c e n c y   m a t r i x   o f   a   g r a p h   w i t h   n o d e   n u m b e r   a n d   s p a r s i t y
2:
d s u m   o f   e l e m e n t s   i n   e a c h   r o w   o f   A
3:
c 1 / b d
4:
W e d g e   w e i g h t s   f r o m   n o n z e r o   e l e m e n t s   o f   A
5:
a p p r o x 1 c 2 b d 2 + b W 2
6:
L U n n o r m a l i z e d L a p l a c i a n A
7:
λ m a x l a r g e s t   e i g e n   v a l u e   o f   L
8:
H v n a p p r o x × log 2 λ m a x
9:
return  H v n
In Algorithm 2, the input is the adjacency matrix of the graph representation. The sum of elements in each row of the adjacency matrix is calculated and stored to create a vector. The inverse of the sum of these values is calculated to derive a constant. The edge weights of all non-zero elements in the adjacency matrix are then extracted. Use the extracted weights and the previously calculated vector to determine an intermediate approximation. Then, calculate the maximum eigenvalue of unnormalized Laplacian matrix. Finally, utilize the prior approximation and the maximum eigenvalue to compute the approximate von-Neumann graph entropy.

3.5. Forecasting Process

Due to the large number of features generated by our method, feature selection is required. Then, we utilize grid search to choose the top N variables and sequentially place variables to determine the optimal variable group and prediction impact. The N ranges from 1 to 100 with the step of 1 (i.e., 1, 2, 3, …, 100) and from 100 to 1600 with the step of 100 (i.e., 100, 150, …, 1600).
Indeed, we attempt various methods for feature selection engineering. Various methods, including the single filter method, RFE (Recursive Feature Elimination) and RFECV (Recursive Feature Elimination with Cross-Validation) [51], the shadow search method [52], and the filter combined with sequential modeling, are included. Finally, the used method (filter combined with sequential modeling) is found to be optimal.
The performance is assessed through two-repetitions and five-fold cross-validation (outer resampling), with the average ROC-AUC serving as the evaluation metric. The prediction performance using various representative classification models, including Random Forest, Logistic Regression, SVM (Support Vector Machine), LDA (Linear Discriminant Analysis), and Naive Bayes, is all considered. The best classification model is selected, and parameter tuning is conducted.
Here, we provide some brief introductions for each model. The random forest algorithm is an ensemble learning method using multiple decision trees to enhance classification and regression accuracy by averaging their results [53]. Logistic regression is a statistical model used for binary classification that estimates the probability of an input belonging to a specific category. SVM is a supervised learning model that finds the optimal hyperplane for classifying data into different categories in higher-dimensional space [54]. LDA is a dimensionality reduction technique used for classification by finding the linear combination of features that best separates classes. Naive Bayes is a probabilistic classifier based on Bayes’ theorem, assuming independence between predictors, suitable for large datasets and text classification.

3.6. Benchmark Indicators

In order to compare with the prior approaches, the static methods are selected for comparison. As mentioned in Section 2, certain static methods have been developed in prior studies. Here, we use the following indicators as benchmarks: The prediction process for these benchmark indicators follows the same procedure as described in Section 3.4, but without the need for feature selection.
(1) The static topological indicators of citation cascade networks. We select the topological metrics, including the number of nodes, average degree, maximum closeness centrality, number of components, and average clustering coefficient of the cascade networks, with a number of edges set at 1000 as a benchmark.
(2) The static PageRank indicators. The PageRank-based metrics (the PageRank value of the focus paper, average of PageRank values, and variance of PageRank values) are benchmarks, with the number of edges at 1000.
(3) The Disruptive Index. The Disruptive Index is a widely recognized metric for measuring disruption. The specific principles and calculation details can be found in Section 2 and the corresponding references.
(4) The (aggregated) static method, the union of static indicators in (1), (2), and (3).
The descriptions and calculation method of indicator (3), the Disruption Index, can be seen in Section 2.1.2 and especially in Figure 1. For Indicators (2) and (3), their descriptions and calculation methods are provided in Section 3.4.1, Section 3.4.2 and Section 3.4.3.

4. Results

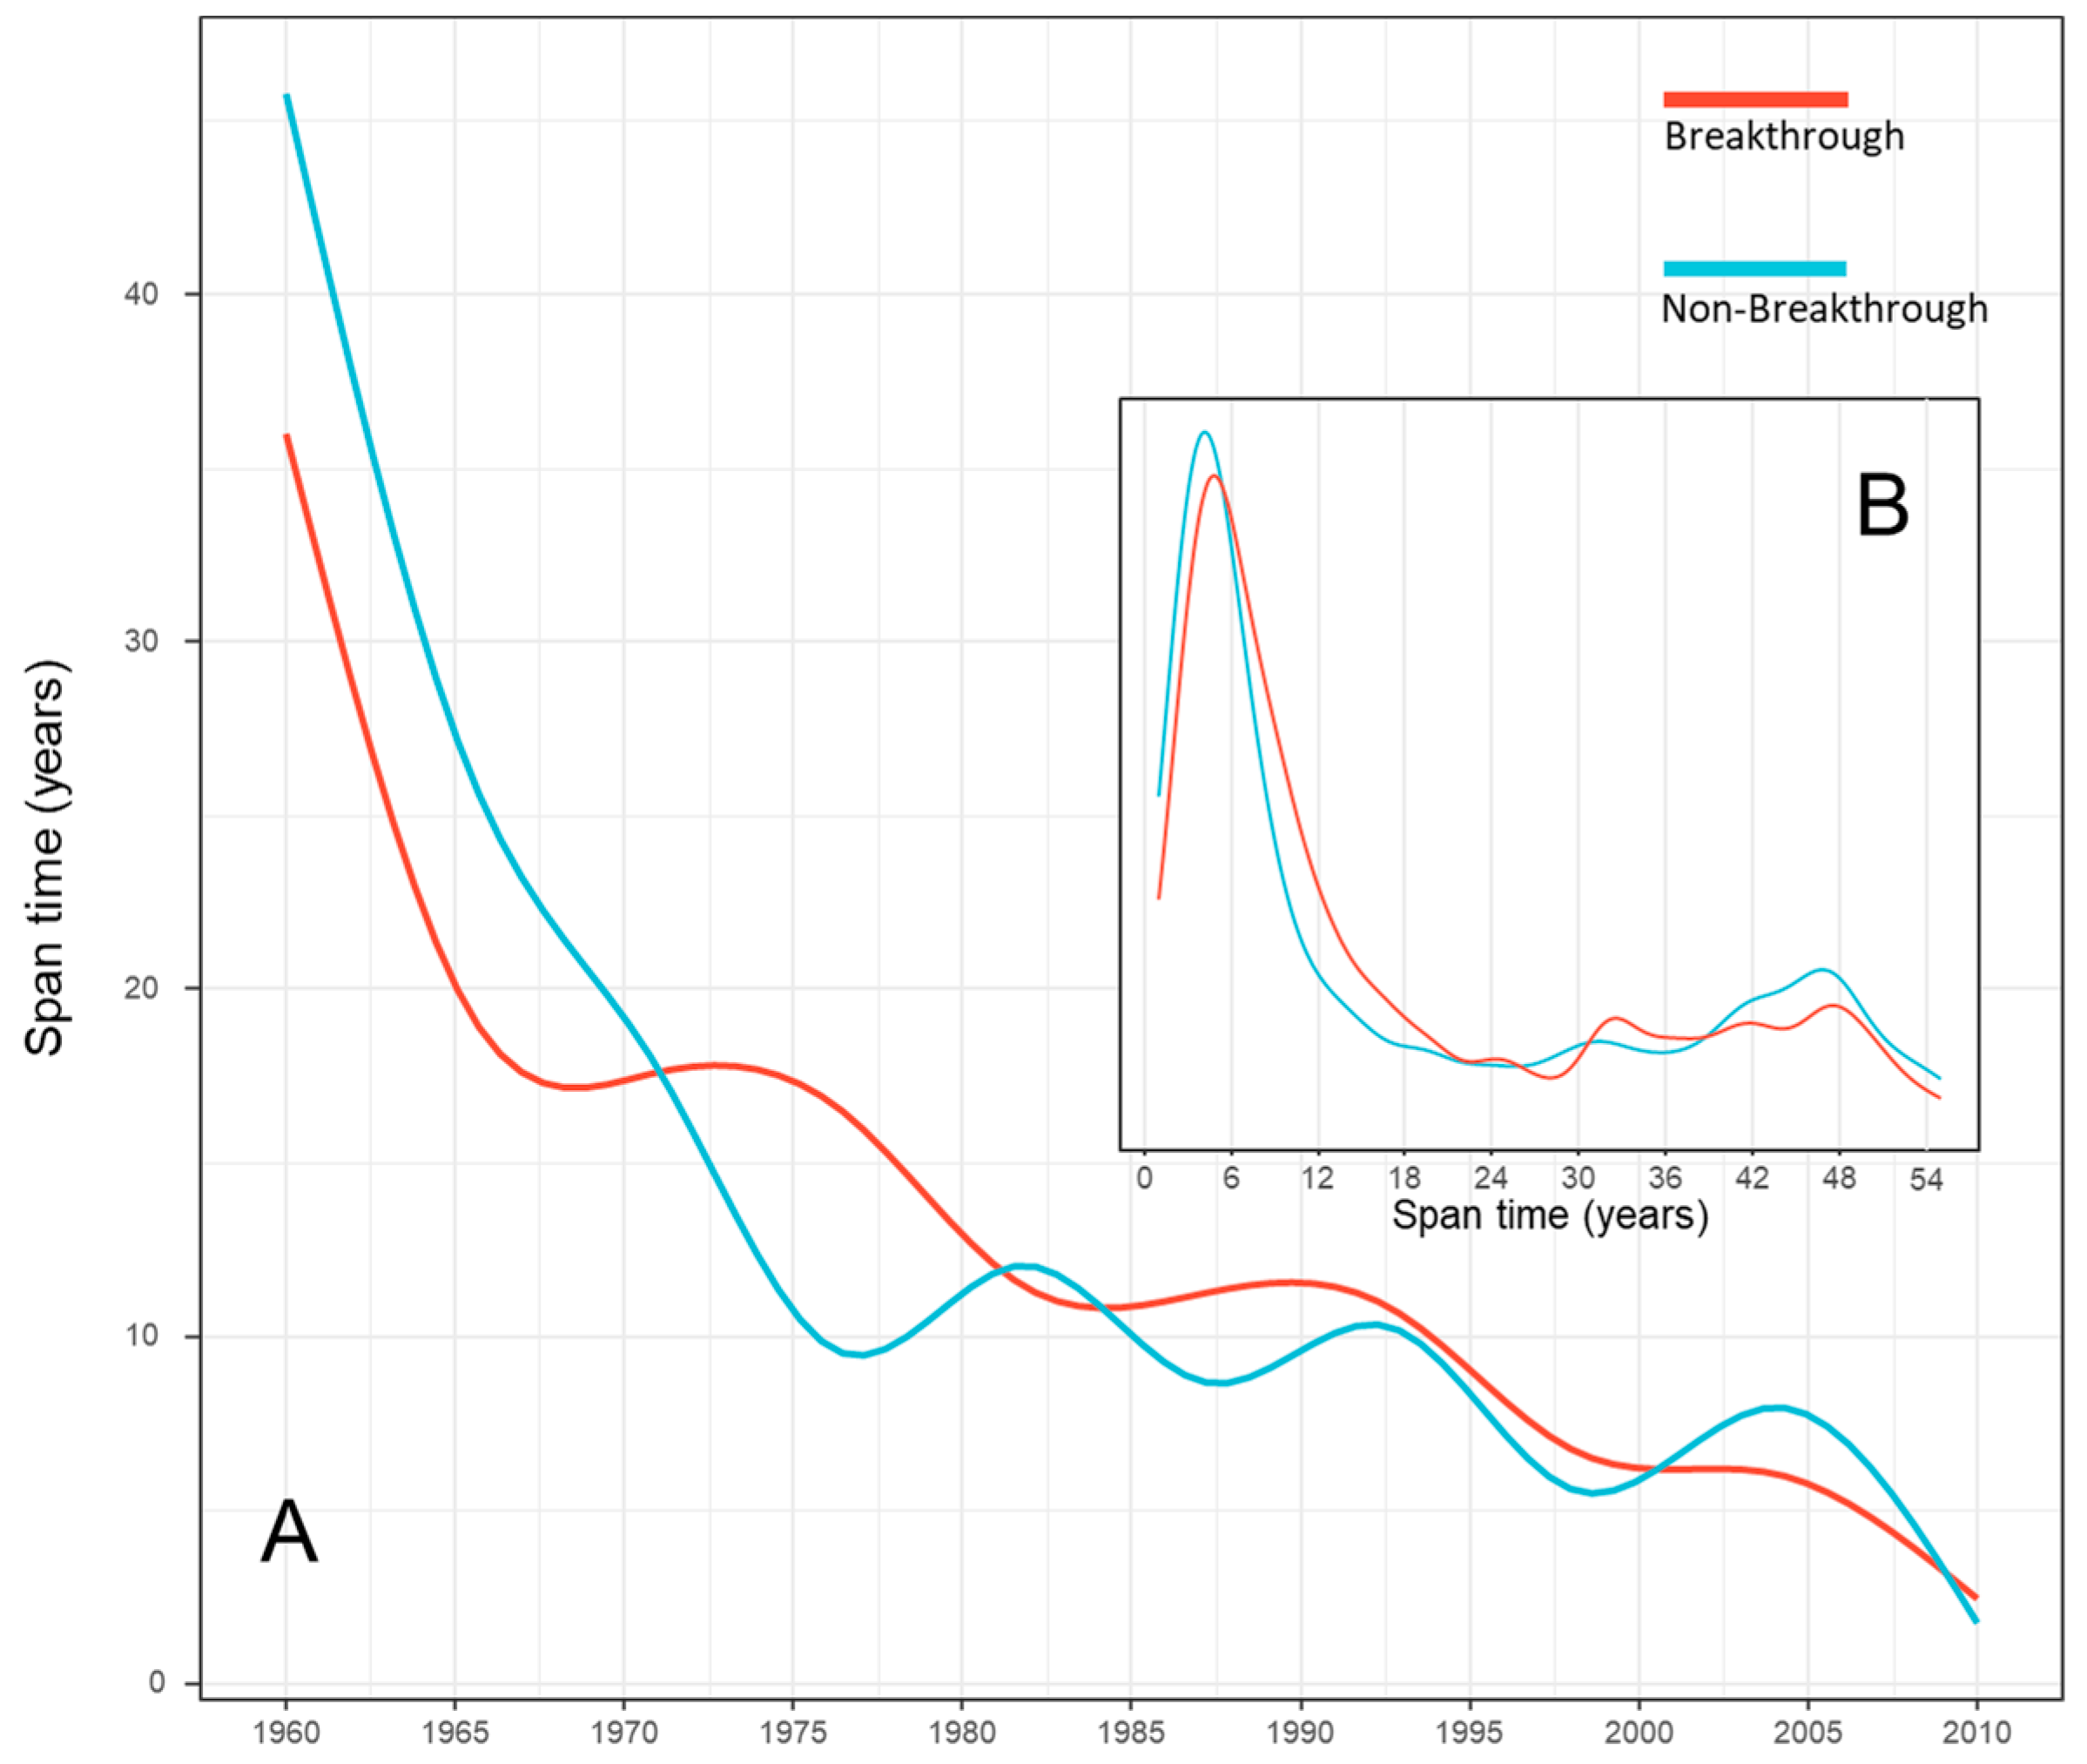
4.1. Descriptive Analysis

Figure 5 presents the trajectories of various metrics of the network as the number of edges expands. These trajectories in breakthrough and non-breakthrough papers show significant differences. In terms of certain metrics, including the average clustering coefficient and the variance of PageRank value, the gap between breakthrough and non-breakthrough papers is evident in the early stage of citation network growth, while for others, it is more pronounced in the later stages. This highlights the importance of tracking the dynamic trajectories of these multiple structural metrics, which offers more predictive insights than static networks.
The average time required to span a citation cascade network within 1000 edges is depicted in Figure 6. Figure 6B illustrates the distribution of the time needed in our empirical study, and the peak is typically less than 6 years. Figure 6A shows the relationship between the time needed for spanning citation cascades and the papers’ publication year. It is evident that, as time progresses, the speed of spanning cascade citations increases significantly, with the span time dropping to about 2 years around 2010. The above analysis shows that this network construction method allows for early prediction of breakthrough papers. In the future, it will be earlier due to the faster growth of cascades.

4.2. Prediction Results
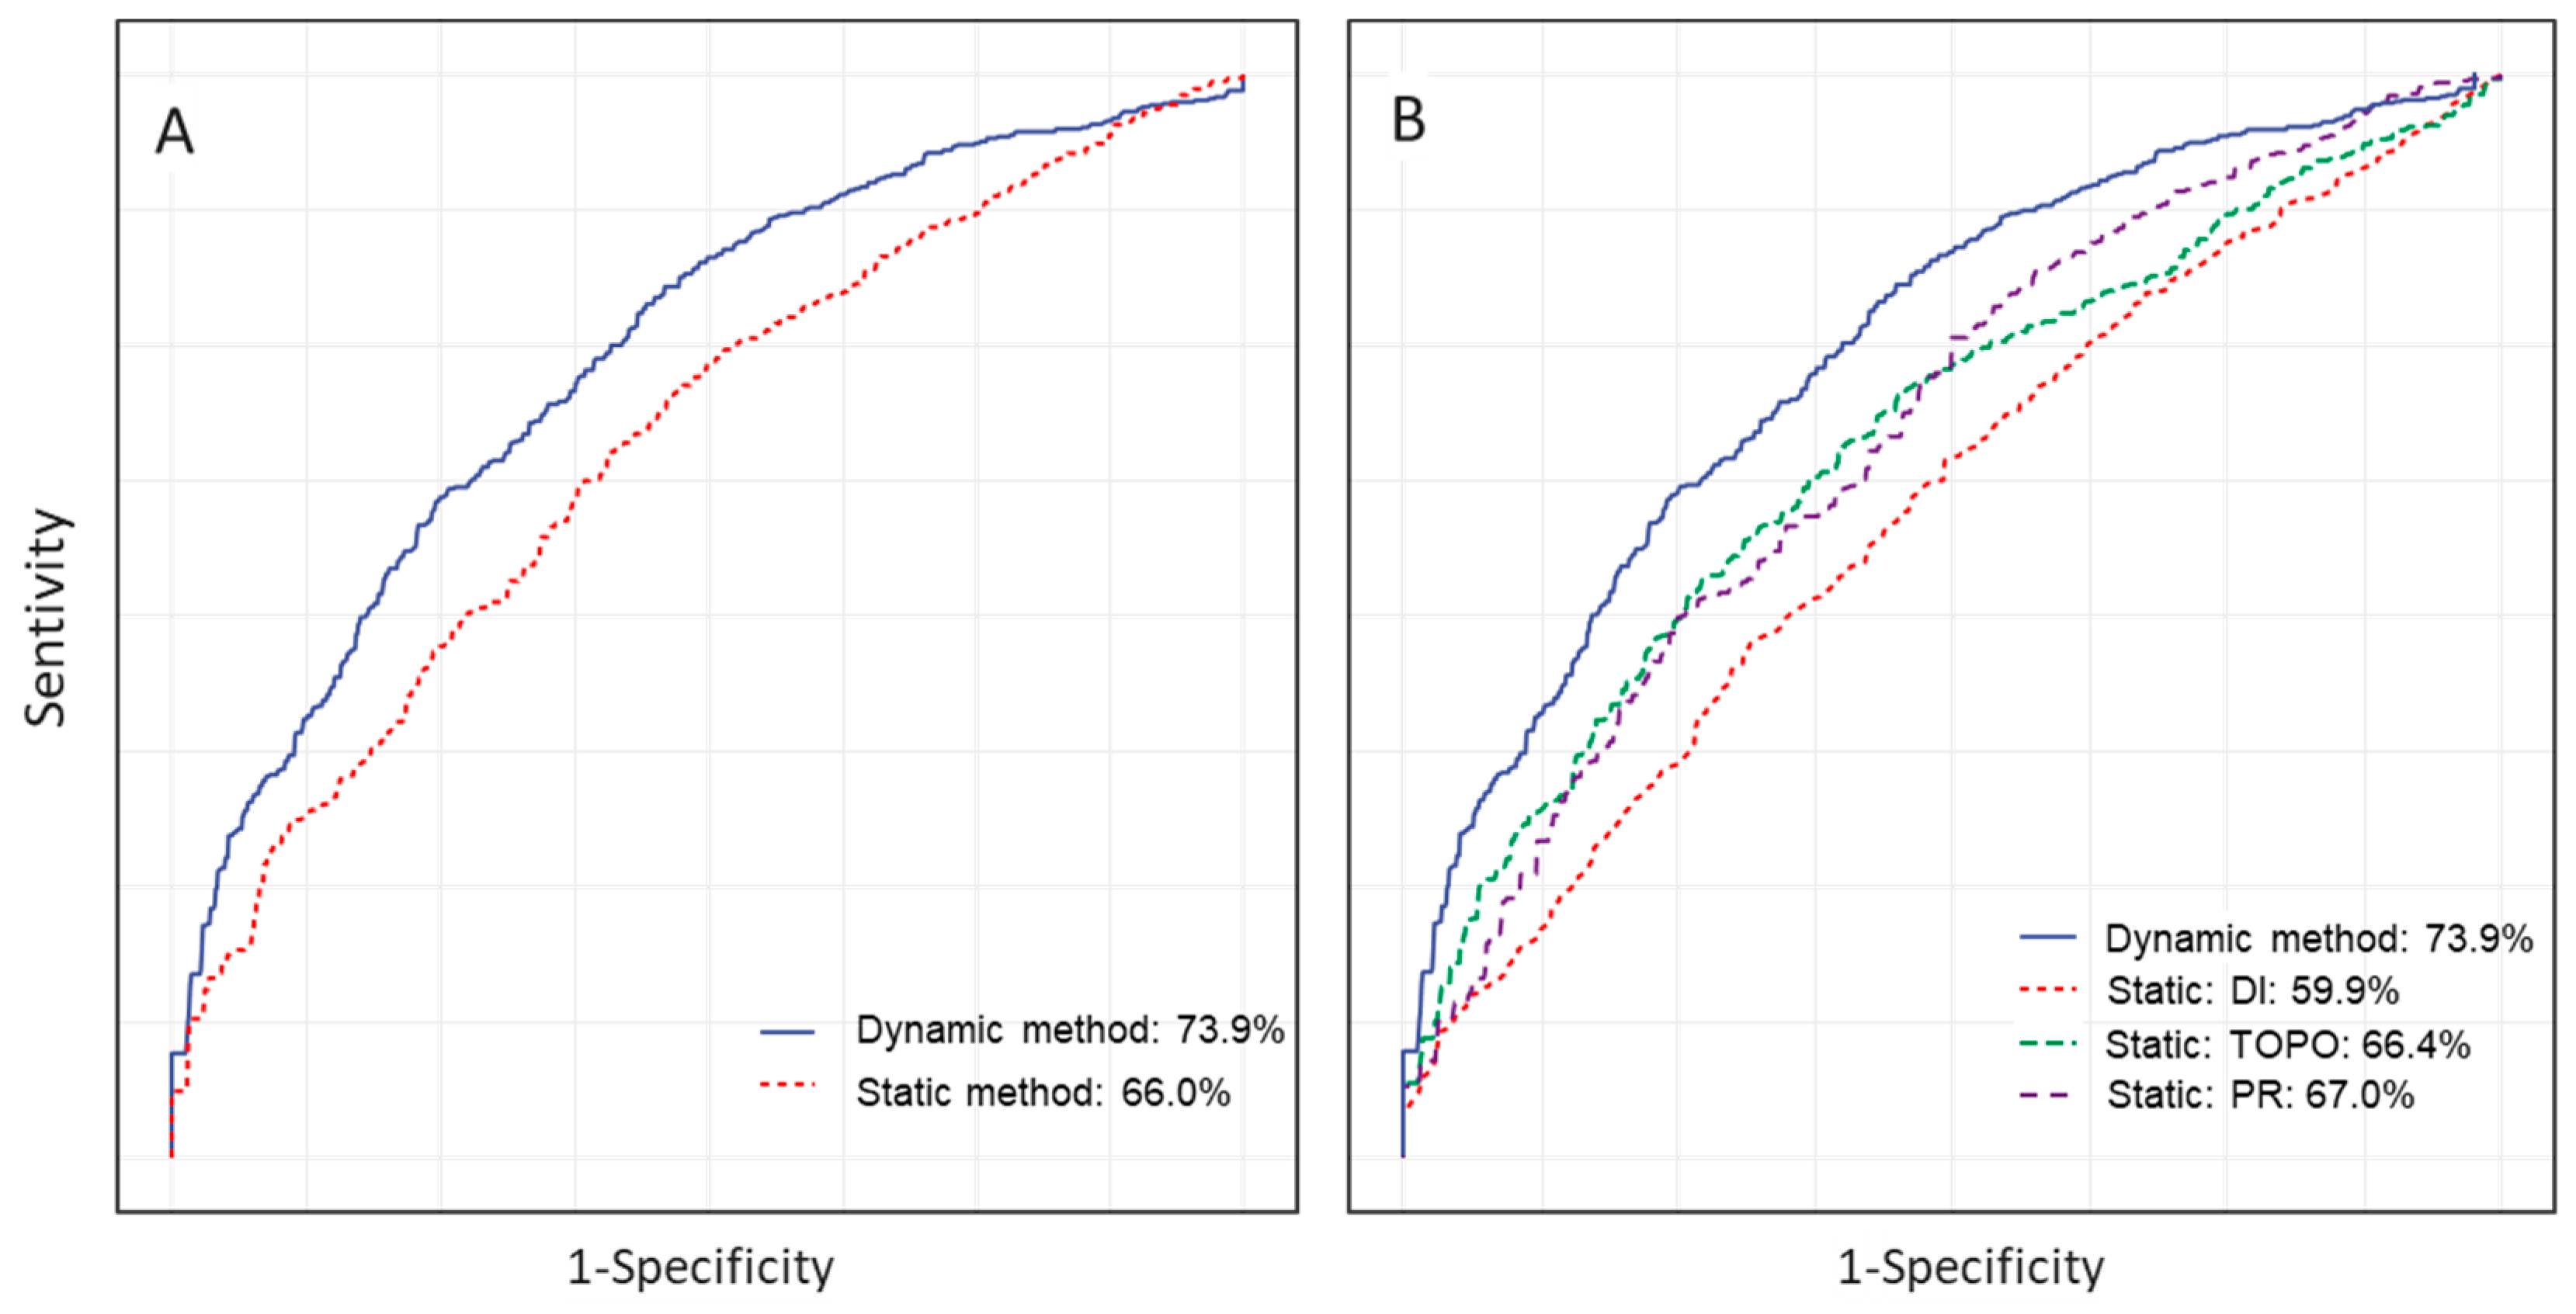
We make the prediction based on the process outlined in Chapter 3. The optimal model is random forests, and the ROC-AUC score for our method is 73.9%. And Table 1 and Table 2 below display the additional prediction results using our method. Our study also demonstrates the challenge of predicting breakthrough papers or Nobel Prize-winning papers. For further analysis, the following section shows the performance of our method compared to other metrics. Learning curves are also offered in Figure 7. It can be seen that, although there is overfitting, as the sample size increases, the AUC value of the test set converges with that of the training set.

4.3. Comparisons

To emphasize the improvement of our proposed approach, we compare it with the prior static method within the same prediction process (Section 3.5). The comparison results (ROC curves) of the selected benchmark indicators (Section 3.6) are displayed in Figure 8, and the detailed ROC scores are shown in Table 3. Our dynamic method shows superior results, achieving an improvement of about 7%. This suggests that the dynamic evolutionary-structure information from the citation cascade networks enhances the prediction of scientific breakthroughs.
The ROC curve is located on a two-dimensional coordinate axis, where the x-axis represents FPR (Fault Positive Rate) and the y-axis represents TPR (True Positive Rate). The area under the ROC curve (AUC) is a common metric used to measure the performance of classification algorithms in machine learning. The algorithm’s performance improves as the value approaches 1.
The previous static methods achieved an overall ROC score of around 66–67%. Despite combining indicators from various prior static methods, their effectiveness did not significantly improve. The combining may have even slightly made the predictions less accurate, possibly due to the covariance between these variables. Additionally, the prediction in our study is made using the method of Min et al., yielding similar results (ROC scores between 65% and 70%).

5. Discussions and Conclusions

5.1. Main Contributions

Our main work has utilized the dynamic structural information of citation cascade networks instead of the (prior) static methods to enhance the performance of predicting scientific breakthroughs. Two main contributions are detailed below:
(1) We have enhanced the static approach to the dynamic method by measuring the dynamic structure evolution of citation cascade networks. The method has been validated and yields an evident improvement using a landmark dataset (Nobel Prize-winning papers).
(2) This study proposes a new method for constructing citation cascade networks to capture the network’s dynamic information. Although citation cascade networks play a crucial role in predicting scientific breakthroughs, the practical construction of them poses a challenging issue. Previous construction methods have impeded the measurement of their dynamic nature.
(3) Additionally, our method of constructing a cascade citation network (Section 4.1) allows for earlier prediction of breakthrough papers than before. Furthermore, the growth rate of cascade citation networks is accelerating over time, thereby reaching earlier predictions in the future. It is recognized that early prediction holds special importance [55].

5.2. Implications

This study differs from previous studies by basing our predictions on citation cascade networks’ dynamic structure information instead of the static information used in previous studies. Our ability to achieve this change relies on the proposed construction method of citation cascade networks. We also highlight the benefits of citation cascades as a proxy for scientific evolution. It offers a cost-effective modeling method to capture dynamic scientific evolution information.
At the theoretical level, we further expand relevant theories. Scientific breakthroughs lead to significant changes in the knowledge structure, which varies across different stages of knowledge evolution. Or, the structure of intelligence and knowledge diffusion evolves differently over time. Intuitively (Section 4.1), we reveal the distinct information provided by different indicators during the early and late stages of knowledge evolution. In the early stages, indicators like the average cluster coefficient and the variance of the PageRank values are better at differentiating breakthrough from non-breakthrough papers, while indicators such as the average degree, the PageRank value of the focus paper, the maximum closeness centrality, and others are more predictive in later stages.
This paper highlights the importance of understanding and predicting breakthroughs from a dynamic perspective. As mentioned in Section 1, though scientific breakthroughs often lead to changes in the structure of knowledge, most previous approaches have mainly viewed this concept statically. Our study indicates that the temporal-like characteristics of knowledge structure evolution offer valuable insights into predicting scientific breakthroughs. Thus, considering scientific breakthroughs dynamically is promising.
Despite significant efforts to improve prediction performance, identifying scientific breakthroughs remains challenging, and prediction performance is not yet at a level ready for practical applications. However, our method has significant potential for enhancement and solidifies the foundation for future practical applications of breakthrough predictions. (1) The threshold for maximum edges can be increased beyond 1000. More edges and a bigger cascade may provide more predictive power. (2) More indicators of cascade networks, especially the technique in complex networks, are valuable to be developed, measuring more information that reflects breakthroughs. (3) Additionally, our method for constructing cascaded networks ensure low computational costs in practice by controlling the number of edges, thus avoiding the need to compute excessively large networks.
Despite promising improvements and the potential for enhancement in our method, predicting scientific breakthroughs remains a challenging task. Our predictions, including those from previous literature, are mainly based on a dataset with an artificially created control group. Hence, it is more challenging (of course, and more valuable) to pinpoint the exact moment and place of a scientific breakthrough in the extensive literature.

5.3. Limitations and Future Directions

(1) Although we have utilized the dynamic structure information from citation cascade networks to predict scientific breakthroughs, relying solely on structural information may have limitations. Other-dimensional information, particularly dynamic factors, also has the potential to predict breakthroughs. In the future, measuring the dynamic evolution of other information is a potential direction.
(2) Citation cascade networks, while effective for modeling, may introduce additional noise. It is acknowledged that some citations may not accurately reflect scientific knowledge. In the future, enhancing the cascade citation networks to accurately identify scientific flows or developing a more efficient complex network are possible improvements. For instance, in the background, we highlight modeling solutions like main path analysis and max-min core document identification.
(3) The opaque nature of extracting features in time series impedes our understanding of scientific breakthrough generations and their characterization. Understanding that is helpful for developing policies that facilitate the implementation of breakthrough catalysts. In the future, it is essential to design specific algorithms to understand scientific breakthroughs.

5.4. Conclusions

Previous methods for predicting scientific breakthroughs have encountered great challenges. Most of them have utilized many static methods, while information regarding dynamic evolution is overlooked. We propose a dynamic method that captures the structural information of the cascade citation and achieves an improvement compared to the prior static methods. We revise the construction method of citation cascade networks to enable the measurement of their dynamic structural characteristics. Certain topological indicators, PageRank values, and the von-Neumann graph entropy of a series of cascade network snapshots are computed, forming the time-series-like predictors. The prediction results indicate that our dynamic method offers better prediction performance. This highlights the validity of the dynamic perspective on scientific breakthrough predictions; in the future, enhanced modelling on dynamic knowledge structure evolution and more complex network indicators are promising.

Author Contributions

Conceptualization, H.Y., Y.L. and Y.X.; investigation, Y.X.; methodology, H.Y.; data curation, Y.L.; formal analysis, Y.L.; writing—original draft, Y.L.; writing—review and editing, H.Y. and Y.X. All authors have read and agreed to the published version of the manuscript.

Funding

This article is supported by National Natural Science Foundation of China (No. 72274227), Humanity and Social Science Foundation of Ministry of Education of China (No. 22YJA870016), and Guangzhou Special Program for Basic and Applied Basic Research Projects (2024A04J4306).

Data Availability Statement

The data are sourced from the following databases/datasets: SciSciNet dataset (https://www.nature.com/articles/s41597-023-02198-9, accessed on 1 October 2023), MAG dataset (https://zenodo.org/records/2628216, accessed on 12 September 2023), and OpenAlex database (https://docs.openalex.org/, accessed on 26 August 2023). The raw data supporting the conclusions of this article will be made available by the authors on request.

Conflicts of Interest

The authors declare that they have no known competing financial interests or personal relationships that could have appeared to influence the work reported in this paper.

References

  1. Wuestman, M.; Hoekman, J.; Frenken, K. A typology of scientific breakthroughs. Quant. Sci. Stud. 2020, 1, 1203–1222. [Google Scholar] [CrossRef]
  2. Min, C.; Bu, Y.; Sun, J. Predicting scientific breakthroughs based on knowledge structure variations. Technol. Forecast. Soc. Chang. 2021, 164, 120502. [Google Scholar] [CrossRef]
  3. Ramdorai, A.; Herstatt, C.; Ramdorai, A.; Herstatt, C. Disruptive innovations theory. In Frugal Innovation in Healthcare: How Targeting Low-Income Markets Leads to Disruptive Innovation; Springer: Berlin/Heidelberg, Germany, 2015; pp. 27–38. [Google Scholar]
  4. Kuhn, T.S. The Structure of Scientific Revolutions; University of Chicago Press: Chicago, IL, USA, 1997; Volume 962. [Google Scholar]
  5. Min, C.; Sun, J.; Ding, Y. Quantifying the evolution of citation cascades. Proc. Assoc. Inf. Sci. Technol. 2017, 54, 761–763. [Google Scholar] [CrossRef]
  6. Min, C.; Chen, Q.; Yan, E.; Bu, Y.; Sun, J. Citation cascade and the evolution of topic relevance. J. Assoc. Inf. Sci. Technol. 2021, 72, 110–127. [Google Scholar] [CrossRef]
  7. Wang, S.; Ma, Y.; Mao, J.; Bai, Y.; Liang, Z.; Li, G. Quantifying scientific breakthroughs by a novel disruption indicator based on knowledge entities. J. Assoc. Inf. Sci. Technol. 2023, 74, 150–167. [Google Scholar] [CrossRef]
  8. Min, C.; Bu, Y.; Wu, D.; Ding, Y.; Zhang, Y. Identifying citation patterns of scientific breakthroughs: A perspective of dynamic citation process. Inf. Process. Manag. 2021, 58, 102428. [Google Scholar] [CrossRef]
  9. Li, X.; Wen, Y.; Jiang, J.; Daim, T.; Huang, L. Identifying potential breakthrough research: A machine learning method using scientific papers and Twitter data. Technol. Forecast. Soc. Chang. 2022, 184, 122042. [Google Scholar] [CrossRef]
  10. Alberts, B. Science breakthroughs. Science 2011, 334, 1604. [Google Scholar] [CrossRef]
  11. Taques, F.H. Challenges in the post-covid-19 world. Socioecon. Anal. 2024, 2, 1–5. [Google Scholar] [CrossRef]
  12. Koshland Jr, D.E. The cha-cha-cha theory of scientific discovery. Science 2007, 317, 761–762. [Google Scholar] [CrossRef]
  13. Hage, J.; Mote, J. Transformational organizations and a burst of scientific breakthroughs: The Institut Pasteur and biomedicine, 1889–1919. Soc. Sci. Hist. 2010, 34, 13–46. [Google Scholar] [CrossRef]
  14. Grumet, G.W. Insubordination and genius: Galileo, Darwin, Pasteur, Einstein, and Pauling. Psychol. Rep. 2008, 102, 819–847. [Google Scholar] [CrossRef] [PubMed]
  15. Wang, J.; Veugelers, R.; Stephan, P. Bias against novelty in science: A cautionary tale for users of bibliometric indicators. Res. Policy 2017, 46, 1416–1436. [Google Scholar] [CrossRef]
  16. Wu, L.; Wang, D.; Evans, J.A. Large teams develop and small teams disrupt science and technology. Nature 2019, 566, 378–382. [Google Scholar] [CrossRef]
  17. Funk, R.J.; Owen-Smith, J. A dynamic network measure of technological change. Manag. Sci. 2017, 63, 791–817. [Google Scholar] [CrossRef]
  18. Park, M.; Leahey, E.; Funk, R.J. Papers and patents are becoming less disruptive over time. Nature 2023, 613, 138–144. [Google Scholar] [CrossRef]
  19. Lin, Y.; Frey, C.B.; Wu, L. Remote collaboration fuses fewer breakthrough ideas. Nature 2023, 623, 987–991. [Google Scholar] [CrossRef] [PubMed]
  20. Bornmann, L.; Devarakonda, S.; Tekles, A.; Chacko, G. Are disruption index indicators convergently valid? The comparison of several indicator variants with assessments by peers. Quant. Sci. Stud. 2020, 1, 1242–1259. [Google Scholar] [CrossRef]
  21. Wei, C.; Zhao, Z.; Shi, D.; Li, J. Nobel-Prize-winning papers are significantly more highly-cited but not more disruptive than non-prize-winning counterparts. In iConference 2020 Proceedings; iSchools: Westford, MA, USA, 2020. [Google Scholar]
  22. Sizemore, A.E.; Karuza, E.A.; Giusti, C.; Bassett, D.S. Knowledge gaps in the early growth of semantic feature networks. Nat. Hum. Behav. 2018, 2, 682–692. [Google Scholar] [CrossRef]
  23. Albert, R.; Barabási, A.-L. Statistical mechanics of complex networks. Rev. Mod. Phys. 2002, 74, 47. [Google Scholar] [CrossRef]
  24. Berkhin, P. A survey on PageRank computing. Internet Math. 2005, 2, 73–120. [Google Scholar] [CrossRef]
  25. Mukherjee, S.; Romero, D.M.; Jones, B.; Uzzi, B. The nearly universal link between the age of past knowledge and tomorrow’s breakthroughs in science and technology: The hotspot. Sci. Adv. 2017, 3, e1601315. [Google Scholar] [CrossRef]
  26. Han, L.; Escolano, F.; Hancock, E.R.; Wilson, R.C. Graph characterizations from von Neumann entropy. Pattern Recognit. Lett. 2012, 33, 1958–1967. [Google Scholar] [CrossRef]
  27. Xu, H.; Luo, R.; Winnink, J.; Wang, C.; Elahi, E. A methodology for identifying breakthrough topics using structural entropy. Inf. Process. Manag. 2022, 59, 102862. [Google Scholar] [CrossRef]
  28. Savov, P.; Jatowt, A.; Nielek, R. Identifying breakthrough scientific papers. Inf. Process. Manag. 2020, 57, 102168. [Google Scholar] [CrossRef]
  29. Jia, W.; Xie, Y.; Zhao, Y.; Yao, K.; Shi, H.; Chong, D. Research on disruptive technology recognition of China’s electronic information and communication industry based on patent influence. J. Glob. Inf. Manag. (JGIM) 2021, 29, 148–165. [Google Scholar] [CrossRef]
  30. Kelly, B.; Papanikolaou, D.; Seru, A.; Taddy, M. Measuring technological innovation over the long run. Am. Econ. Rev. Insights 2021, 3, 303–320. [Google Scholar] [CrossRef]
  31. Yan, E. Disciplinary knowledge production and diffusion in science. J. Assoc. Inf. Sci. Technol. 2016, 67, 2223–2245. [Google Scholar] [CrossRef]
  32. Datta, A.A.; Srivastava, S. (Re) conceptualizing technological breakthrough innovation: A systematic review of the literature and proposed framework. Technol. Forecast. Soc. Chang. 2023, 194, 122740. [Google Scholar] [CrossRef]
  33. Sun, Y.; Latora, V. The evolution of knowledge within and across fields in modern physics. Sci. Rep. 2020, 10, 12097. [Google Scholar] [CrossRef]
  34. Satarova, B.; Siddiqui, T.; Raza, H.; Abbasi, N.; Kydyrkozha, S. A Systematic Review of “The Performance of Knowledge Organizations and Modelling Human Action”. Socioecon. Anal 2023, 1, 56–77. [Google Scholar] [CrossRef]
  35. Chen, P.-Y.; Wu, L.; Liu, S.; Rajapakse, I. Fast incremental von neumann graph entropy computation: Theory, algorithm, and applications. In Proceedings of the International Conference on Machine Learning, Long Beach, CA, USA, 10–15 June 2019. [Google Scholar]
  36. Lv, Y.; Ding, Y.; Song, M.; Duan, Z. Topology-driven trend analysis for drug discovery. J. Informetr. 2018, 12, 893–905. [Google Scholar] [CrossRef]
  37. Yang, J.; Liu, Z. The effect of citation behaviour on knowledge diffusion and intellectual structure. J. Informetr. 2022, 16, 101225. [Google Scholar] [CrossRef]
  38. Bu, Y.; Waltman, L.; Huang, Y. A multidimensional framework for characterizing the citation impact of scientific publications. Quant. Sci. Stud. 2021, 2, 155–183. [Google Scholar] [CrossRef]
  39. Nepomuceno, T.C.C.; Piubello Orsini, L.; de Carvalho, V.D.H.; Poleto, T.; Leardini, C. The core of healthcare efficiency: A comprehensive bibliometric review on frontier analysis of hospitals. Healthcare 2022, 10, 1316. [Google Scholar] [CrossRef] [PubMed]
  40. Hou, J.; Yang, X.; Zhang, Y. The effect of social media knowledge cascade: An analysis of scientific papers diffusion. Scientometrics 2023, 128, 5169–5195. [Google Scholar] [CrossRef]
  41. Rousseau, R. The Gozinto theorem: Using citations to determine influences on a scientific publication. Scientometrics 1987, 11, 217–229. [Google Scholar] [CrossRef]
  42. Van Raan, A.F. Sleeping beauties in science. Scientometrics 2004, 59, 467–472. [Google Scholar] [CrossRef]
  43. Yu, D.; Yan, Z. Combining machine learning and main path analysis to identify research front: From the perspective of science-technology linkage. Scientometrics 2022, 127, 4251–4274. [Google Scholar] [CrossRef]
  44. Nepomuceno, T.C.C.; de Carvalho, V.D.H.; Nepomuceno, K.T.C.; Costa, A.P.C. Exploring knowledge benchmarking using time-series directional distance functions and bibliometrics. Expert Syst. 2023, 40, e12967. [Google Scholar] [CrossRef]
  45. Van Eck, N.; Waltman, L. Software survey: VOSviewer, a computer program for bibliometric mapping. Scientometrics 2010, 84, 523–538. [Google Scholar] [CrossRef] [PubMed]
  46. Li, J.; Yin, Y.; Fortunato, S.; Wang, D. A dataset of publication records for Nobel laureates. Sci. Data 2019, 6, 33. [Google Scholar] [CrossRef] [PubMed]
  47. Lin, Z.; Yin, Y.; Liu, L.; Wang, D. SciSciNet: A large-scale open data lake for the science of science research. Sci. Data 2023, 10, 315. [Google Scholar] [CrossRef] [PubMed]
  48. Priem, J.; Piwowar, H.; Orr, R. OpenAlex: A fully-open index of scholarly works, authors, venues, institutions, and concepts. arXiv 2022, arXiv:2205.01833. [Google Scholar]
  49. Liu, X.; Fu, L.; Wang, X.; Zhou, C. On the similarity between von Neumann graph entropy and structural information: Interpretation, computation, and applications. IEEE Trans. Inf. Theory 2022, 68, 2182–2202. [Google Scholar] [CrossRef]
  50. Christ, M.; Braun, N.; Neuffer, J.; Kempa-Liehr, A.W. Time series feature extraction on basis of scalable hypothesis tests (tsfresh–a python package). Neurocomputing 2018, 307, 72–77. [Google Scholar] [CrossRef]
  51. Guyon, I.; Weston, J.; Barnhill, S.; Vapnik, V. Gene selection for cancer classification using support vector machines. Mach. Learn. 2002, 46, 389–422. [Google Scholar] [CrossRef]
  52. Kursa, M.B.; Rudnicki, W.R. Feature selection with the Boruta package. J. Stat. Softw. 2010, 36, 1–13. [Google Scholar] [CrossRef]
  53. Breiman, L. Random forests. Mach. Learn. 2001, 45, 5–32. [Google Scholar] [CrossRef]
  54. Cortes, C.; Vapnik, V. Support-vector networks. Mach. Learn. 1995, 20, 273–297. [Google Scholar] [CrossRef]
  55. Li, X.; Ma, X.; Feng, Y. Early identification of breakthrough research from sleeping beauties using machine learning. J. Informetr. 2024, 18, 101517. [Google Scholar] [CrossRef]
Figure 1. The basic idea and calculation of the Disruption Index. Note: After constructing the citation structure, D I l in the lower right corner is the value of the Disruptive Index. Generally speaking, l is equal to 1, and Bormann et al. [20] expanded this index and extended the l to any value.
Mathematics 12 01741 g001
Figure 2. Notation and construction methods of citation cascades. Note: In (A), each focal document in our approach has a corresponding citation cascade. (B) illustrates an example of citation cascade networks. (C,D) show two previous methods of creating cascading citations.
Mathematics 12 01741 g002
Figure 3. Overview of the process. Note: The process of our study follows the sequence (A) → (B) → (C). (A) illustrates the process of constructing the dataset. (B) provides a basic description of our dynamic approach. The red dot represents the focus paper, and the blue dots represent papers that directly or indirectly cite the focus papers. As the number of edges expands, we capture lots of snapshots of the citation cascade. For each one, we calculate specific structural metrics (e.g., the average cluster coefficient). As a result, time-series-like data is generated. Afterward, extract features from these sequences, which then serve as predictors. (C) illustrates the final machine learning process.
Mathematics 12 01741 g003
Figure 4. The new approach proposed in this study to constructing citation cascade networks for capturing dynamic structural information. Note: (A) shows that the citation time of each citation is recorded. A chronological order is added to each citation based on the citation time, with “2” indicating the second citation in the chronological sequence, as shown in (B). Finally, a threshold (the maximum number of edges) is selected. (C) shows the result of setting the threshold at 4, and (D) illustrates a network with a maximum of 7 edges. In our experiments, the threshold is indeed set at 1000.
Mathematics 12 01741 g004
Figure 5. The tendency of the indicators used when the number of edges increases. Note: This graph illustrates the “time-series” distribution of the selected structural indicators. The x-axis represents the number of edges (increasing to the right), and the y-axis represents the magnitude of the values. Below is an explanation of the notation. NON: the number of nodes. AVD: the average degree. NOC: the number of components. MCC: the maximum closeness centrality. ACC: the average clustering coefficient. VNGE: the von Neumann graph entropy. PR-FP: the PageRank value of the focus paper. PR-MEAN: the average of PageRank values. PR-SD: the variance of PageRank values.
Mathematics 12 01741 g005
Figure 6. The span of time across publication years and its distribution.
Mathematics 12 01741 g006
Figure 7. The learning curves.
Mathematics 12 01741 g007
Figure 8. The ROC curves of the benchmark indicators. Note: (A) shows the dynamic method against the static method. The static method denotes the union of the three static methods in (B) and the (4) benchmark in Section 3.6. (B) shows the dynamic method against each static method. “DI” denotes the disruption index, the (3) benchmark in Section 3.6. “Topo” denotes the prediction using the basic topological metrics of citation cascade networks, the (1) benchmark in Section 3.6. “PR” denotes PageRank-based metrics, the (2) benchmark in Section 3.6. For presentation, the 95% confidence interval (CI) is not displayed in the figure.
Mathematics 12 01741 g008
Table 1. Confusion matrix and evaluation metrics.
Pred-TurePred-False
Truth-True436216
Truth-False226462
Note: The confusion matrix presented here is the sum of predictions made using the two-repeat, five-fold strategy (10 times in total).
Table 2. Certain evaluation metrics.
MetricsROC-AUC (%)ACCURACY (%)F1-SCORE (%)RECALL (%)
Score73.967.0166.3866.32
Table 3. ROC scores of benchmark indicators.
BenchmarksROC-AUCImprovement (%)
Dynamic method73.9%\
Static method66.0%+7.9%
Static: DI (Disruption Index)59.9%+14.0%
Static: TOPO (Topological indicator of cascades)66.4%+7.5%
Static: PR (PageRank)67.0%+6.9%
Note: The notation of the benchmark indicators can be seen in the legend of Figure 8. Improvement indicates the degree to which our method can outperform previous indicators.
Disclaimer/Publisher’s Note: The statements, opinions and data contained in all publications are solely those of the individual author(s) and contributor(s) and not of MDPI and/or the editor(s). MDPI and/or the editor(s) disclaim responsibility for any injury to people or property resulting from any ideas, methods, instructions or products referred to in the content.

