Article

Recycling Models of Waste Electrical and Electronic Equipment under Market-Driven Deposit-Refund System: A Stackelberg Game Analysis

School of Business, Macau University of Science and Technology, Macao 999078, China
*
Author to whom correspondence should be addressed.
Mathematics 2024, 12(14), 2187; https://doi.org/10.3390/math12142187
Submission received: 18 June 2024 / Revised: 29 June 2024 / Accepted: 10 July 2024 / Published: 12 July 2024
(This article belongs to the Special Issue Applied Mathematics in Supply Chain and Logistics)

Abstract

:
Recycling waste electrical and electronic equipment (WEEE) has garnered considerable societal attention. To incentivize WEEE recycling within a closed-loop supply chain (CLSC), a deposit-refund system (DRS) has been implemented. This study delves into the implications of a market-driven DRS on WEEE recycling under different recycling models. A Stackelberg game analysis is employed, where an electronics manufacturer (leader) has sufficient channel power over an electronics retailer and a third-party recycler (followers). The results indicate that the market-driven DRS significantly incentivizes consumer recycling efforts, ultimately elevating the economic efficiency of the supply chain. When the electronics manufacturer assumes responsibility for WEEE recycling, it streamlines the recycling process, thereby enhancing operational efficiency and profitability. Conversely, when the electronics retailer handles WEEE recycling, it reduces retail prices and simplifies the recycling process, positively influencing consumer purchasing behavior. However, when a third-party recycler undertakes WEEE recycling, the recycling volume tends to be minimal, resulting in the lowest level of supply chain profits. This paper provides theoretical and practical implications for improving the recycling effectiveness and operational efficiency of the CLSC.

1. Introduction

Advancements in electronics and information technology drive frequent upgrades of electrical and electronic equipment (EEE), presenting significant challenges in the disposal of waste electrical and electronic equipment (WEEE) [1]. In 2022, global WEEE volume reached 62 million tons, an 82% increase from 2010, with projections estimating a rise to 82 million tons by 2030 [2]. Inadequate disposal of WEEE poses severe risks to environmental and public health [3], necessitating recycling and remanufacturing [4,5]. Existing WEEE recycling services have developed three distinct channels: electronics manufacturers, electronics retailers, and third-party recyclers [6]. Manufacturers establish recycling channels through subsidiaries or partnerships (e.g., Apple, Dell, Samsung) [6]. Retailers leverage distribution networks for recycling (e.g., Suning.com, JD.com) [7]. Third-party recyclers create autonomous channels (e.g., ATRenew, Zhuanzhuan) [8]. Investigating the effects of various recycling strategies on business decisions and enhancing current systems is essential. Consumers play a pivotal role in WEEE recycling, yet overall enthusiasm remains low [9]. Therefore, providing convenient recycling channels to boost consumer motivation is crucial for effective WEEE recycling.
To mitigate environmental pollution and enhance resource efficiency, regulators have implemented recycling legislation grounded in Extended Producer Responsibility (EPR). One such policy, the Deposit-Refund System (DRS), incentivizes recycling by requiring a refundable deposit on potentially harmful items, reimbursed upon their return through a designated system [10]. There are two types of DRS: government-driven and market-driven. Government-driven DRS, such as Shenzhen’s battery recycling pilot scheme, collects deposits from manufacturers to achieve environmental goals [6]. Market-driven DRS, exemplified by beverage bottle recycling, involves consumer deposits included in the product price, reclaimable upon recycling. Increased emphasis on environmental conservation has boosted consumer participation in recycling [11]. However, most of the existing studies on incentive mechanisms for WEEE recycling have been rewards and penalties, taxes, subsidies, etc. Several studies have focused on the application of government-driven DRS in WEEE recycling, while little research has studied the application of market-driven DRS, as well as the corresponding issues of different recycling models for WEEE under market-driven DRS.
To fill the research gap, this paper delves into the application of a market-driven DRS in WEEE recycling under different recycling channels. Specifically, this study aims to address the following research questions:
(1) What is the impact of the market-driven DRS on CLSC?
(2) What are the similarities and differences between pricing decision, recycling volume and supply chain profit under three different recycling models?
(3) What is the impact of changes in deposit on pricing decisions, recycling volume, and supply chain profit?
To answer these research questions, the study employs Stackelberg game models to capture the strategic interactions among the electronics manufacturer, electronics retailer, third-party recycler, and consumers, thereby providing a robust theoretical framework for understanding the dynamics of market-driven DRS in the CLSC.
This study contributes to the theory and practice in several ways. First, this study investigates the impact of market-driven DRS on the CLSC, providing insights into how market mechanisms can influence recycling efforts and overall supply chain performance. Second, this study offers a comparative analysis of pricing decisions, recycling volumes, and supply chain profits across three distinct recycling models; this study highlights both the commonalities and differences in strategic outcomes, offering a comprehensive understanding of how each model performs under varying conditions. Models in this paper include scenarios where the electronics manufacturer, the electronics retailer, and the third-party recycler play different roles in the recycling process. Third, this study examines the effects of varying deposit amounts on pricing decisions, recycling volumes, and supply chain profits. By elucidating the sensitivity of these factors to changes in deposit levels, this paper provides valuable insights into how deposit policies can be optimized to maximize recycling efficiency and profitability.
The remainder of the paper is organized as follows: Section 2 provides a brief overview of the existing literature relevant to our research topic. Section 3 describes the research problems, defines the parameters, introduces several reasonable assumptions, and establishes the supply chain models under the market-driven DRS. Section 4 presents a comparative analysis of the results of each recycling model. Section 5 explores the impact of deposit on recycling volume and supply chain profit, making further comparisons through numerical study. Section 6 summarizes the conclusion.

2. Literature Review

This paper primarily focuses on three research directions: (1) the closed-loop supply chain (CLSC), (2) the Deposit-Refund System (DRS) for recycling, and (3) recycling channels.

2.1. Closed-Loop Supply Chain (CLSC)

The closed-loop supply chain (CLSC) integrates reverse logistics of recycling and remanufacturing waste products into forward logistics, offering economic value and environmental benefits [9]. Current research often focuses on WEEE within the CLSC framework [12]. For example, Zhang et al. examined optimal pricing and remanufacturing models of e-waste CLSC under government fund policies, finding that appropriate fund parameters can boost recycling and remanufacturing profits [13]. Jain et al. used the Supply Chain Operations Reference (SCOR) model to assess the sustainability performance of e-waste CLSC [14]. Guo et al. developed a sustainable CLSC system leveraging the Internet of Things (IoT) to manage WEEE and promote official recycling channels [15]. Wan et al. explored enterprise recycling strategies using evolutionary game theory, showing that government intervention and consumer environmental awareness influence recycling strategies [16]. Under carbon cap-and-trade regulation, Fang et al. studied optimal recycling advertising models in a CLSC with dual recycling channels, concluding that cooperative advertising delivers the best economic and environmental outcomes [17]. Chen et al. integrated government subsidies and green activities into CLSC to explore financing strategies [18]. Collectively, these studies underscore the importance of WEEE within the context of CLSC.

2.2. Deposit-Refund System (DRS)

Most studies on the Deposit-Refund System (DRS) in supply chain management focus on government-driven DRS, typically initiated by governments with enterprises as decision-makers. Linderhof et al. used the Fullerton–Wu model to examine DRS’s impact on recycling rates for small appliances and batteries in the Netherlands, finding it effective in diverting waste from disposal [19]. Li et al. used game-based system dynamics to analyze DRS in China’s EV battery industry, noting improved collection rates but limited overall impact [20]. Gong et al. studied the effect of DRS on network platform-led electronic CLSC, showing consistent benefits to the platform [21]. Miao et al. investigated DRS in China’s photovoltaic module recycling, finding its effectiveness dependent on deposit thresholds [10].
While research has extensively characterized government-driven DRS as a combination of taxes and subsidies enhancing producer responsibility, the potential of DRS as a market-driven mechanism remains underexplored. Most market-driven DRS research focuses on beverage bottle recycling. Numata put forward that DRS is more efficient than other ways such as the natural participation of the citizens in container recycling [11]. Calabrese et al. classified four DRS archetypes in Europe for one-way beverage packaging recycling, evaluated by Agnusdei et al. for consumer preference retention [22,23]. These studies have employed various methods, including cost-benefit and empirical analysis, but have rarely used game theory. Özdemir-Akyıldırım applied Stackelberg game theory to DRS as a producer-managed tool under incomplete information, demonstrating diminishing cost advantages with higher recycling rates [24]. Research on market-driven DRS has predominantly concentrated on the recycling of beverage bottles, addressing different aspects such as citizen participation, consumer preference, the classification and evaluation of DRS archetypes in Europe. Despite various methodologies, the application of game theory has been limited. This paper addresses the gap in understanding recycling channel selection within market-driven DRS using Stackelberg game theory to investigate its impact on WEEE recycling within a CLSC.

2.3. Recycling Channels

The selection and comparison of recycling channels have been extensively researched within the domain of supply chain management [6]. Li et al. considered the existence of informal collection channels and demonstrated that governance mechanisms implemented by governments or collectors are effective in regulating or utilizing these informal channels [25]. He et al. suggested that competitive collection in a CLSC can reduce recovery efficiency under inconvenience-perception [26]. Kushwaha et al. explored manufacturer compliance with carbon cap-and-trade regulations, finding that revenue from carbon trade and long-term emission reduction targets influence collection channel selection [27]. Fan et al. investigated the collection delegation strategy in a CLSC with traditional retail channel and dual-channel structures and provided the optimal channel choice for the manufacturer with trade-ins [28]. Based on “Internet + recycling”, Qu et al. explored the impact of consumer choice of collection channels on a dual-recycling channel reverse supply chain [29]. Hosseini-Motlagh et al. studied competition between collection channels and its effect on acquisition prices in reverse supply chains [30]. Pal found that a cooperation between manufacturer and collector is effective to boost the fraction collected in a closed-loop dual-channel green supply chain [31]. Based on information asymmetry and individual rationality, Suvadarshini et al. explored the impact of reverse channel competition on original equipment manufacturers in a multi-channel CLSC [32]. Yu et al. proposed a CLSC with three collection modes—platform, collector, and dual-channel—and examined the effect of supply disruptions on collection mode selection [33]. Incorporating inventory policy and marketing considerations, Motlagh et al. proposed two coordination contracts of discounts and revenue sharing in a retail and chain stores dual-channel supply chain [34]. The above studies on recycling channels have explored various dimensions, including informal recycling channels, channel competition, regulatory policies, and consumer preferences, and so on. Despite these advancements, gaps remain in the development of comprehensive policies that balance environmental and economic goals.
Based on the above discussion, it is evident that limited research has been conducted on the different collection channels for WEEE recycling under DRS, particularly within the context of market-driven DRS. To address this research gap, the present study investigates various recycling channels while integrating market-driven DRS into WEEE recycling. This study contributes to the literature in three main innovative ways: (1) This study uniquely incorporates market-driven DRS into the analysis of WEEE recycling channels. By doing so, it provides a novel perspective on how economic incentives can be structured to enhance recycling volume and efficiency. This approach not only incentivizes consumers to return WEEE, but also maximizes profits for the electronics manufacturer, the electronics retailer, and the third-party recycler while achieving environmental objectives. (2) Unlike previous studies that have often focused on isolated aspects of recycling channels, this research offers a holistic evaluation. It examines the effectiveness of different recycling channels in the context of market-driven DRS under a broader framework of recycling modes. This comprehensive approach allows for a better understanding of the interactions between different stakeholders and the overall impact on the recycling ecosystem. Through the systematic analysis and horizontal comparison of different recycling models, it broadens the choice of recycling models in the CLSC and provides enterprises with more flexible and comprehensive recycling strategies. (3) The findings of this study have significant policy implications. By identifying the strengths and weaknesses of different recycling channels under market-driven DRS, the research provides actionable insights for policymakers. These recommendations can help in designing more effective recycling programs that not only meet environmental targets but also ensure economic viability and stakeholder engagement. In summary, this study addresses a critical gap in the existing literature by exploring the integration of market-driven DRS into WEEE recycling channels, which collectively advance the understanding and implementation of effective WEEE recycling strategies. Table 1 lists and compares the contributions of previous works.

3. Methodology

3.1. Problem Description

In this paper, we explore a comprehensive CLSC framework, encompassing an electronics manufacturer, an electronics retailer, and a third-party recycler.
In the supply chain’s forward flow, the manufacturer’s role involves the creation and distribution of new electronic items to the retailer, whose job it then becomes to offer these products to the end-user [9]. Conversely, in the supply chain’s backward flow, WEEE are recycled via three distinct recycling channels: the manufacturer channel, the retailer channel, and the third-party recycler channel [6]. The electronics manufacturer can choose different recycling channels, and the recycled WEEE are subjected to steps such as testing, cleaning, and sorting. Of the recycled WEEE, inferior components will undergo dismantling to salvage any useful materials. Subsequently, all processed WEEE will undergo a refurbishment process before being reintroduced to the marketplace [9].
In order to increase the incentive to recycle WEEE, this paper introduces a market-driven DRS, whereby the electronics manufacturer charges consumers a deposit, which is included in the selling price of the product. If the consumer chooses to recycle the WEEE, the deposit is returned, and any unreturned deposit is retained with the electronics manufacturer.
To investigate the impacts of a market-driven DRS on recycling processes and pricing strategies within a CLSC for WEEE, we propose three distinct recycling frameworks: (1) the electronics manufacturer establishes its own recycling channels (model M); (2) the electronics retailer undertakes the recycling activities (model R); and (3) a third-party recycler is responsible for the recycling operations (model T). Furthermore, within the Stackelberg Game framework, among supply chain members, the electronics manufacturer assumes the role of the leader, while the electronics retailer and the third-party recycler act as followers. The recycling models of the CLSC are illustrated in Figure 1.

3.2. Model Assumptions

This paper constructs a CLSC comprising a single electronics manufacturer, an electronics retailer, and a third-party recycler, operating under the following assumptions:
Assumption 1.
Following Wu et al., it is assumed that all participants in the CLSC exhibit perfect rationality and risk neutrality, making decisions that optimize their respective profits [6]. This assumption is underpinned by classical economic theory, which asserts that economic agents behave in a manner that maximizes their utility. Within the context of a CLSC, enterprises are considered to be profit-maximizers, making decisions based on the available information and a logical analysis of potential outcomes.
Assumption 2.
The electronics manufacturer sells a mixture of new and remanufactured products, both of which are of exactly the same level of quality and performance, and consumers do not differentiate between the two products [8].
Assumption 3.
The market demand  D  is affected by the retail price  p  of the product [6], and the demand function is  D p = a b p + φ r ,  a 0 ,  b 0 ,  φ 0 . Based on the actual situation, the recycling price  r  of used products has less impact on the market demand  D  than the retail price  p   of the products, so we set  0 < φ b . Under a market-driven DRS, since the deposit  e  is included in the retail price  p , the demand function is  D p = a b ( p + e ) + φ r .
Assumption 4.
Consumer recycling of WEEE is mainly influenced by recycling price [6]. Following Gu et al., the amount of WEEE recycled is a linear function of the recycling price [35], and the recycling volume function is S r = α + β r ,  α 0 ,  β 0 . Under a market-driven DRS, since consumers receive both the recycling price  r  and a deposit  e  when they recycle their used products, the recycling volume function is  S r = α + β ( r + e ) .
Assumption 5.
According to Huang et al., the recycling process for WEEE is assumed to be a single-cycle operation, wherein there are no subsequent cycles of remanufacturing and re-recycling [9]. Once WEEE is collected and processed, the materials extracted are either utilized in the production of new products or disposed of, rather than being subjected to multiple cycles of remanufacturing and recycling.
Assumption 6.
We assume a hierarchical structure of control and influence among the key participants in the CLSC, implementing a Stackelberg game framework. Following Tang et al., the CLSC operates as a price taker within a competitive market, striving to avoid price competition that could lead to detrimental price wars [36]. In this paper, the electronics manufacturer is designated as the Stackelberg leader, possessing substantial channel power over both the retailer and the third-party recycler, thereby making the initial strategic decisions. The electronics retailer and the third-party recycler, in turn, act as followers, adapting their strategies based on the manufacturer’s decisions.
Table 2 summarizes the notations used in this paper.

3.3. Models

In this section, we developed three recycling models under a market-driven DRS. First, we present the Manufacturer Recycling Model (model M), where the responsibility for establishing and maintaining recycling channels is assigned to the electronics manufacturer. Second, we introduce the Retailer Recycling Model (model R). In this model, the electronics retailer assumes the responsibility for recycling. Lastly, we discussed the Third-Party Recycling Model (model T), where recycling activities are managed by an independent third-party entity. For each model, we constructed profit functions for the electronics manufacturer, electronics retailer, and third-party recycler. The optimal equilibrium outcomes for each member were derived through backward induction.

3.3.1. Model M: Manufacturer Recycling Model

In model M, we assumed that the manufacturer determines the wholesale price w and the recycling price r , and then the retailer responds to the manufacturer’s wholesale price w by determining its retail price p . The profit function of the manufacturer and the retailer is defined as Equations (1) and (2).
M a x   π m w , r = w + e a b p + e + φ r + ( Φ e r c ) α + β r + e
M a x   π r p = p w a b p + e + φ r        
Using backward deduction, we can derive the following results.
r M = ( ( ( 4 Φ 4 ) e 4 c 4 Δ ) β 4 α ) b + a φ 8 β b φ 2
w M = e φ 2 + ( ( ( 2 Φ 2 ) e 2 c 2 Δ ) β 2 α ) φ + 4 β ( 2 b e + a ) 8 β b φ 2
p M = e φ 2 + ( ( ( 3 Φ 3 ) e 3 c 3 Δ ) β 3 α ) φ + 6 β ( 4 b e 3 + a ) 8 β b φ 2
S M = 4 b ( ( Φ 1 ) e + c + Δ ) β 2 + ( 4 α b + φ ( e φ + a ) ) β α φ 2 8 β b φ 2

3.3.2. Model R: Retailer Recycling Model

In model R, we assumed that the manufacturer first decides on the wholesale price w , and the transfer price m , and then the retailer responds to the manufacturer’s wholesale price and transfer price by deciding on the retail price p and the recycling price r . The profit function of the manufacturer and the retailer is defined as Equations (7) and (8).
M a x   π m w , m = w + e a b p + e + φ r + ( Φ e m ) α + β r + e
M a x   π r p , r = p w a b p + e + φ r + ( m r c ) α + β r + e
Using backward deduction, we can derive the following results.
m R = ( ( Φ 1 ) e + c Δ ) β α 2 β
w R = ( 2 b e e φ + a ) β α φ 2 b β
p R = 6 b ( ( ( Φ 6 5 6 ) e c 6 Δ 6 ) φ 4 b e 3 + a ) β 2 φ ( e φ 2 + ( 2 b e + a ) φ + 5 b α ) β + α φ 3 8 β ( b β φ 2 4 ) b
r R = 2 Φ + 3 e + c + Δ b β 2 + 6 b α + φ e φ + a β + α φ 2 8 b β φ 2 4 β
S R = 2 ( ( Φ 1 ) e + c + Δ ) b β 2 + ( 2 b α + φ ( e φ + a ) ) β α φ 2 8 b β 2 φ 2

3.3.3. Model T: Third-Party Recycler Recycling Model

In model T, we assumed that the manufacturer first determines the wholesale price w and the unit transfer price m , then the retailer responds to the manufacturer’s wholesale price by determining the retail price p , and the third-party recycler determines the recycling price r . The profit function of the manufacturer, the retailer and the third-party recycler is defined as Equations (14)–(16).
  M a x   π m w , m = w + e a b p + e + φ r + ( Φ e m ) α + β r + e
  M a x   π r p = p w a b p + e + φ r
M a x   π t r = ( m r c ) α + β r + e
Using backward deduction, we can derive the following results.
m T = 8 b ( ( Φ 1 ) e + c Δ ) β 2 + ( 8 b α + ( c e ) φ 2 + 2 φ a ) β α φ 2 16 β 2 b φ 2 β
w T = φ 2 e + ( ( ( 2 Φ 6 ) e 2 c 2 Δ ) β 6 α ) φ + 8 β ( 2 b e + a ) 16 β b φ 2
p T = φ 2 e + ( ( ( 3 Φ 9 ) e 3 c 3 Δ ) β 9 α ) φ + 12 β ( 4 b e 3 + a ) 16 β b φ 2
r T = ( ( ( 4 Φ 12 ) e 4 c 4 Δ ) β 12 α ) b + φ a 16 β b φ 2
S T = 4 ( ( Φ 1 ) e + c + Δ ) b β 2 + ( 4 b α + φ ( e φ + a ) ) β α φ 2 16 β b φ 2

4. Comparative Analysis of Equilibrium Decisions

In this section, we discuss the relationship of equilibrium decisions in different recycling models, as well as explore the impact of some of the key factors in the model on the performance of the electronics manufacturer, the electronics retailer, and the third-party recycler.

4.1. Recycling Effect Analysis

Proposition 1.
The optimal recycling volume of three models shows a positive correlation with the product deposit, all of which increase with the product deposit, i.e.,:  S M e > 0 ,     S R e > 0 ,     S T e > 0 .
Proposition 1 demonstrates a positive correlation between the deposit amount and the recycling volume of WEEE. By increasing the product deposit, enterprises can effectively boost the recycling volume, making it a crucial strategic tool for enhancing recycling efficiency. Regardless of whether the responsibility for recycling lies with the electronics manufacturer, electronics retailer, or third-party recycler, a higher product deposit leads to increased recycling volumes. Enterprises can adjust the deposit size to control their recycling volume targets, thereby optimizing their recycling processes and resource reuse.
The foundation of Proposition 1 lies in the market-driven DRS, which influences consumer behavior through an economic incentive; namely, consumers pay a deposit at the time of purchase and are motivated to recycle the product to reclaim the deposit after use. This economic incentive reduces the likelihood of WEEE being discarded improperly and facilitates its flow into formal recycling channels. Consequently, the market-driven DRS effectively transforms consumers into active participants in the WEEE recycling supply chain.
Proposition 2.
The optimal recycling volume of three models satisfy the following relationship:  S M > S R > S T .
Proposition 2 demonstrates that the recycling volume of WEEE is highest when the electronics manufacturer is responsible for recycling and lowest when a third-party recycler undertakes the recycling work.
The recycling volume peaks when the electronics manufacturer directly handles recycling. This can be attributed to the electronics manufacturer’s intimate knowledge of their own products’ construction and materials, enabling more efficient recycling and reuse. The electronics manufacturer also has a vested interest in recycling to maintain their brand image and potentially gain additional revenue from remanufacturing or reselling. Furthermore, when the electronics manufacturer undertakes the recycling work, the process is streamlined, reducing intermediaries and making it easier for consumers to participate, thereby increasing the recycling volume.
Conversely, when a third-party takes on the recycling work, the recycling volume of WEEE is at its lowest. This may be due to inadequate communication channels between the third-party recycler and consumers, leading to poor dissemination of recycling information. Additionally, the third-party recycler typically does not benefit directly from product remanufacturing and are not as strongly profit-driven as the electronics manufacturer. The third-party recycler may also lack sufficient incentives to invest in the necessary infrastructure, publicity, and education to boost recycling volumes.

4.2. Product Pricing Analysis

Proposition 3.
The optimal recycling price and the optimal transfer price of three models shows a positive correlation with the product deposit, all of which increase with the product deposit, i.e.,  r M e > 0 ,  r R e > 0 ,  r T e > 0 ,  m R e > 0 ,  m T e > 0 .
Proposition 3 demonstrates that both the recycling price and the transfer price of WEEE are positively correlated with the deposit, regardless of whether the electronics manufacturer, electronics retailer, or third-party recycler is responsible for recycling. As the deposit increases, consumers receive a higher return value when their products are recycled, and recyclers receive a higher payment per unit of WEEE transferred. This indicates that variations in the unit deposit influence both the recycling price and the transfer price per unit of WEEE, thereby directly enhancing the motivation of consumers and recyclers to engage in recycling activities due to the potential for greater financial benefits.
When implementing a market-driven DRS, the electronics manufacturer can adjust the unit deposit to incentivize increased recycling of WEEE while simultaneously regulating the flow of products in the market through this mechanism. Appropriately set deposits can ensure that the DRS does not adversely affect market demand for the product while still promoting recycling.
Proposition 4.
The optimal wholesale price and the optimal retail price of three models shows a negative correlation with the product deposit, all of which decrease as the product deposit increases, i.e.,:  w M e < 0 ,  w R e < 0 ,  w T e < 0 ,  p M e < 0 ,  p R e < 0 ,  p T e < 0 .
Proposition 4 indicates that both the wholesale price and the retail price of the three models are negatively correlated with the product deposit, decreasing as the deposit increases. This phenomenon can be attributed to the deposit functioning as an upfront cost for consumers. When the deposit rises, electronics manufacturer and retailer may opt to reduce the wholesale and retail prices of their products to avoid overburdening consumers and negatively impacting sales. These price adjustments aim to mitigate the potential deterrent effect on consumption caused by an increased deposit, thereby ensuring that the products remain competitive in the market.
As the deposit influences pricing decisions, electronics manufacturer and retailer must consider the deposit amount and fluctuations in market demand when setting product prices. An effective pricing strategy should strive to balance the product price and the deposit to maintain stable market demand, while ensuring that the market-driven DRS effectively promotes the recycling of WEEE.
Proposition 5.
The optimal recycling price of three models satisfy the following relationship:  r M > r R > r T .
Proposition 5 demonstrates that the recycling price is highest when the electronics manufacturer is responsible for recycling and lowest when a third-party recycler is responsible. This can be attributed to the elimination of intermediaries, such as electronics retailer or third-party recycler, which would otherwise profit from the price differential. Consequently, the recycling price peaks when the electronics manufacturer handles the recycling process directly. This arrangement provides the strongest incentive for consumers to engage in recycling activities.
Furthermore, Proposition 5 corroborates Proposition 2, as it shows that the highest recycling price paid to consumers occurs when the electronics manufacturer is responsible for recycling, leading to the maximum recycling volume. This emphasizes the efficacy of a market-driven DRS from another perspective: it can directly influence the supply side of WEEE, i.e., consumers. By increasing the deposit, enterprises can effectively motivate consumers to participate in recycling, thereby boosting the recycling volume.
Proposition 6.
The optimal wholesale price and the optimal retail price of three models satisfy the following relationship:  w M > w T > w R ,   p M > p T > p R .
Proposition 6 indicates that the wholesale price is highest when the electronics manufacturer is responsible for recycling, likely due to the need to offset the costs associated with the recycling process. Conversely, the wholesale price is lowest when the electronics retailer is responsible for recycling. Correspondingly, the retail price follows the same trend, being highest when the electronics manufacturer handles recycling and lowest when the electronics retailer takes on this responsibility.
Proposition 6 elucidates that the electronics manufacturer tends to set higher wholesale price when undertaking the recycling work. This is likely due to the additional costs incurred during the recycling process, including logistics, processing, and remanufacturing expenses. To maintain the economic viability of the entire recycling process, the electronics manufacturer needs to recoup these costs by increasing the wholesale price. In contrast, when the electronics retailer is responsible for recycling, the wholesale price of the product is generally lower. Hence, in a CLSC with a market-driven DRS, consumers benefit from lower retail prices when the electronics retailer is responsible for recycling.
Proposition 7.
The optimal transfer price of three models satisfy the following relationship:  m T > m R .
Proposition 7 demonstrates that, in a comparison between a third-party recycler and an electronics retailer responsible for recycling, the transfer price that the electronics manufacturer pays is higher when the third-party recycler is responsible for recycling. This proposition illustrates that the transfer price for WEEE is influenced by the choice of recycling partners and also corroborates Proposition 6, which indicates that a third-party recycler, as an independent economic entity, needs to be fully compensated for its operational costs.
Given that the electronics manufacturer incurs a higher transfer price when the third-party recycler is responsible for recycling, the electronics manufacturer may opt to increase the wholesale price to mitigate the cost pressure associated with the elevated transfer price. This cost-transfer mechanism implies that the market price of the product may be relatively higher under the model where the third-party recycler handles recycling, potentially adversely affecting consumers’ purchasing decisions. Consequently, the electronics manufacturer must carefully balance the relationship between recycling cost compensation and product market competitiveness when selecting recycling partners to ensure the overall efficiency and sustainability of the CLSC.

5. Numerical Study

In this section, we use numerical examples to explore the influences of the market-driven DRS on different WEEE recycling models in the CLSC.

5.1. Numerical Example

To guarantee the practical significance of the outcomes, we assumed that a = 300 , b = 4 , c = 2 , α = 10 , β = 2 , = 1 , φ = 1 , Φ = 5 . Table 3 presents the optimal outcomes under various recycling models. Analyzing the recycling effectiveness of WEEE, it is evident that when the electronics manufacturer assumed responsibility for recycling, the recycling volume was maximized. This indicates that the electronics manufacturer recycling model provides the strongest incentive for consumer recycling behavior. From the perspective of consumer interests, the scenario where the electronics retailer was responsible for recycling resulted in the lowest retail prices, making it the most advantageous for consumers in terms of product affordability. Examining the interests of each supply chain member, the electronics manufacturer’s profit was highest when it was responsible for recycling and lowest when a third-party recycler handled recycling. Similarly, the electronics retailer’s profit was lowest when the third-party recycler was responsible for recycling and highest when the electronics retailer itself managed the recycling process. Considering the overall interests of the CLSC, the total supply chain profit was highest when the electronics manufacturer was responsible for recycling and lowest when the third-party recycler was in charge.
In summary, Table 3 illustrates that under a market-driven DRS, the model where the electronics manufacturer was responsible for recycling was the most advantageous. This conclusion holds true both in terms of the effectiveness of WEEE recycling and the overall profitability of the supply chain.

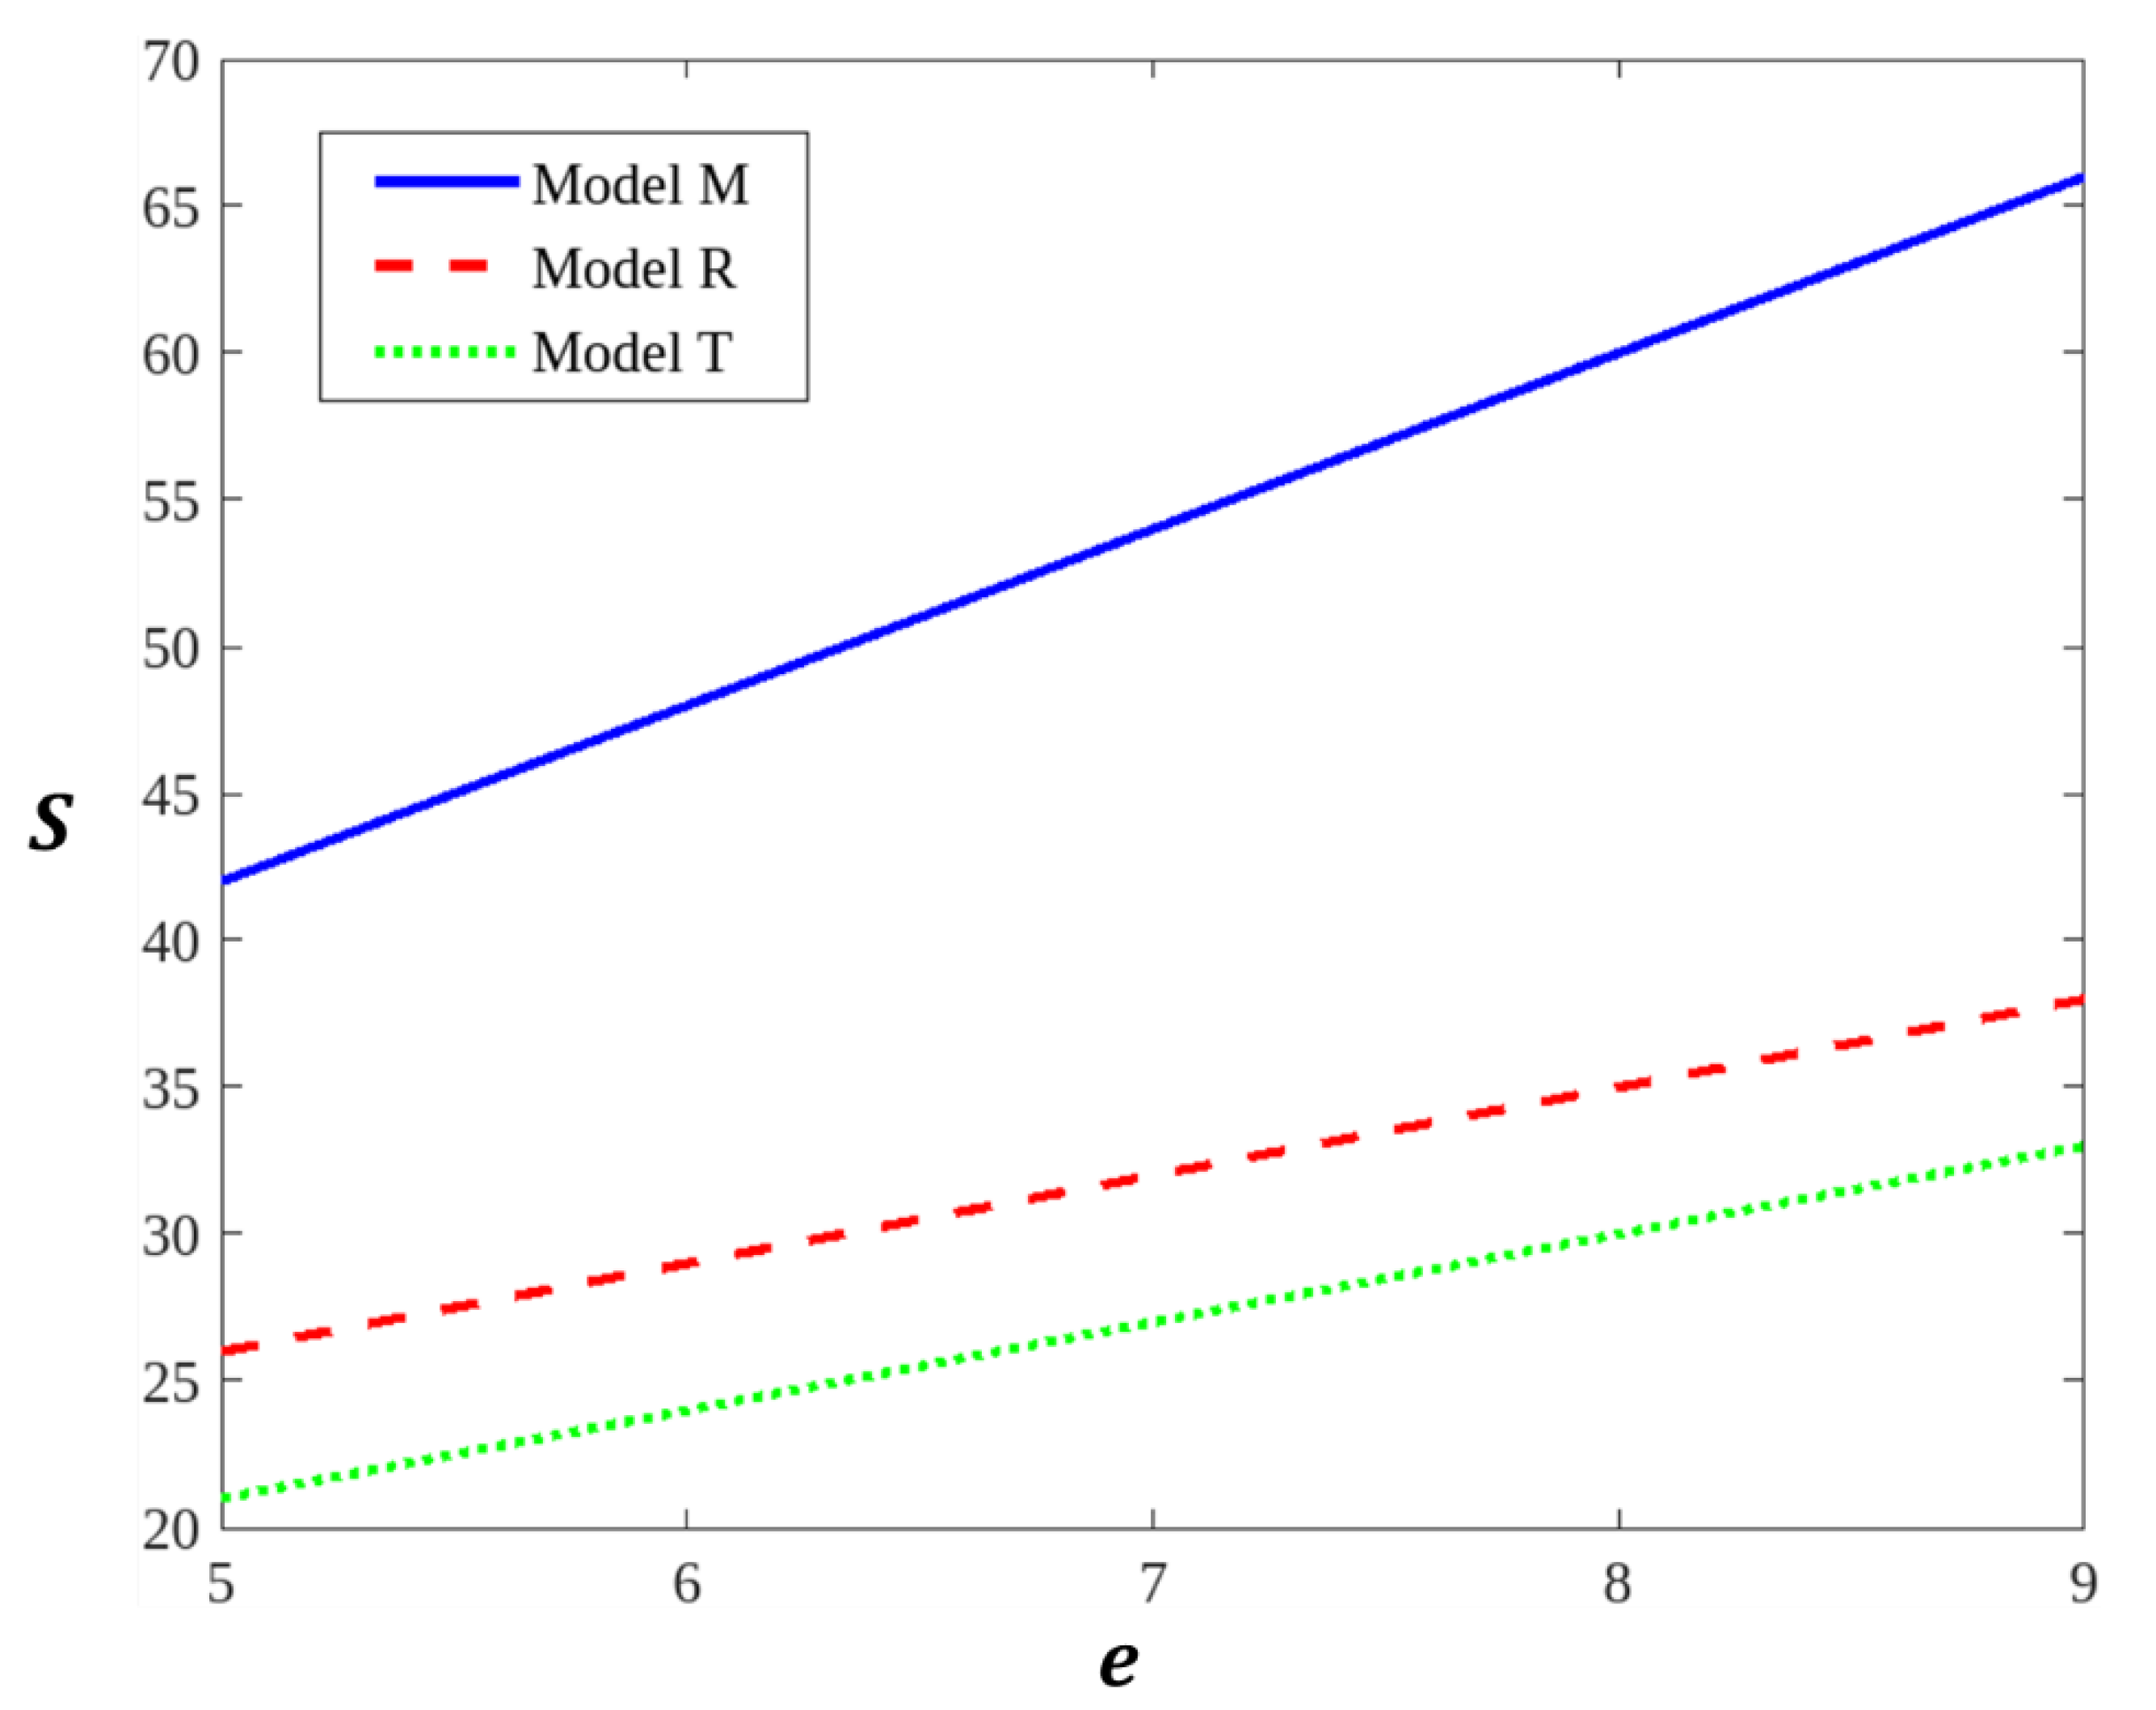
5.2. Sensitivity Analysis

To further investigate the impact of deposit e on optimal results, we examined how sensitive e is by keeping all other parameters stable and only varying the value of   e . This sensitivity is depicted in Figure 2, Figure 3, Figure 4, Figure 5 and Figure 6.
Figure 2 shows the trend of the recycling volume in relation to the product deposit. Under a market-driven DRS, the recycling volume of WEEE increased with an increase in the product deposit, regardless of whether the electronics manufacturer, electronics retailer, or third-party recycler was responsible for recycling. This observation validates Proposition 1. The underlying reason is that a higher product deposit provides a stronger economic incentive for consumers to return WEEE for recycling in exchange for the deposit, thereby increasing the overall recycling volume.
The recycling volume of WEEE was highest when the electronics manufacturer undertook the recycling work and lowest when a third-party recycler was responsible for recycling, which supports Proposition 2. This can be attributed to the electronics manufacturer’s ability to consider recycling needs during the product design and production stages, thereby integrating the recycling process more effectively. This integration reduces intermediate steps and enhances recycling efficiency. Conversely, when a third-party recycler is responsible for recycling, the involvement of additional intermediate steps may lead to lower recycling efficiency, resulting in the lowest recycling volume.
These conclusions underscore the importance of the responsible entity in the recycling process and highlight the effectiveness of economic incentives in promoting consumer recycling behavior.
Figure 3 shows the trend of the electronics manufacturer’s profit in relation to the product deposit. As the product deposit increased, so did the electronics manufacturer’s profit. This phenomenon can be explained by the dynamics of a market-driven DRS, where the electronics manufacturer collects an environmental deposit from the consumer at the time of purchase. If the consumer does not recycle the used product, the deposit is retained by the electronics manufacturer. Consequently, the electronics manufacturer’s profit comprises not only the revenue from the production and remanufacturing of the product but also a portion of the deposits that are not reclaimed by consumers. An increase in the deposit amount means that consumers pay a higher deposit upfront, and if they fail to recycle the product, this higher deposit translates into additional income for the electronics manufacturer. Therefore, the electronics manufacturer’s profit increases in tandem with the deposit amount.
The electronics manufacturer’s profit was highest in the model where it was responsible for recycling and lowest in the model where a third-party recycler was responsible for recycling. This disparity arose because, when the electronics manufacturer handled recycling independently, there were no other recyclers in the market to capture the price differential. The electronics manufacturer could directly profit from recycling activities without incurring intermediary fees, leading to higher prices for recycled products and, consequently, higher profits. In contrast, when a third-party recycler was responsible for recycling, the involvement of additional intermediaries reduced the electronics manufacturer’s profit margin. Therefore, in scenarios where the electronics manufacturer was accountable for recycling WEEE, they had the potential to maximize their profits by eliminating intermediary costs and directly benefiting from the recycling process.
These conclusions highlight the significant impact of the deposit amount and the responsible entity on the electronics manufacturer’s profitability within a market-driven DRS framework. They underscore the importance of strategic decisions regarding recycling responsibilities to optimize financial outcomes for electronics manufacturers.
Figure 4 illustrates the trend of the electronics retailer’s profit in relation to the product deposit. As the product deposit increased, the electronics retailer’s profit also rose. Notably, the electronics retailer’s profit reached its peak when it was responsible for recycling, and it was at its lowest when a third-party recycler handled the recycling process. This trend can be attributed to the additional revenue streams available to the electronics retailer when it undertakes recycling activities. Specifically, when the electronics retailer was responsible for recycling, its profit encompassed not only the earnings from the sale of new products but also the profits derived from the recycling operations. This dual revenue stream significantly enhanced the electronics retailer’s overall profitability. Conversely, when a third-party recycler was responsible for recycling, the electronics retailer forfeited the potential profits from recycling activities, resulting in a lower overall profit.
Therefore, the electronics retailer’s profit was maximized when it assumed the responsibility for recycling, as it could capitalize on both the sale of new products and the recycling of used products. This finding underscores the financial advantages for electronics retailers who integrate recycling operations into their business model, highlighting the importance of strategic decisions regarding recycling responsibilities to optimize profitability.
Figure 5 depicts the trend of the third-party recycler’s profit in relation to the product deposit. As the product deposit increased, the profit of the third-party recycler also experienced a corresponding rise. This positive correlation can be attributed to the market-driven DRS, which effectively incentivized consumers to engage in recycling activities. Under the market-driven DRS, higher product deposits served as a direct financial motivation for consumers to return used products for recycling. As a result, the volume of products entering the recycling stream increased. This surge in recycling volume enabled third-party recycler to process a greater number of used products, thereby enhancing its revenue and overall profit. The increased recycling activity translated into higher operational throughput and economies of scale for the third-party recycler, further contributing to its profitability.
In summary, the implementation of a market-driven DRS significantly boosted the profitability of third-party recycler by driving consumer participation in recycling programs. The direct financial incentives provided by higher product deposits led to increased recycling volumes, which, in turn, allowed the third-party recycler to achieve higher profits through the efficient processing of a larger quantity of used products. This finding highlights the critical role of economic incentives in promoting recycling behavior and enhancing the financial performance of third-party recycling entities.
Figure 6 illustrates the trend of total supply chain profit in relation to product deposit levels. Under a market-driven DRS, the overall profit of the CLSC exhibited an upward trend as the product deposit increased, irrespective of the specific recycling mode employed. This trend underscores the dual benefits of a market-driven DRS: it not only boosts recycling volumes but also enhances the economic efficiency of the entire supply chain.
Figure 6 further reveals a notable variation in total supply chain profit based on the entity responsible for recycling. Specifically, the highest total profit was observed in the model where the electronics manufacturer assumed responsibility for recycling, while the lowest profit was recorded in the model where a third-party recycler was tasked with recycling duties. This finding suggests that, from the perspective of maximizing the overall interests of the supply chain, it is most effective for the electronics manufacturer to undertake the recycling of WEEE.
The superior performance of the electronics manufacturer recycling model can be attributed to several factors. First, electronics manufacturers are likely to achieve greater efficiency in the recycling process due to their intimate knowledge of the product design and materials, which facilitates more effective disassembly and material recovery. Second, by internalizing the recycling operations, electronics manufacturers can eliminate or significantly reduce intermediate costs associated with contracting third-party recyclers. These cost savings, combined with the operational efficiencies, contribute to the higher total profit observed in the manufacturer-led recycling model.

6. Discussion and Conclusions

This paper considers an electronics manufacturer, an electronics retailer, and a third-party recycler in a CLSC. Taking market-driven DRS into account, we put forward the optimal decision-making models under three different recycling models, namely the Manufacturer Recycling Model (model M), the Retailer Recycling Model (model R), and the Third-Party Recycling Model (model T). We analyzed the impact of market-driven DRS on the decision-making of CLSC in the WEEE recycling industry. Moreover, we compared the effects of different recycling models on the WEEE recycling volume and supply chain profits.

6.1. Theoretical Implication

This study contributes to the burgeoning literature on the DRS by investigating the optimal recycling model that maximizes benefits for both enterprises and society. Distinct from previous research predominantly focused on government-driven DRS, our work emphasizes a market-driven approach, positioning enterprises as the initiators and consumers as the primary implementers.
In addition, we identified product deposits as a critical factor of recycling volume and examines various WEEE recycling models. According to our knowledge, this paper is one of the early papers to consider these issues together. Utilizing Stackelberg game theory, our study provides a theoretical foundation for analyzing the impact of market-driven DRS on WEEE recycling across different recycling channels. This approach offers valuable insights into the dynamics of enterprise-consumer interactions and the effectiveness of different recycling strategies.

6.2. Practical Implication

From the enterprises’ perspective, a market-driven DRS can substantially boost supply chain profitability while achieving economic objectives such as showcasing product quality, enhancing brand image, and gaining competitive advantage. Enterprises should tailor deposit and recycling strategies to their specific goals and context, for instance, by setting higher deposits to encourage returns or implementing convenient recycling methods to increase participation.
As for governments, implementing a market-driven DRS is pivotal in promoting WEEE recycling. This system reduces environmental pollution by ensuring proper collection and processing of electronic waste, preventing it from ending up in landfills. It also enhances resource utilization by recovering valuable materials for reuse in manufacturing. Governments can support enterprises in collecting environmental deposits from consumers to further these efforts.
Under a market-driven DRS, when the electronics retailer assumes responsibility for WEEE recycling, consumers can also benefit from purchasing electronics at the most competitive prices, thereby maximizing their interests. Moreover, environmental deposits incentivize consumers to increase their environmental consciousness and actively participate in WEEE recycling.

6.3. Conclusions

Based on the comparative analysis and numerical analysis, a market-driven DRS significantly motivated consumers to engage in recycling, thereby enhancing the economic efficiency of the supply chain. Notably, an increase in product deposits directly correlated with a higher recycling volume of WEEE, which, in turn, boosted profitability across the entire supply chain. As product deposits rose, there was a corresponding increase in the recycling and transfer prices for WEEE. To maintain cost equilibrium, the electronics manufacturer and the retailer might choose to lower wholesale and retail prices. This adjustment helps balance costs and sustain market competitiveness.
When the electronics manufacturer takes on the responsibility for WEEE recycling, the process became more streamlined, enhancing operational efficiency and profitability. This led to an optimization of the CLSC performance. Conversely, when the electronics retailer handled WEEE recycling, they tended to reduce retail price and simplify the recycling process. This strategy positively impacted consumer purchasing behavior by making products more affordable and recycling more accessible. In cases where a third-party recycler was responsible for WEEE recycling, the recycling volume was generally minimal, resulting in the lowest level of supply chain profits. Overall, the allocation of recycling responsibilities within the supply chain significantly influences economic outcomes and operational efficiency, highlighting the importance of strategic decision-making in the implementation of a market-driven DRS.

6.4. Limitation

This paper comes with certain limitations. First, we only considered the influence of market-driven DRS implementation by enterprises on consumers. Realistic enterprises have multiple parallel consumer-related initiatives, such as trade-ins. Future research should explore decision-making processes under the influence of multiple parallel initiatives. Second, the recycling model selection problem addressed in this paper pertains to a single recycling channel. However, in practice, there are multiple recycling channels and competition among them. Future studies should consider mixed recycling models and the competitive dynamics between multiple recyclers. Third, the design of the market-driven DRS can be further refined to optimize both environmental and economic benefits. Future research should delve into enhancing the DRS design to achieve these dual objectives more effectively.

Author Contributions

Conceptualization, Y.L.; Methodology, W.L.; Validation, C.L.; Formal analysis, Y.L.; Investigation, C.L.; Resources, C.L.; Writing—original draft, Y.L.; Writing—review & editing, C.L.; Visualization, Y.L.; Supervision, C.L.; Funding acquisition, C.L. All authors have read and agreed to the published version of the manuscript.

Funding

This research is supported in part by the Macau Science and Technology Development Fund (FDCT), Macau SAR (Grant No. 0008/2022/ITP) and the Faculty Research Grant of Macau University of Science and Technology (Grant No. FRG-23-026-MSB and FRG-19-037-MSB).

Data Availability Statement

The data presented in this study are available on request from the corresponding author.

Conflicts of Interest

The authors declare no conflict of interest.

References

  1. Islam, M.T.; Abdullah, A.B.; Shahir, S.A.; Kalam, M.A.; Masjuki, H.H.; Shumon, R.; Rashid, M.H. A public survey on knowledge, awareness, attitude and willingness to pay for WEEE management: Case study in Bangladesh. J. Clean. Prod. 2016, 137, 728–740. [Google Scholar] [CrossRef]
  2. Vinayagamoorthi, R.; Bhargav, P.B.; Ahmed, N.; Balaji, C.; Aravinth, K.; Krishnan, A.; Govindaraj, R.; Ramasamy, P. Recycling of end of life photovoltaic solar panels and recovery of valuable components: A comprehensive review and experimental validation. J. Environ. Chem. Eng. 2024, 12, 111715. [Google Scholar] [CrossRef]
  3. Wang, W.; Ding, J.; Sun, H. Reward-penalty mechanism for a two-period closed-loop supply chain. J. Clean. Prod. 2018, 203, 898–917. [Google Scholar] [CrossRef]
  4. Fang, L.; Li, Y.; Govindan, K. Entry mode selection for a new entrant of the electric vehicle automaker. Eur. J. Oper. Res. 2024, 313, 270–280. [Google Scholar] [CrossRef]
  5. Tan, K.S.; Tian, Y.; Xu, F.S.; Li, C.S. Research on multi-objective optimal scheduling for power battery reverse supply chain. Mathematics 2023, 11, 901. [Google Scholar] [CrossRef]
  6. Wu, W.; Zhang, M.; Jin, D.; Ma, P.; Wu, W.; Zhang, X. Decision-making analysis of electric vehicle battery recycling under different recycling models and deposit-refund scheme. Comput. Ind. Eng. 2024, 191, 110109. [Google Scholar] [CrossRef]
  7. Sun, Q.; Chen, H.; Long, R.; Li, Q.; Huang, H. Comparative evaluation for recycling waste power batteries with different collection modes based on Stackelberg game. J. Environ. Manag. 2022, 312, 114892. [Google Scholar] [CrossRef]
  8. Zhang, Q.; Tang, Y.; Bunn, D.; Li, H.; Li, Y. Comparative evaluation and policy analysis for recycling retired EV batteries with different collection modes. Appl. Energy 2021, 303, 117614. [Google Scholar] [CrossRef]
  9. Huang, Y.; Liang, Y. Influence of corporate social responsibility considering dual-channel recycling competition and privacy information protection. J. Clean. Prod. 2022, 373, 133850. [Google Scholar] [CrossRef]
  10. Miao, S.; Zhang, Q.; Liu, C.; Wang, L. Can the deposit-return scheme promote recycling of waste PV modules in China? Analysis of an evolutionary game. Sol. Energy 2023, 265, 112136. [Google Scholar] [CrossRef]
  11. Numata, D. Policy mix in deposit-refund systems-From schemes in Finland and Norway. Waste Manag. 2016, 52, 1–2. [Google Scholar] [CrossRef] [PubMed]
  12. Islam, M.T.; Huda, N. Reverse logistics and closed-loop supply chain of Waste Electrical and Electronic Equipment (WEEE)/E-waste: A comprehensive literature review. Resour. Conserv. Recycl. 2018, 137, 48–75. [Google Scholar] [CrossRef]
  13. Zhang, X.M.; Li, Q.W.; Liu, Z.; Chang, C.T. Optimal pricing and remanufacturing mode in a closed-loop supply chain of WEEE under government fund policy. Comput. Ind. Eng. 2021, 151, 106951. [Google Scholar] [CrossRef]
  14. Jain, V.; Kumar, S.; Mostofi, A.; Momeni, M.A. Sustainability performance evaluation of the E-waste closed-loop supply chain with the SCOR model. Waste Manag. 2022, 147, 36–47. [Google Scholar] [CrossRef]
  15. Guo, R.; Zhong, Z. A customer-centric IoT-based novel closed-loop supply chain model for WEEE management. Adv. Eng. Inform. 2023, 55, 101899. [Google Scholar] [CrossRef]
  16. Wan, Y.; Yang, L. Differential recycling strategies and government intervention in a closed-loop supply chain. Comput. Ind. Eng. 2024, 187, 109816. [Google Scholar] [CrossRef]
  17. Fang, H.; Yu, L.; Zhang, Z. Promoting consumer returns in closed-loop supply chains under cap-and-trade regulation: A cooperative recycling advertising perspective. J. Clean. Prod. 2024, 436, 140584. [Google Scholar] [CrossRef]
  18. Chen, J.; Tian, Y.; Chan, F.T.; Tang, H.; Che, P.H. Pricing, greening, and recycling decisions of capital-constrained closed-loop supply chain with government subsidies under financing strategies. J. Clean. Prod. 2024, 438, 140797. [Google Scholar] [CrossRef]
  19. Linderhof, V.; Oosterhuis, F.H.; Van Beukering, P.J.; Bartelings, H. Effectiveness of deposit-refund systems for household waste in the Netherlands: Applying a partial equilibrium model. J. Environ. Manag. 2019, 232, 842–850. [Google Scholar] [CrossRef]
  20. Li, X.; Mu, D.; Du, J.; Cao, J.; Zhao, F. Game-based system dynamics simulation of deposit-refund scheme for electric vehicle battery recycling in China. Resour. Conserv. Recycl. 2020, 157, 104788. [Google Scholar] [CrossRef]
  21. Gong, Y.; Chen, M.; Wang, Z.; Zhan, J. With or without deposit-refund system for a network platform-led electronic closed-loop supply chain. J. Clean. Prod. 2021, 281, 125356. [Google Scholar] [CrossRef]
  22. Calabrese, A.; Costa, R.; Ghiron, N.L.; Menichini, T.; Miscoli, V.; Tiburzi, L. Operating modes and cost burdens for the European deposit-refund systems: A systematic approach for their analysis and design. J. Clean. Prod. 2021, 288, 125600. [Google Scholar] [CrossRef]
  23. Agnusdei, G.P.; Gnoni, M.G.; Sgarbossa, F. Are deposit-refund systems effective in managing glass packaging? State of the art and future directions in Europe. Sci. Total Environ. 2022, 851, 158256. [Google Scholar] [CrossRef] [PubMed]
  24. Özdemir-Akyıldırım, Ö. Deposit-refund system vs. compliance scheme membership: How to comply with producer responsibility regulations? Int. J. Prod. Econ. 2015, 162, 25–44. [Google Scholar] [CrossRef]
  25. Li, Y.; Xu, F.; Zhao, X. Governance mechanisms of dual-channel reverse supply chains with informal collection channel. J. Clean. Prod. 2017, 155, 125–140. [Google Scholar] [CrossRef]
  26. He, Q.; Wang, N.; Yang, Z.; He, Z.; Jiang, B. Competitive collection under channel inconvenience in closed-loop supply chain. Eur. J. Oper. Res. 2019, 275, 155–166. [Google Scholar] [CrossRef]
  27. Kushwaha, S.; Ghosh, A.; Rao, A.K. Collection activity channels selection in a reverse supply chain under a carbon cap-and-trade regulation. J. Clean. Prod. 2020, 260, 121034. [Google Scholar] [CrossRef]
  28. Fan, X.; Guo, X.; Wang, S. Optimal collection delegation strategies in a retail-/dual-channel supply chain with trade-in programs. Eur. J. Oper. Res. 2022, 303, 633–649. [Google Scholar] [CrossRef]
  29. Qu, Y.; Zhang, Y.; Guo, L.; Cao, Y.; Zhu, P. Decision strategies for the WEEE reverse supply chain under the “Internet+ recycling” model. Comput. Ind. Eng. 2022, 172, 108532. [Google Scholar] [CrossRef]
  30. Hosseini-Motlagh, S.M.; Johari, M.; Nematollahi, M.; Pazari, P. Reverse supply chain management with dual channel and collection disruptions: Supply chain coordination and game theory approaches. Ann. Oper. Res. 2023, 324, 215–248. [Google Scholar] [CrossRef]
  31. Pal, B. Investigating a closed-loop dual-channel green supply chain with stochastic demand rate and collection ratio using the distribution-free approach. Comput. Ind. Eng. 2023, 184, 109588. [Google Scholar] [CrossRef]
  32. Suvadarshini, P.; Biswas, I.; Srivastava, S.K. Impact of reverse channel competition, individual rationality, and information asymmetry on multi-channel closed-loop supply chain design. Int. J. Prod. Econ. 2023, 259, 108818. [Google Scholar] [CrossRef]
  33. Yu, Y.; Yang, H.; Zhen, Z. Collection cooperation breakdown and repair in a closed-loop supply chain during supply disruption and price shock. Comput. Ind. Eng. 2023, 183, 109495. [Google Scholar] [CrossRef]
  34. Motlagh, P.H.; Nasiri, G.R. Developing a pricing strategy and coordination in a dual-channel supply chain incorporating inventory policy and marketing considerations. Comput. Ind. Eng. 2023, 185, 109607. [Google Scholar] [CrossRef]
  35. Gu, X.; Zhou, L.; Huang, H.; Shi, X.; Ieromonachou, P. Electric vehicle battery secondary use under government subsidy: A closed-loop supply chain perspective. Int. J. Prod. Econ. 2021, 234, 108035. [Google Scholar] [CrossRef]
  36. Tang, S.; Wang, W.; Zhou, G. Remanufacturing in a competitive market: A closed-loop supply chain in a Stackelberg game framework. Expert Syst. Appl. 2020, 161, 113655. [Google Scholar] [CrossRef]
Figure 1. Recycling models.
Mathematics 12 02187 g001
Figure 2. Change rule of S w.r.t. e .
Mathematics 12 02187 g002
Figure 3. Change rule of π m w.r.t. e .
Mathematics 12 02187 g003
Figure 4. Change rule of π r w.r.t. e .
Mathematics 12 02187 g004
Figure 5. Change rule of π t w.r.t. e .
Mathematics 12 02187 g005
Figure 6. Change rule of π w.r.t. e .
Mathematics 12 02187 g006
Table 1. Summary and comparison of related literature.
Research PaperCLSCWEEERecycling ChannelsDRS
Government-DrivenMarket-Driven
Wu et al., 2024 [6]
Miao et al., 2023 [10]
Linderhof et al., 2019 [19]
Li et al., 2020 [20]
Gong et al., 2021 [21]
Calabrese et al., 2021 [22]
Agnusdei et al., 2022 [23]
Özdemir-Akyıldırım, 2015 [24]
Kushwaha et al., 2020 [27]
Hosseini-Motlagh et al., 2023 [30]
Pal, 2023 [31]
Suvadarshini et al., 2023 [32]
This paper
Table 2. The description of notations.
NotationsDescription
Model parameters
c The unit cost of recycling
The unit cost of remanufacturing from recycled materials
e The deposit
Φ The profit factor for deposits retained with the manufacturer
α The base recycling volume independent of recycling price
β The recycling rate related to recycling price
a The market size
b The sensitivity of demand to price
φ The sensitivity of demand to recycling price
Decision variables
r The unit recycling price of WEEE
m The unit transfer price of WEEE
w The unit wholesale price of new products
p The unit retail price of new products
Functions
D The market demand
S Total recycling volume
π m / π r / π t / π The profit of the manufacturer/retailer/third-party recycler/supply chain
Table 3. Optimal results when e = 5 ,   6 ,   7 ,   8 ,   9 .
e 56789
w M 33.8633.1132.3731.6230.87
w R 31.2530.1329.0027.8826.75
w T 32.5431.6130.6729.7328.80
p M 53.2952.6752.0551.4350.81
p R 50.9950.0049.0048.0047.01
p T 51.3150.4149.5048.6047.69
r M 10.8612.8914.9216.9518.98
r R 2.943.474.004.535.06
r T 0.350.851.351.862.36
m R 8.0010.0012.0014.0016.00
m T 12.6914.7016.7118.7220.72
S M 41.7147.7853.8459.9065.97
S R 25.8728.9432.0035.0638.13
S T 20.6923.7026.7129.7232.72
π m M 3484.573733.564018.794340.294698.03
π m R 3276.523421.133584.003765.133964.52
π m T 3052.983167.373299.783450.203618.65
π r M 1509.881529.681549.611569.671589.86
π r R 1638.261710.561792.001882.561982.26
π r T 1409.501414.231418.981423.731428.48
π t T 214.10280.86356.68441.54535.44
π M 4994.455263.235568.405909.956287.89
π R 4914.775131.695376.005647.695946.77
π T 4676.574862.475075.435315.475582.57
Disclaimer/Publisher’s Note: The statements, opinions and data contained in all publications are solely those of the individual author(s) and contributor(s) and not of MDPI and/or the editor(s). MDPI and/or the editor(s) disclaim responsibility for any injury to people or property resulting from any ideas, methods, instructions or products referred to in the content.

