Article

Numerical Study of Temperature Field and Melt Pool Properties during Electron Beam Selective Melting Process with Single Line and Multiple Line Scanning

1
Science and Technology on Plasma Dynamic Laboratory, Air Force Engineering University, Xi’an 710038, China
2
Faculty of Mechanical and Precision Instrument Engineering, Xi’an University of Technology, Xi’an 710048, China
*
Author to whom correspondence should be addressed.
Mathematics 2024, 12(14), 2238; https://doi.org/10.3390/math12142238
Submission received: 14 June 2024 / Revised: 8 July 2024 / Accepted: 16 July 2024 / Published: 18 July 2024

Abstract

:
Electron beam selective melting is a metal powder bed fusion additive manufacturing technology. In order to study the temperature field and melt pool changes of high Nb-TiAl electron beam selective melting on a single scan line and multi-scan lines. In this paper, two three-dimensional thermal-fluid models are established to simulate the evolution of the melt pool and temperature field at different electron beam scanning speeds under a single scan line and the evolution of the temperature field under multi-scan lines. The simulation results of a single scan line show that the length of the bath increases with the increase in the electron beam scanning speed, while the width and depth of the bath decrease with the increase in the speed. The scanning speed has a significant impact on the length and depth of the micro-bath, but the impact on the width is relatively small. The simulation results of multi-scan lines show that the preheating temperature has a greater influence on the melting temperature field, while the size of the scanning current has a smaller influence on the temperature field. The conclusion drawn from the results obtained through simulation is that the temperature during the preheating process must be strictly controlled, and the melting process speed must be appropriately set in order to obtain high-quality samples.

1. Introduction

Electron Beam Selective Melting (EBSM) is an Additive Manufacturing (AM) technology that involves adding materials layer by layer to construct complex objects based on Computer-Aided Design (CAD) models [1]. EBSM is one of the most promising additive manufacturing technologies. In the EBSM process, a high-energy electron beam selectively melts and stacks metal powder into three-dimensional components in a vacuum environment. EBSM has numerous applications in fields such as aerospace and medical implants [2,3,4]. Compared with other additive manufacturing technologies like Selective Laser Melting (SLM), EBSM has its own unique advantages and disadvantages. Due to the high electrical conductivity requirement of materials in the EBSM process, its application is limited to metallic materials, while SLM includes materials such as metals, polymers, and ceramics. Additionally, the possibility of powder charging may lead to process failures in AM. On the other hand, the extremely fast movement and inertia-free nature of the electron beam in EBSM have led to the development of many novel material melting strategies [5,6,7,8].
From a physical perspective, EBSM is a rather complex process involving multiple thermal phenomena [9]. When the electron beam scans the top layer of the powder, the powder particles at the focus are rapidly heated to temperatures higher than their melting point, forming a so-called melt pool. As the electron beam scans along the prescribed path, the melt pool moves and some heat is lost to the colder environment through the radiation heating of the powder, while a significant amount of heat is transferred to the surrounding particles and substrate [10,11,12]. As the melt pool temperature decreases, the molten material subsequently solidifies into a dense 3D component. The evolution of the melt pool and the transformation in material state from powder to liquid and from liquid to solid constitute the most complex physical processes in the EBSM process. And the variation of material properties with temperature further complicates the heat transfer issue. In a real additive manufacturing process, additional factors such as vaporization and scanning strategies should be considered [13,14,15].
In practical applications, the EBSM process can lead to issues such as spattering, spheroidization, stratification, incomplete fusion, deformation, and cracking caused by thermal stress [16,17,18]. The parameters of the EBSM process will have a significant impact on the defects generated during the EBSM process, such as electron beam scanning speed, preheating temperature, heat source power, etc. [19]. In studies of single scan lines, line energy density is typically used to compare forming parameters under different processes. Line energy density is directly proportional to the heat source power and inversely proportional to the scanning speed, with scanning speed having a greater impact on the melt pool size. Therefore, this paper selects the electron beam scanning speed as the research subject to explore its impact on the melt pool size during the PBF-EB process. Since the EBSM process takes place in a closed vacuum build chamber, experimental observations are difficult, and research costs are high, with a certain degree of randomness. Therefore, utilizing numerical simulation techniques to model the physical processes of EBSM allows for a comprehensive understanding of the temperature field and evolution of the melt pool under different process parameters. Scharowsky [20] et al. conducted a study on the effects of beam scanning speed and scan spacing on the surface roughness and heat-affected zone of formed samples in electron beam selective melting through experiments and simulations. The research found that high scanning speeds can result in insufficient melting of the sample, leading to increased surface roughness and decreased forming quality. Yue [21] et al. studied the effects of electron beam current, scanning speed, and energy density on the surface appearance, porosity, and Al loss of Ti-47Al-2Cr-2Nb alloy samples through experiments. The results showed that with increasing scanning speed, the porosity continuously increased while Al loss gradually decreased. In Yang’s article [22], Ti6.5Al2Zr1Mo1V was fabricated via electron beam selective melting (EBSM) with different process parameters to study the diversity of microstructure. Results demonstrate that samples with a flat surface can be obtained when the ratio of beam current to scanning speed fluctuated between 5.0 and 7.5 as other parameters were fixed.
The above simulations and experimental studies have proven that the electron beam scanning speed has a significant impact on the formation of defects during the EBSM process, thereby affecting the quality of the formed samples. However, a more detailed analysis reveals that the main cause of these defect formations is still the influence of the electron beam line energy density on the melt pool. Therefore, an increasing number of researchers are now focusing on the evolution of micro-melt pools. Yang [11] et al. provided a comprehensive review of the numerical simulation of electron beam selective melting behavior, covering aspects such as the mathematical principles of temperature fields, simulation processes, thermo-mechanical coupling simulation, melt pool thermodynamics simulation, and thermal defect mechanisms. They also proposed the influencing factors and numerical calculation methods that should be considered in the EBSM numerical simulation process. Yan [23] et al. used a finite element coupled Monte Carlo method to obtain the temperature field of the melt pool in the Ti-6Al-4V electron beam additive manufacturing process, and proposed a new form of heat source with better physical relevance. With the help of Plateau–Rayleigh capillary instability theory, Gusarov [24] et al. pointed out the close relationship between spheroidization and the geometric shape of the melt pool. At the two-dimensional level, it is stated that spheroidization is more likely to occur when the ratio of the length to the width of the melt pool exceeds 2.1. D. Grange [25] et al. found in their research that the size and shape of the melt pool have a significant impact on the solidification conditions. Different manufacturing parameters used in the preparation resulted in different melt pool sizes and shapes, leading to varying crack intensities. It was demonstrated that the occurrence of cracking is minimized when narrow melt pools and strong overlap between adjacent melt pools are utilized. Galati [26] et al. introduced a new type of modelling for energy source and powder material properties and this modelling has been included in a thermal numerical model in order to improve the effectiveness and reliability of Electron Beam Melting (EBM) FE simulation and use it to predict the size of the melt pool. Christoph et al. [27]. studied high-throughput thermal simulation for the identification of fundamental relationships between process parameters, processing conditions, and the resulting melt pool geometry in the quasi-stationary state of line-based hatching strategies in PBF-EB. Through a comprehensive study of over 25,000 parameter combinations, including beam power, velocity, line offset, preheating temperature, and beam diameter, process parameter-melt pool relationships were established, processing boundaries were identified, and guidelines for the selection of process parameters to achieve desired properties under different processing conditions were derived. Chen et al. [28]. studied the influence of key process parameters on the heat flow field of the molten pool through numerical simulation and experiments. It was shown that when the laser power was 300 W, the depression depth and melt pool depth caused by the recoil pressure were significantly larger, and the isothermal density of the solidification region was more intensive; when the scanning speed was increased from 0.4 m/s to 0.8 m/s, the molten pool length was reduced from 524 μm to 410 μm, and the line energy density was reduced, making the amount of melted powder decrease. The wettability and fluidity of the molten state metal became worse; when the scanning interval increased to 120 μm, a large number of incompletely melted powder tracks could not lap correctly at the midline of the double track.
Most of the aforementioned studies focus on materials such as Ti-6Al-4V. According to the literature [29], we realize that the shape of the melt pool is a function of the energy input, and its size depends not only on the heat source power and speed but also on the material’s thermal conductivity. The thermal conductivity of high Nb-TiAl is much higher than that of Ti-6Al-4V, making high Nb-TiAl more suitable for the EBSM process. In Tang’s article [30], the formation of various types of microstructural defects, including banded structures caused by the vaporization of aluminum, was investigated with respect to different processing parameters in the EBSM process. The results show that EBSM can be used to fabricate high performance titanium aluminide alloys with appropriate processing parameters and pathways. So far, research on the temperature field and melt pool of high-Nb-TiAl in EBSM under single and multiple scan lines is extremely limited.
Kan [31] et al. considered the grain morphology and texture control in EBSM Ti-47Al-8Nb g-TiAl alloy. The EBSM process window to obtain a columnar lamellar colony (CLC) grain structure was defined following a critical assessment of thermal gradient and liquid-solid interface velocity by using numerical simulation. Based on the steady-state model proposed by Kan, this paper has developed a new transient thermal-fluid model that allows for the study of the temperature field and morphological evolution of the melt pool in high Nb-TiAl EBSM at each moment. Numerical simulations are conducted using the finite element software COMSOL 6.0 to establish the new transient thermal-fluid model based on the heat transfer module. The model incorporates temperature-dependent material properties and a Gaussian plane heat source model. Based on this, simulations were first conducted for single-channel scanning processes to study the influence of scanning speed on the temperature field and melt pool size, and to analyze the evolution of the melt pool. Subsequently, simulations were carried out for multi-channel scanning processes to analyze the temperature field evolution under different initial temperatures and scanning current levels.

2. Numerical Simulation Method

Prior to conducting the simulation calculations in this paper, the author replicated the simulation results from Kan’s paper [31] using the same method. The replicated results closely matched those in Kan’s paper, with the error in the final melt pool size being within 5%. The research methodology in this paper involves refining Kan’s methodology and applying it to the current study. Kan utilized a steady-state adaptive grid, which reduced computation time but only provided the final steady-state results, unable to observe the temperature changes at each moment during the electron beam scanning process. Our optimized method, using transient calculations, can complete simulations on 338,914 grids with a single parameter in just 3 h, demonstrating higher computational efficiency than Kan’s approach. Therefore, the model in this paper demonstrates a high level of accuracy.
The electron beam selective melting additive manufacturing process involves complex physical phenomena, including intricate heat and mass transfer processes, as well as the phase change phenomenon of metal powder melting and solidification, all of which impact the final product quality. It is difficult for numerical simulation techniques to simulate the entire actual additive manufacturing environment. For instance, Nastac [32] found that treating Al and V elements as mixed elements had minimal impact on the simulation of microstructures. Furthermore, increasing model complexity can reduce computational efficiency and stability. Therefore, reasonable simplifications and assumptions are necessary to develop accurate, efficient models. The simulation software used is COMSOL 6.0, which is one of the leading international software programs for plasma simulation, featuring advanced physical modeling modules, numerical methods, and powerful post-processing capabilities.
The study makes the following reasonable assumptions:
(1)
The powder bed during the powder bed fusion process is considered a continuous medium due to the influence of the preheating process. This assumption may lead to differences in the morphology of the melt pool and the evolution of the solid–liquid boundary compared to reality, but the error is within an acceptable range.
(2)
Material properties such as density, thermal conductivity, and specific heat are considered to vary with temperature during the electron beam scanning process, as significant temperature changes occur. This assumption may lead to lower computational efficiency, but it is more closely aligned with reality.
(3)
The electron beam is assumed to be a Gaussian-distributed heat source, exhibiting high consistency with the actual heat source. The Gaussian heat source is the most commonly used heat source form in EBSM, and this assumption can most accurately reflect the heating situation of the electron beam heat source.
(4)
There are no outward velocity components perpendicular to the surface of the melt pool. This assumption can increase computational efficiency and will not have a significant impact on the results.

2.1. Governing Equation

Based on the above assumptions, the control equation in the three-dimensional coordinate system is described from the perspective of mass, momentum, and energy [33]:
(1)
Mass conservation equation:
ρ t + ( ρ u ) x + ( ρ v ) y + ( ρ w ) z = 0
(2)
Momentum conservation equation:
( ρ u ) t + ( ρ u u ) x + ( ρ u v ) y + ( ρ u w ) z = p x + x [ μ ( 2 u x 2 3 v ) ] + y [ μ ( u y + v x ) ] + z [ μ ( u z + w x ) ] + S x
( ρ v ) t + ( ρ u v ) x + ( ρ v v ) y + ( ρ v w ) z = p y + y [ μ ( 2 v y 2 3 v ) ] + x [ μ ( u y + v x ) ] + z [ μ ( v z + w x ) ] + S y
( ρ w ) t + ( ρ u w ) x + ( ρ v w ) y + ( ρ w w ) z = p z + z [ μ ( 2 w y 2 3 v ) ] + x [ μ ( w y + u z ) ] + y [ μ ( w y + v z ) ] + S z
(3)
Energy conservation equation:
( ρ T ) t + ( ρ u T ) x + ( ρ v T ) y + ( ρ w T ) z = x ( k T x ) + y ( k T y ) + z ( k T z ) + S H
where ρ is the density, k is the thermal conductivity, μ is the liquid viscosity, p is the pressure, u , v , w are the velocity in the x, y, and z, S x , S y , S z is the source term on the momentum equation, S H is the source term on the energy equation.
In the momentum equation, only surface tension F s = σ k r n and static pressure F h = ρ g z are considered, so S x , S y , S z can be defined as:
S x = σ k r x S y = σ k r y S z = σ k r z + ρ g z
where, σ is the surface tension coefficient, k r is the local curvature, ρ is the material density, g is the gravitational acceleration, and x , y , z is the vector in the x, y, z directions.

2.2. Boundary Conditions

(1)
Boundary conditions of the upper surface:
Energy exchange includes the energy absorbed by the powder, the energy lost by heat convection, and the energy lost by thermal radiation [33]:
k T z = q ˙ E q ˙ R q ˙ C
q ˙ E is the heat source of the electron beam, q ˙ R is the energy lost through thermal radiation, and q ˙ C is the energy lost through thermal convection.
The focused electron beam is a typical Gaussian heat source, and its energy distribution follows the Gaussian distribution [33]:
q ˙ E = 3 A P π l B 2 exp ( x 0 2 + y 0 2 l B 2 )
where, l B is the radius of the focused electron beam spot, A is the absorption rate of the powder bed to the electron beam energy, 0.7, P is the power of the electron gun, x 0 , y 0 is the relative distance from the center of the spot.
The control equation of q ˙ C is [33]:
q ˙ C = h C ( T T )
The control equation of q ˙ R is [33]:
q ˙ R = ε σ e ( T 4 T 4 )
where h C is the thermal convection coefficient of the surface, with a value of 80 W/(m2K), ε is the thermal radiation coefficient of the surface with a value of 0.36, T is the instantaneous temperature of the surface, T is the temperature of the environment, and σ e is the Stefan–Boltzmann constant with a value of 5.67 × 10⁻⁸ W/m2K4 (Table 1).
(2)
Boundary conditions of the side/bottom surface:
When simulating a single scan line, set the symmetrical surface as the adiabatic surface:
T y = 0
u y = 0
v = 0
w y = 0
Due to the heating and synchronous preheating of the substrate, the side and surface temperatures are set to be the same as the preheating temperature, and there is also thermal convection and thermal radiation on the side and the ground.

2.3. TiAl Alloy Properties Parameters

The EBSM process exhibits severe temperature fluctuations and a wide range of variations, causing the metal material to undergo transitions from a powder state to a liquid state and then from a liquid state to a solid state. The thermal properties of the material also change accordingly. Due to the different internal heat transfer mechanisms, the thermal properties of powder materials, especially their thermal conductivity, differ significantly from those of bulk materials. Based on Kan’s article [31], using the Pandat 2022 simulation software, the relationship between the temperature variation and the basic physical property parameters can be calculated as shown in Figure 1.

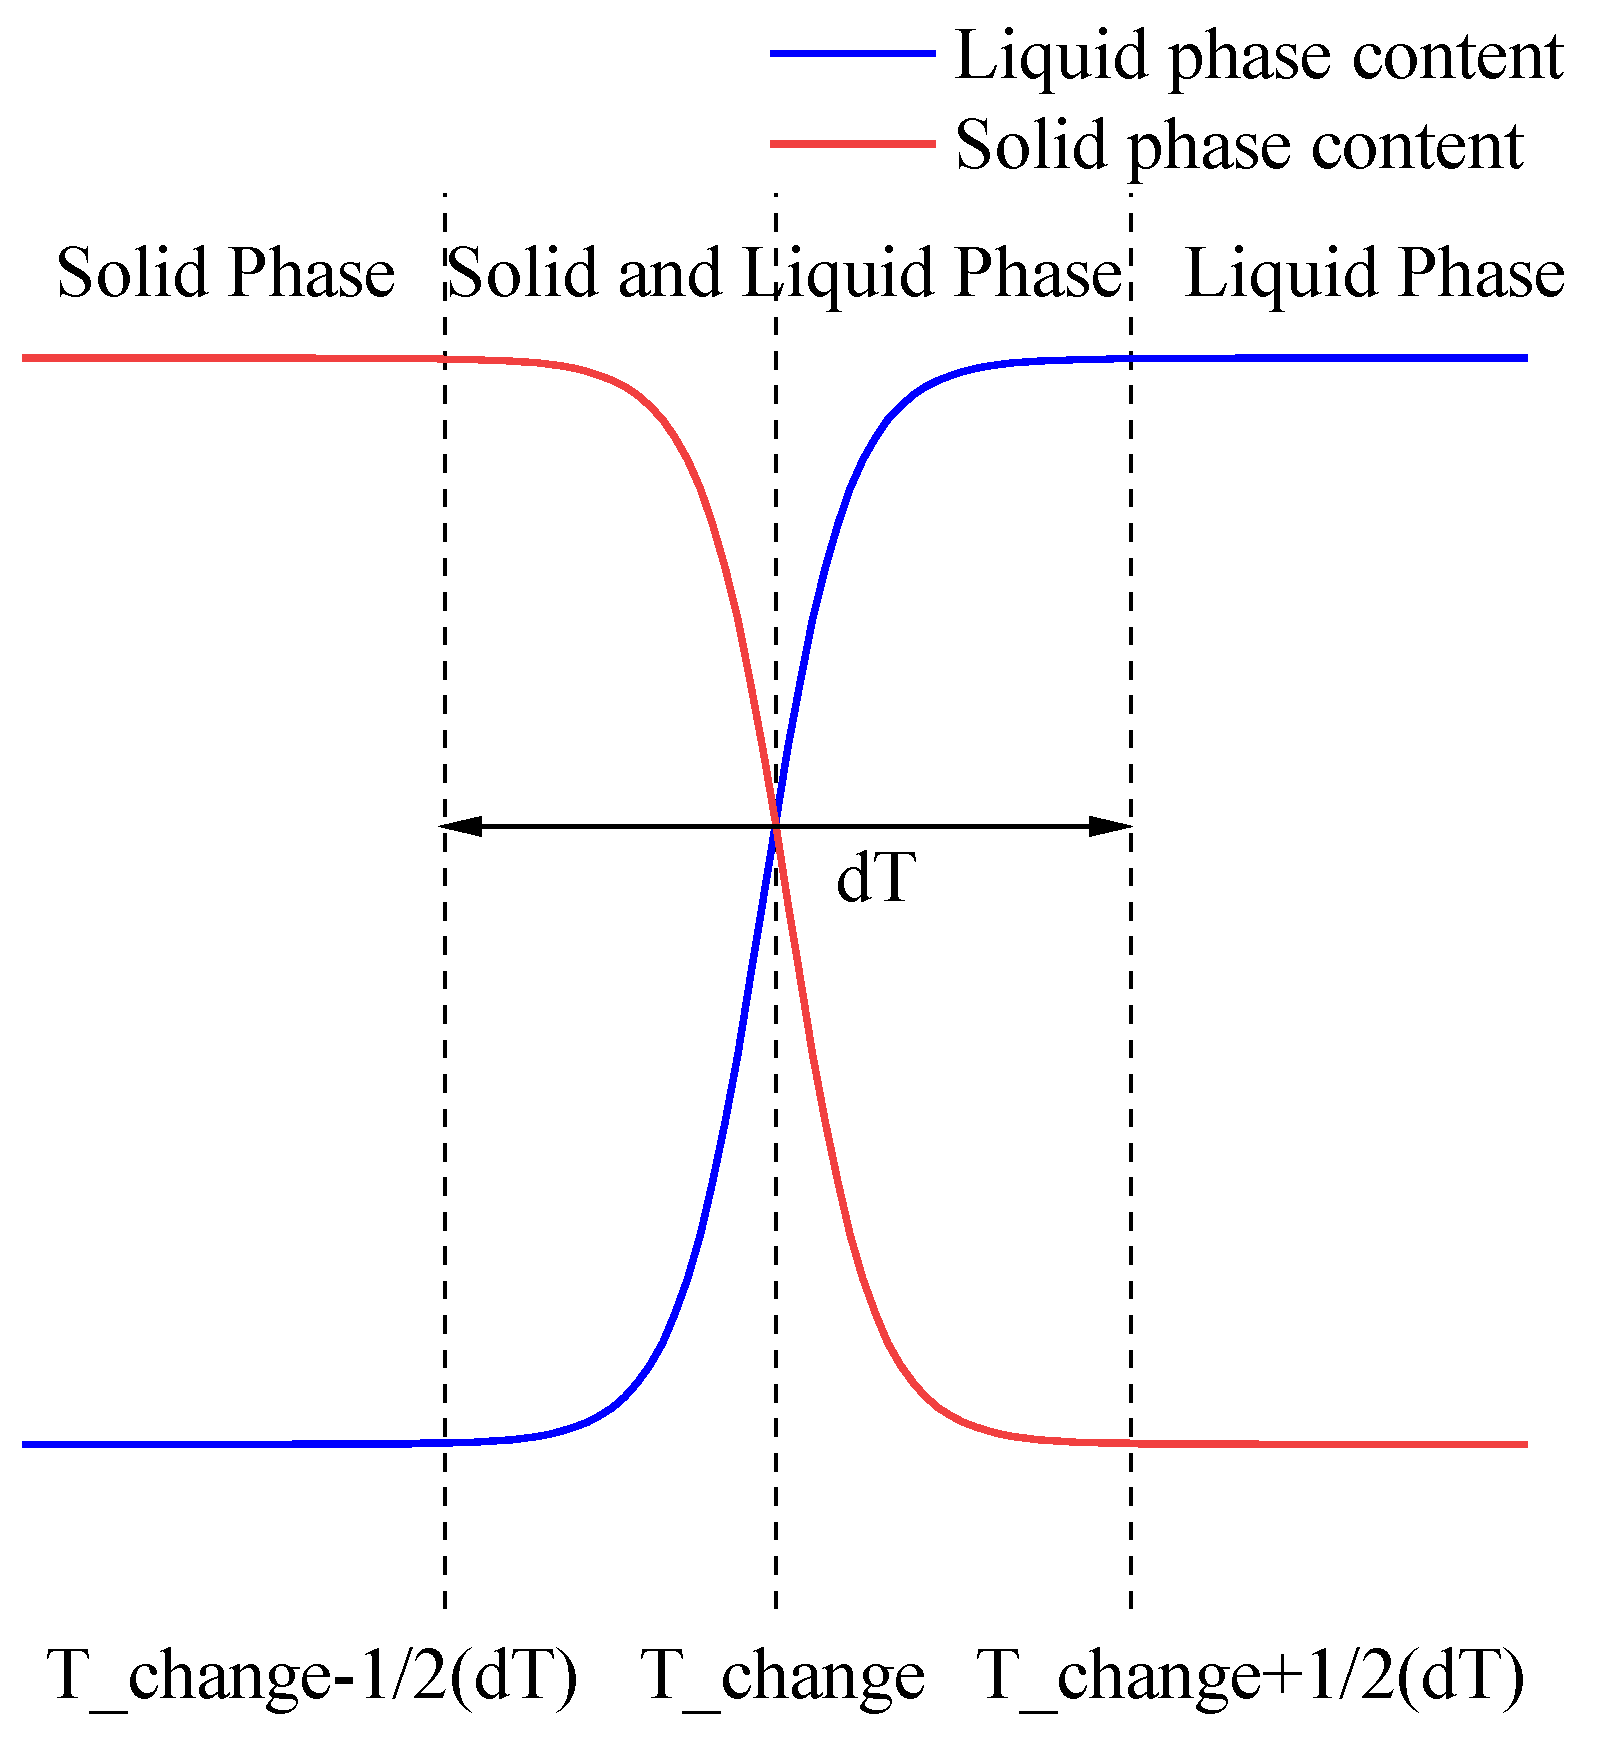
2.4. Solid–Liquid Phase Transformation

Select the phase change material interface in COMSOL 6.0, and define the phase change function α(T) in the interface as the Heaviside function. Set the solid-liquid phase change temperature T_change, the phase change temperature interval dT, and the latent heat of solidification dH. Simulate the solid–liquid phase change using the apparent heat capacity method. The graph of the phase change function is shown below (Figure 2).
The apparent heat capacity method uses the following expression for heat capacity:
C p = C p , solid ( 1 a ( T ) + C p , liquid a ( T ) + d H d α d T )
The latent heat of the phase transition, as the source energy, significantly affects the shape of the bath. The mathematical expression is:
S H = ( t ( ρ Δ H ) + x ( ρ u Δ H ) + y ( ρ v Δ H ) + z ( ρ w Δ H ) )
where h = h ref + T r e f T C p d T .

2.5. Model Set-Up

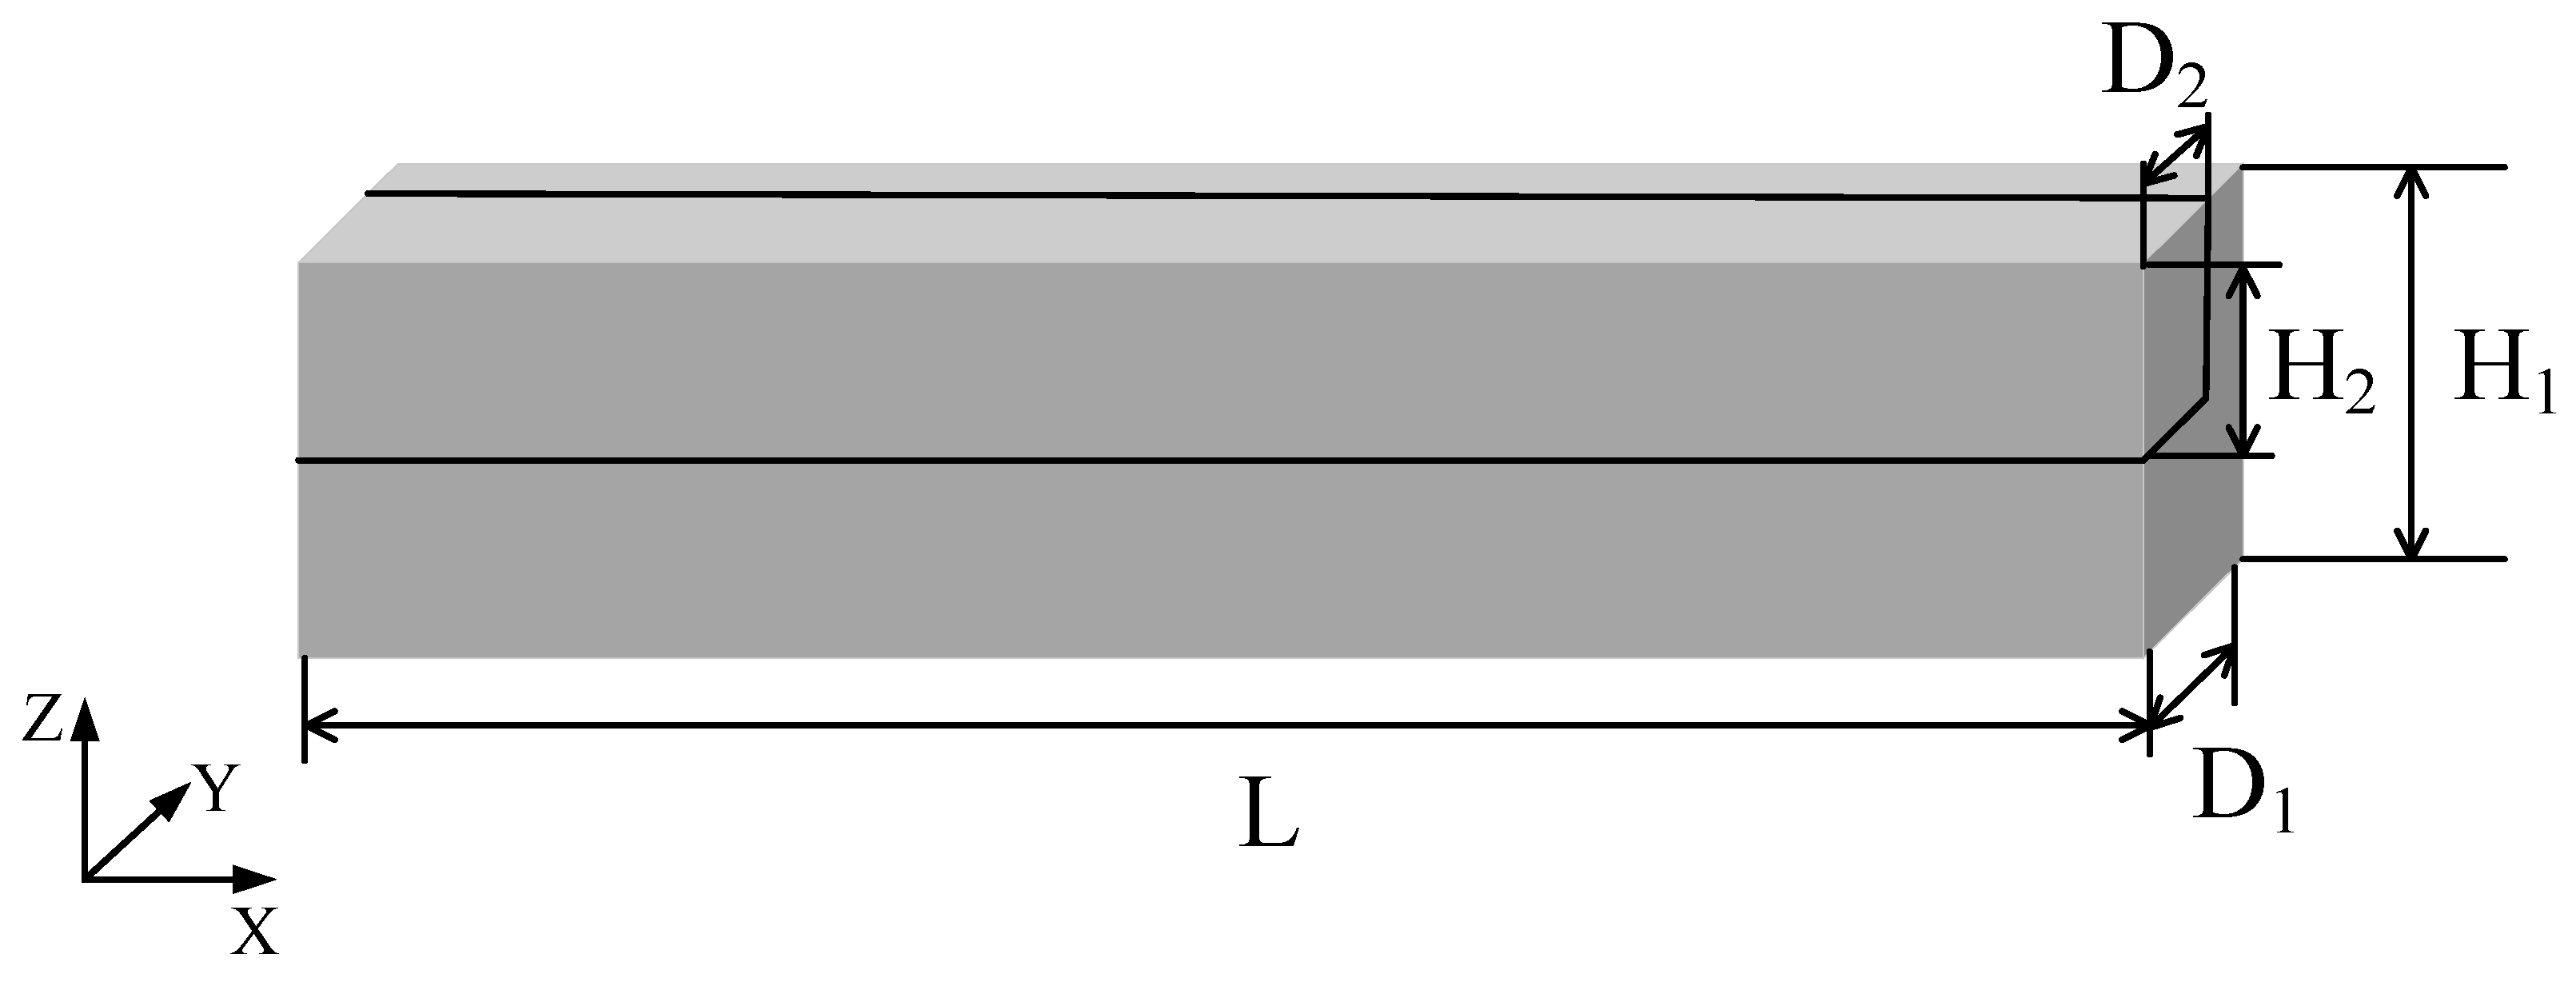
2.5.1. Single Scanning Line Model

The single scanning line model is created in COMSOL 6.0 software to simultaneously meet computational resource and accuracy requirements. The model is symmetric, with the front face being the symmetry plane. The area where the grid needs to be encrypted is further divided. The total length L of the model is 5 mm, the total width D1 is 0.6 mm, and the total height H1 is 0.3 mm. The encrypted part of the mesh is located near the symmetry plane of the model, with a length of 5 mm, a width of 0.3 mm, and a height of 0.15 mm. The physical field control equations applied in this model include the mass conservation equation (Equation (1)), momentum conservation equations (Equations (2)–(4)), energy conservation equation (Equation (5)), heat convection and thermal radiation (Equation (6)), Gaussian heat source (Equation (7)), and latent heat of phase change (Equations (14) and (15)).
The central part of the build surface is the electron beam heating area, where the temperature will change drastically, so the mesh must be encrypted. The upper half of the symmetrical surface needs refinement to observe the cross-sectional morphology of the melt pool. Other areas require a coarser grid to reduce computational load. The refined area is set as the fluid computational domain and divided into tetrahedral grids. Compared to the grids in the regular physical computational domain, the grids in the fluid computational domain are finer and more uniform, with smaller computational errors when the maximum grid cell size and maximum grid growth rate are small. The structure and grid division of the heat conduction model are shown in Figure 3 and Figure 4. The model parameters are provided in Table 2.

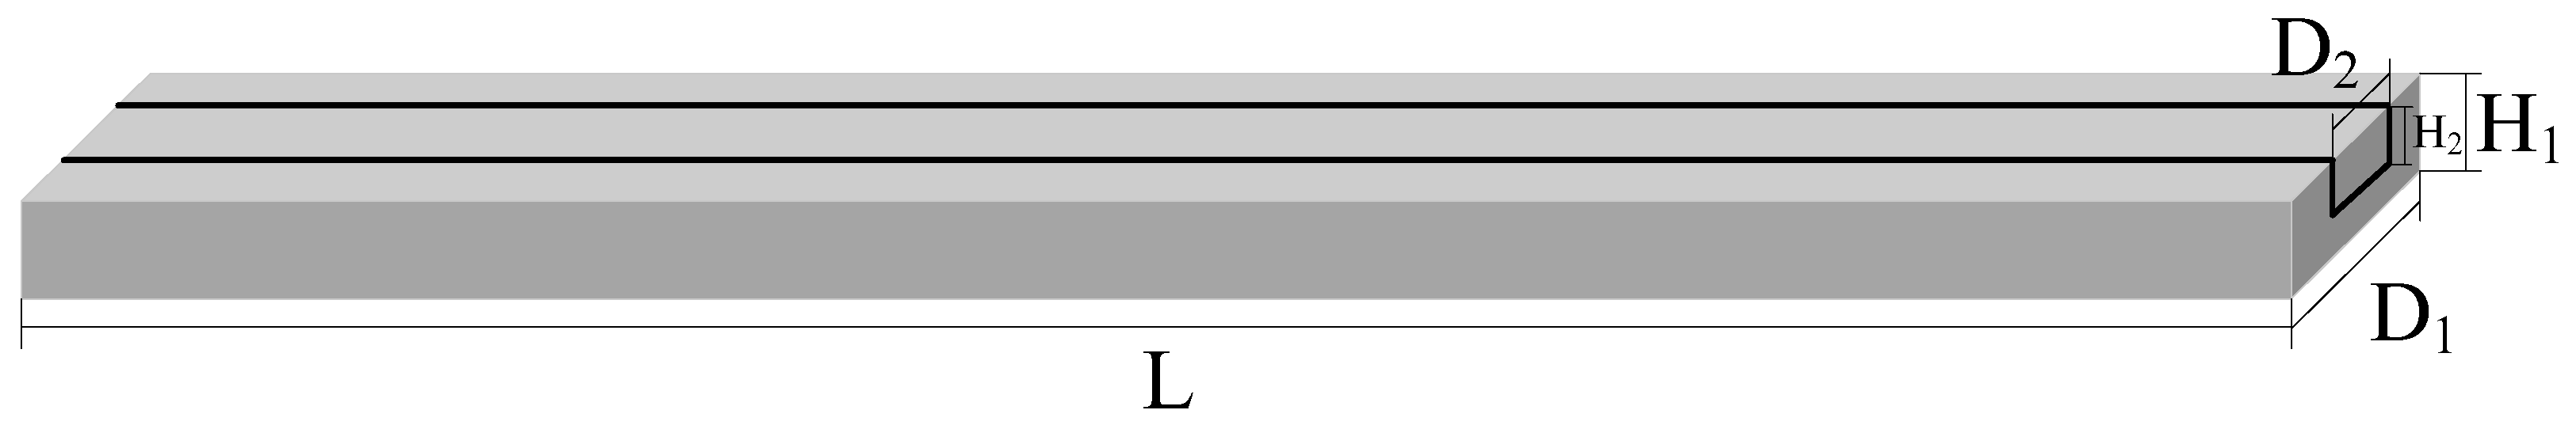
2.5.2. Multi-Scanning Line Model

A multi-scan line model is established on the basis of a single scan line model. The overall size of this model is 30 × 3 × 1 mm3, with the middle 1/3 part of the model serving as the electron beam scanning area. The scanning area is 30 × 1 mm2, which includes ten scanning lines. The range of these ten scanning lines essentially covers the thermal influence region of the scanning lines, and reducing the model size appropriately can help save computational resources. Set up an observation point at the center of the sixth scan line to monitor the temperature changes throughout the scanning process in order to understand the temperature variations in the scanning area. Additionally, this can help investigate the temperature field impact between different scanning lines. The electron beam scanning area needs to be grid encrypted to improve the quality and accuracy of the simulation results.
The physical field control equations applied in this model include the mass conservation equation (Equation (1)), momentum conservation equations (Equations (2)–(4)), energy conservation equation (Equation (5)), heat convection and thermal radiation (Equation (6)), Gaussian heat source (Equation (7)), and latent heat of phase change (Equations (14) and (15)). The structure and grid division of the heat conduction model are shown in Figure 5 and Figure 6. The model parameters are provided in Table 3.

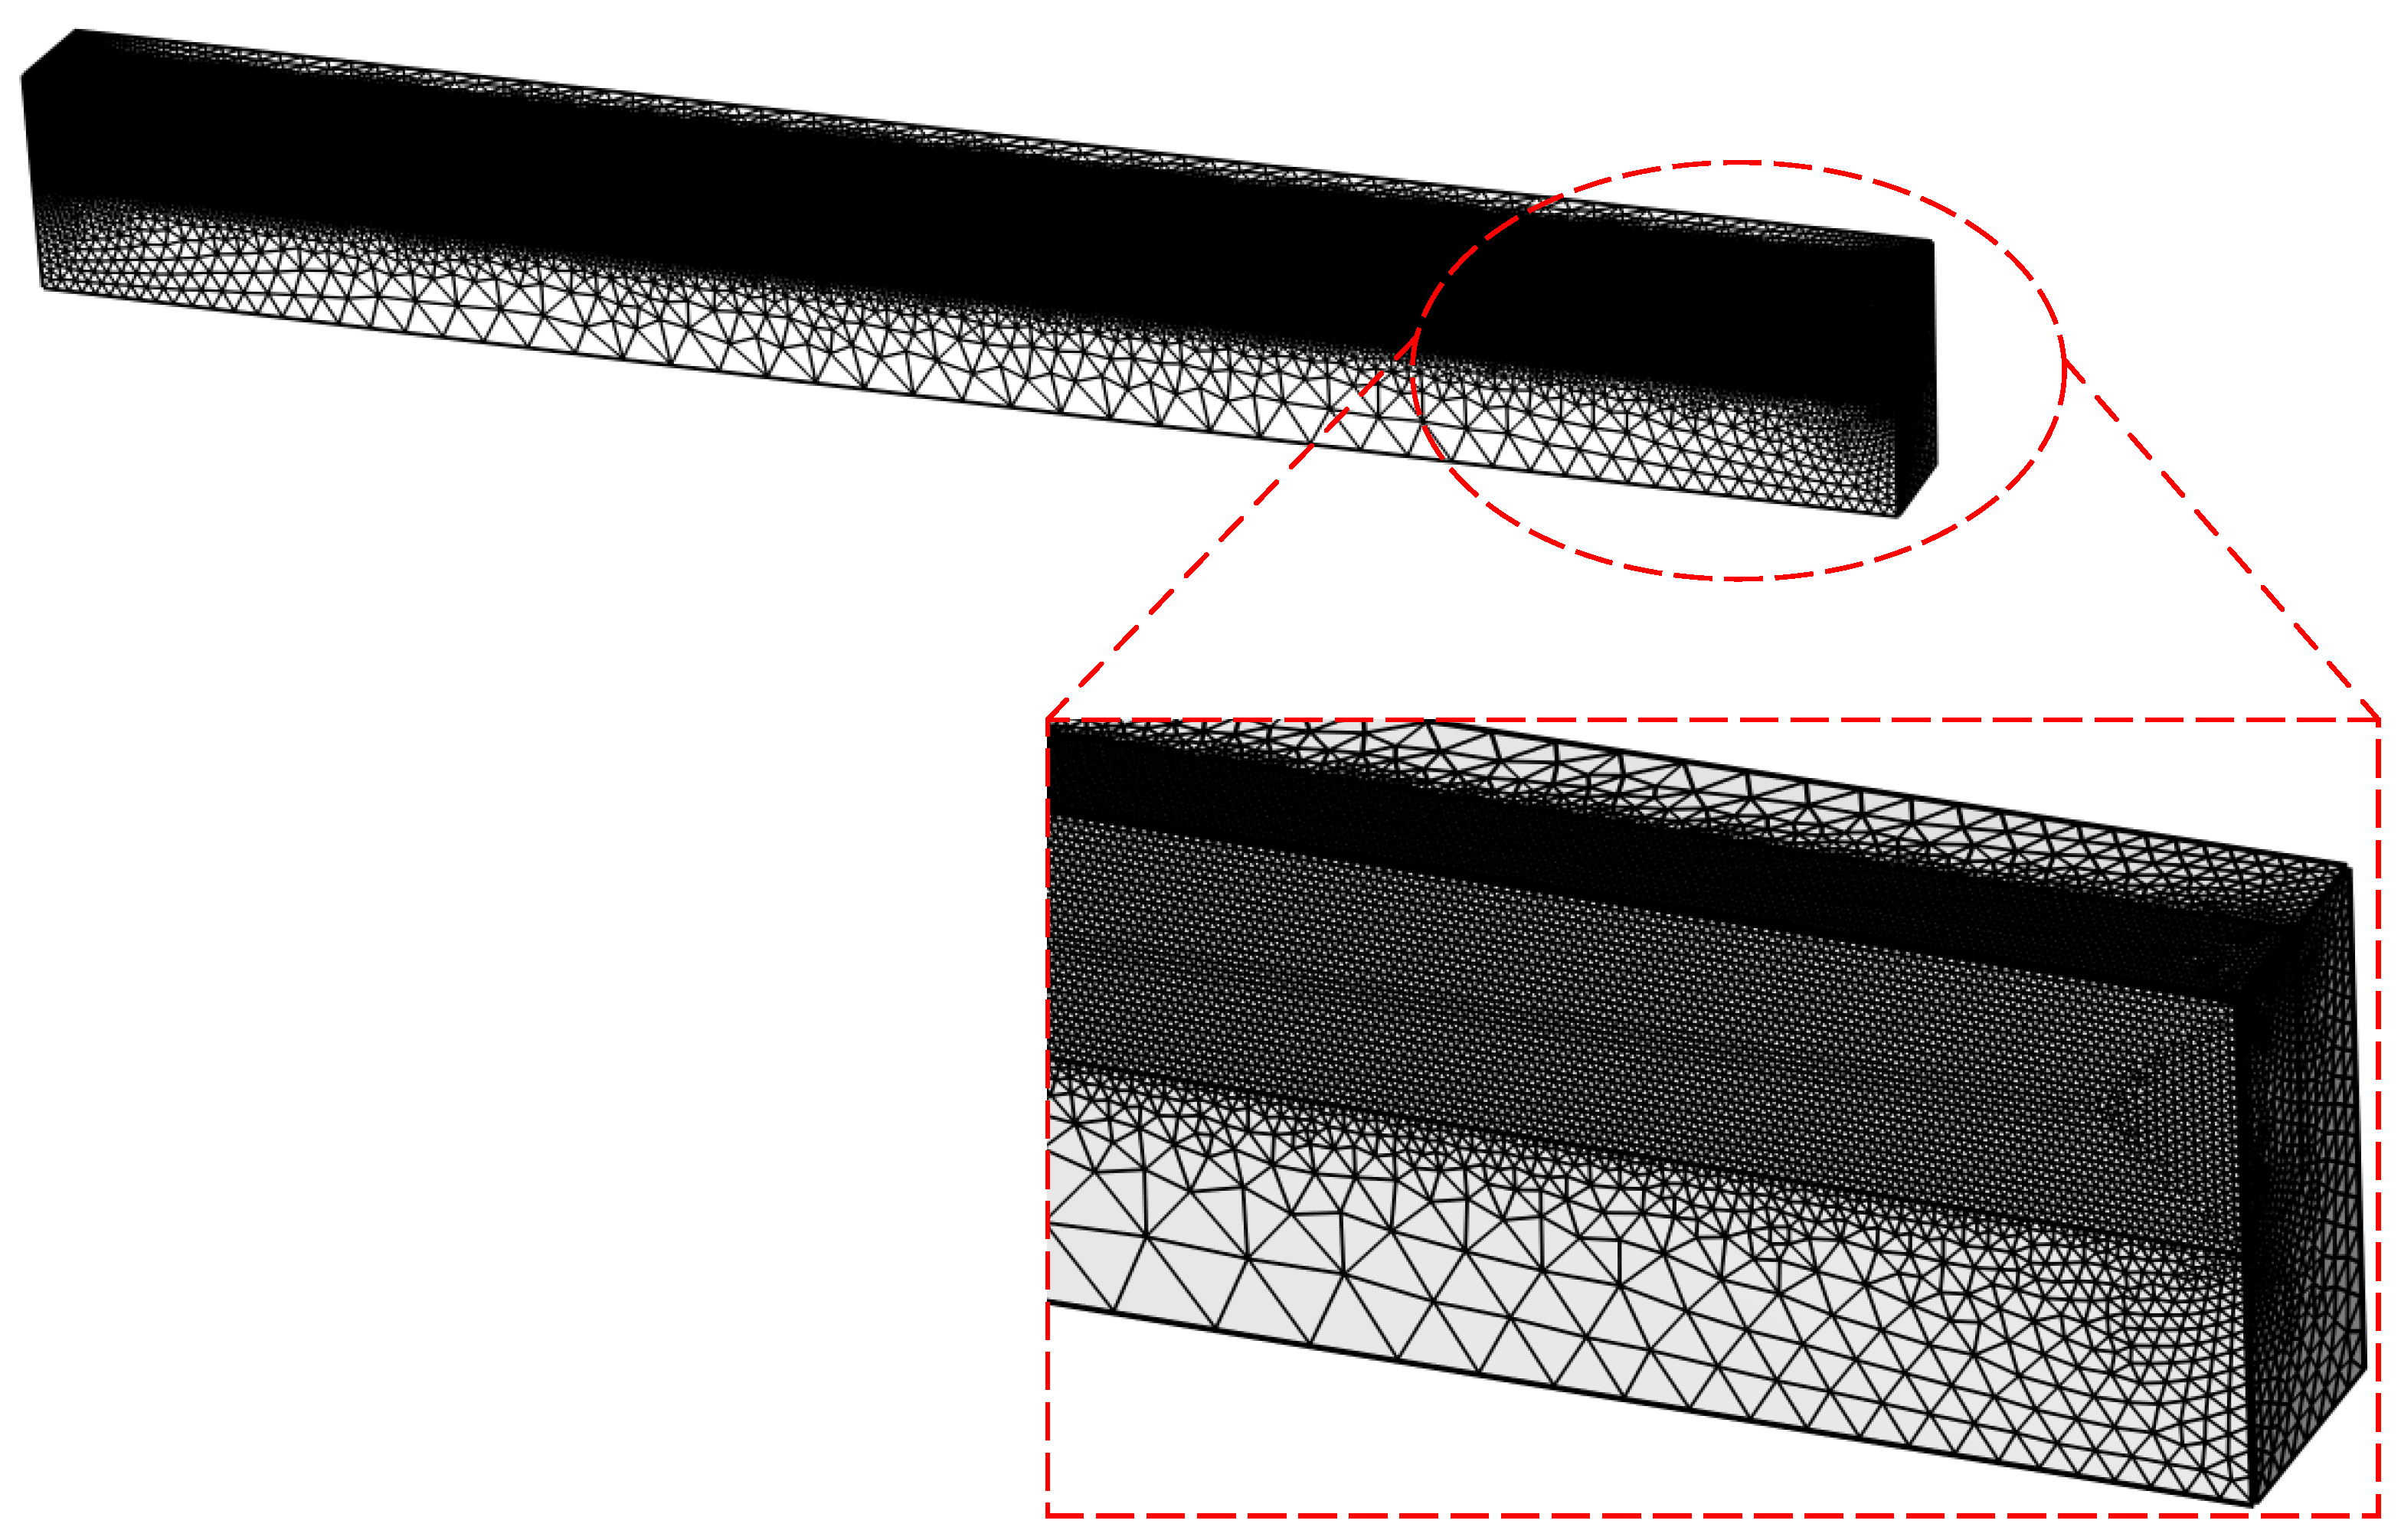
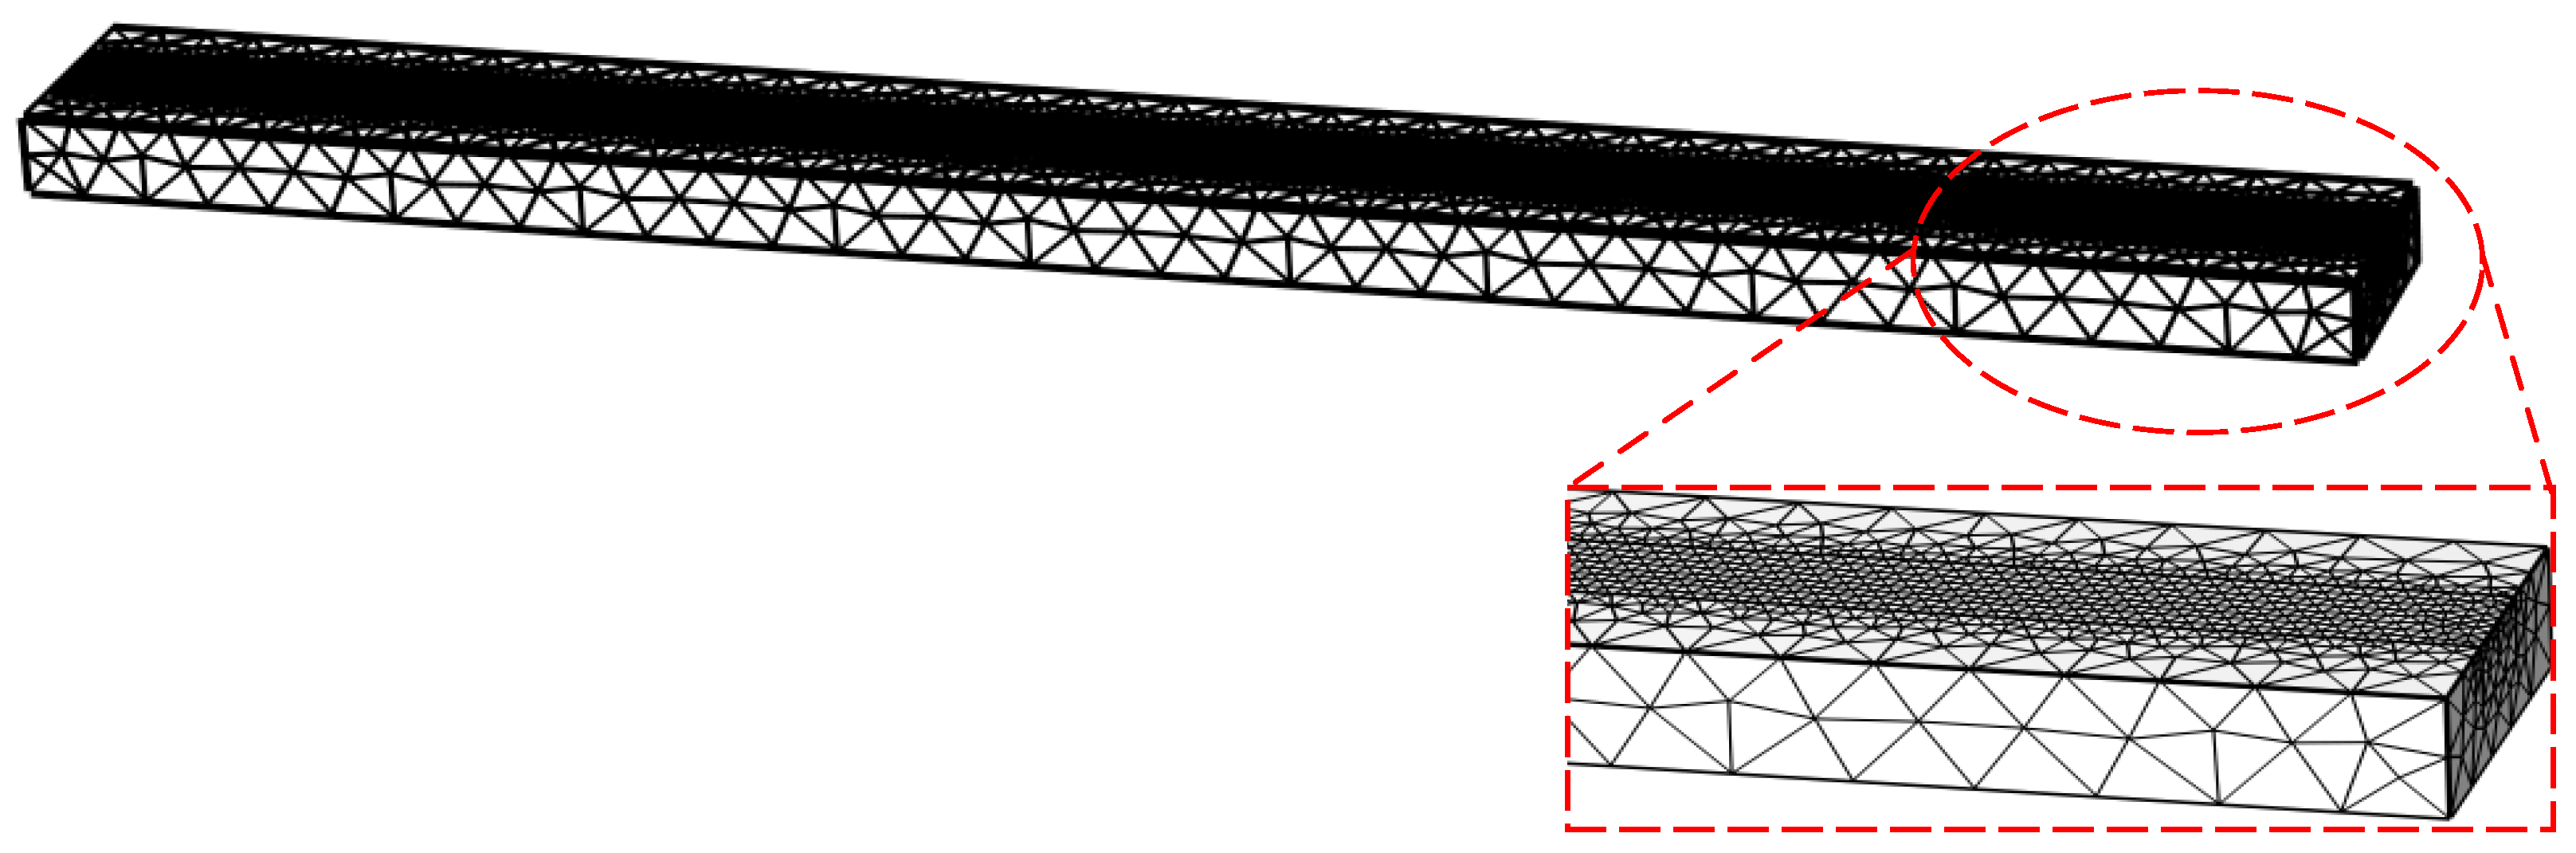
2.6. Grid Independence Verification

To ensure the robustness and reliability of the results, we conducted a grid independence verification of the model. A coarser grid was applied to our model to compare the research results obtained with the finer mesh described earlier. It consisted of 30,000 mesh elements, while the finer grid contained 330,000 grid elements. The coarser grid model is shown in Figure 7.

3. Results and Discussion

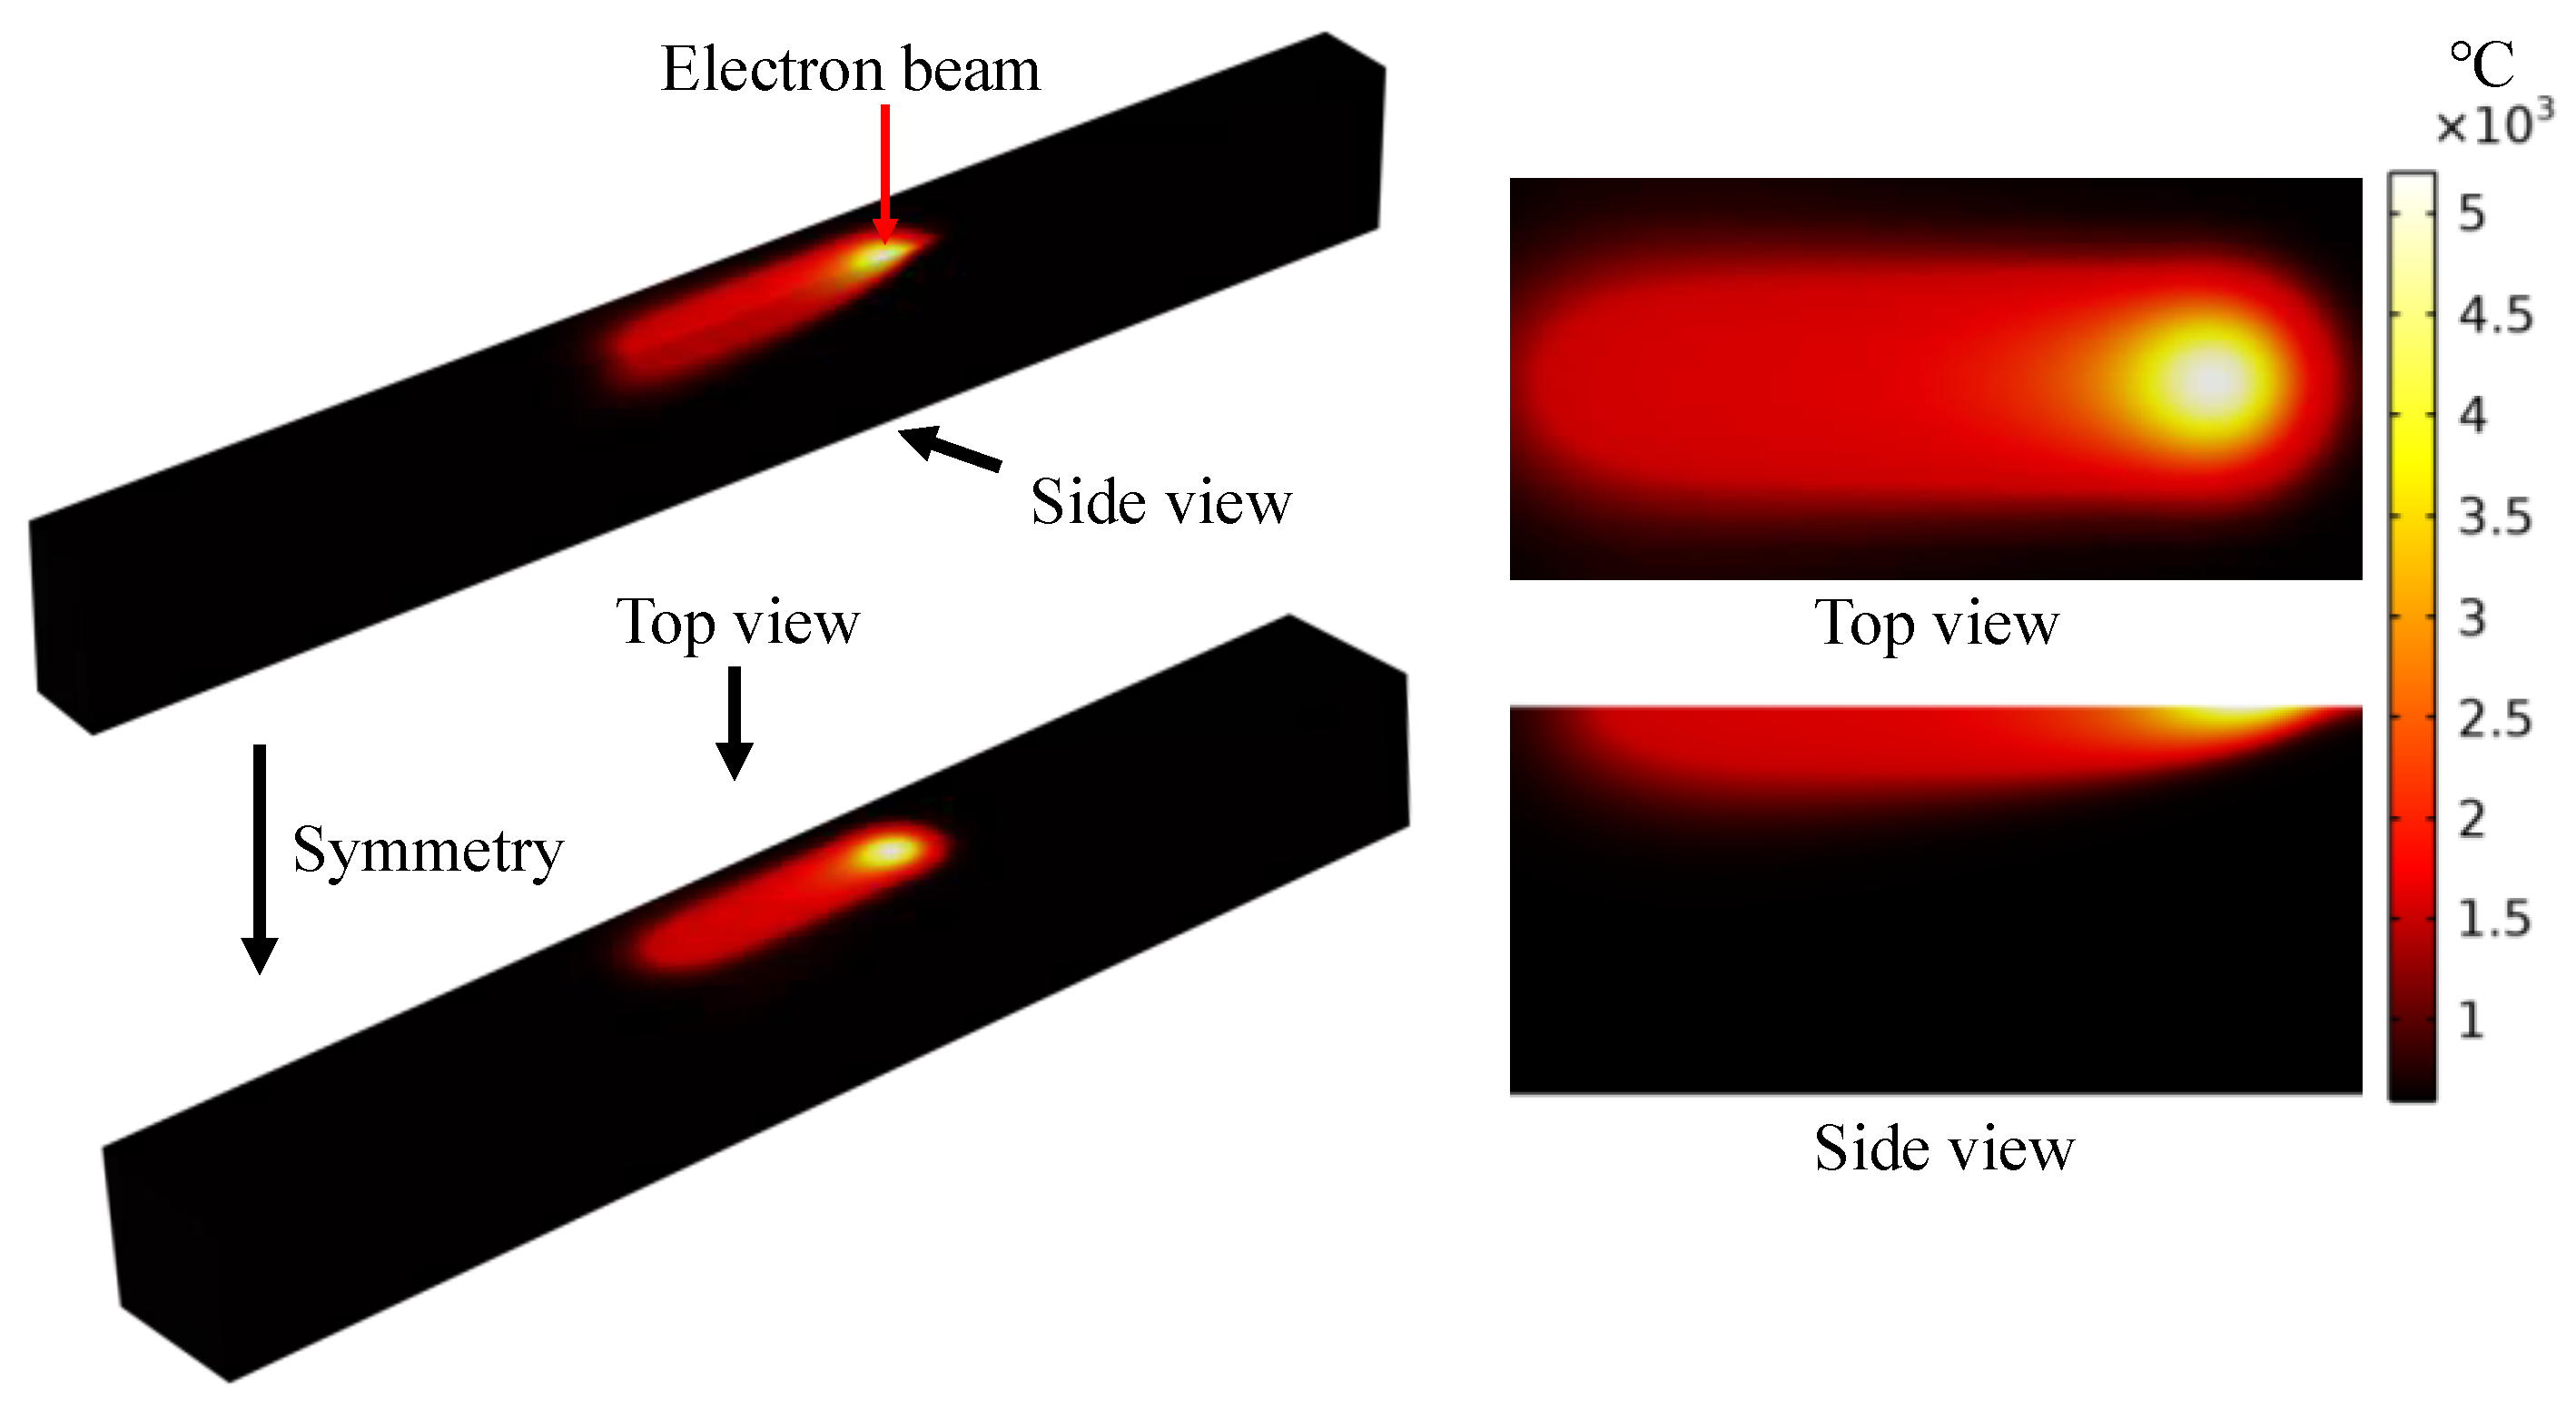
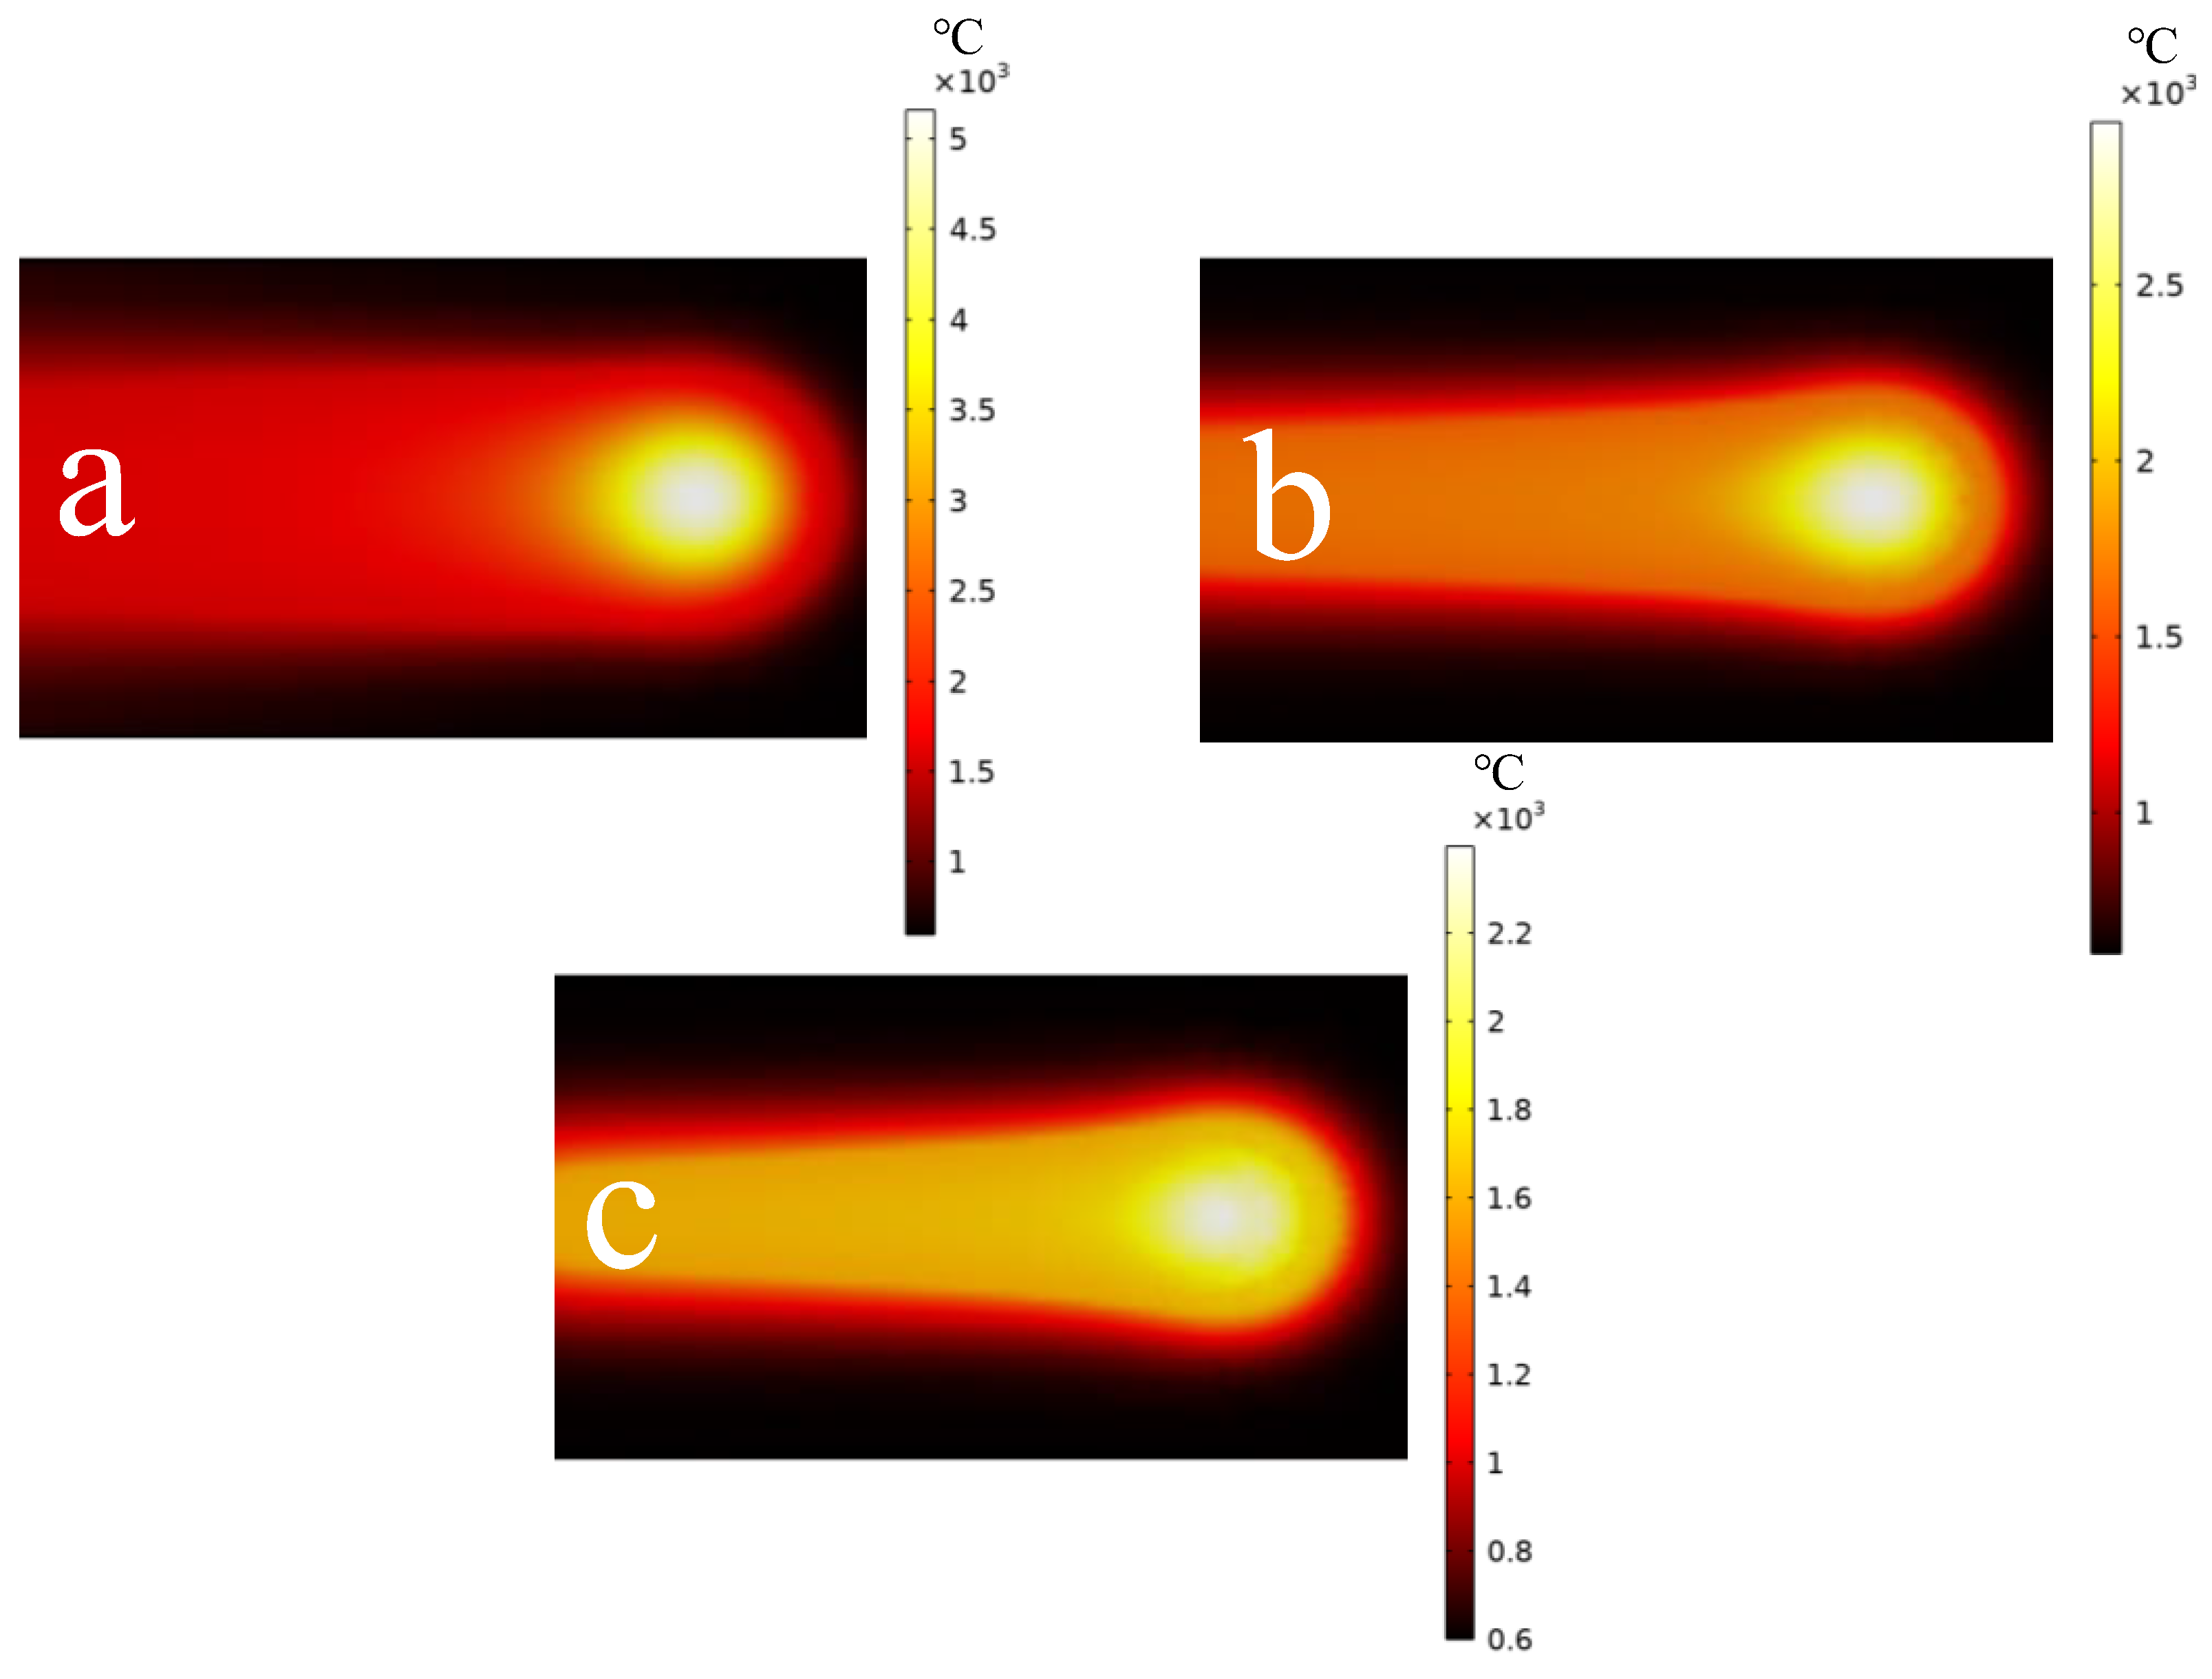
3.1. Single Scanning Line Results and Analysis

The melting and solidification of metal powder in the electron beam selective melting additive manufacturing process is a non-equilibrium physical process [34]. It involves complex physical phenomena such as mass transport and phase changes. Figure 8 shows the temperature field distribution on the build surface and cross-section of the powder bed when the electron beam scanning speed is 1000 mm/s and the current is 1 mA. From the figure, it can be seen that the position of the highest temperature on the build surface of the melt pool lags slightly behind the center position of the electron beam. The energy of the high-energy electron beam is applied to the powder bed and the corresponding position of the melt pool in the form of a Gaussian distribution at each moment. When the center of the electron beam moves to the next position, the material at the previous position can still absorb the energy of the electron beam and continue to heat up.
Figure 9 shows the changes in melt pool morphology with electron beam moving speeds of 1000 mm/s, 5000 mm/s, and 10,000 mm/s under identical conditions. From the graph, we can see that as the scanning speed increases, the trailing edge of the high-temperature region gradually lengthens, and the melt pool length increases. In addition, the shape of the electron beam heating section transitions from elliptical to droplet-shaped. This transition occurs because the downward conduction of temperature on the powder bed requires some time. The higher scanning speed causes the temperature applied by the electron beam on the surface to not rapidly conduct to the lower layers, resulting in the elongation of the high-temperature region’s trailing edge and melt pool length. Furthermore, as the scanning speed increases, the temperature applied by the electron beam on the surface fails to quickly spread to the sides, leading to insufficient heating of the powder bed by the electron beam and the formation of a droplet shape. The measured melt pool lengths are 170 um at 1000 mm/s, 192 um at 5000 mm/s, and 216 um at 10,000 mm/s. These results reveal the intricate interplay between scanning speed, heat conduction, and molten pool characteristics.
By comparing Figure 9 and Figure 10, we can see that the surface images of the melt pool obtained using the coarse mesh are almost identical to those obtained using the fine mesh, and the trends in the results are also the same. The maximum error between the temperature field results obtained using the coarse mesh and those obtained using the fine mesh is within 10%.
Figure 11 shows when v = 1000 mm/s, the temperature at the upper boundary of the symmetric plane x = 0.002, x = 0.0022, x = 0.0024, x = 0.0026, x = 0.0028, and x = 0.003 changes over time. It can be observed that the temperature at each position changes as the electron beam center moves. As the electron beam approaches the designated position, the temperature begins to rise rapidly, leading to localized heating and melting. During the temperature increase, there is a small fluctuation, during which the temperature is within the solid–liquid phase transition temperature range, causing the solid metal powder to absorb heat and melt, forming a molten pool. When the electron beam reaches the designated position, the temperature reaches its peak. As the electron beam moves past the designated position, the temperature gradually begins to decrease, ultimately stabilizing at around 2000 K. From the graph, it is evident that the heating efficiency during the temperature rise process is significantly higher than the cooling efficiency during the temperature decrease process. This indicates that electron beam heating and melting are a rapid process, while subsequent cooling and solidification are a relatively slow process.
Figure 12 shows the temperature variation graph obtained by taking five points every 0.00002 m from top to bottom at the symmetric surface x = 0.0025 m, y = 0 when v = 1000 mm/s. From the graph, we can see that the temperature is higher closer to the build surface, with more dramatic temperature changes, indicating higher heating efficiency closer to the surface directly heated by the electron beam. As the heating moves downwards, the efficiency decreases, the maximum achievable temperature decreases, and the time to reach the maximum temperature lags behind. Zhang [35] utilized a three-dimensional heat and mass transfer model that combines the lattice Boltzmann method and the finite volume method to study the temperature field of the molten pool during the electron beam selective melting process. Zhang’s research findings indicate that the temperature trends at different depths align with the observations in this paper. From the cross-sectional view in Figure 13, we can see that when the electron beam is applied to the material, the energy deposited on the material decreases with depth due to the influence of the material’s thermal conductivity. Therefore, at the same location, the temperature decreases with increasing depth. The temperature rise at different depths lags behind as the depth increases, and the maximum temperature achievable at greater depths also decreases. Therefore, during the process of scanning multiple layers of powder, to ensure print density, the powder layer thickness must be less than the maximum depth at which the electron beam heating can form a molten pool under the corresponding scanning speed.
Similarly, by comparing Figure 13 and Figure 14, we can see that the cross-sectional images of the melt pool obtained using the coarse mesh are almost identical to those obtained using the fine mesh, and the trends in the results are also the same. The maximum error between the temperature field results obtained using the coarse mesh and those obtained using the fine mesh is within 10%.
Figure 15 shows the overall size of the melt pool as a function of scanning speed at v = 1000 mm/s, v = 5000 mm/s, and v = 10,000 mm/s. It can be observed that as the scanning speed increases, the length of the melt pool also increases, with the growth rate approaching a straight line. At v = 5000 mm/s, the length of the melt pool is close to twice the diameter of the electron beam. Furthermore, with increasing scanning speed, the width and depth of the melt pool decrease, but the decrease in width is not significant, remaining at around 140 µm. Therefore, when scanning multiple scan lines, to ensure the density of the printed sample, the spacing between adjacent scan lines must be less than the width of the melt pool under the corresponding speed. The depth of the melt pool is significantly influenced by the scanning speed, but as the speed increases, the rate of change decreases. This is because the electron beam energy has strong penetrative properties; once applied to the surface of the powder bed, it penetrates to a certain depth. When the depth of the melt pool decreases to near this penetration depth, the rate of change significantly decreases, ultimately approaching the penetration depth infinitely closely. This differs from the results of Chen. In Chen [28] et al.’s results, the length of the molten pool decreases with increasing scanning speed, while the width and depth decrease with increasing scanning speed. This is mainly because he took into account the powder layer in the article, and his line energy density is different from that in this paper; the trend of the length change of the molten pool is also different.

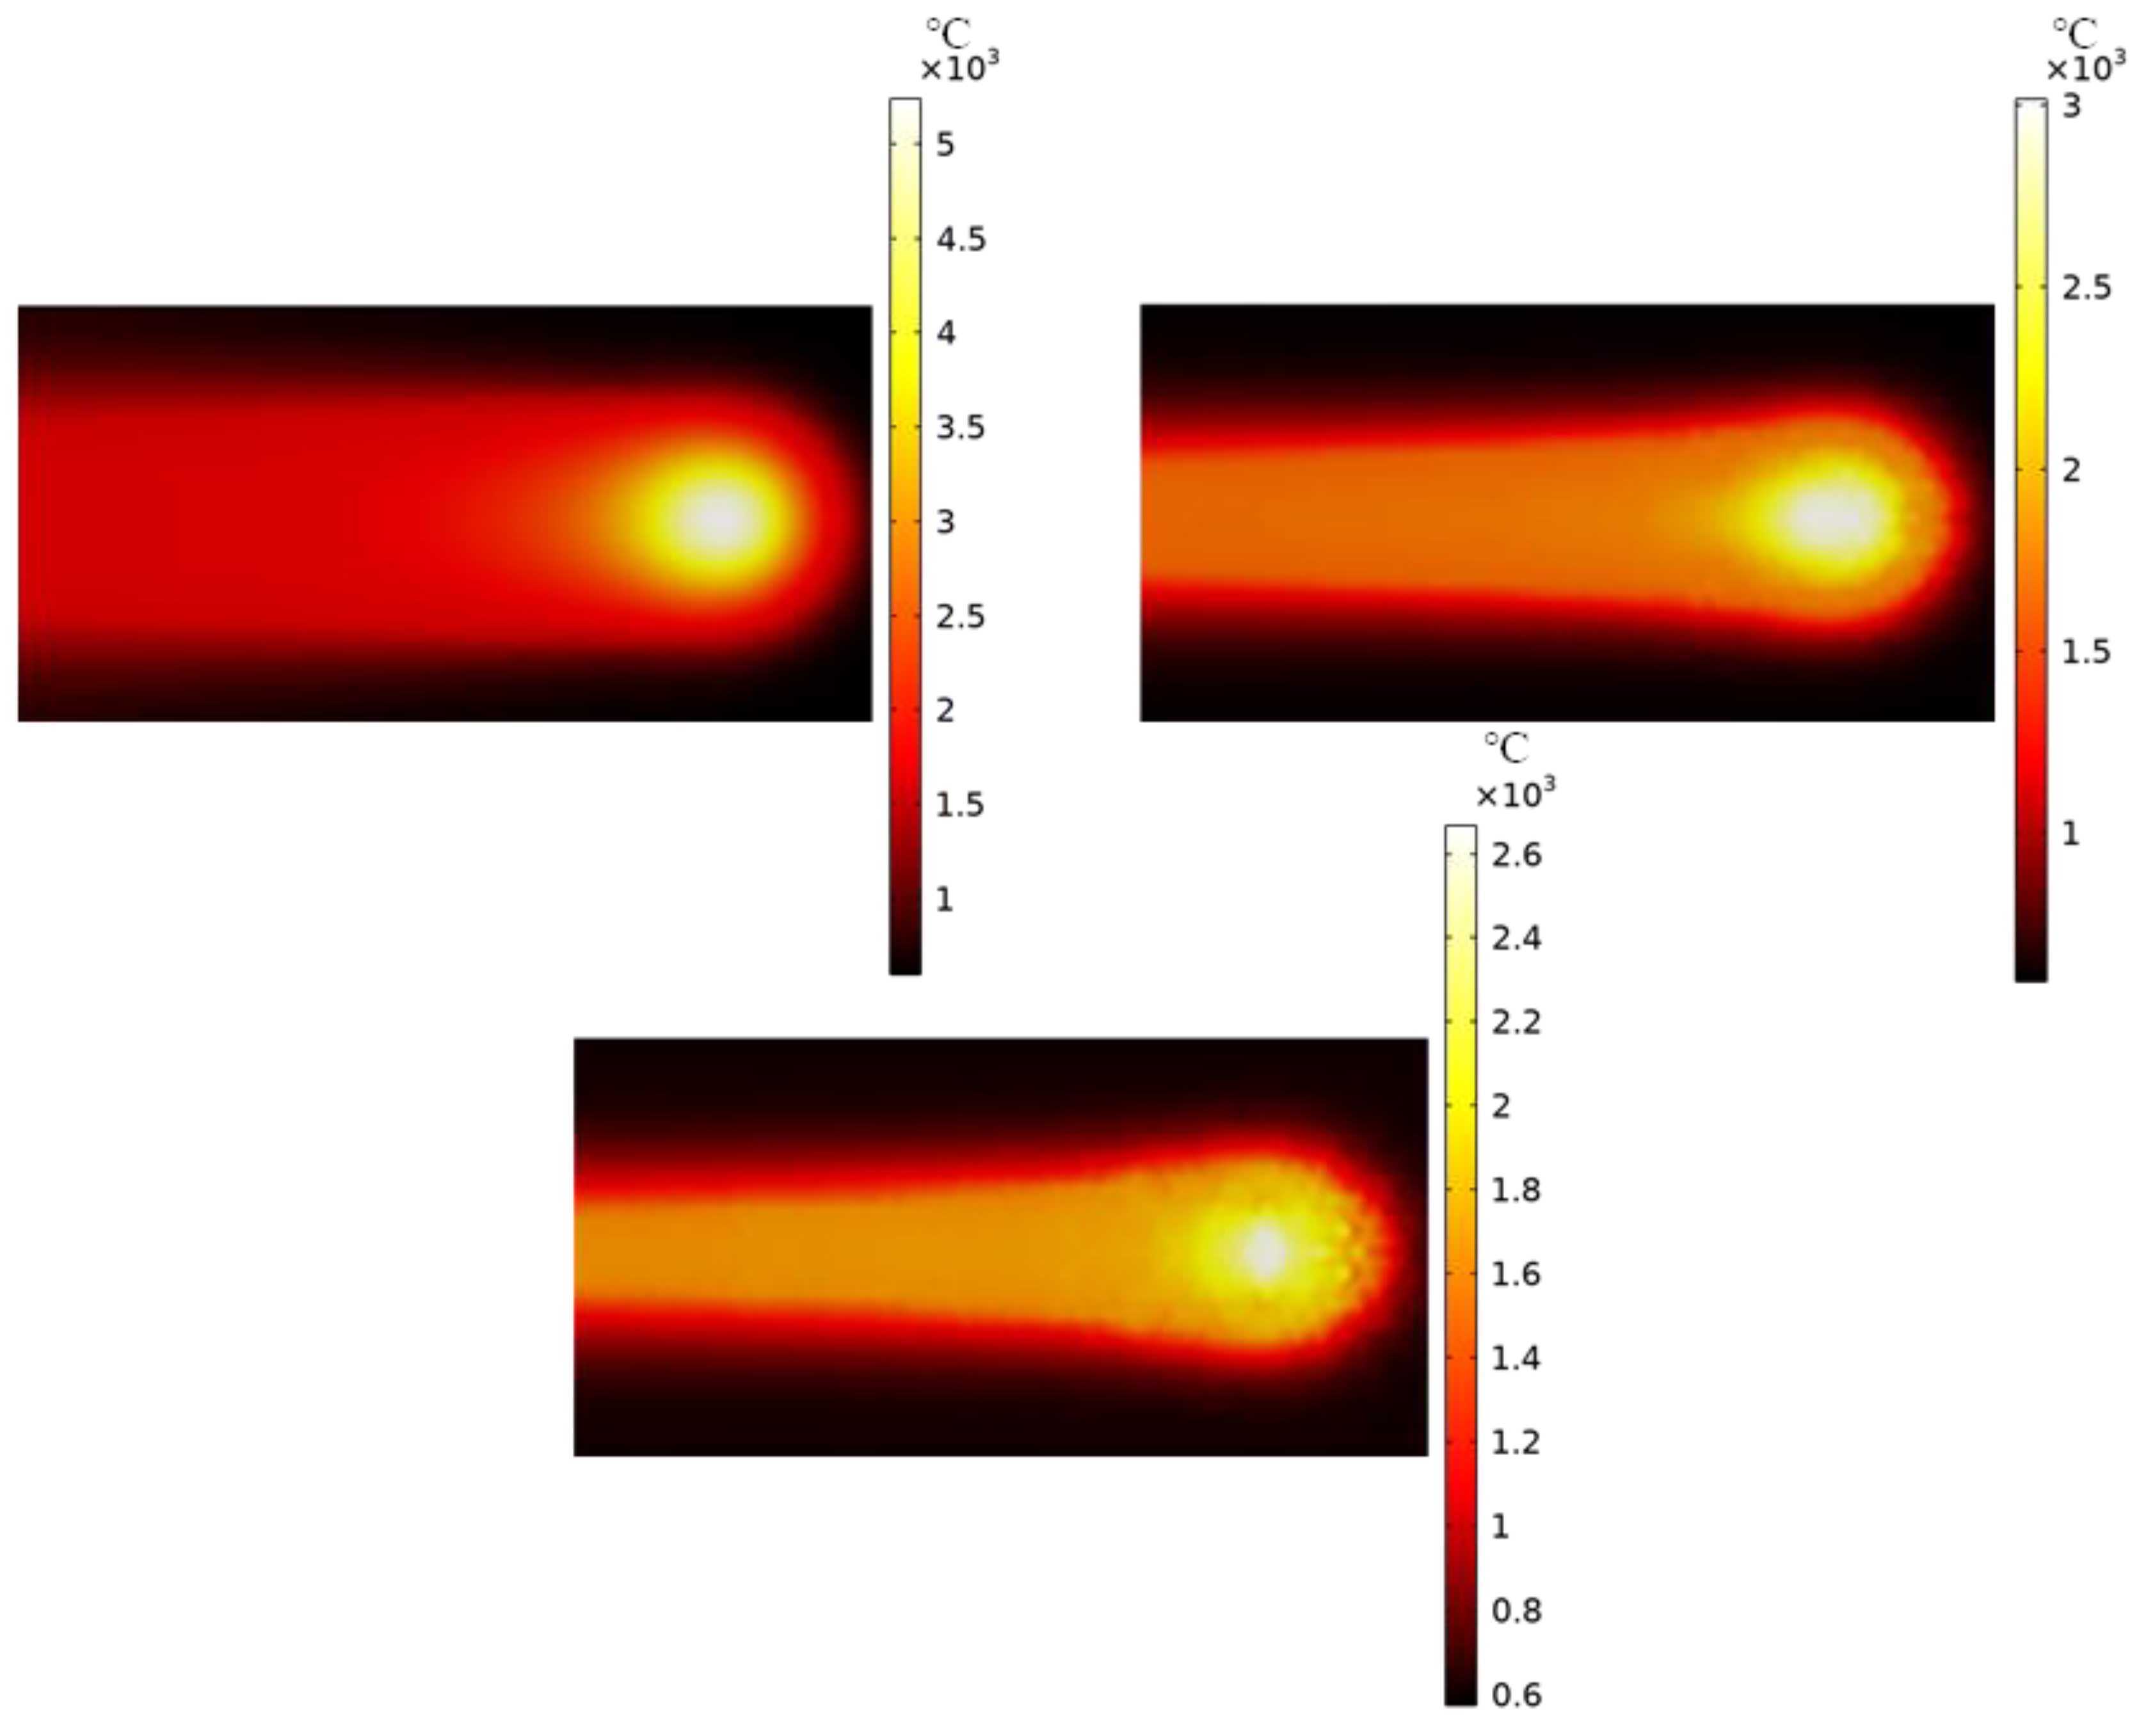
3.2. Multi-Scanning Line Results and Analysis

At v = 4000 mm/s, N = 10, L_beam = 100 um, I = 7 mA, considering phase transition, thermal radiation, thermal convection, and heat absorption from Al vaporization, the temperature variation at the central observation point in the scanning area is shown in Figure 16. The average temperature of the surface after preheating under normal circumstances of electron beam selective melting is about 1220 °C, so 1220 °C is set as the initial temperature. As can be seen from the figure, when the electron beam scans to the midpoint of the scanning line each time, the distance between the scanning point and the observation point is the closest, so the temperature of the observation point reaches its peak. When the midpoint of the sixth scan line is scanned, the temperature of the observation point reaches the highest, which is about 1750 °C. When the fifth and seventh scan lines are scanned, the temperature of the observation point can also reach above the melting point. It shows that the width of the bath exceeds the spacing of the scan lines, and there is a lap between the adjacent scan lines to ensure density. Ma’s study [36] simulated the electron beam selective melting heat forming of single-layer multi-channel TC4. He also selected the middle position in the scanning area as the observation point for temperature monitoring, and the final temperature trend observed was consistent with that of this article.
Figure 17 shows the effect of different initial temperatures on the temperature field during the scanning process. It can be seen from the figure that starting from 1220 °C and lowering to 1120 °C, the overall temperature at the observation point during the scanning process decreases by around 100 °C, and the temperature difference becomes smaller as the scanning progresses. In general, the initial temperature has a greater influence on the temperature field of the scanning process.
Figure 18 shows the effect of different electron beam current values on the temperature field during the scanning process. It can be seen the change in the current value does not have a great impact on the temperature of the measurement point. When I = 7 mA, the maximum temperature reached by the measurement point is 1720 °C; when I = 14 mA, the maximum temperature reached by the measurement point is 1790 °C. The current is twice as large as the original, but the maximum temperature is only 70 °C short.
Figure 19 shows the changes in the temperature field at 0.01 s, 0.02 s, 0.03 s, 0.04 s, 0.05 s, and 0.06 s during the melting process. When the temperature reaches the phase transition temperature of 1550 °C, the high Nb-TiAl of the solid phase begins to transform into the liquid phase, thereby forming a bath. Heating up during electron beam scanning is a violent process, while cooling is a slow process, so the place scanned by the electron beam will appear pale red. And it can be clearly seen that when the electron beam scans the next scan line, there will be a part that coincides with the place scanned by the previous scan line, and this part will be scanned repeatedly, and the color will be more obvious. It is the existence of this part that ensures the lap rate of sample forming and makes the sample more dense.

4. Conclusions

This article focuses on the temperature field and melt pool changes of high Nb-TiAl electron beam selective melting on a single scan line and multi-scan lines. Two three-dimensional thermal-fluid models were established in COMSOL 6.0 to numerically simulate the evolution of the melt pool and temperature field at different electron beam scanning speeds under a single scan line and the evolution of the temperature field under multi-scan lines.
Based on the simulation results, the conclusions are as follows:
(1)
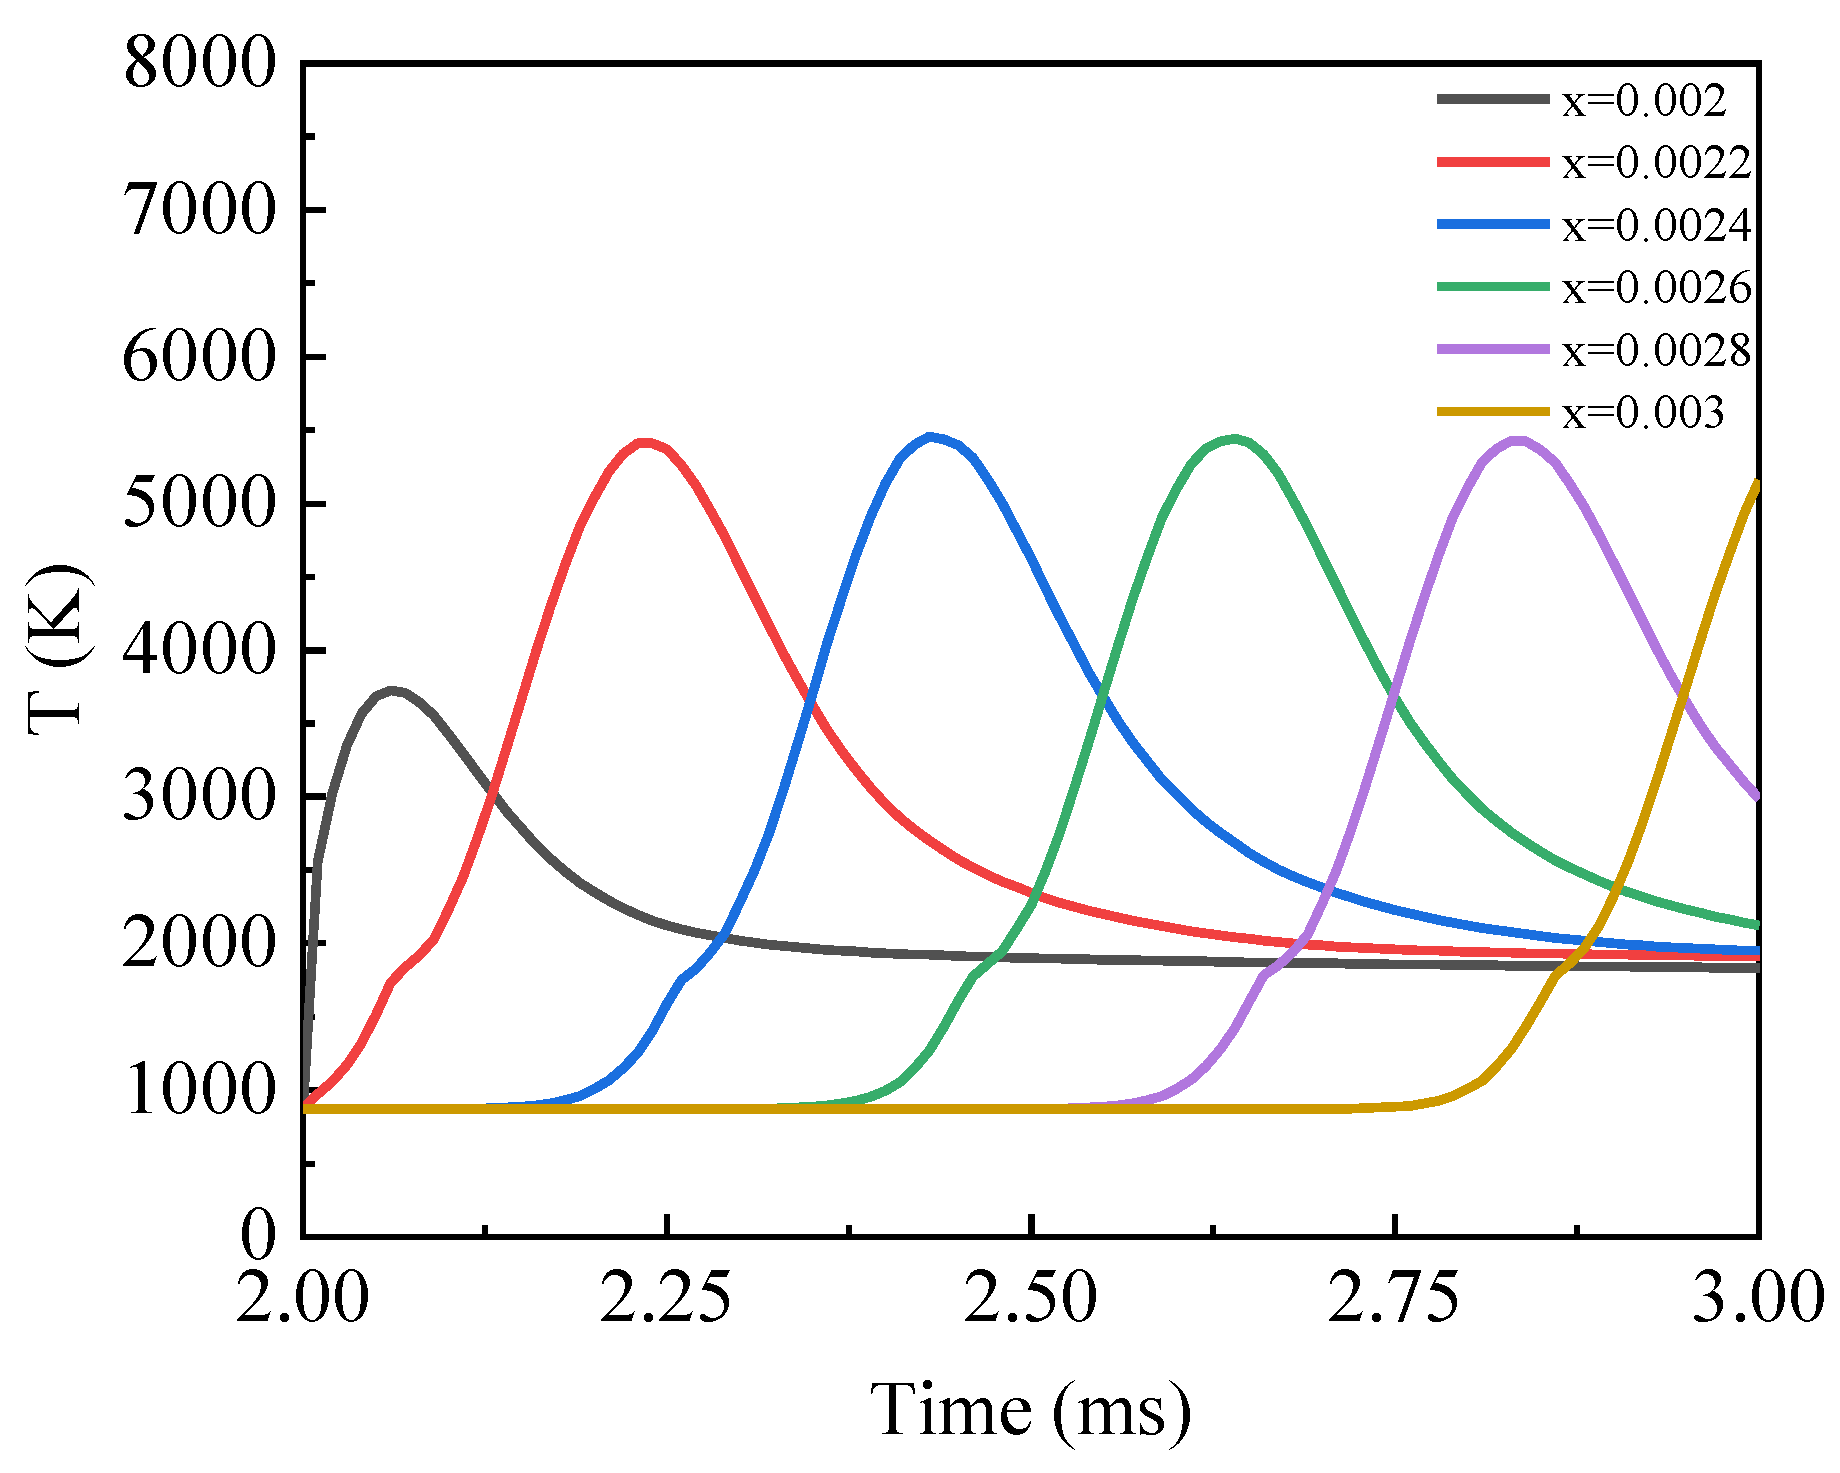
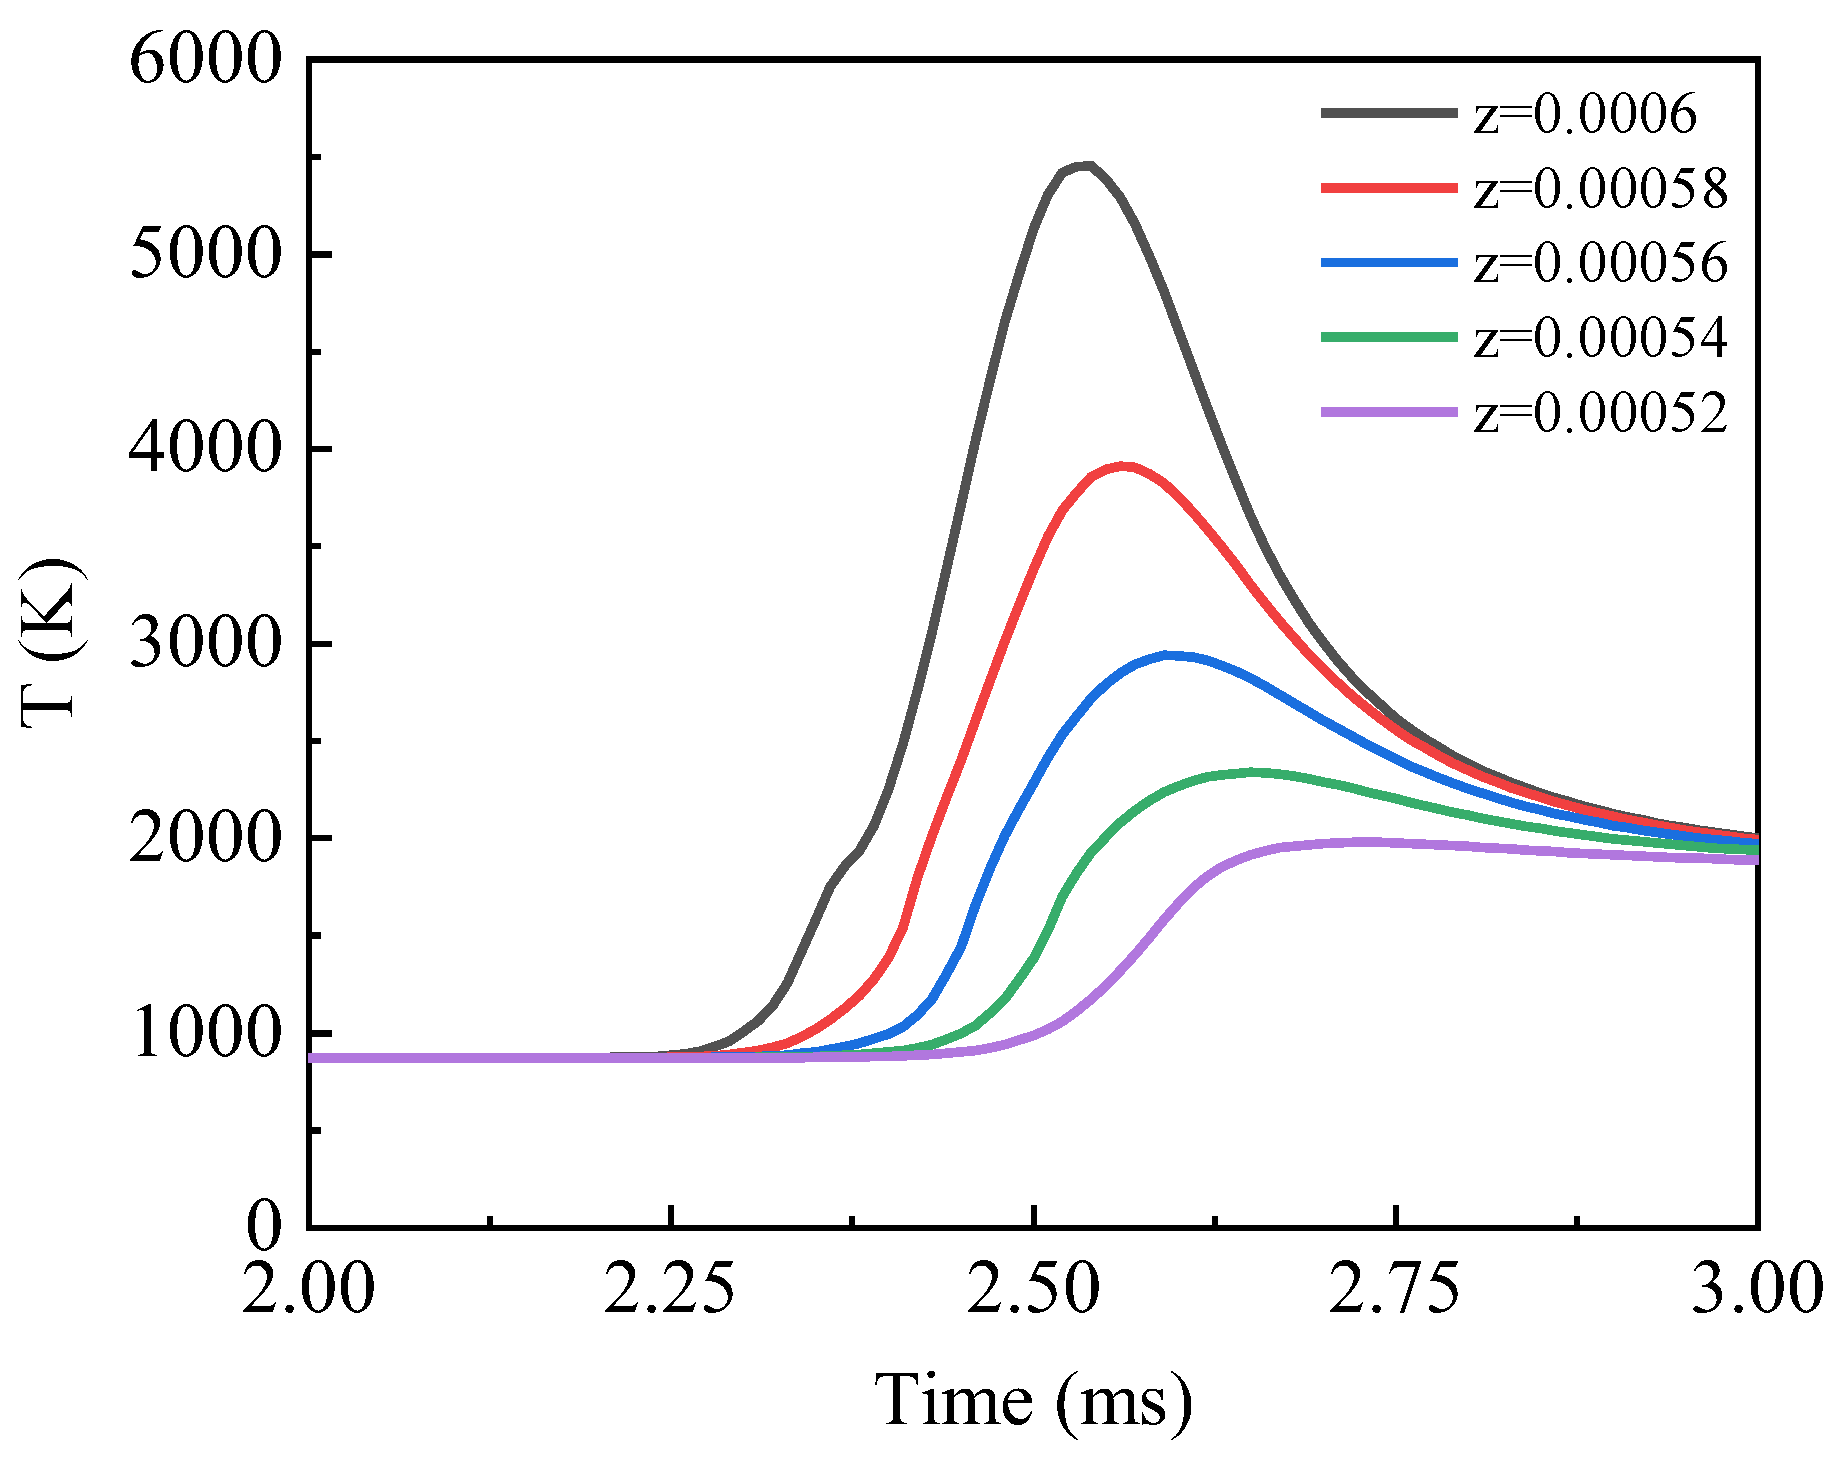
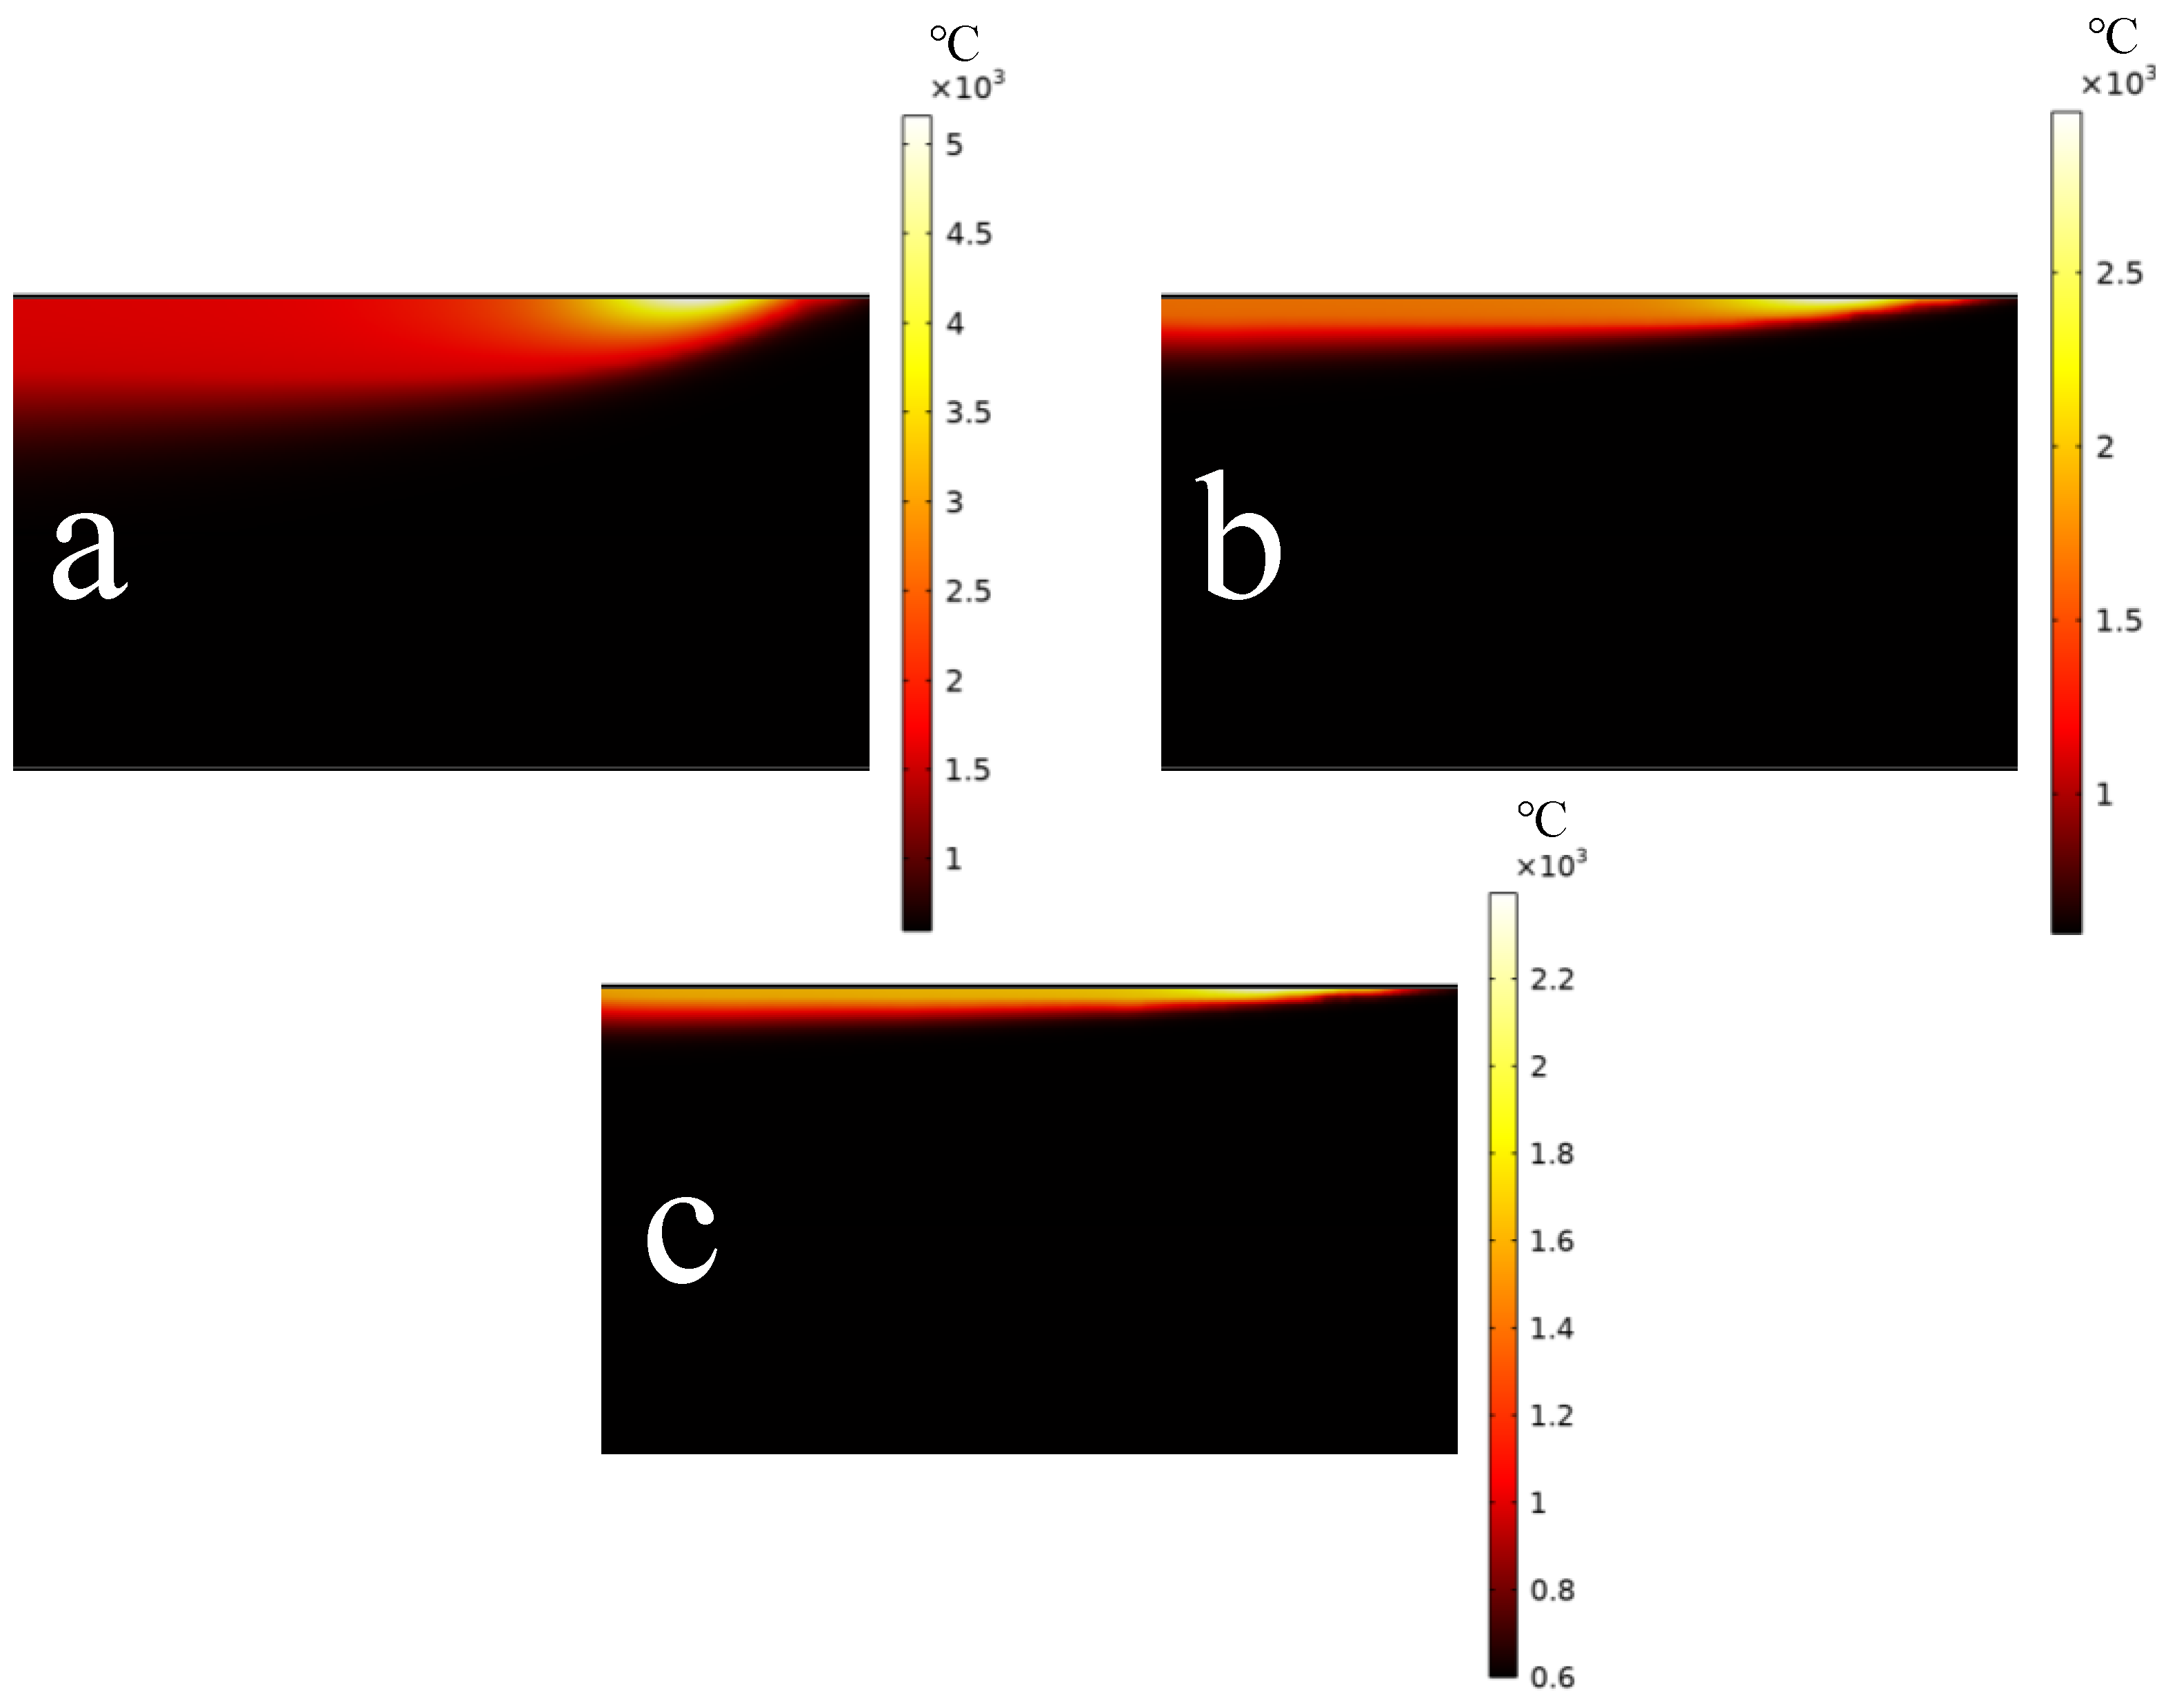
The electron beam heating process is intense, while the subsequent cooling after scanning is slow, leading to a slow formation of the melt pool from top to bottom. Moreover, with an increase in scanning speed, the solid–liquid boundary in front of the molten pool becomes shallower.
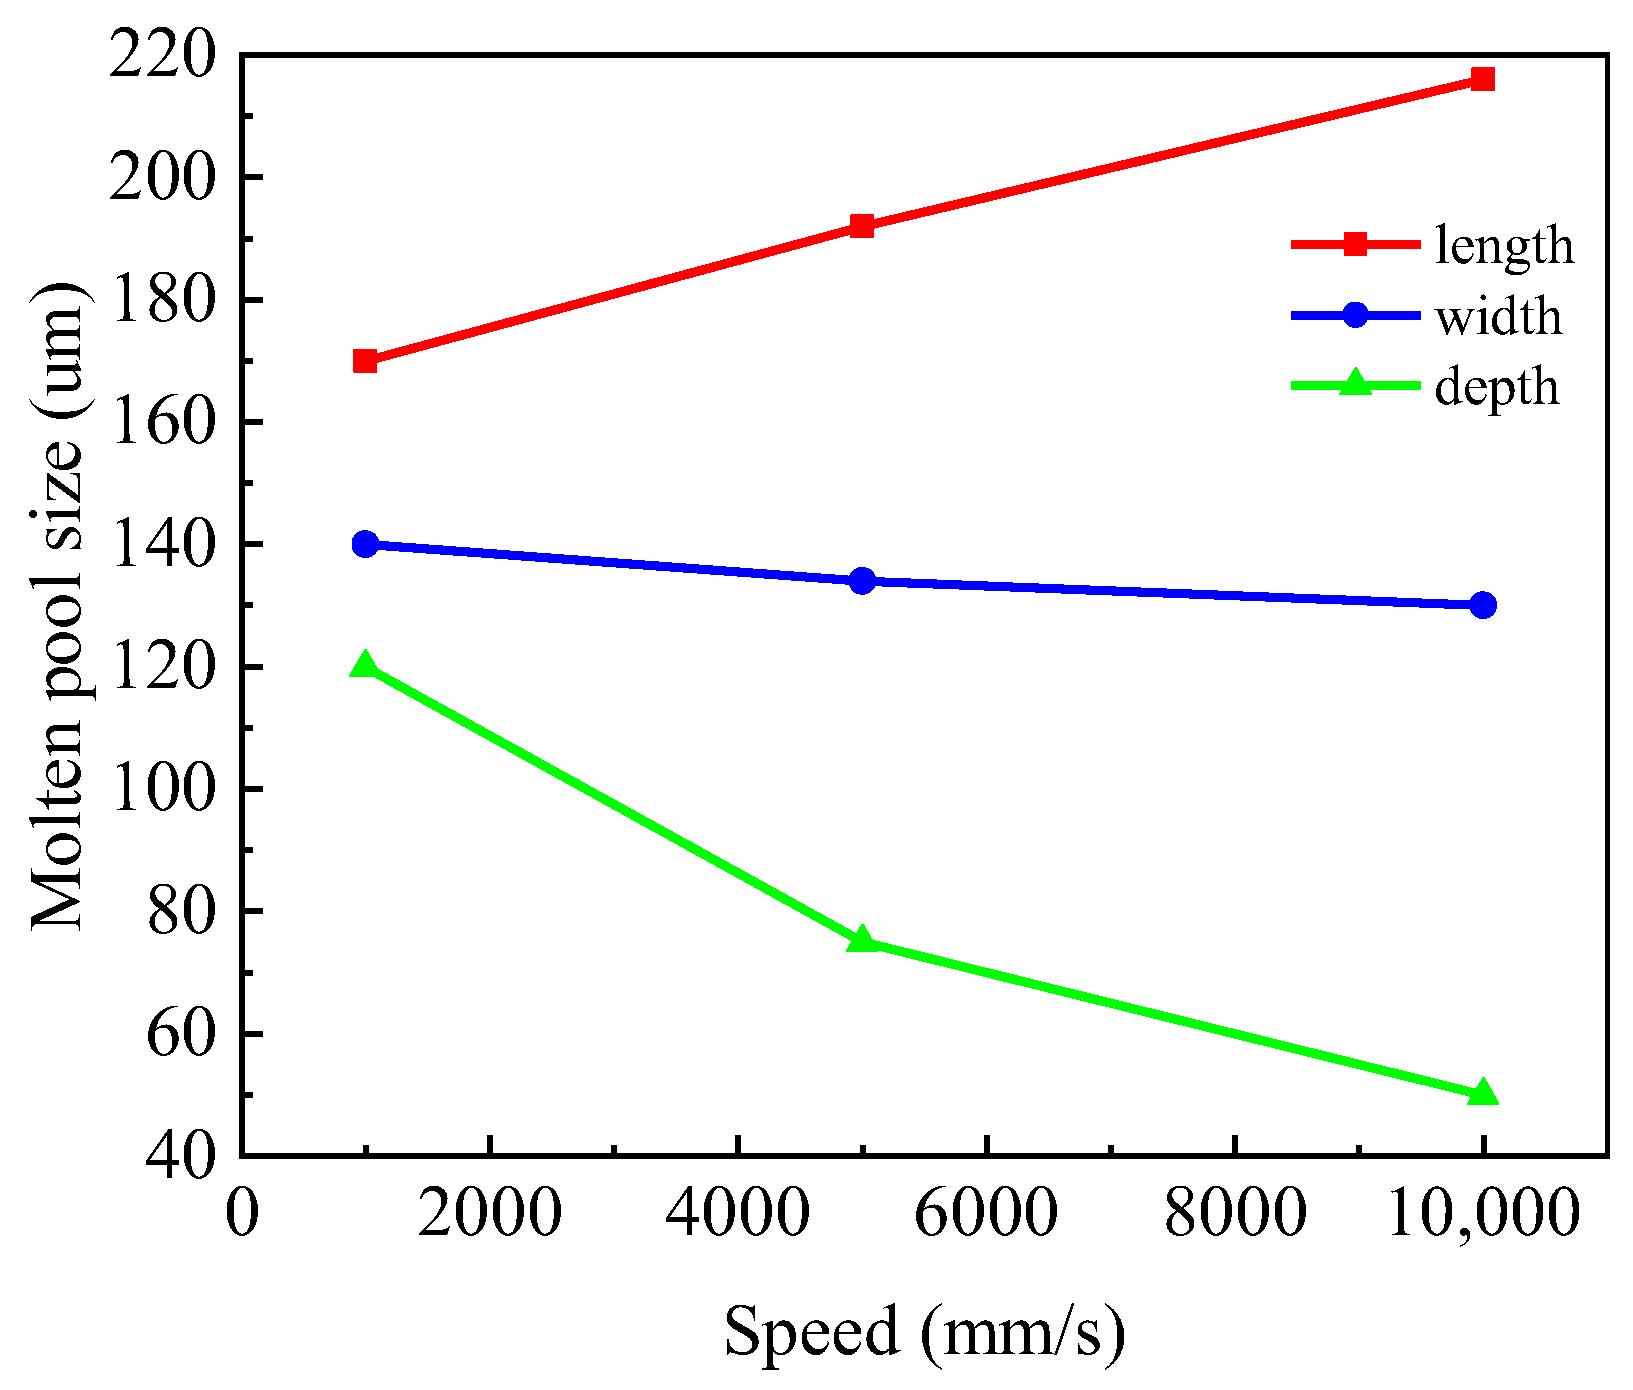
(2)
The size of the micro-molten pool changes with the variation in electron beam scanning speed. The length of the molten pool increases with the increase in scanning speed, while the width and depth decrease with the speed. The scanning speed has a significant impact on the length and depth of the micro-molten pool but a relatively minor effect on the width.
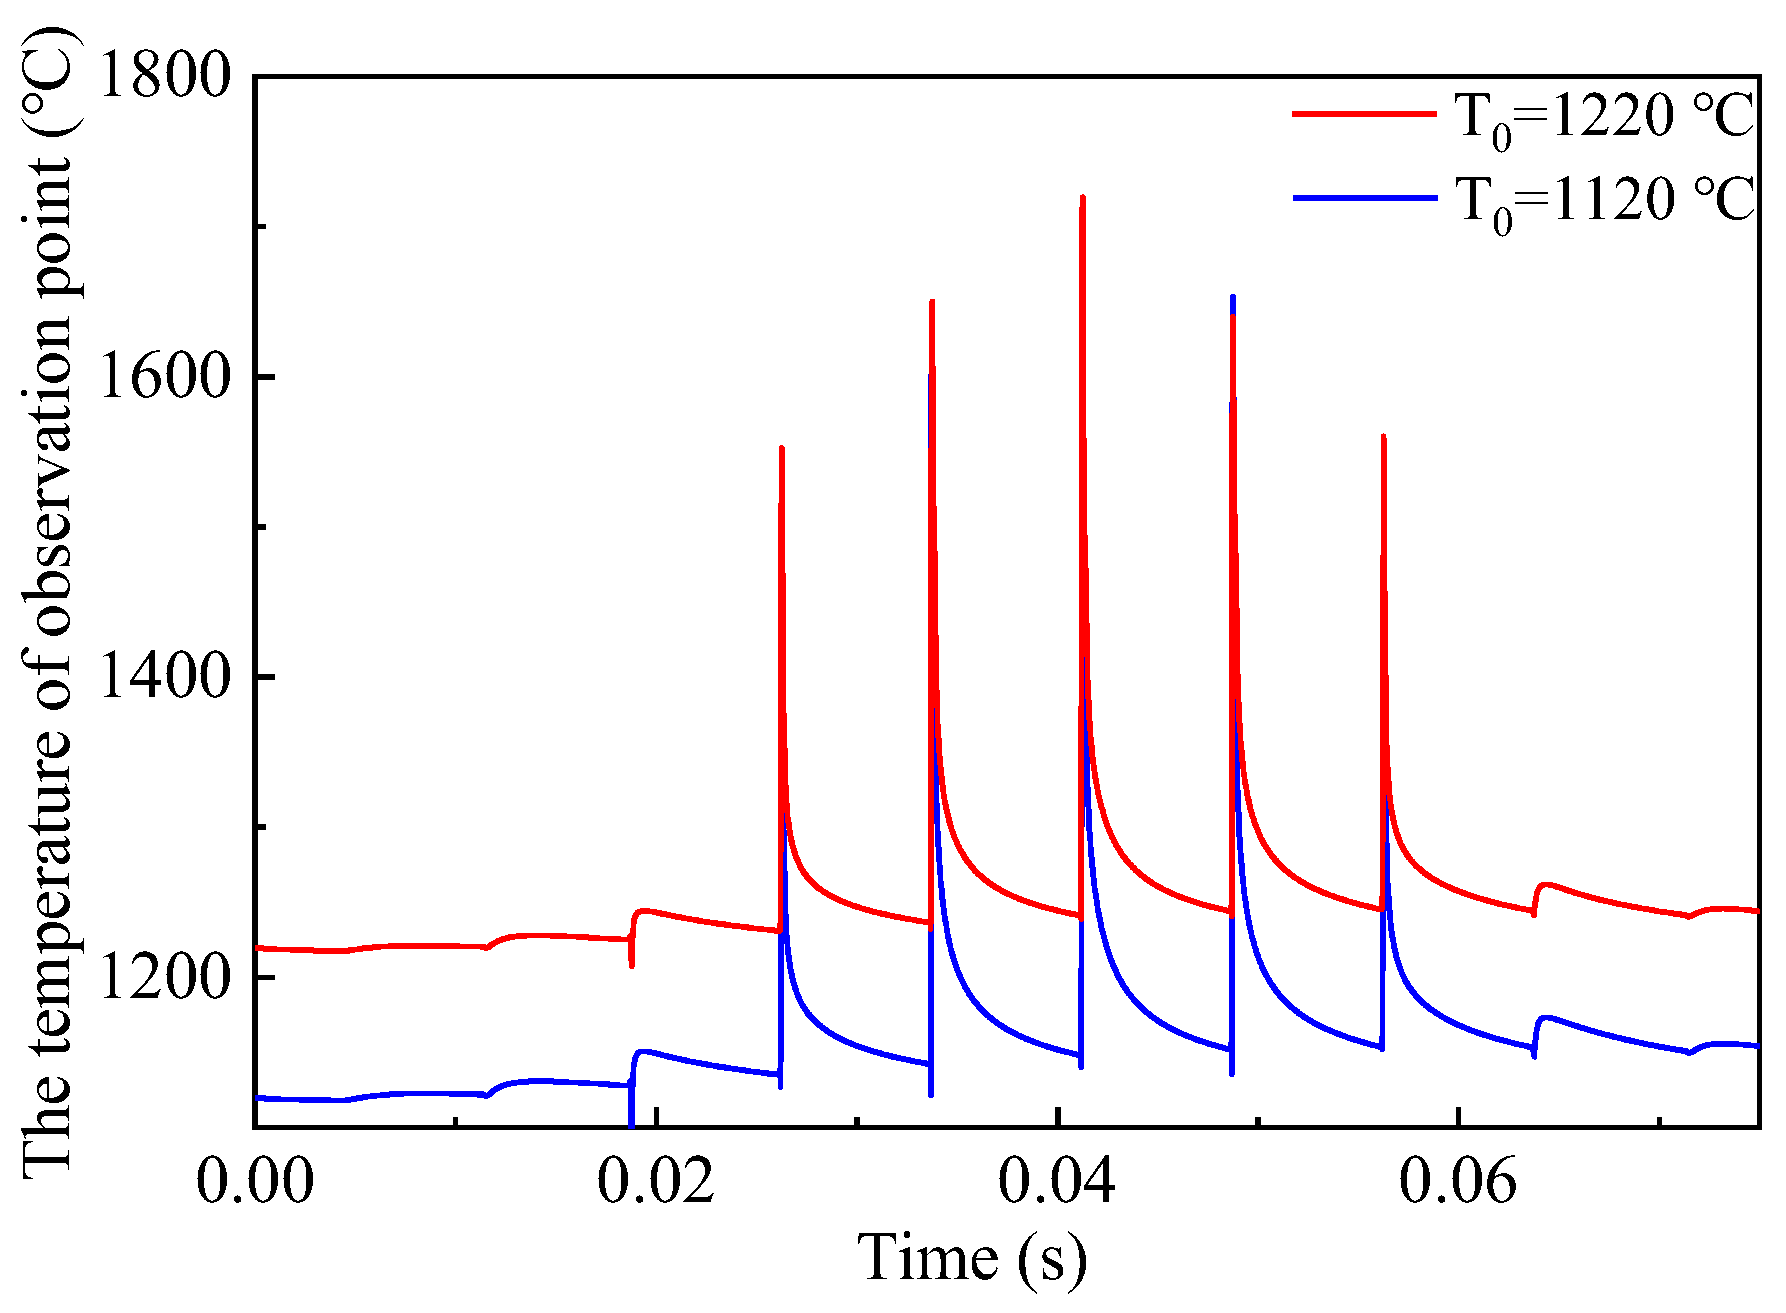
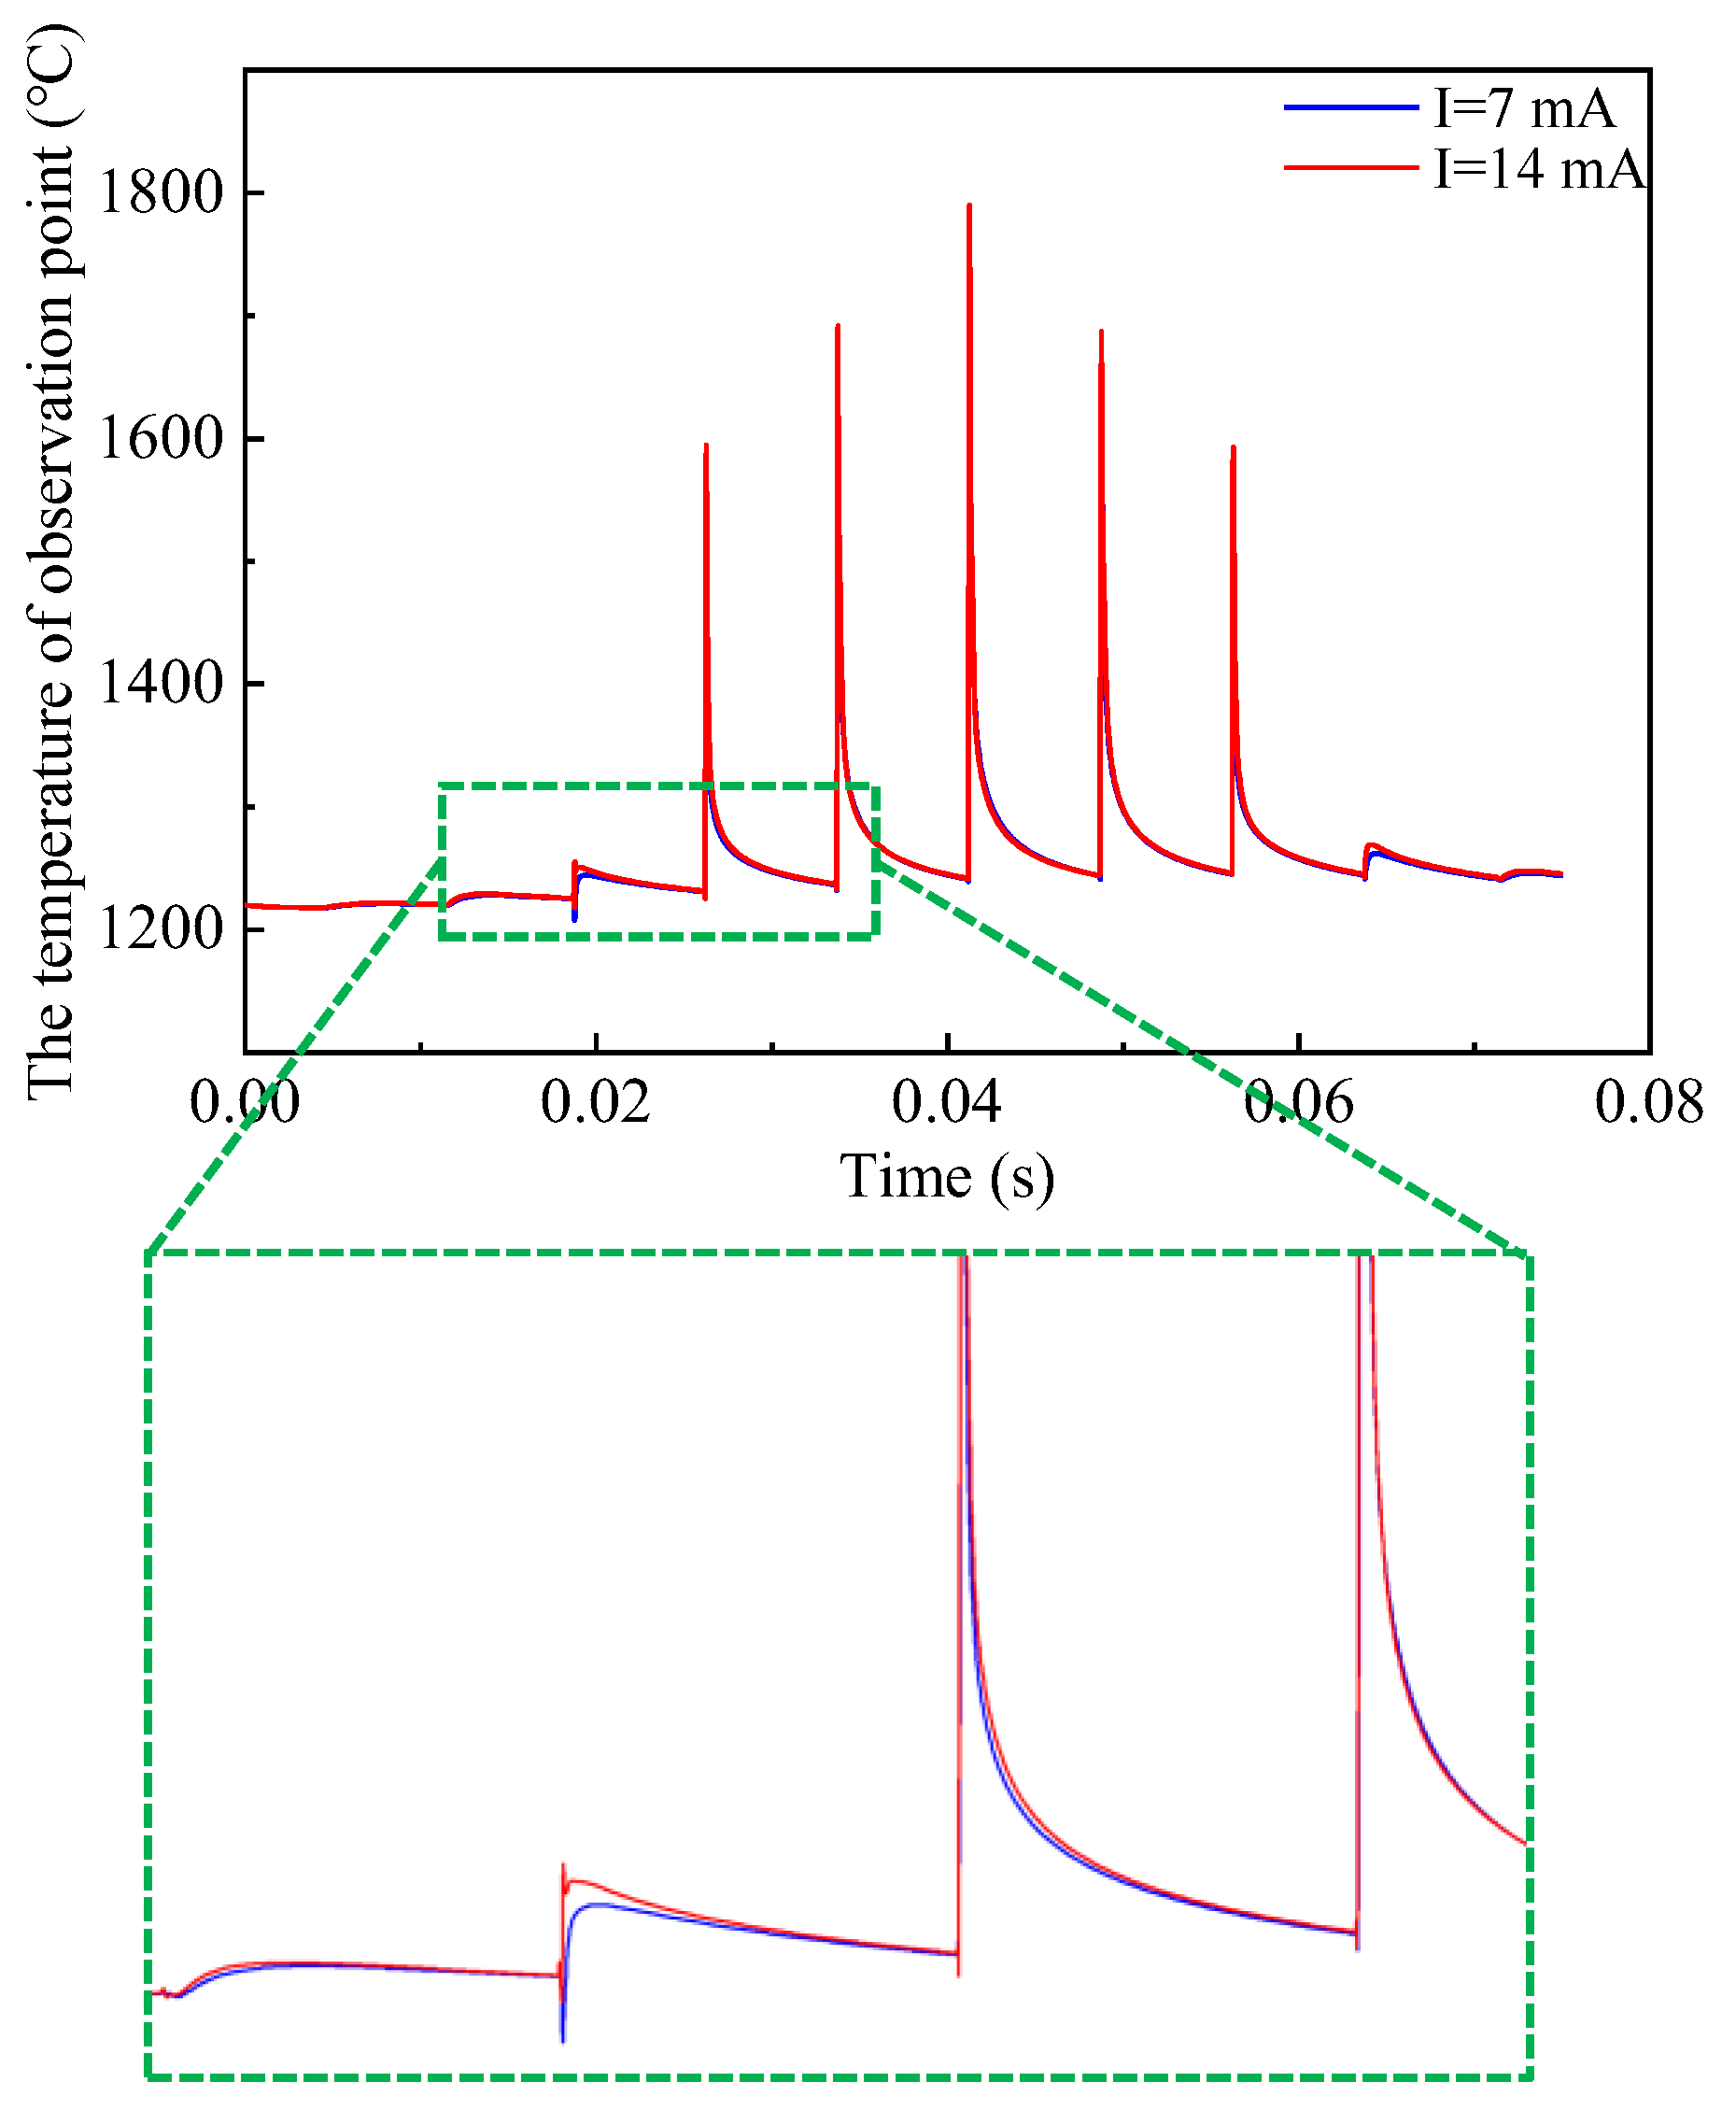
(3)
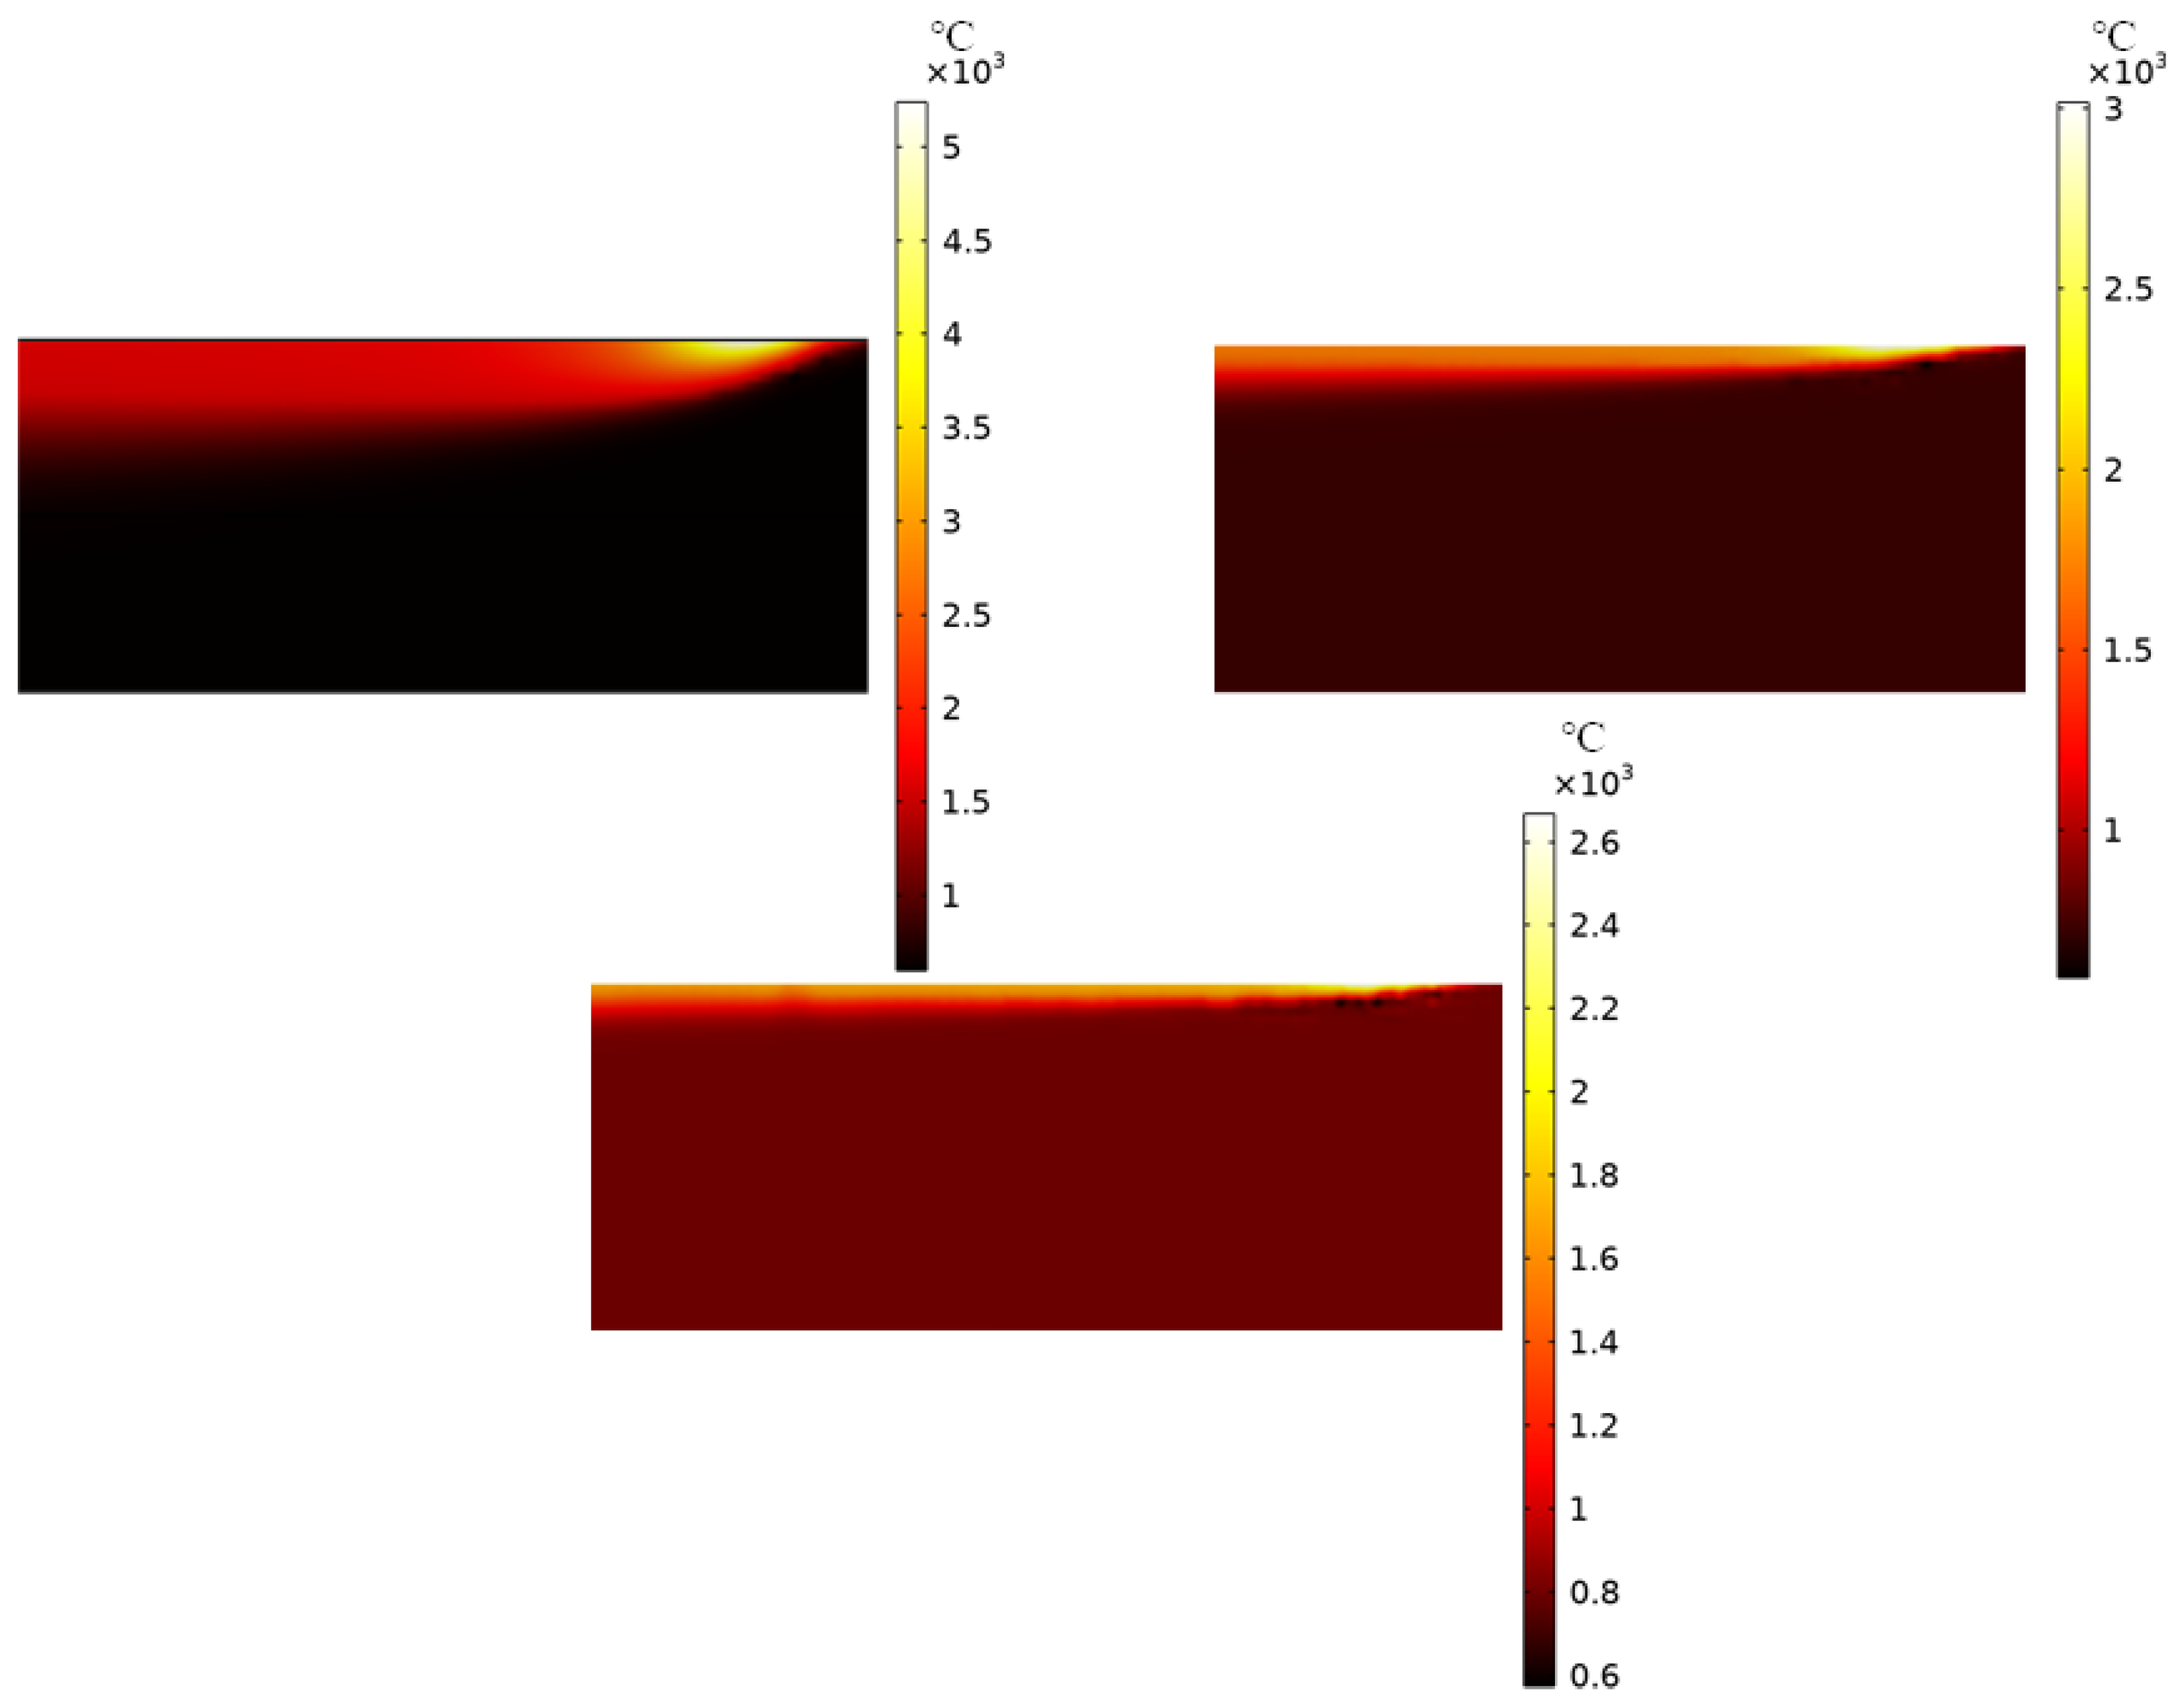
The magnitude of the scanning electron beam current does not have a significant impact on the temperature of the melting process and therefore does not have a significant impact on the bonding rate of the samples. However, changing the initial temperature directly affects the size of the melting temperature. Therefore, the final temperature of the preheating process needs to be strictly controlled to ensure the quality of the formed products.
This work demonstrates the temperature field and melt pool changes of high Nb-TiAl electron beam selective melting on a single scan line and multi-scan lines. The results indicate that the speed of the scan significantly affects the formation and evolution of the melt pool under the single scan line. And in the process of multi-scan line scanning, the initial temperature will have a greater impact on the entire temperature field. These findings provide important clues for optimizing process parameters and controlling the morphology and size of the melt pool. This research is of great significance for advancing the development and application of additive manufacturing technology, offering new insights and breakthroughs for related research and practices.

Author Contributions

Conceptualization, Z.A.; Methodology, Z.A.; Software, B.W.; Validation, B.W.; Formal analysis, Z.A.; Investigation, B.W.; Data curation, M.Y.; Writing—original draft, B.W.; Writing—review and editing, M.Y. and B.W.; Funding acquisition, Z.A. All authors have read and agreed to the published version of the manuscript.

Funding

This research was supported by the foundation of National Key Laboratory of Science and Technology on Plasma Dynamic under Grant No. 6142202210207.

Data Availability Statement

The data presented in this study are available on request from the corresponding author. The data are not publicly available because the data also form part of an ongoing study.

Conflicts of Interest

The authors declare no conflicts of interest.

References

  1. Zhou, L.-F.; Miller, J.; Vezza, J.; Mayster, M.; Raffay, M.; Justice, Q.; Al Tamimi, Z.; Hansotte, G.; Sunkara, L.-D.; Bernat, J. Additive manufacturing: A comprehensive review. Sensors 2024, 24, 2668. [Google Scholar] [CrossRef]
  2. Bhavar, V.; Kattire, P.; Patil, V.; Khot, S.; Singh, R. A review on powder bed fusion technology of metal additive manufacturing. In Proceedings of the 4th International Conference and Exhibition on Additive Manufacturing Technologies-AM-2014, Banglore, India, 1–2 September 2014. [Google Scholar]
  3. Zhang, L.-C.; Liu, Y.-J.; Li, S.-J.; Hao, Y.-L. Additive manufacturing of titanium alloys by electron beam melting: A review. Adv. Eng. Mater. 2018, 20, 1700842. [Google Scholar] [CrossRef]
  4. ZähS, M.-F.; Lutzmann, S. Modelling and simulation of electron beam melting. Prod. Eng. Res. Dev. 2010, 4, 8. [Google Scholar]
  5. Körner, C. Additive manufacturing of metallic components by selective electron beam melting—A review. Int. Mater. Rev. 2016, 61, 361–377. [Google Scholar] [CrossRef]
  6. Tian, W.-Q.; Yang, D.-Y.; Li, J.-X. Research progress on Ti-Al alloy prepared by high-energy beam additive manufacturing technique. Mater. Mech. Eng. 2021, 45, 1–7. [Google Scholar]
  7. Chen, D.-L.; Chen, W.; Liu, Y.-F.; Sun, D.-K. A two-relaxation-time lattice boltzmann model for electron beam selective melting additive manufacturing. Front. Mater. 2022, 9, 885481. [Google Scholar] [CrossRef]
  8. Fan, Y.-X.; Lin, Y.; Ao, Q.-B.; Wang, J.-Z. Research progress on additive manufactured Ti-6Al-4V lattice materials. Rare Met. Mater. Eng. 2023, 52, 3630–3639. [Google Scholar]
  9. Prabhakar, P.; Sames, W.; Dehoff, R.; Babu, S. Computational modeling of residual stress formation during the electron beam melting process for Inconel 718. Addit. Manuf. 2015, 7, 83–91. [Google Scholar] [CrossRef]
  10. Chen, Y.-Y.; Shi, G.-H.; Du, Z.-M.; Zhang, Y.; Chang, S. Research progess on additive manufacturing TiAl alloy. Acta Metall. Sin. 2023, 60, 1–15. [Google Scholar]
  11. Yang, X.; Wang, F.-H.; Gu, W.-P.; Lai, Y.-K.; Sun, C.-H.; Liu, S.-F.; Tang, H.-P. Research status of numerical simulation of electron beam selective melting thermal behavior. Rare Met. Mater. Eng. 2023, 52, 2278–2286. [Google Scholar]
  12. Liang, X.-Y.; Zhang, L.; Lin, F. Research progress of TiAl intermetallic fabricated by electron beam powder bed fusion. J. Netshape Form. Eng. 2022, 14, 81–97. [Google Scholar]
  13. Lee, Y.-S.; Kirka, M.-M.; Ferguson, J.; Paquit, V.-C. Correlations of cracking with scan strategy and build geometry in electron beam powder bed additive manufacturing. Addit. Manuf. 2020, 32, 101031. [Google Scholar] [CrossRef]
  14. Liu, Y.-J.; Li, S.-J.; Wang, H.-L.; Hou, W.-T.; Hao, Y.-L.; Yang, R.; Sercombe, T.-B.; Zhang, L.-C. Microstructure, defects and mechanical behavior of beta-type titanium porous structures manufactured by electron beam melting and selective laser melting. Acta Mater. 2016, 113, 56–67. [Google Scholar] [CrossRef]
  15. Zhang, Y.; Li, Y.; Song, M.-H.; Li, Y.C.; Gong, S.-L.; Zhang, B. TiAl alloy fabricated using election beam selective melting: Process, nicrostructure, and tensile performance. Metals 2024, 14, 482. [Google Scholar] [CrossRef]
  16. Gu, D.-D.; Zhang, H.-M.; Chen, H.-Y.; Zhang, H.; Xi, L.-X. Laser additive manufacturing of high-performance metallic aerospace components. Chin. J. Lasers 2020, 47, 32–55. [Google Scholar]
  17. Wang, D.; Ou, Y.-H.; Dou, W.-H.; Yang, Y.-Q.; Tan, C.-L. Research progress on spatter behavior in laser powder bed fusion. Chin. J. Lasers 2020, 47, 9–23. [Google Scholar]
  18. Shi, Y.-L.; Wang, Z.; Sang, X.-H.; Yang, B.; Xu, H.-Y.; Yang, G.; Gong, S.-L.; Qi, B.-J. Review on smoking mechanism and factor analysis during selective electron beam melting process. Aeronaut. Manuf. Technol. 2023, 66, 50–59. [Google Scholar]
  19. Gong, D.-L.; Bian, H.-K.; Pan, D.; Chen, S.-H.; Yang, X.; Tang, H.-P. Research advances in powder bed fusion additive manufacturing AlSi10Mg alloy. Trans. Nonferrous Met. Soc. China 2024, 34, 1091–1112. [Google Scholar]
  20. Scharowsky, T.; Bauereiss, A.; Körner, C. Influence of the hatching strategy on consolidation during selective electron beam melting of Ti-6Al-4V. Int. J. Adv. Manuf. Technol. 2017, 92, 2809–2818. [Google Scholar] [CrossRef]
  21. Yue, H.-Y.; Peng, H.; Li, R.-F.; Su, Y.-J.; Zhao, Y.; Qi, K.; Chen, Y.-Y. Selective electron beam melting of TiAl alloy: Metallurgical defects, tensile property, and determination of process window. Adv. Eng. Mater. 2020, 22, 2000194. [Google Scholar] [CrossRef]
  22. Yang, J.-X.; Chen, T.; Huang, Y.-J.; Li, H.-G.; Guo, C.; Sun, J.-F. Diverse microstructure of Ti6.5Al2Zr1Mo1V fabricated via electron beam selective melting. Mater. Lett. 2021, 304, 130597. [Google Scholar] [CrossRef]
  23. Yan, W.-T.; Smith, J.; Ge, W.-J.; Lin, F.; Liu, W.-K. Multiscale modeling of electron beam and substrate interaction: A new heat source model. Comput. Mech. 2015, 56, 265–276. [Google Scholar] [CrossRef]
  24. Gusarov, A.-V.; Yadroitsev, I.; Smurov, I.; Bertrand, P. Heat transfer modelling and stability analysis of selective laser melting. Appl. Surf. Sci. 2007, 254, 975–979. [Google Scholar] [CrossRef]
  25. Grange, D.; Bartout, J.-D.; Macquaire, B.; Colin, C. Processing a non-weldable nickel-base superalloy by Selective Laser Melting: Role of the shape and size of the melt pools on solidification cracking. Materialia 2020, 12, 12. [Google Scholar] [CrossRef]
  26. Galati, M.; Iuliano, L.; Salmi, A.; Atzeni, E. Modelling energy source and powder properties for the development of a thermal FE model of the EBM additive manufacturing process. Addit. Manuf. 2017, 14, 49–59. [Google Scholar] [CrossRef]
  27. Christoph, B.; Jonas, B.; Matthias, M.; Carolin, K. High-throughput numerical investigation of process parameter-melt pool relationships in electron beam powder bed fusion. Modelling 2023, 4, 336–350. [Google Scholar] [CrossRef]
  28. Chen, D.-J.; Li, G.; Wang, P.; Zeng, Z.-Q.; Tang, Y.-H. Numerical simulation of melt pool size and flow evolution for laser powder bed fusion of powder grade Ti6Al4V. Finite Elem. Anal. Des. 2023, 223, 103971. [Google Scholar] [CrossRef]
  29. Basak, A.; Das, S. Epitaxy and microstructure evolution in metal additive manufacturing. Annu. Rev. Mater. Res. 2016, 46, 125–149. [Google Scholar] [CrossRef]
  30. Tang, H.-P.; Yang, G.-Y.; Jia, W.-P.; He, W.-W.; Lu, S.-L.; Qian, M. Additive manufacturing of a high niobium-containing titanium aluminide alloy by selective electron beam melting. Mater. Sci. Eng. A 2015, 636, 103–107. [Google Scholar] [CrossRef]
  31. Kan, W.; Chen, B.; Jin, C.; Peng, H.; Lin, J. Microstructure and mechanical properties of a high Nb-TiAl alloy fabricated by electron beam melting. Mater. Des. 2018, 160, 611–623. [Google Scholar] [CrossRef]
  32. Nastac, L. Solute redistribution, liquid/solid interface instability, and initial transient regions during the unidirectional solidification of Ti-6-4 and Ti-17 alloys. In Proceedings of the TMS Annual Meeting & Exhibition; Symposium on CFD Modeling and Simulation in Materials Processing, Orlando, FL, USA, 11–15 March 2012. [Google Scholar]
  33. Dai, D.-H.; Gu, D.-D. Thermal behavior and densification mechanism during selective laser melting of copper matrix composites: Simulation and experiments. Mater. Des. 2014, 55, 482–491. [Google Scholar] [CrossRef]
  34. Yan, K.; Gao, Z.-J.; Gao, L.; Zhang, J.-B.; Zhang, W.-Q.; Chen, X.-F.; Yang, Y. Research progress of electron beam selective melting additive manufacturing metal materials. Hot Work Technol. 2024, 53, 7–13. [Google Scholar]
  35. Zhang, W.-B.; Chen, W.; Chen, D.-L.; Wang, J.; Sun, D.-K. Muti-scale numerical simulation of molten pool evolution for electron beam selective melting. Trans. Nonferrous Met. Soc. China 2023, 33, 1413–1424. [Google Scholar]
  36. Ma, B.-X. Simulation of Electron beam Selective Melting Forming and Thermal Interaction Based on TC4. Master’s Thesis, Guilin University of Electronic Technology, Guilin, China, 2023. [Google Scholar]
Figure 1. Physical property parameters of Ti-45Al-8Nb alloy at different temperatures: Density ρ, Thermal conductivity k and Specific heat capacity C p .
Mathematics 12 02238 g001
Figure 2. Phase change function α(T).
Mathematics 12 02238 g002
Figure 3. Geometry of the single scanning line model.
Mathematics 12 02238 g003
Figure 4. Meshing of the single scanning line model.
Mathematics 12 02238 g004
Figure 5. Geometry of the multi-scanning line model.
Mathematics 12 02238 g005
Figure 6. Meshing of the multi-scanning line model.
Mathematics 12 02238 g006
Figure 7. Coarser grid model.
Mathematics 12 02238 g007
Figure 8. The temperature field and pool morphology of the surface and cross-section of the powder bed.
Mathematics 12 02238 g008
Figure 9. Pool shape at different speeds (a) 1000 mm/s; (b) 5000 mm/s; (c) 10,000 mm/s.
Mathematics 12 02238 g009
Figure 10. Surface image of the melt pool on the coarse gird.
Mathematics 12 02238 g010
Figure 11. Changes in temperature at the upper boundary of the symmetrical plane x = 0.002, x = 0.0022, x = 0.0024, x = 0.0026, x = 0.0028, x = 0.003.
Mathematics 12 02238 g011
Figure 12. The change of temperature of the symmetrical surface at x = 0.0025, y = 0; z = 0.0006, z = 0.00058, z = 0.00056, z = 0.00054, z = 0.00052.
Mathematics 12 02238 g012
Figure 13. The local temperature field distribution map of the symmetrical cross-section at different speeds (a) 1000 mm/s; (b) 5000 mm/s; (c) 10,000 mm/s.
Mathematics 12 02238 g013
Figure 14. Cross-sectional image of the melt pool on the coarse grid.
Mathematics 12 02238 g014
Figure 15. The size of the bath varies with the scanning rate.
Mathematics 12 02238 g015
Figure 16. Temperature change curve of the central observation point.
Mathematics 12 02238 g016
Figure 17. Temperature change curve of different initial temperature scanning processes.
Mathematics 12 02238 g017
Figure 18. Temperature change curve of different electron beam current scanning processes.
Mathematics 12 02238 g018
Figure 19. Scanning line chart during melting.
Mathematics 12 02238 g019
Table 1. The value of the numerical coefficients required to implement the model.
ParametersValue
Stefan–Boltzmann constant σ e [W/m2K4]5.67 × 10−8
Thermal convection coefficient of the surface h C [W/(m2K)]80
Thermal radiation coefficient of the surface ε 0.36
Table 2. The single scanning line model size and simulation parameters [31].
Parameter NameNumerical ValueParameter Description
U60 kVElectron gun acceleration voltage
I1 mAElectron beam current
v1000 mm/sScanning speed
5000 mm/s
10,000 mm/s
L_beam100 umElectron beam spot diameter
A0.7Electron beam energy absorption rate
L5 mmModel length
D10.6 mmTotal model width
D20.3 mmWidth of the encrypted area of the grid
H10.3 mmTotal model height
H20.15 mmHeight of the encrypted area of the grid
T_change1550 °CPhase transition temperature
dT30 °CSolid–liquid two-phase temperature range
dH706 kJ/kgLatent heat of solidification
Table 3. The single scanning line model size and simulation parameters.
Parameter NameNumerical ValueParameter Description
U60kVElectron gun acceleration voltage
I7, 14, 20 mAElectron beam current
v4000 mm/sScanning speed
L_beam100 umElectron beam spot diameter
A0.7Electron beam energy absorption rate
L30 mmModel length
D13 mmTotal model width
D21 mmWidth of the encrypted area of the grid
H11 mmTotal model height
H20.5 mmHeight of the encrypted area of the grid
T01020, 1120, 1220 °CInitial temperature
T_pulse0.0125 sSingle scan line scan time
d_beam0.1 mmSpacing of adjacent scan lines
Disclaimer/Publisher’s Note: The statements, opinions and data contained in all publications are solely those of the individual author(s) and contributor(s) and not of MDPI and/or the editor(s). MDPI and/or the editor(s) disclaim responsibility for any injury to people or property resulting from any ideas, methods, instructions or products referred to in the content.

