

A Stock Optimization Problem in Finance: Understanding Financial and Economic Indicators through Analytical Predictive Modeling


Abstract
:1. Introduction
2. Materials and Methods
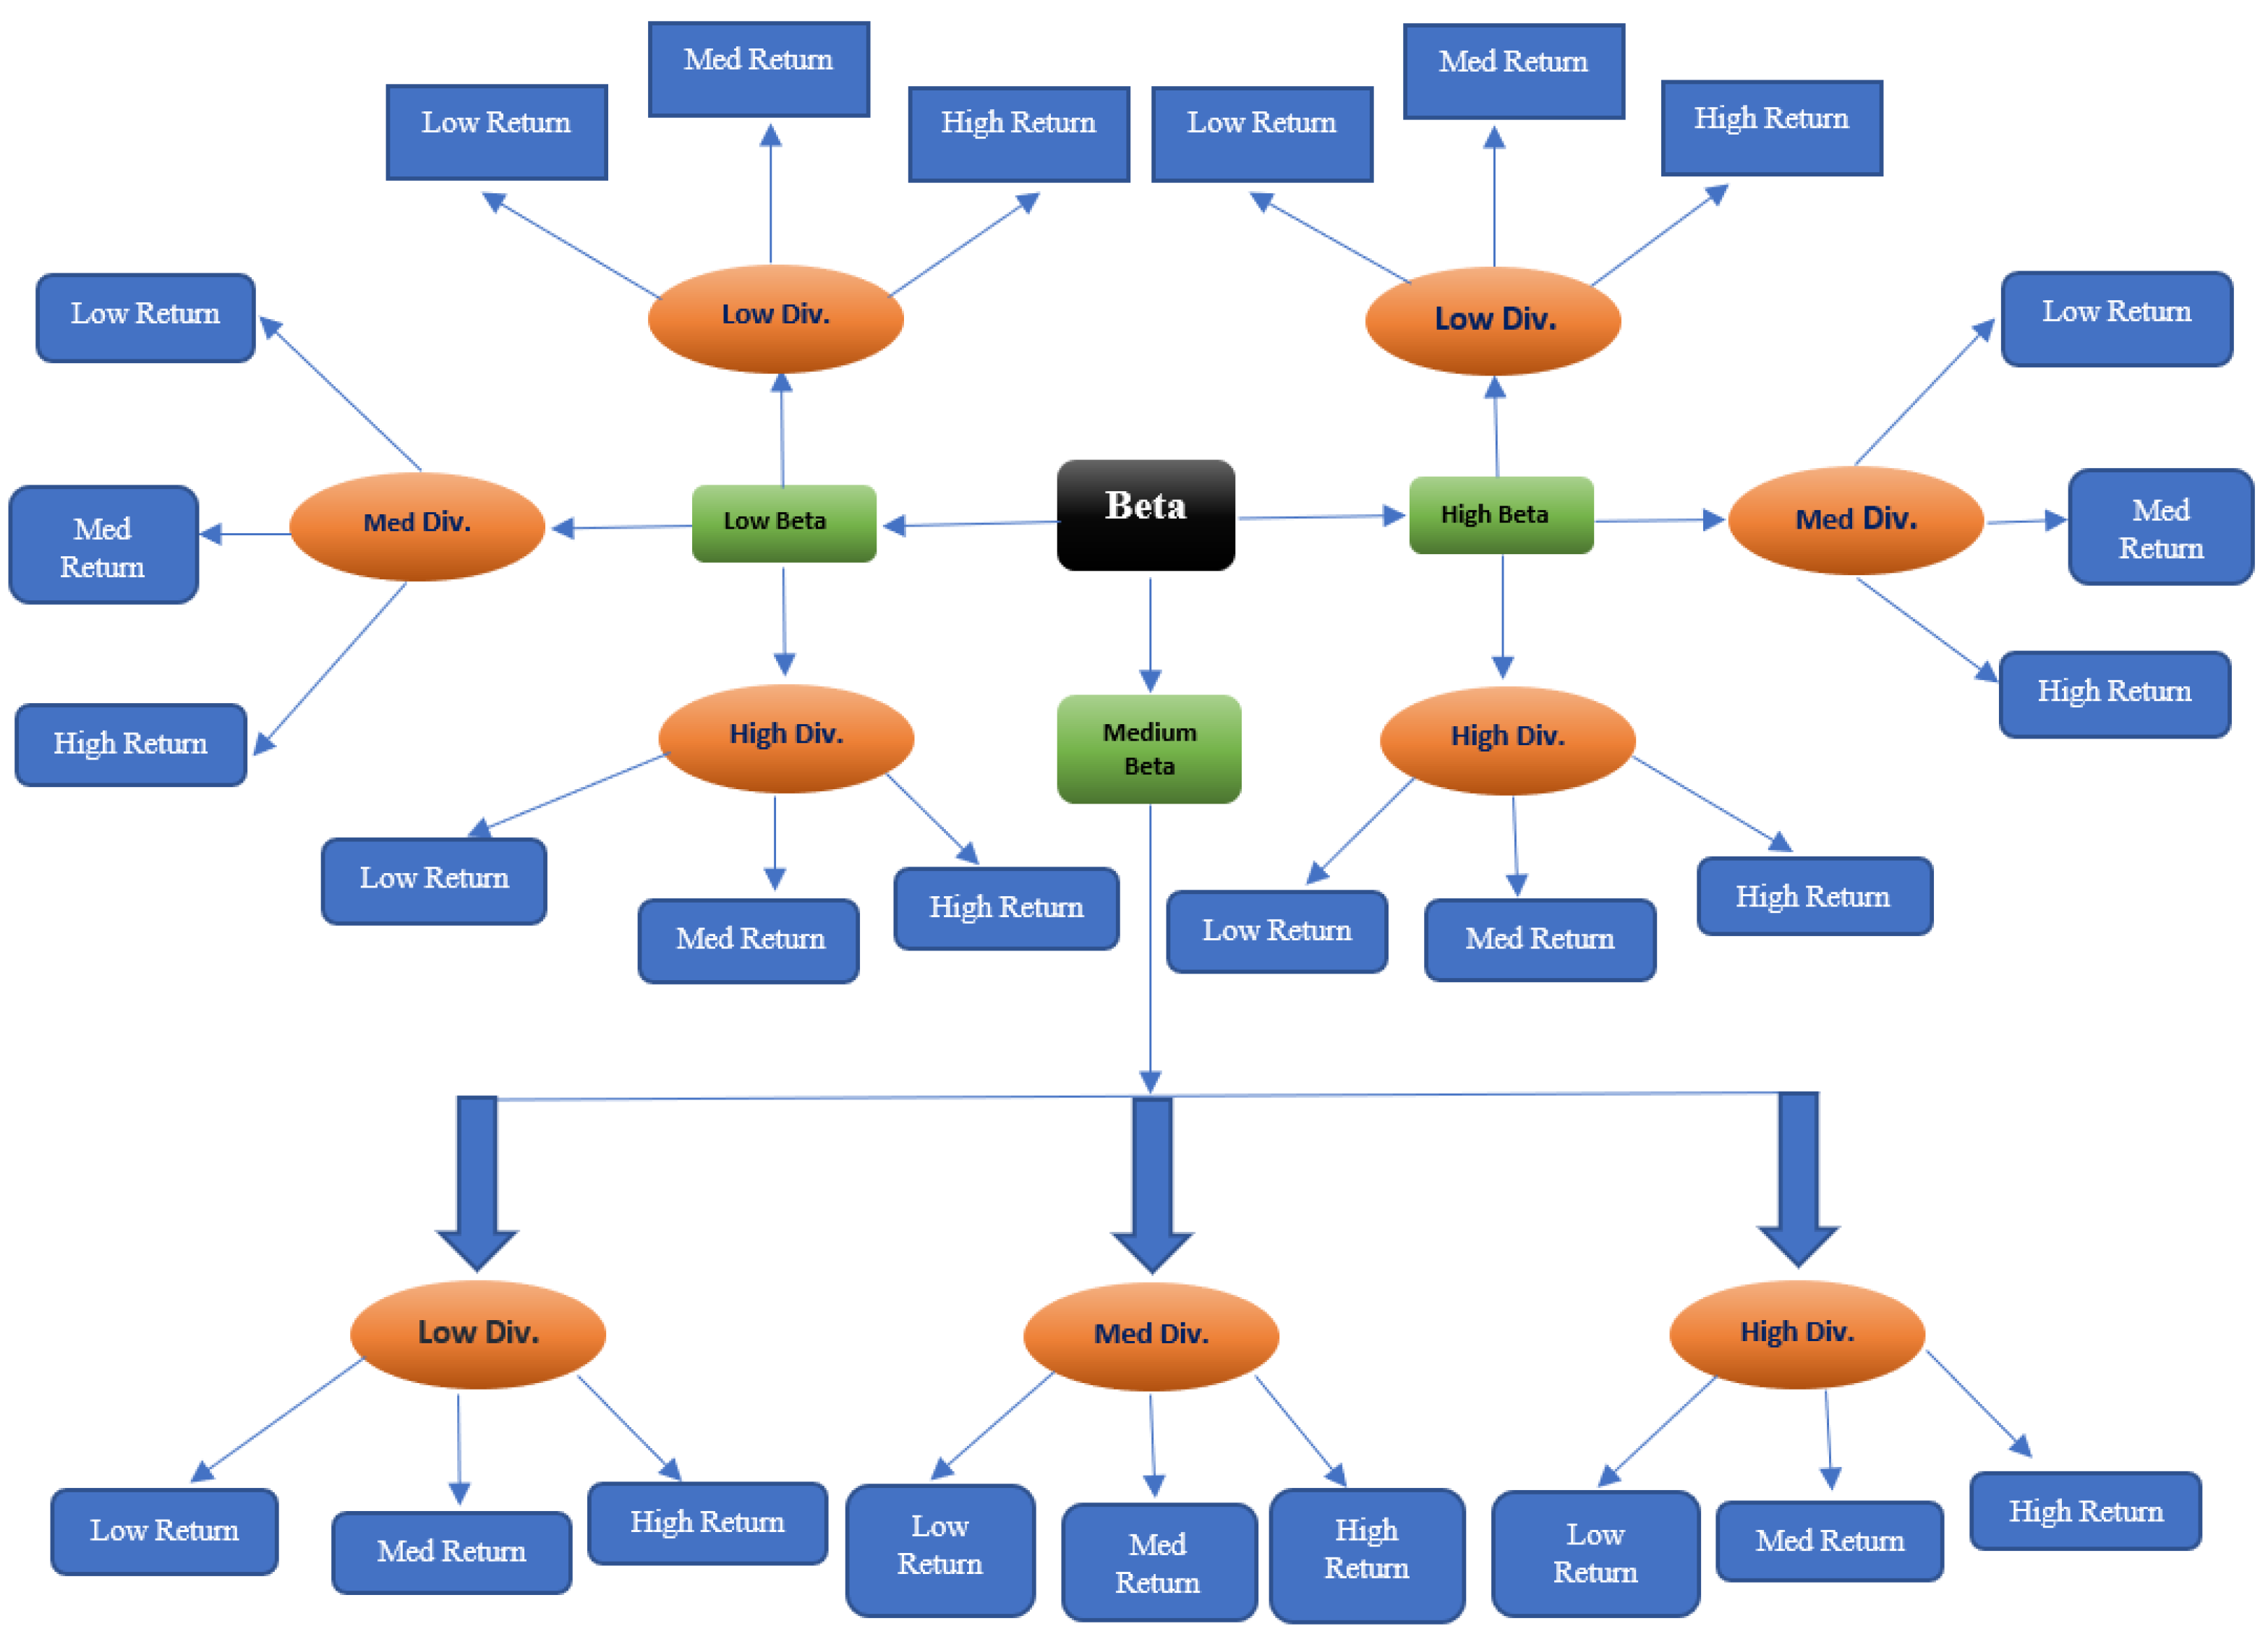
2.1. Selection of the Appropriate Stock
- Cluster the stocks into three groups (low, medium, and high) based on the risk factor beta.
- After we obtained the three clusters (high beta, medium beta, and low beta), each cluster was further grouped into three categories (low, medium, and high) based on the risk factor dividend yield.
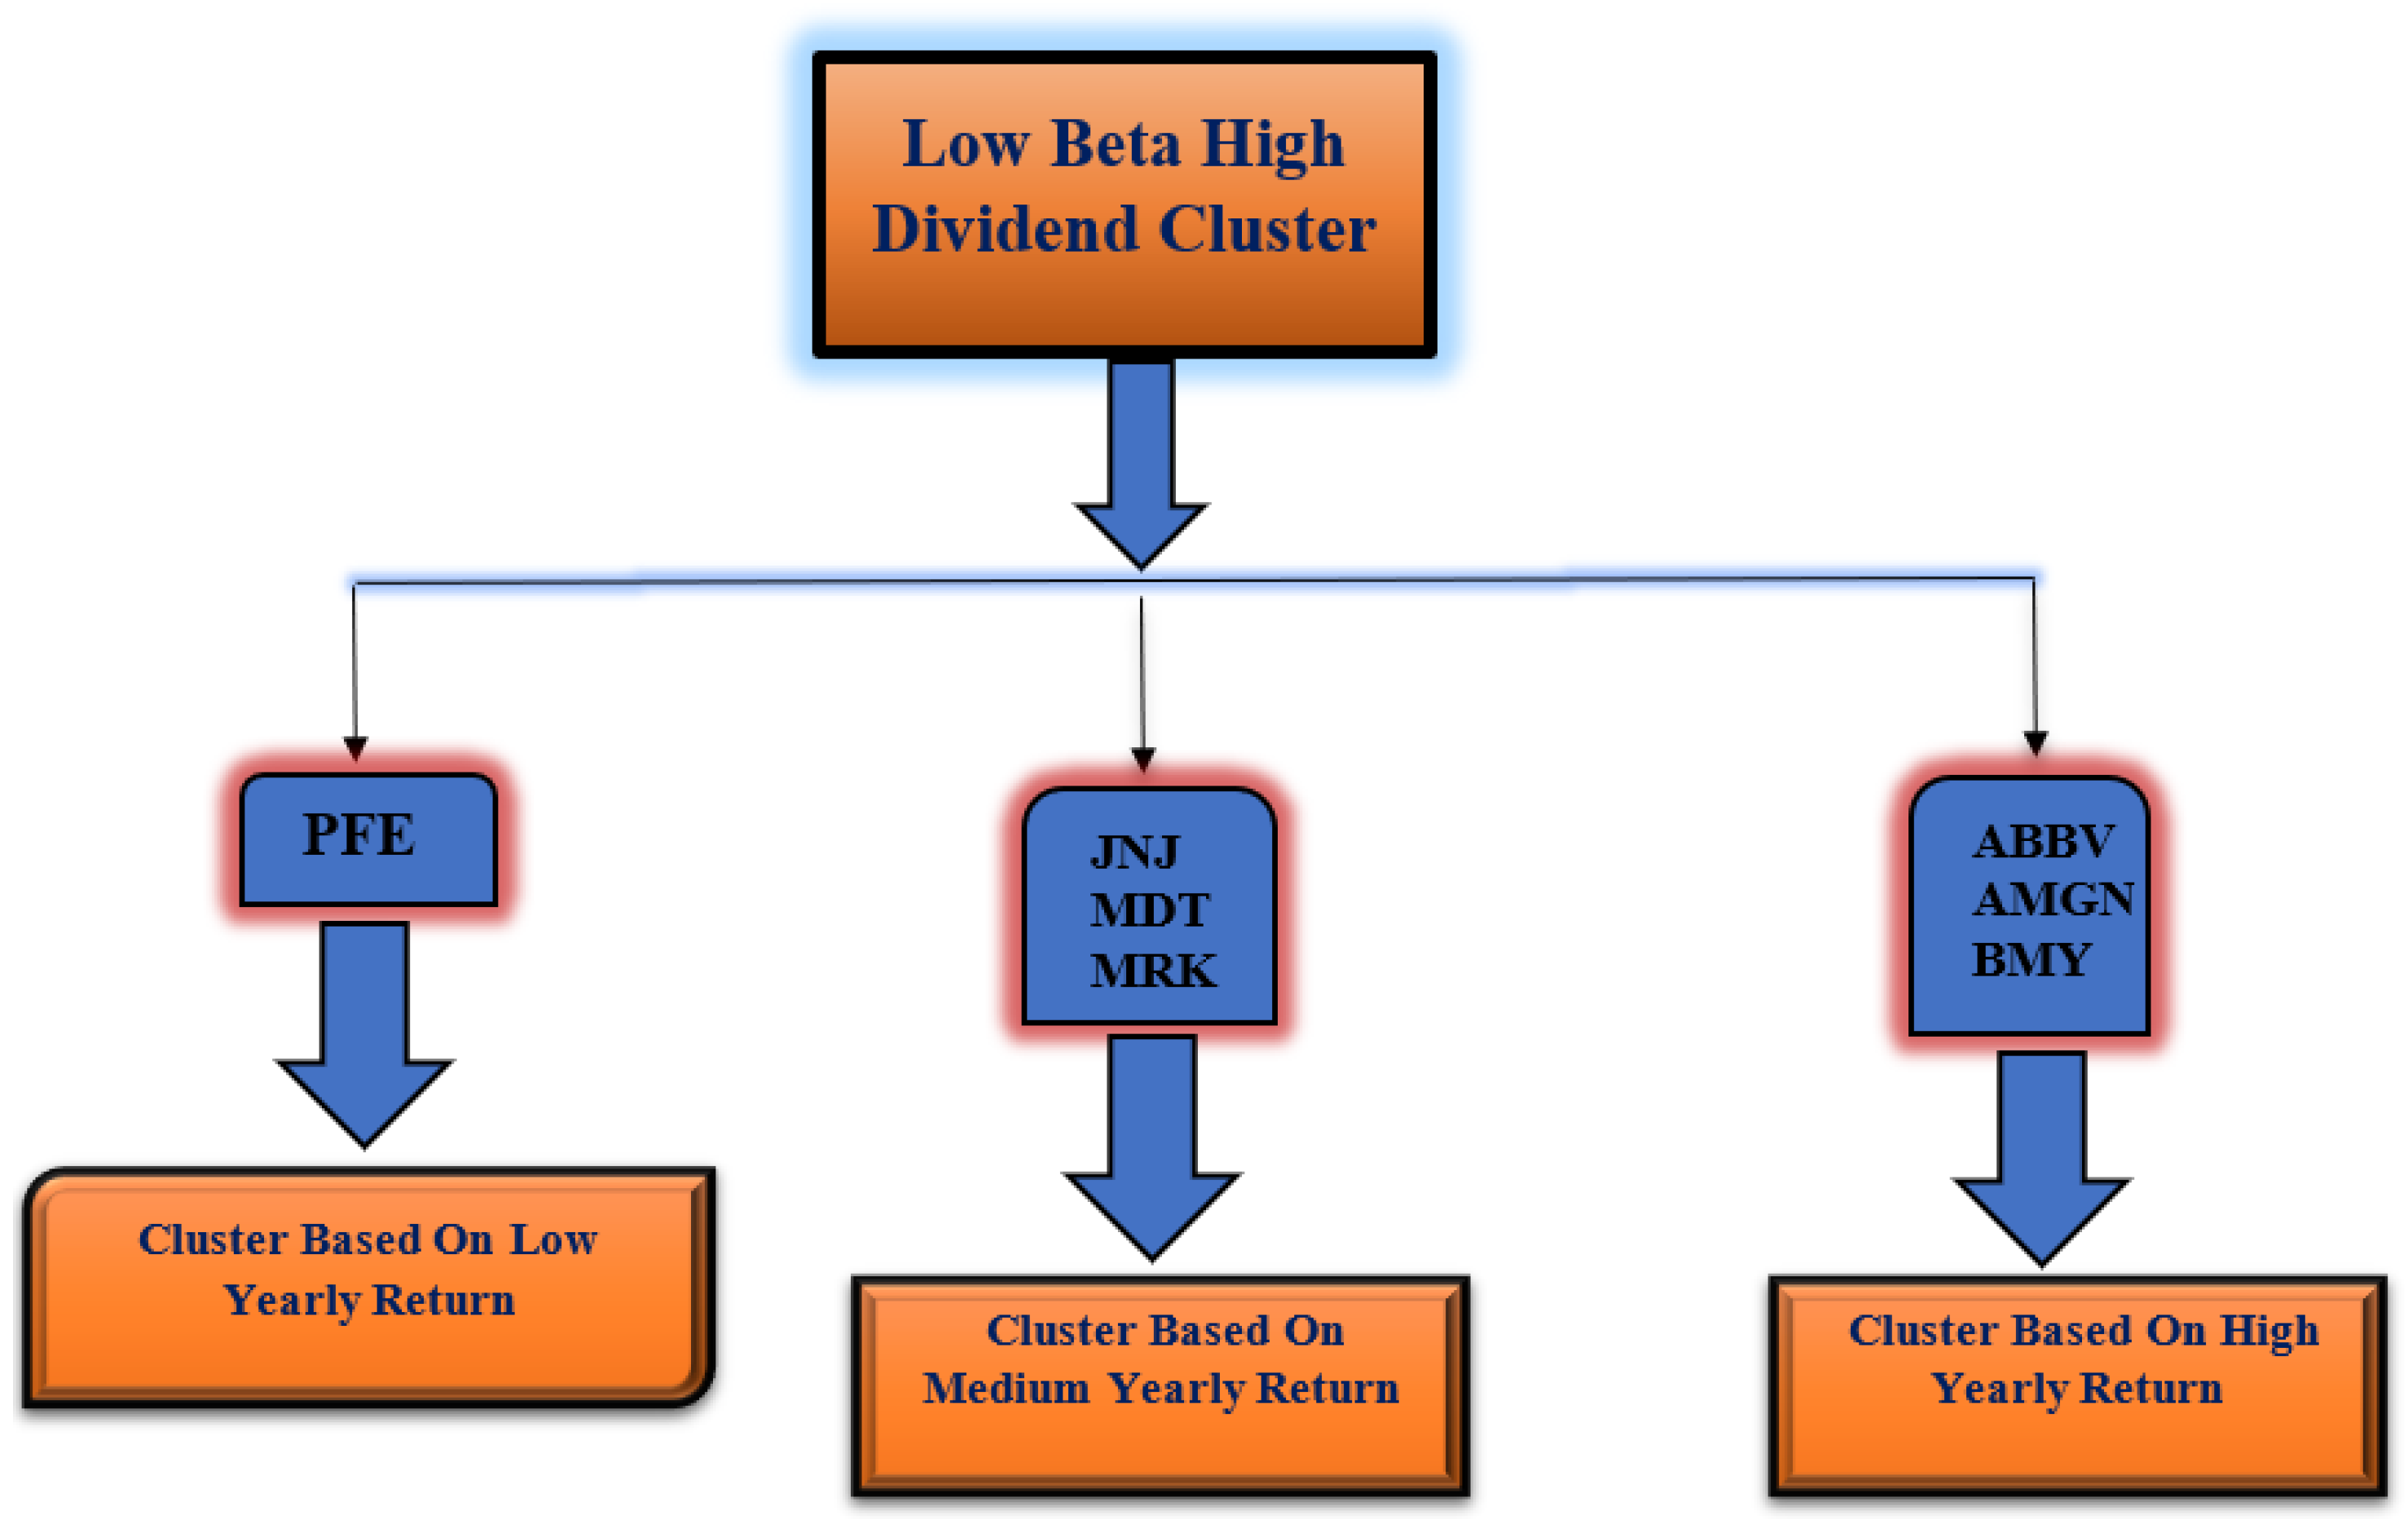
- In the final stage of clustering, we again clustered each group of dividend yield clusters based on the yearly percentage return of the stocks.
2.2. Description of the Indicators
2.2.1. Financial Indicators
- Div_Yield (): The dividend yield is a financial measure that demonstrates how much a company disburses in dividends each year with respect to its stock price. It is the annual dividend rate divided by the current share price. It is expressed as a percent form. For instance, if the current stock price is and the annual dividend is , then the dividend yield is 2 percent.
- Beta (): Beta is a risk measure of a stock’s volatility of return with regard to the overall market. In general, a stock with a higher beta value tends to have a higher risk and also higher expected returns. It is defined as follows:where is the return on an individual stock and is the return on the overall market. Cov(.,.) is the covariance between and , i.e., how the changes in stock return are related to the changes in the market return, Var(.) is the variance measure, implying how far the market data are scattered from their average market return.
- PE (): The price-to-earnings ratio (P/E ratio) is the ratio that measures the current share price of a stock with respect to its earnings per share (EPS). It is defined as follows:
2.2.2. Economical Indicators
- US_GDP (): Gross domestic product of the United States (in trillions).
- US_ICS (): The Index of Consumer Sentiment (ICS) or economic well-being was developed at the University of Michigan Survey Research Center to measure the confidence or optimism (pessimism) of consumers in their future well-being and economic conditions. The index measures the short and long-term expectations of business conditions and the individual’s perceived economic well-being. Evidence indicates that the ICS is a leading indicator of economic activity, as consumer confidence seems to pave the way for major spending decisions.
- US_PSR (): The U.S. personal savings rate is the population’s personal savings as a percentage of their disposable personal income. In other words, it is the percentage of people’s income left after they pay taxes and spend money. The U.S. Bureau of Economic Analysis (BEA) publishes this rate.
2.3. Development of the Statistical Model
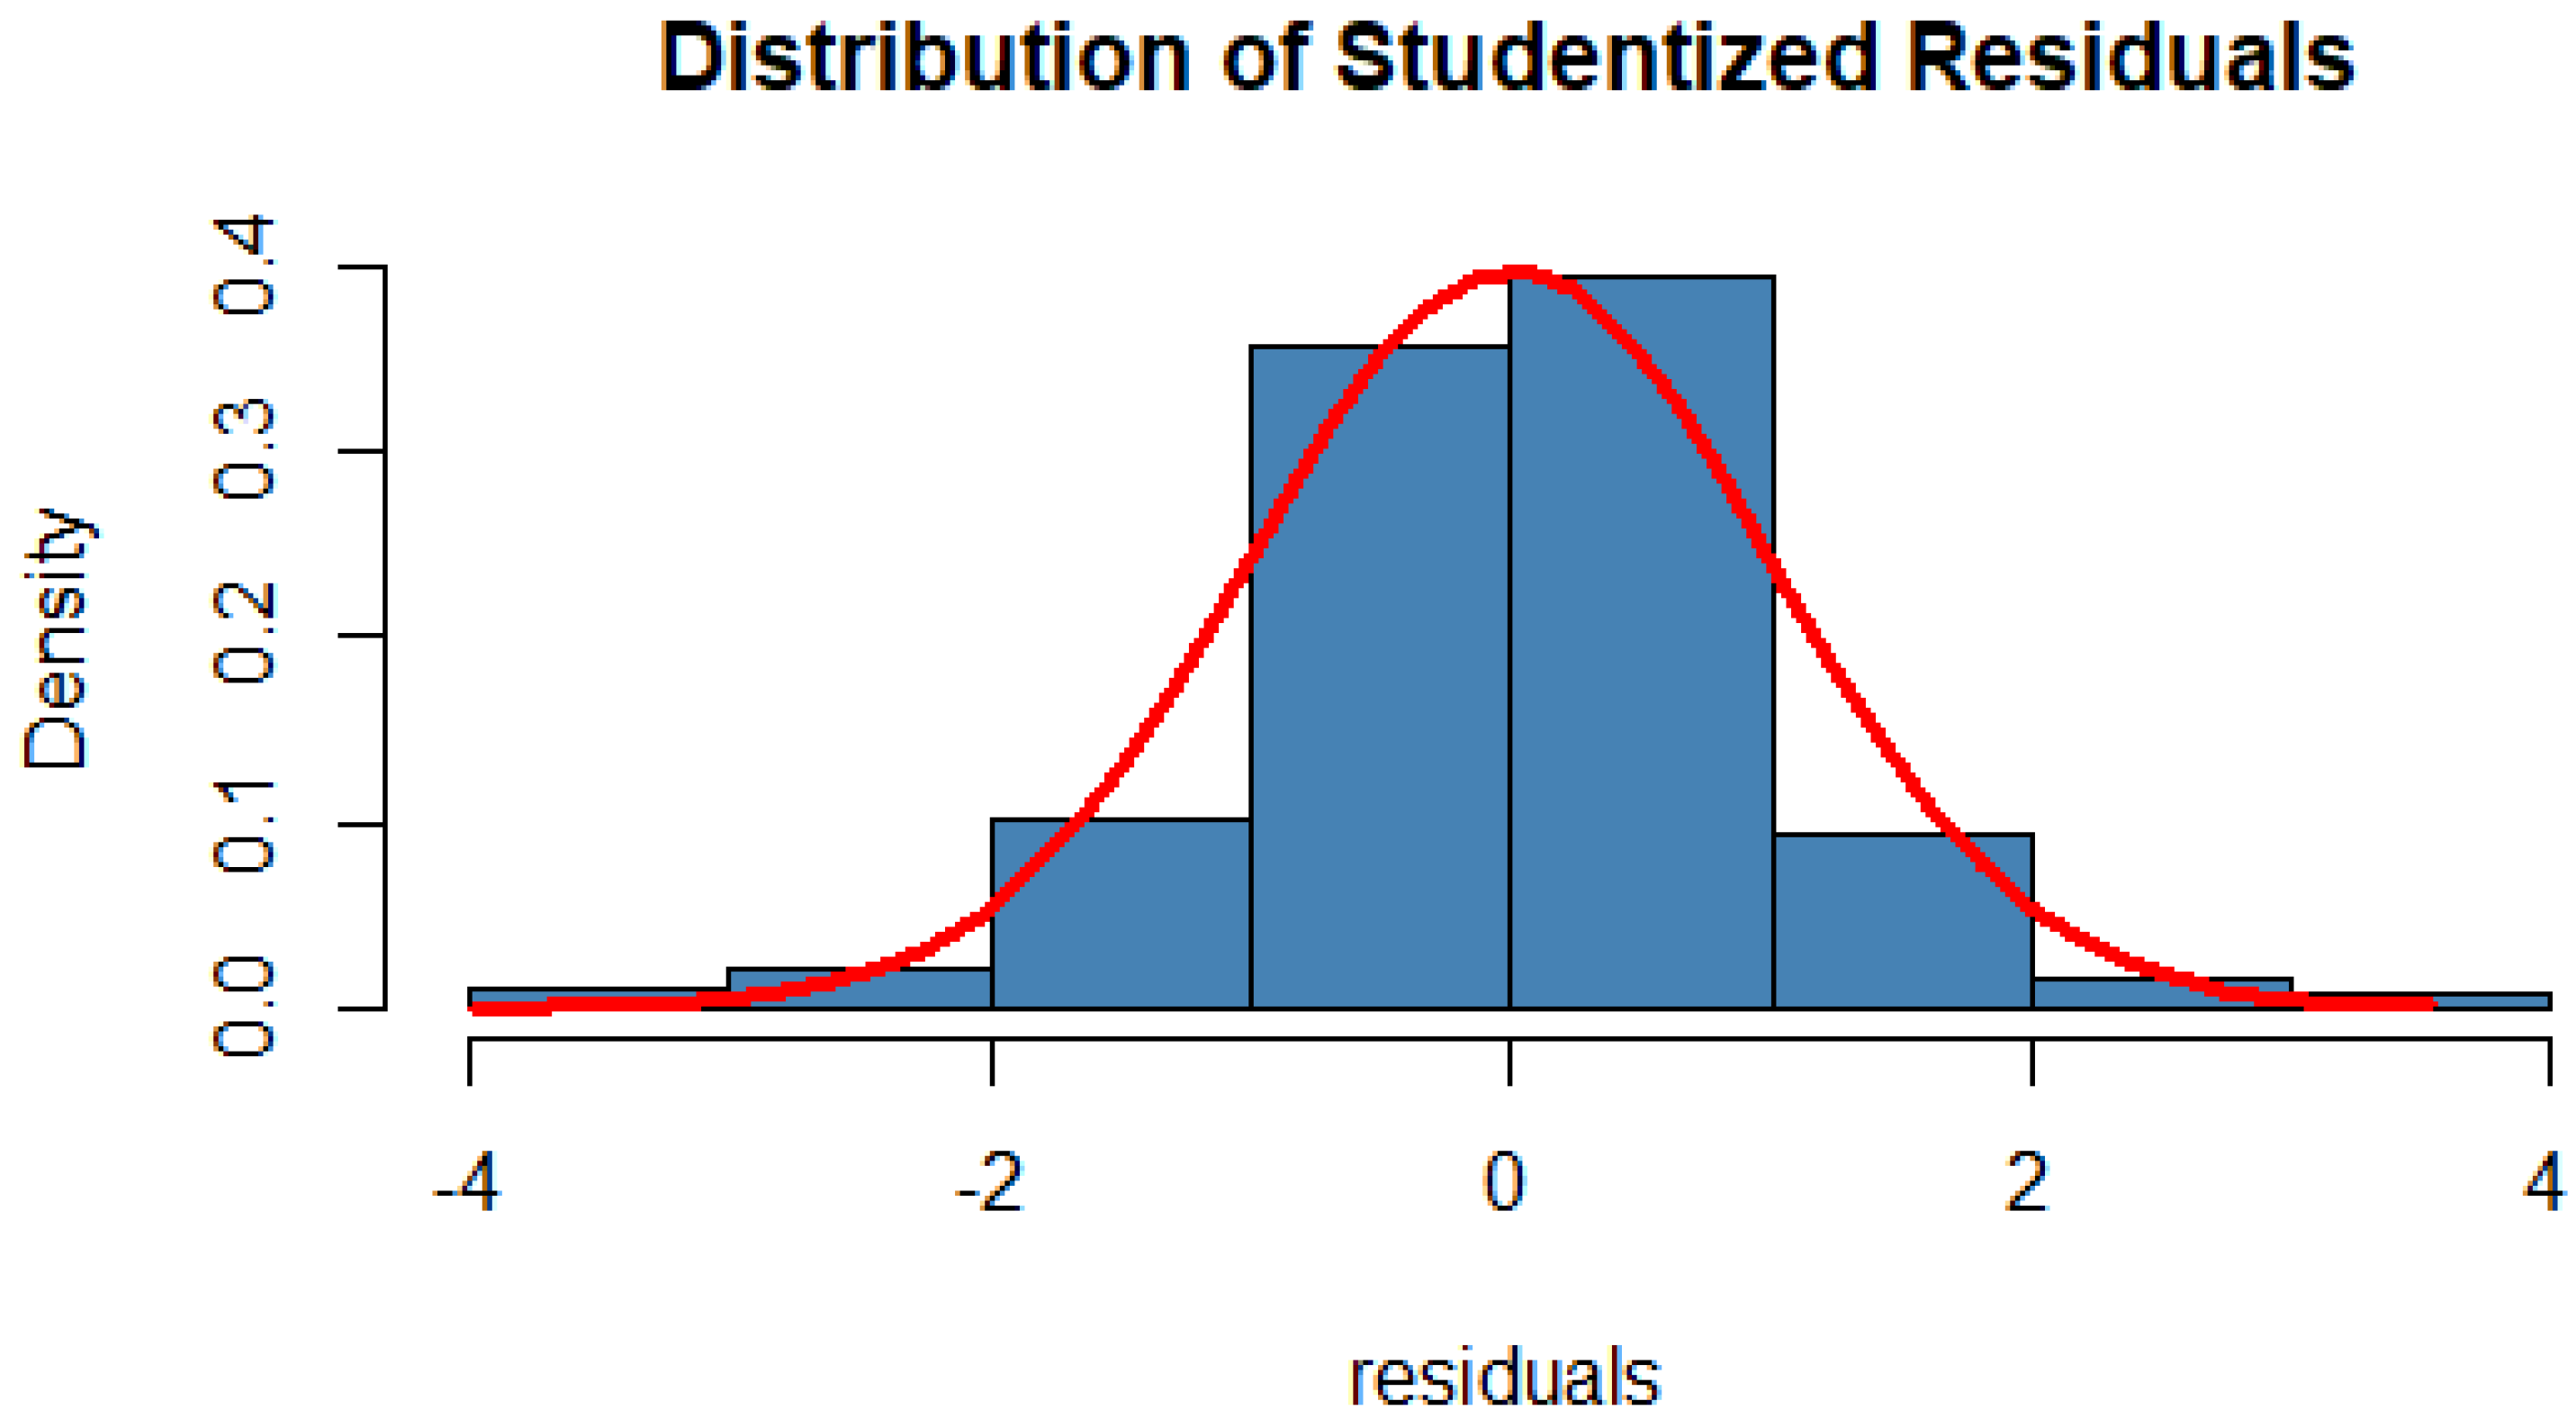
2.4. Residual Analysis
2.4.1. Mean Residual is Approximately Zero
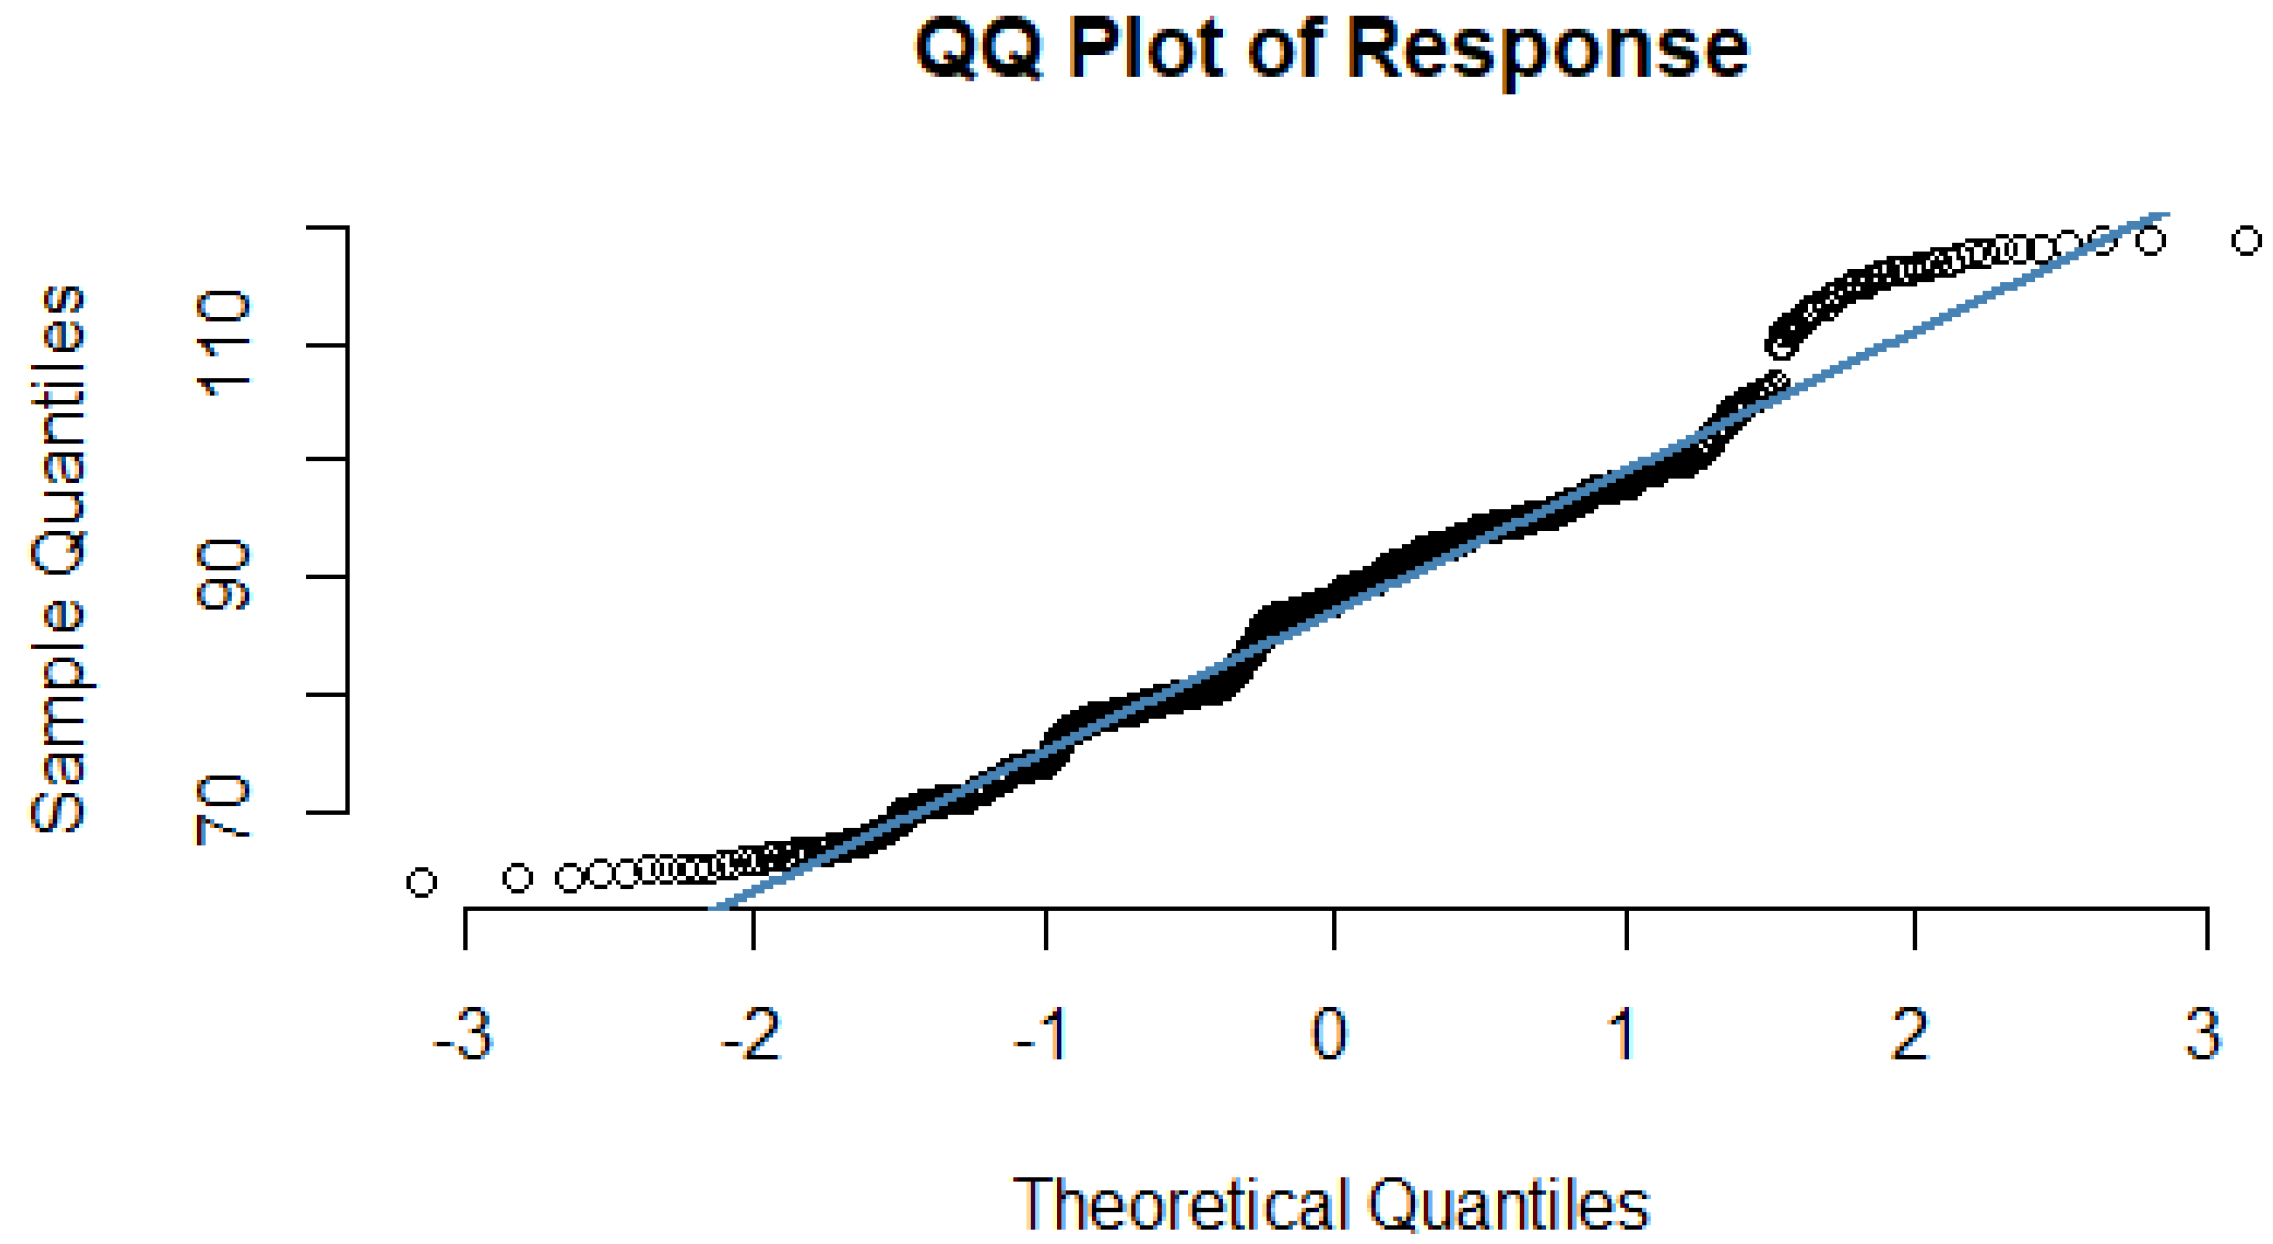
2.4.2. Normality of Residual
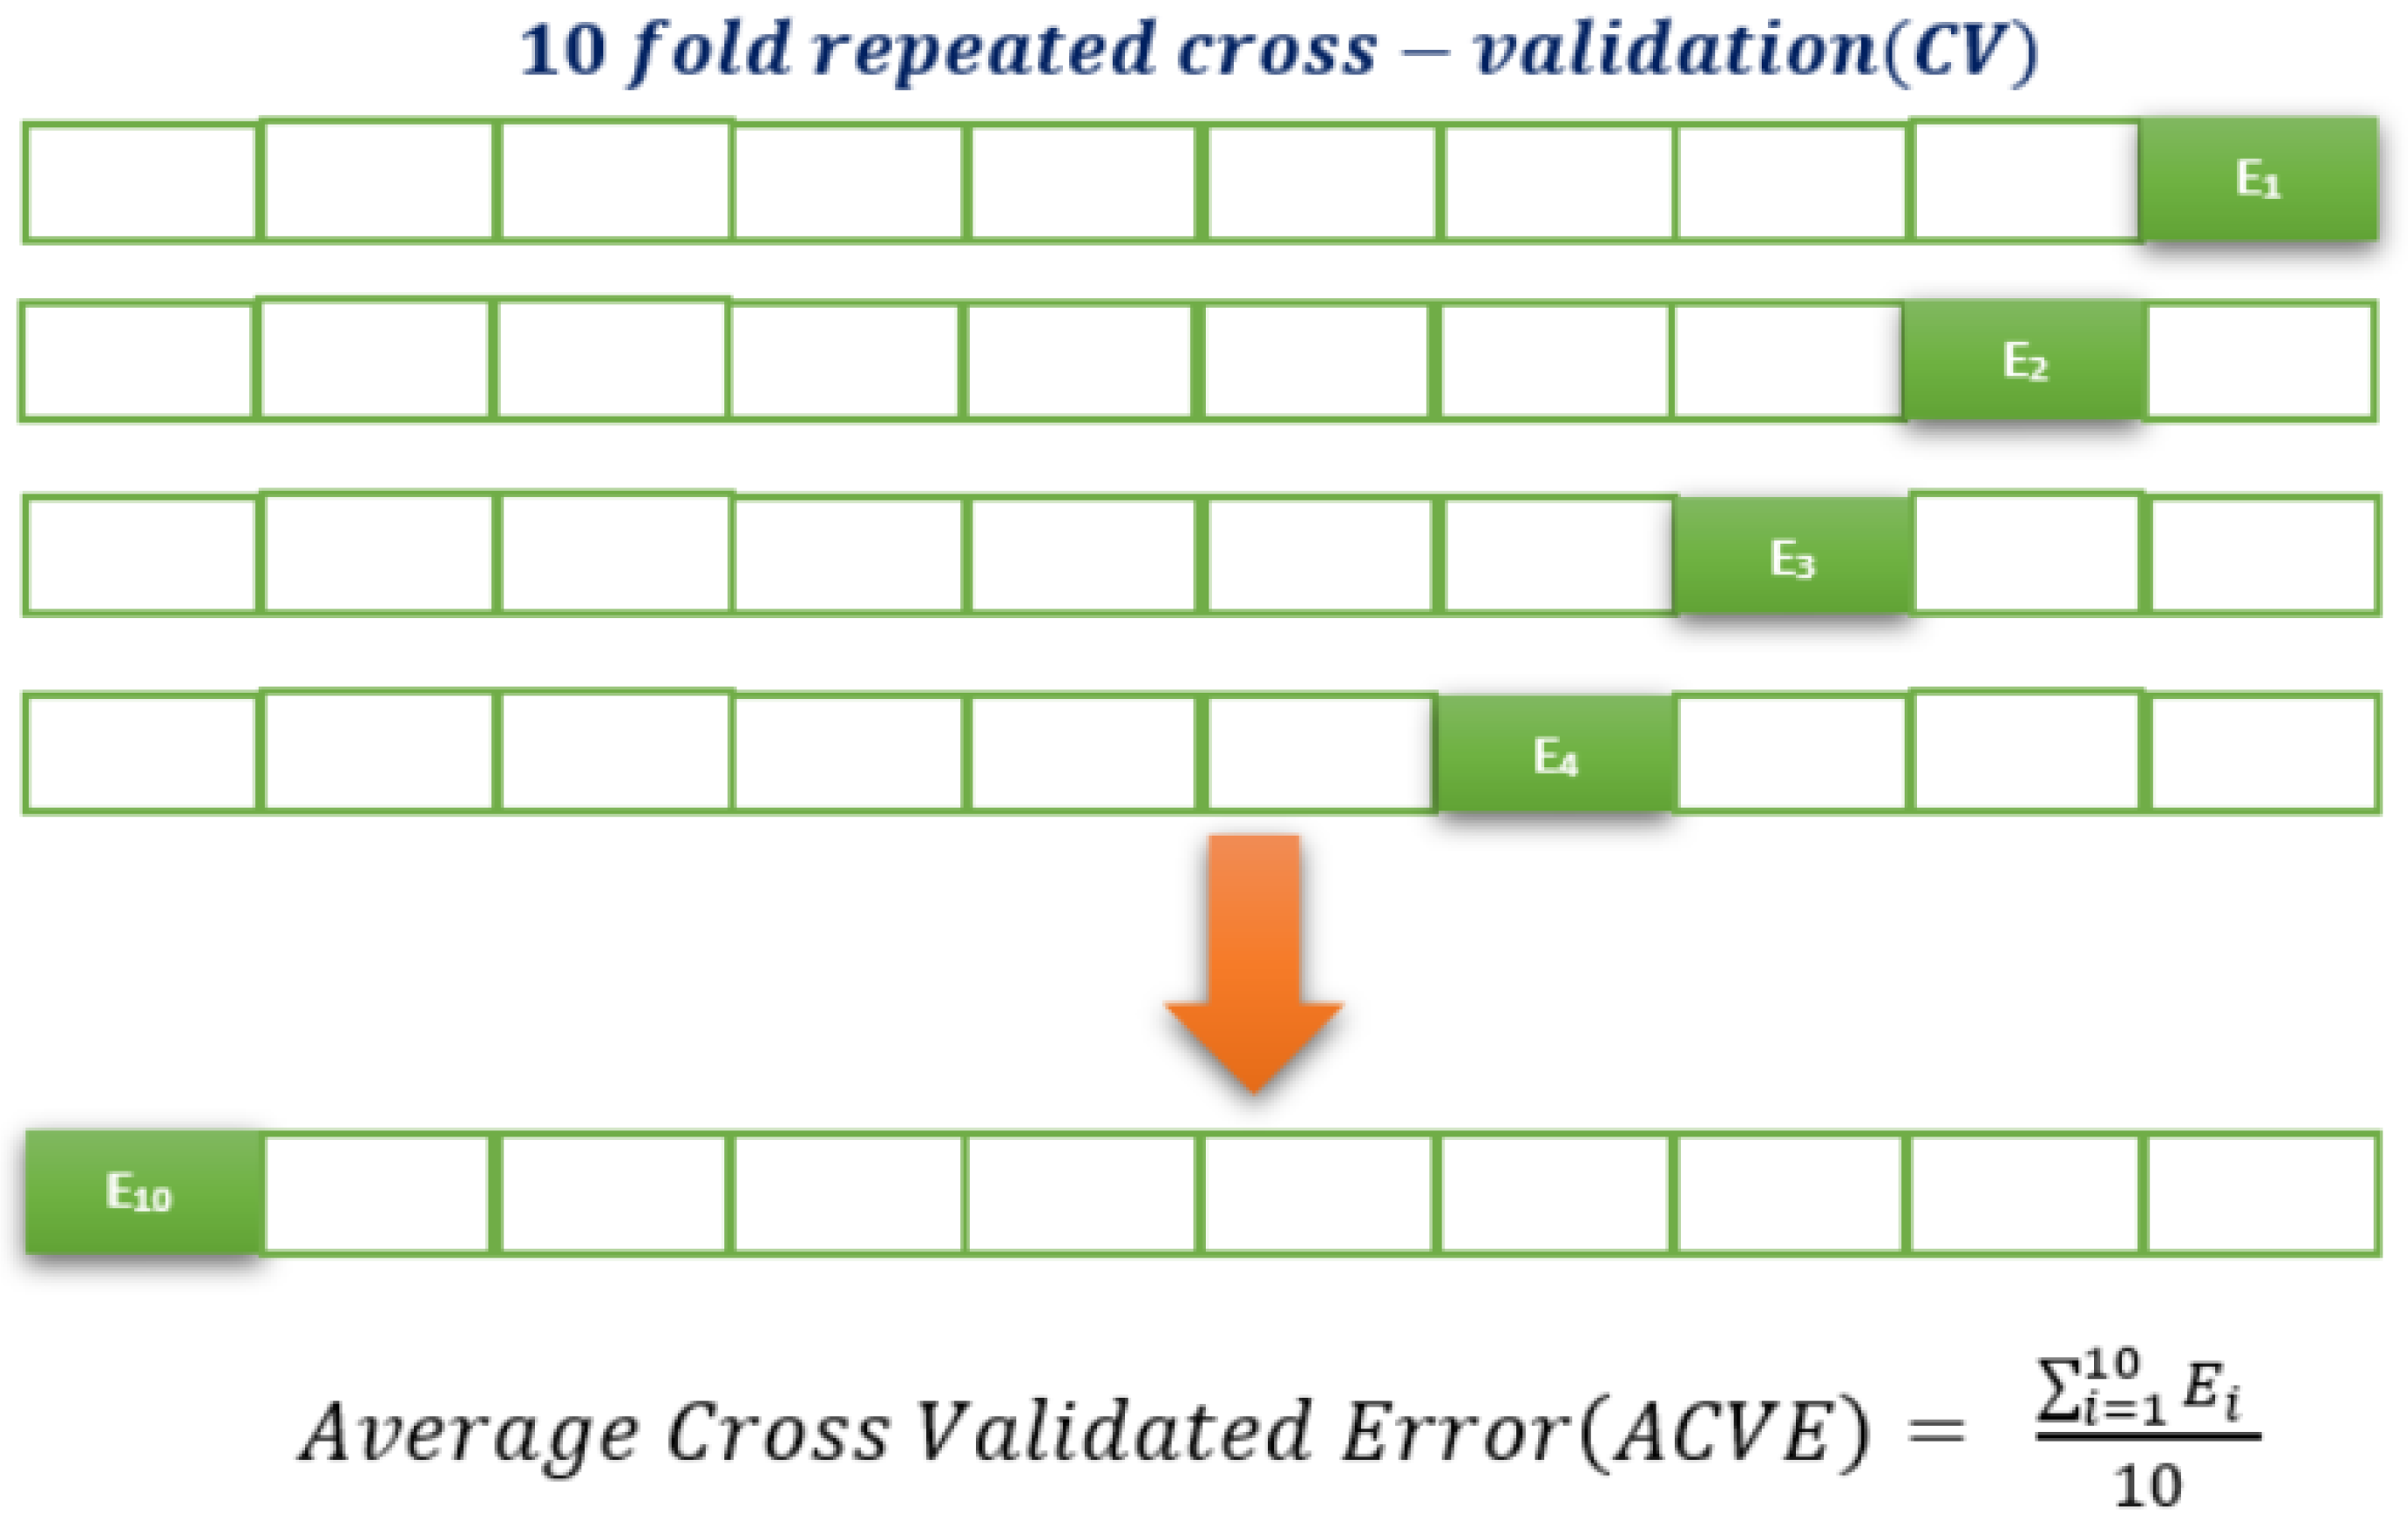
3. Validation and Prediction Accuracy of the Proposed Model
4. Analytical Method to Optimize the AWCP of ABBV Inc.
A Formal Analytical Approach For the Response Surface Model Using the Desirability Function
- Given the data, fit response models for all k responses (in our study, we have a single response; therefore, k = 1);
- Define individual desirability functions for each response;
- Optimize the overall desirability D with respect to the controllable indicators.
5. Results
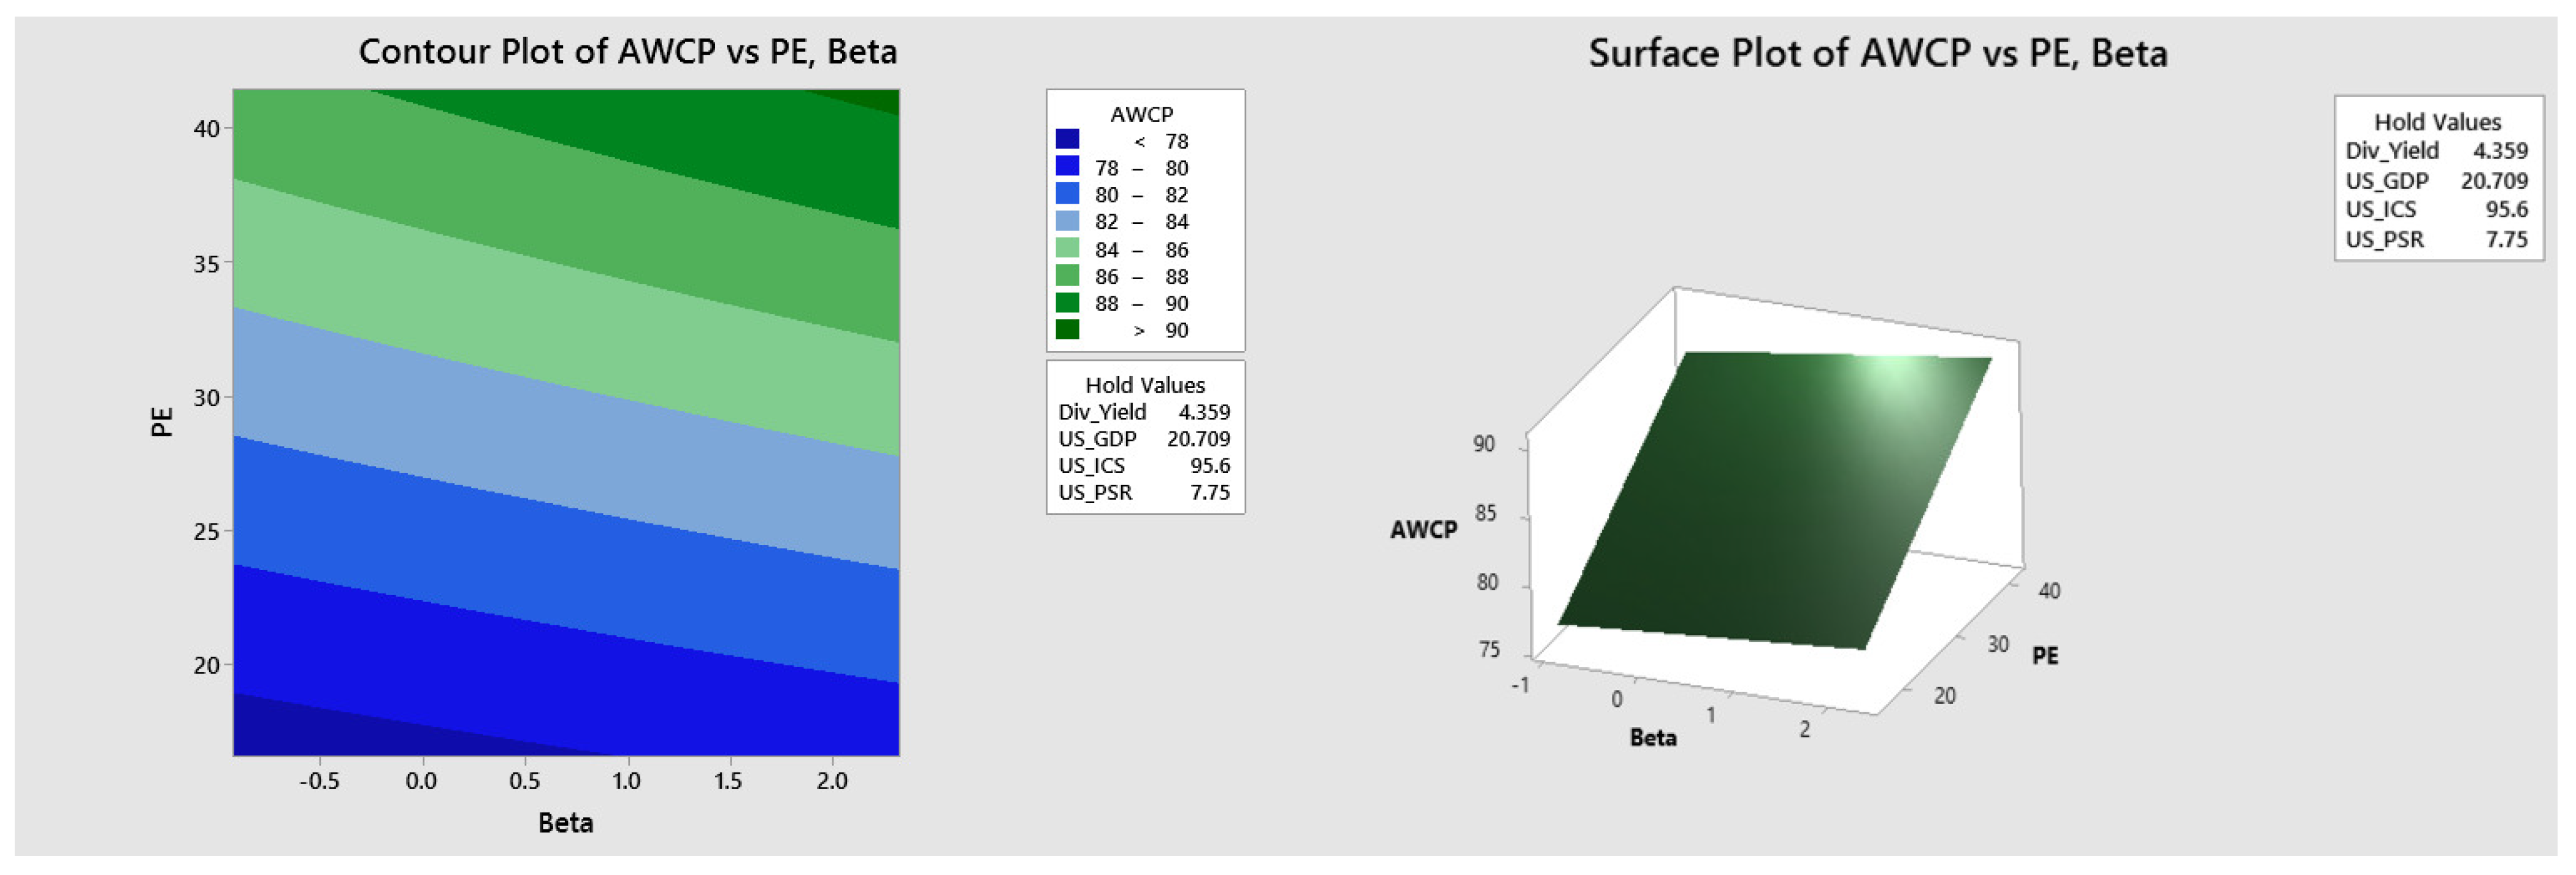
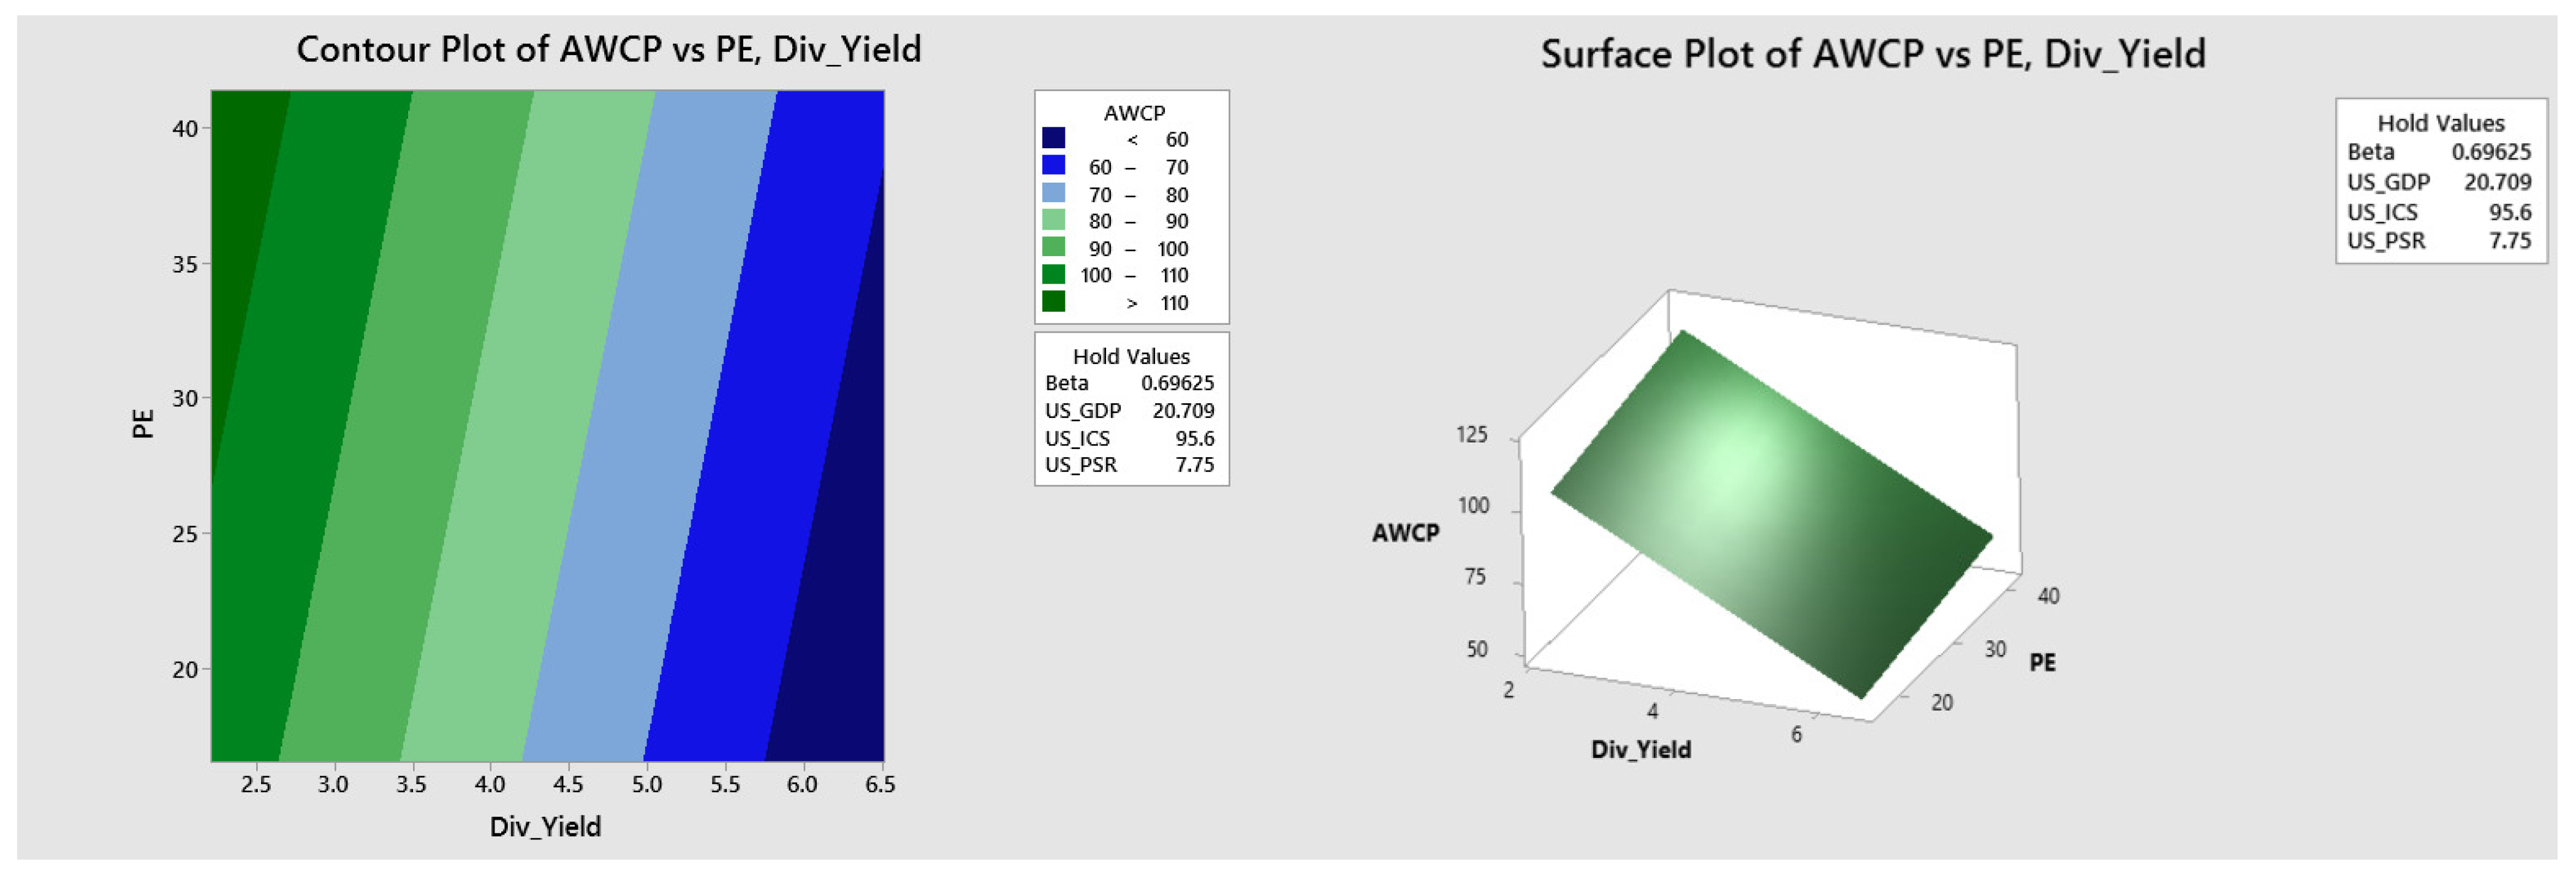
Graphical Visualization of the Estimated Response Surface
6. Discussion
- We identified and tested the individual attributable variables (indicators) responsible for the increases or decreases in the ABBV stock price.
- The significant interactions that influence the response AWCP in our model were identified.
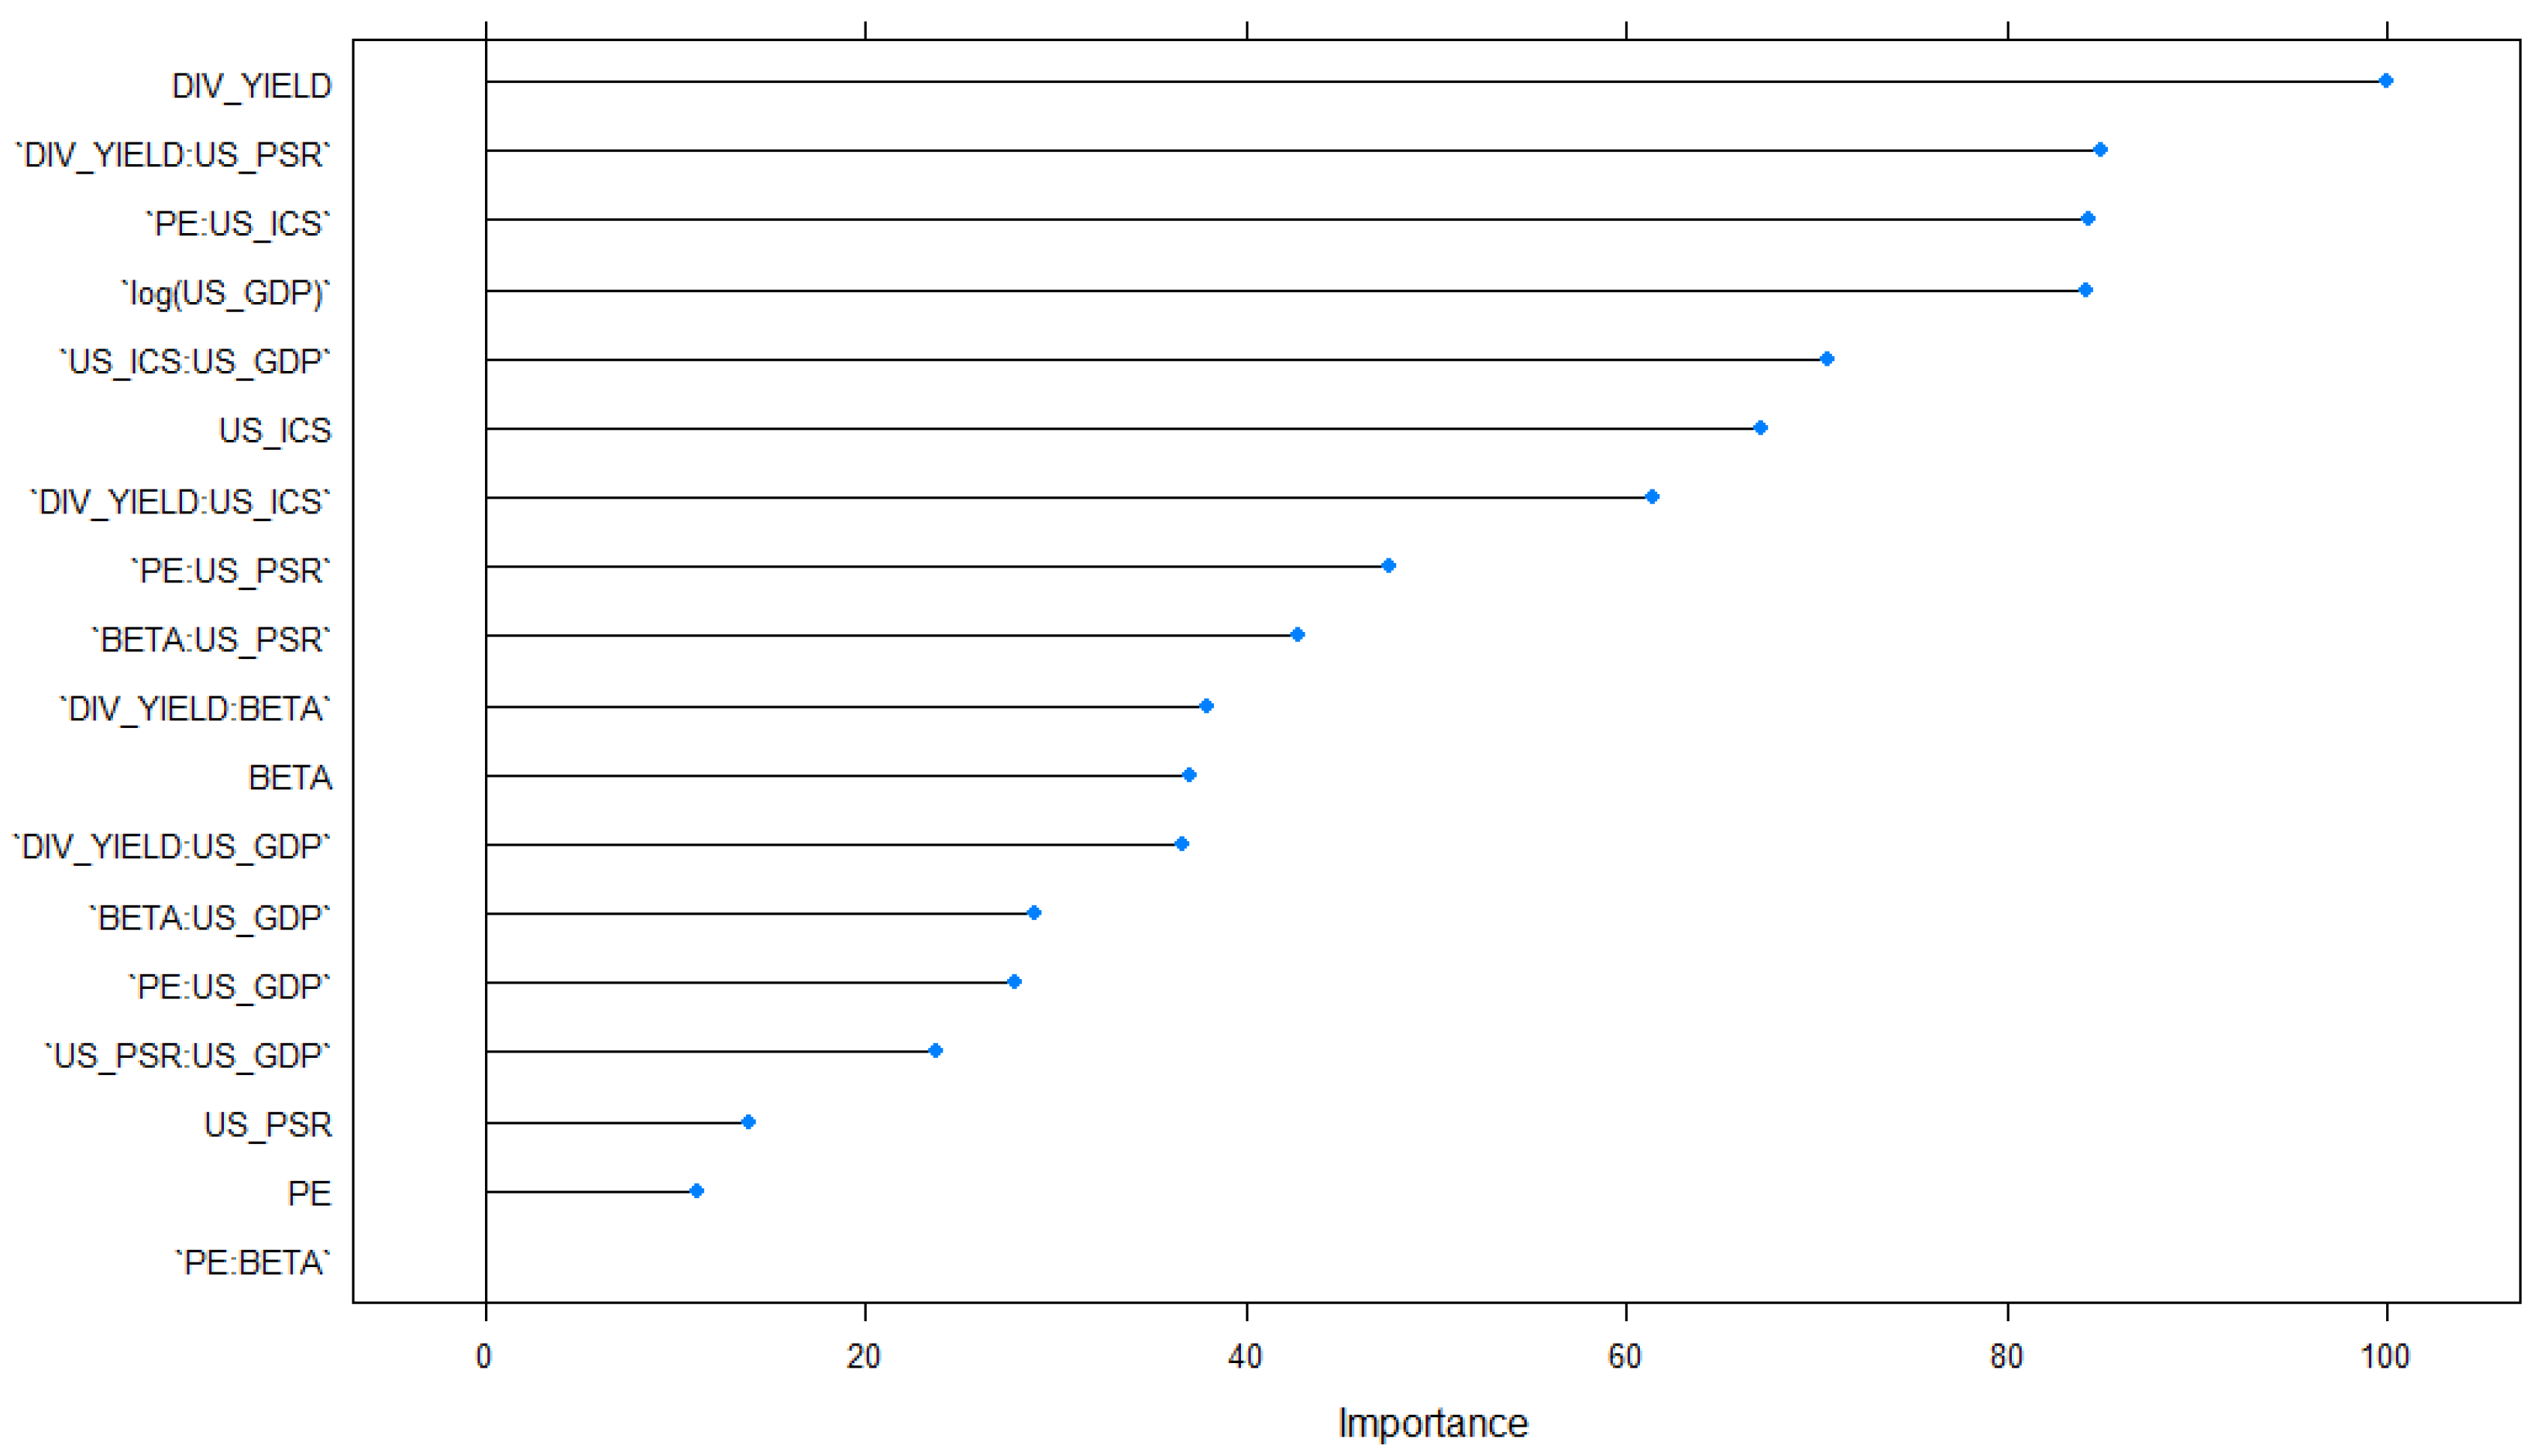
- The individual attributable indicators and interactions were ranked with respect to the percentage of contribution to the response.
- Excellent predictions of the weekly closing price for the healthcare stock ABBV from our analytical model can be obtained with a high degree of prediction accuracy.
- We compared the original and the estimated response AWCP using our analytical model and found that they are very close to each other, indicating the high accuracy of our model.
- A desirability function approach was performed for this stock, ABBV Inc., to maximize the predicted response based on the average weekly closing price (AWCP). We also identified the optimum levels of the indicators that maximized the predicted response with a high degree, along with the 95% confidence interval and 95% prediction interval.
7. Conclusions
Author Contributions
Funding
Data Availability Statement
Acknowledgments
Conflicts of Interest
References
- Lajevardi, S. A study on the effect of P/E and PEG ratios on stock returns: Evidence from Tehran Stock Exchange. Manag. Sci. Lett. 2014, 4, 1401–1410. [Google Scholar] [CrossRef]
- Lemmon, M.; Portniaguina, E. Consumer confidence and asset prices: Some empirical evidence. Rev. Financ. Stud. 2006, 19, 1499–1529. [Google Scholar] [CrossRef]
- Tang, G.Y.N.; Shum, W.C. The conditional relationship between beta and returns: Recent evidence from international stock markets. Int. Bus. Rev. 2003, 12, 109–126. [Google Scholar] [CrossRef]
- Garner, C.A. Should the decline in Personal Saving Rate Be a Cause of Concern? Econ. Rev. Quart. 2006, 91, 5–28. [Google Scholar]
- Avouyi-Dovi, S.; Matheron, J. Productivity and stock prices. Banq. Fr. Financ. Stab. Rev. 2006, 81–94. [Google Scholar]
- Polansky, A.M.; Chou, Y.-M.; Mason, R.L. An algorithm for fitting Johnson transformations to non-normal data. J. Qual. Technol. 1999, 31, 345–350. [Google Scholar] [CrossRef]
- Myers, R.H.; Montgomery, D.C.; Anderson-Cook, C.M. Response Surface Methodology: Process and Product Optimization Using Designed Experiments; John Wiley & Sons: Hoboken, NJ, USA, 2016. [Google Scholar]
- Harrington, E.C. The desirability function. Ind. Qual. Control. 1965, 21, 494–498. [Google Scholar]
- Derringer, G.; Suich, R. Simultaneous optimization of several response variables. J. Qual. Technol. 1980, 12, 214–219. [Google Scholar] [CrossRef]
- Chakraborty, A.; Tsokos, C.P. An AI-driven Predictive Model for Pancreatic Cancer Patients Using Extreme Gradient Boosting. J. Stat. Theory Appl. 2023, 22, 262–282. [Google Scholar] [CrossRef]
- Chakraborty, A.; Tsokos, C.P. A Modern Analytical Approach for Assessing the Treatment Effectiveness of Pancreatic Adenocarcinoma Patients Belonging to Different Demographics and Cancer Stages. J. Cancer Res. Treat. 2023, 11, 13–18. [Google Scholar] [CrossRef]
- Chakraborty, A.; Tsokos, C.P. A real data-driven clustering approach for countries based on happiness score. Amfiteatru Econ. 2021, 23, 1031–1045. [Google Scholar] [CrossRef]
- Chakraborty, A.; Tsokos, C.P. A Real Data-Driven Analytical Model to Predict Happiness. Sch. J. Phys. Math. Stat. 2021, 3, 45–61. [Google Scholar] [CrossRef]
- Chakraborty, A.; Tsokos, C.P. Survival Analysis for Pancreatic Cancer Patients Using Cox-Proportional Hazard (CPH) Model. Glob. J. Med. Res. 2021, 21, 29–46. [Google Scholar] [CrossRef]
- Gray, J.B.; Woodall, W.H. The maximum size of standardized and internally studentized residuals in regression analysis. Am. Stat. 1994, 48, 111–113. [Google Scholar] [CrossRef]
- Pek, J.; Wong, O.; Wong, A.C.M. How to address non-normality: A taxonomy of approaches, reviewed, and illustrated. Front. Psychol. 2018, 9, 2104. [Google Scholar] [CrossRef] [PubMed]
- Lee, D.K. Data transformation: A focus on the interpretation. Korean J. Anesthesiol. 2020, 73, 503. [Google Scholar] [CrossRef] [PubMed]
- Fushiki, T. Estimation of prediction error by using K-fold cross-validation. Stat. Comput. 2011, 21, 137–146. [Google Scholar] [CrossRef]
- Dor, O.; Zhou, Y. Achieving 80% ten-fold cross-validated accuracy for secondary structure prediction by large-scale training. Proteins Struct. Funct. Bioinform. 2007, 66, 838–845. [Google Scholar] [CrossRef] [PubMed]
- Enke, D.; Thawornwong, S. The use of data mining and neural networks for forecasting stock market returns. Expert Syst. Appl. 2005, 29, 927–940. [Google Scholar] [CrossRef]
- Boloorforoosh, A.; Christoffersen, P.; Fournier, M.; Gouriéroux, C. Beta risk in the cross-section of equities. Rev. Financ. Stud. 2020, 33, 4318–4366. [Google Scholar] [CrossRef]
- Campbell, J.Y.; Vuolteenaho, T. Bad beta, good beta. Am. Econ. Rev. 2004, 94, 1249–1275. [Google Scholar] [CrossRef]
- Ferson, W.E.; Harvey, C.R. The variation of economic risk premiums. J. Political Econ. 1991, 99, 385–415. [Google Scholar] [CrossRef]
- Black, F.; Scholes, M. The effects of dividend yield and dividend policy on common stock prices and returns. J. Financ. Econ. 1974, 1, 1–22. [Google Scholar] [CrossRef]
- Cyert, R.; Kang, S.-H.; Kumar, P. Managerial objectives and firm dividend policy: A behavioral theory and empirical evidence. J. Econ. Behav. Organ. 1996, 31, 157–174. [Google Scholar] [CrossRef]


| Rank | Indicators | Contribution (%) |
|---|---|---|
| 1 | 8.95 | |
| 2 | 7.85 | |
| 3 | 7.81 | |
| 4 | 7.79 | |
| 5 | 6.8 | |
| 6 | 6.54 | |
| 7 | 6.13 | |
| 8 | 5.11 | |
| 9 | 4.76 | |
| 10 | 4.42 | |
| 11 | 4.35 | |
| 12 | 4.31 | |
| 13 | 3.75 | |
| 14 | 3.67 | |
| 15 | 3.37 | |
| 16 | 2.65 | |
| 17 | 2.45 | |
| 18 | 1.63 |
| Indicators | Lower Limit | Upper Limit |
|---|---|---|
| Div_Yield | 2.212 | 6.506 |
| Beta | −0.9 | 2.3 |
| PE | 16.55 | 41.42 |
| US_GDP | 19.6 | 21.9 |
| US_ICS | 89.8 | 101.4 |
| US_PSR | 6.7 | 8.8 |
| Response and Indicators | Optimum Values |
|---|---|
| AWCP (Response) | 120$ |
| Div_Yield | 4.36 |
| Beta | 0.7 |
| PE | 39.56 |
| US_GDP | 19.6 |
| US_ICS | 101.4 |
| US_PSR | 8.8 |
| Estimated Maximized Value | USD 120 |
|---|---|
| Desirability | 1 |
| 98.61% | |
| 98.57% | |
| 95% CI | (110.71, 129.29) |
| 95% PI | (110.28, 129.72) |
| Observations | Observed | Predicted |
|---|---|---|
| 1 | 88.1 | 88.5 |
| 246 | 89.1 | 90.2 |
| 247 | 89.2 | 90.4 |
| 308 | 93.5 | 96.4 |
| 373 | 96.4 | 100.1 |
| 374 | 96.2 | 99 |
| 375 | 95 | 99.5 |
| 376 | 94 | 98.5 |
| 377 | 93 | 97.5 |
| 378 | 92.7 | 96 |
| 379 | 92.3 | 95 |
| 435 | 92 | 95.5 |
| 436 | 92 | 96.5 |
| 437 | 91.8 | 96.4 |
| 438 | 91.2 | 96.1 |
| 439 | 91.4 | 96.1 |
| 440 | 92.4 | 94.1 |
| 449 | 109.8 | 106 |
| 450 | 113.2 | 107.8 |
| 451 | 114.5 | 102 |
| 452 | 115.9 | 112 |
| 452 | 115.9 | 111.8 |
| 453 | 117 | 113.5 |
| 454 | 118.2 | 115.2 |
| 459 | 115.4 | 118.3 |
| 460 | 114.8 | 118.4 |
| 473 | 112.6 | 115.8 |
| 474 | 111.3 | 115.2 |
| 475 | 111.4 | 114.9 |
| 476 | 111.3 | 114.4 |
| 477 | 111.8 | 113.8 |
| 482 | 116.4 | 111 |
| 483 | 117.9 | 111 |
| 484 | 116.4 | 109.4 |
| 485 | 115 | 108.9 |
| 486 | 113 | 108.5 |
| 496 | 99.8 | 102.9 |
| 497 | 100 | 102.9 |
| 504 | 97.8 | 97.7 |
| 505 | 97.7 | 96.6 |
| 506 | 98 | 97 |
| 507 | 98 | 97 |
Disclaimer/Publisher’s Note: The statements, opinions and data contained in all publications are solely those of the individual author(s) and contributor(s) and not of MDPI and/or the editor(s). MDPI and/or the editor(s) disclaim responsibility for any injury to people or property resulting from any ideas, methods, instructions or products referred to in the content. |
© 2024 by the authors. Licensee MDPI, Basel, Switzerland. This article is an open access article distributed under the terms and conditions of the Creative Commons Attribution (CC BY) license (https://creativecommons.org/licenses/by/4.0/).
Share and Cite
Chakraborty, A.; Tsokos, C. A Stock Optimization Problem in Finance: Understanding Financial and Economic Indicators through Analytical Predictive Modeling. Mathematics 2024, 12, 2407. https://doi.org/10.3390/math12152407
Chakraborty A, Tsokos C. A Stock Optimization Problem in Finance: Understanding Financial and Economic Indicators through Analytical Predictive Modeling. Mathematics. 2024; 12(15):2407. https://doi.org/10.3390/math12152407
Chicago/Turabian StyleChakraborty, Aditya, and Chris Tsokos. 2024. "A Stock Optimization Problem in Finance: Understanding Financial and Economic Indicators through Analytical Predictive Modeling" Mathematics 12, no. 15: 2407. https://doi.org/10.3390/math12152407
APA StyleChakraborty, A., & Tsokos, C. (2024). A Stock Optimization Problem in Finance: Understanding Financial and Economic Indicators through Analytical Predictive Modeling. Mathematics, 12(15), 2407. https://doi.org/10.3390/math12152407