Article

Integrated Evaluation Method of Bus Lane Traffic Benefit Based on Multi-Source Data

1
T. Y. Lin International Engineering Consulting (China) Co., Ltd., Chongqing 401121, China
2
China Construction Seventh Engineering Division Co., Ltd., Chongqing 404100, China
3
College of Traffic & Transportation, Chongqing Jiaotong University, Chongqing 400074, China
4
School of Smart City, Chongqing Jiaotong University, Chongqing 400074, China
5
Chongqing Key Laboratory of Spatio-Temporal Information in Mountain Cities, Chongqing Jiaotong University, Chongqing 400074, China
*
Author to whom correspondence should be addressed.
Mathematics 2024, 12(17), 2664; https://doi.org/10.3390/math12172664
Submission received: 22 July 2024 / Revised: 15 August 2024 / Accepted: 20 August 2024 / Published: 27 August 2024

Abstract

:
Bus lanes are an important measure for improving the quality of bus service and the efficiency of transportation systems. A scientific and reasonable evaluation of the overall traffic operation efficiency of the bus priority road section is helpful to fully understand the improvement effect of the introduction of bus lanes on traffic operation. To comprehensively and objectively evaluate the traffic benefits of bus lanes, the Delphi and grey correlation methods were used to construct a comprehensive weight calculation model of the indicators. The weights of eight traffic benefit evaluation indicators at the two levels of buses and general traffic were calculated, and the weights were then optimized using the target optimization model. Combined with different weight indexes, the evaluation of the traffic benefit level of the bus lane was realized using the matter-element extension model based on the improvement in the sticking progress. The bus lanes of the Daping-Yangjiaping, Huanghuayuan interchange-Luneng turntable, and Dashiba-Hongqihegou routes in the main urban area of Chongqing were used for verification. The results show that the traffic benefits of the three case areas have been improved to a certain extent after the construction of bus lanes, but the benefit level has not changed. Through the analysis of various operating indicators, the weaknesses that affect the traffic efficiency can be obtained, and then the decision-making basis for the implementation and improvement of the bus lane optimization scheme can be provided.

1. Introduction

With the rapid development and expansion of cities, the number of urban cars continues to increase, and urban road congestion continues to intensify. To alleviate urban road congestion, the Chinese government has introduced a series of measures to improve the efficiency of road access, among which the promotion of public transport is a key element [1]. Public transport is an important foundation for the green and sustainable development of urban transport, and the creation of bus-only lanes is an important measure for developing and prioritizing the development of urban public transport, which is crucial for ensuring the operating speed of public transport and improving its attractiveness [2]. With the increasing mileage of bus-only lanes, different forms of bus-only lanes have enhanced the priority right-of-way of public transport and ensured the smooth flow of public transport travel, but they have had an impact on the traffic efficiency of general traffic [3]. Therefore, the use of bus lanes needs to be scientifically and reasonably examined, not only from the perspective of public transport operation but also to consider the degree of influence on social vehicle operation by accurately and comprehensively evaluating the traffic benefits of bus lanes. Improving evaluation methods of bus lane evaluation facilitates scientific management and fixed-point improvement and optimization.
Bus priority is one of the main means to alleviate urban traffic congestion. The implementation of bus lanes is an important measure to ensure bus priority. Accurately grasping the traffic benefits of bus lanes/priority lanes is helpful for scientific management and fixed-point improvement and optimization. In order to fully grasp the traffic benefits of the bus priority road section, it is necessary to identify weak links in the traffic operation of the bus priority road section, analyze the reasons for the bus priority road section with low traffic benefits, and identify the shortcomings and weaknesses in the traffic operation process. In this paper, multiple impact indicators are selected, and the subjective and objective fusion method is used to calculate the comprehensive weight of the impact of each indicator. The traffic efficiency of bus lanes is evaluated based on the improved matter-element extension model.
The second part of this study is to analyze and summarize the relevant research on traffic benefit evaluation and explain the difference between this study and the existing traffic benefit evaluation research. The third part is to select the traffic benefit evaluation index of bus lanes, improve the subjective and objective comprehensive weight calculation by the method of goal programming, and construct the traffic benefit evaluation model of bus lanes based on the improved matter-element extension model. The fourth part is the case analysis. Based on the real collected data and expert scoring opinions, the traffic benefit level of the three bus lane cases is evaluated. The fifth part is the summary and future prospects of the research.

2. Literature Review

2.1. Evaluation of Traffic Benefits Using Single Indicators through Simulation Software

The existing research on the benefit evaluation of bus lanes mostly focuses on three aspects: economic, social, and traffic benefits. Among these, the traffic benefit evaluation reflects the impact of bus lanes on road traffic operation [4]. In view of the evaluation research on the traffic benefits of bus lanes, scholars have mainly focused on evaluation indexes such as vehicle speed, travel time, bus passenger capacity, delay, and reliability. Lei [5], Sekhar [6], and Kampouri et al. [7] evaluated the traffic operation efficiency of bus lanes using VISSIM v8.0 (Karlsruhe, Germany) to compare changes in car delay, bus delay, queuing time, and running time before and after the introduction of bus lanes. Chen et al. [8] established a simulation model using Paramics software v6.4 (Edinburgh, Scotland) and used the running time, speed, peak social vehicle flow, and per capita travel time of buses and general traffic as evaluation indicators. Huo et al. [9] proposed a method to measure the unit delay of bus lanes as an index for evaluating the service level of bus lanes. Ullah [10] constructed a bus lane simulation model using TransModeler v6.0 (Newton, MA, USA) and used individual indicators, such as bus travel speed and non-bus travel speed, to evaluate bus operation benefits.
Using a single index to evaluate the operating efficiency of bus lanes simplifies the process, which can more intuitively reflect the operating efficiency of bus lanes so that decision-makers can quickly understand the impact of bus lanes on bus operations. However, a single indicator can only reflect the operating efficiency of bus lanes from one dimension, ignoring the impact of multiple aspects, and adopting simple indicators for evaluation is highly dependent on the accuracy of the simulation modeling. Therefore, most of these methods have been applied to evaluate bus lanes under relatively simple road conditions.

2.2. Traffic Benefit Evaluation Models

To improve the accuracy of using parameter indicators to evaluate the operational efficiency of bus lanes, some scholars have adopted mathematical models to synthesize more factors to optimize the evaluation of important indicators. Lin et al. [11] adopted a comprehensive evaluation and analysis method combining a mathematical theory model with dynamic simulation, considered the factor of road saturation, and explored the saturation state in which the introduction of bus lanes could achieve good benefits. Song et al. [12] determined the dynamic lane opening time and, based on the delay formula of the Highway Capacity Manual 2010 (HCM2010) and the United States Bureau of Public Roads (BPR) road resistance function, the average travel time model and the average travel time model of the dynamic bus lane were established, and the benefit of the dynamic bus lane was evaluated. In addition to the continuous optimization of the single-index evaluation model, some scholars have also constructed an evaluation planning model by combining multiple indicators to evaluate the optimal operating efficiency under multiple factors. Xue et al. [13] constructed a bi-level programming model by considering vehicle travel time and passenger travel time as parameter indicators. The operational efficiency of the bus lane was evaluated using the upper specific road model and the lower overall road network operational efficiency model to explore the optimal solution for the bus lane layout in the entire network. To evaluate the maximum benefit of bus lanes, Hadas and Nahum [14] constructed a multi-objective evaluation model to minimize bus delays, reduce maximum travel time, and maximize road connectivity.
Compared with the direct use of a single index to evaluate the traffic benefits of bus lanes, the establishment of an evaluation model to optimize the evaluation index can effectively improve the accuracy of the evaluation. The evaluation model established by the multi-objective solution can identify the maximum operational benefit of bus lanes in a regional road network. The operating efficiency of bus lanes is affected by many factors. Multiple factors can improve the accuracy of the evaluation. The guidelines for different groups to judge the operational benefits of bus lanes are also different [15]; the degree of influence of a given factor will also be different for different groups, but the existing evaluation model construction does not consider the influence of subjective factors and only considers the objective influence factors to construct mathematical models.

2.3. Evaluation Methods That Consider Subjective and Objective Weights of Indicators

Through a comprehensive evaluation of multiple indicators in different dimensions, the limitations of a single-index evaluation can be avoided. After mining each index and forming the data system framework, the comprehensive weight evaluation method calculates the subjective and objective weights of each index and finally evaluates the target comprehensively using the weight results. Owing to the different dimensions involved in different factors, the primary objective is to effectively combine the information of different dimensions to form quantitative standards. Based on multi-source data mining technology, Li et al. [16] proposed a data-driven multi-dimensional fusion framework to objectively and accurately evaluate the detailed performance of dynamic bus lanes from the perspectives of passengers, the Chinese government, and operators. Vijay et al. [17] selected key performance indicators (KPIs) affecting the effectiveness of urban public transport from the perspective of passenger travel experience. They used the COPRAS-TOPSIS methodology to determine the weights of different indicators in the evaluation in order to analyze public transport services.
After analyzing and processing the indicators of different dimensions and forming the evaluation index system, it is necessary to calculate the comprehensive weight of each index from the two levels of objective and subjective calculation for different evaluation indicators and determine the importance of each index to the evaluation results.
Common methods of subjective calculation of index weight include the Delphi method and the analytic hierarchy process. The Delphi method is mainly used to score and sort the indexes determined by experts, and the weighted average is then calculated according to the results to obtain the index weight [18]. The analytic hierarchy process has the advantages of systematicness, practicability, and simplicity and is suitable for determining the weight of a complex evaluation index system [19]. In the study of bus lane evaluation, Ali et al. [20] first used the analytic hierarchy process to determine the index weight and then used the TOPSIS method to evaluate bus lanes.
When calculating the subjective weight, the judgment boundaries between adjacent levels are not completely distinct, leading to the inevitable influence of subjective factors when scoring and resulting in randomness in the evaluation results. To mitigate the influence of subjective arbitrariness, Guo et al. [21] introduced fuzzy evaluation into the subjective evaluation methods. Li et al. [22] used the fuzzy comprehensive evaluation method to construct an evaluation model to evaluate the traffic benefits of bus lanes. Ebrahimi [23] combined a fuzzy Delphi method and fuzzy analytic hierarchy process with fuzzy set theory to deal with the uncertainty of opinions and sorted the factors affecting public transport services through customer evaluation. Araz [24] et al. explored and sorted the influencing factors of train collision risk by fuzzy COPRAS and fuzzy DEMATEL methods and evaluated the risk of public transport operation.
The main methods of objective calculation of index weight are the entropy method, principal component analysis method, grey correlation method, and so on. Zhang et al. [25] used the structural entropy weight calculation method to determine the index and the TOPSIS model to evaluate the overall benefit of bus priority implementation. Alkharabsheh et al. [26] used the gray correlation method and analytic hierarchy process to comprehensively evaluate the urban public transport network operation system by combining subjective and objective factors.
After obtaining the index weights, the subjective and objective fusion models are constructed and combined with the subjective and objective weights of each index to perform the target benefit evaluation. Weng et al. [27] used the analytic hierarchy process-maximum deviation method fusion model to solve the weight index and solved the model using the Lagrange function to obtain the bus lane efficiency score. Yang and Chen [28] used the analytic hierarchy process and entropy weight method to calculate the weight of multiple indicators at four levels and constructed a comprehensive evaluation model of bus lane operation benefit using the matter-element method to evaluate the operational benefits of bus lanes. Liu et al. [29] constructed a comprehensive evaluation method for bus lanes from the perspective of bus operations combined with multi-source data.

2.4. Summary of Research Status

Instituting bus lanes can improve the traffic efficiency of public transport but will also have an impact on other vehicles on the road. Therefore, evaluating the traffic benefits brought by bus lanes considers not only the level of bus operation but also the impact of the bus lanes on the flow of general traffic [30]. Integrating the overall operation of general traffic and public transport vehicles can comprehensively and scientifically reflect the traffic operation benefits of bus lanes. Through an in-depth analysis of existing bus lane benefit evaluation research, it can be found that, although there are various indicators considered in the current evaluation, there are also methods to evaluate the comprehensive indicators, but the following deficiencies remain:
(1)
The existing benefit evaluation methods of bus lanes, whether an index evaluation, model evaluation, or a subjective and objective weight comprehensive evaluation method, often only focus on one aspect, that is, only bus operation or social vehicle operation. Few methods consider the joint evaluation of the positive effects of buses and the negative effects of general traffic.
(2)
In the evaluation method integrating subjective and objective weights, after the evaluation model is constructed by integrating the weights of the indicators at the subjective and objective levels, it is usually used directly to evaluate the operational efficiency of bus-only lanes. However, after the weights of multiple indicators are integrated together, there is a relationship of competition or interconstraints between the indicators, which will lead to the failure of indicators to achieve the maximum evaluative value when they are used directly in the operational efficiency evaluation model.
Therefore, in order to evaluate the traffic benefits of bus-only lanes objectively and comprehensively, this study uses radiofrequency identification (RFID), bus global positioning system (GPS), taxi GPS, and other multi-source traffic data as the basis and selects more comprehensive evaluation indicators from the perspectives of buses and general traffic to comprehensively reflect the positive and negative effects of bus-only lane operation. The weights of each index are calculated by combining the subjective and objective comprehensive evaluation methods, and the objective programming model is used to optimize the comprehensive evaluation model of subjective and objective weights so that the evaluative value of the individual indicators is maximized in the fusion model. Based on the improved extension matter-element model, a comprehensive evaluation method for the traffic benefit of bus lanes is proposed to determine the traffic operation benefit level of bus lanes. Several typical bus lanes in Chongqing are selected for research and analysis.

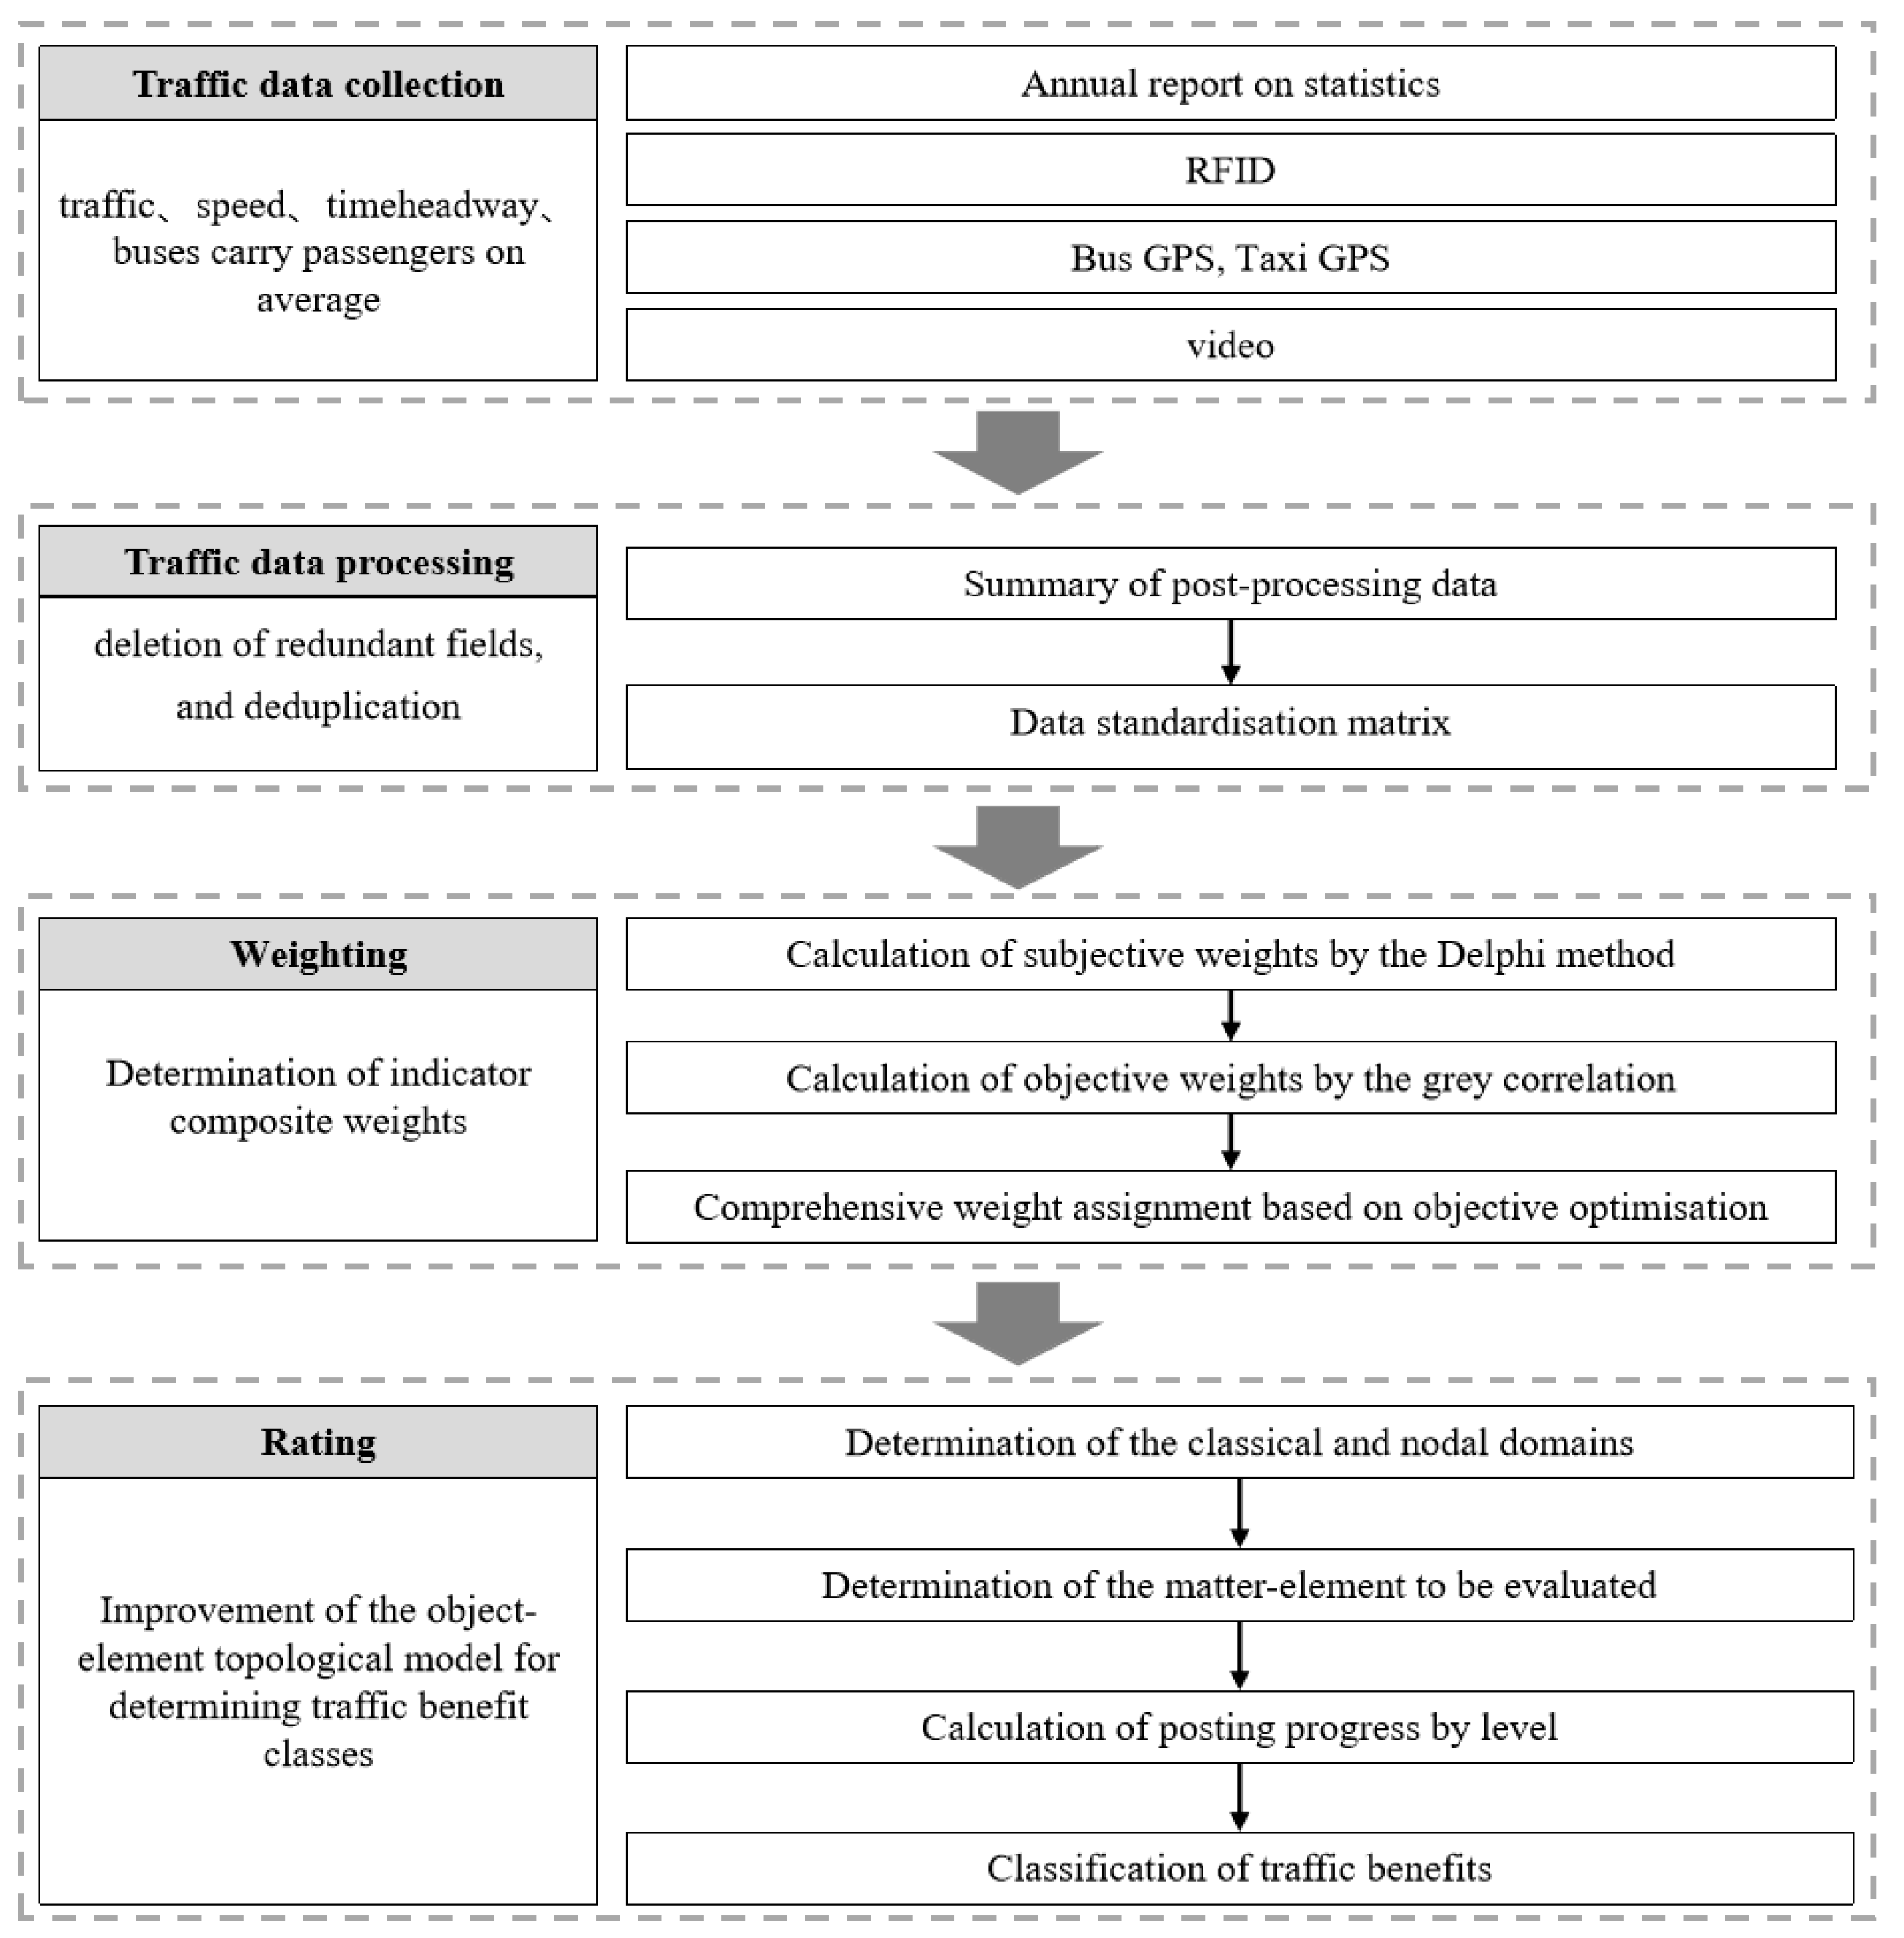
3. Materials and Methods

In the present study, a flowchart is drawn to describe the process of constructing bus lane benefit evaluation ratings using the improved object element topologizable model in conjunction with composite weights (Figure 1).

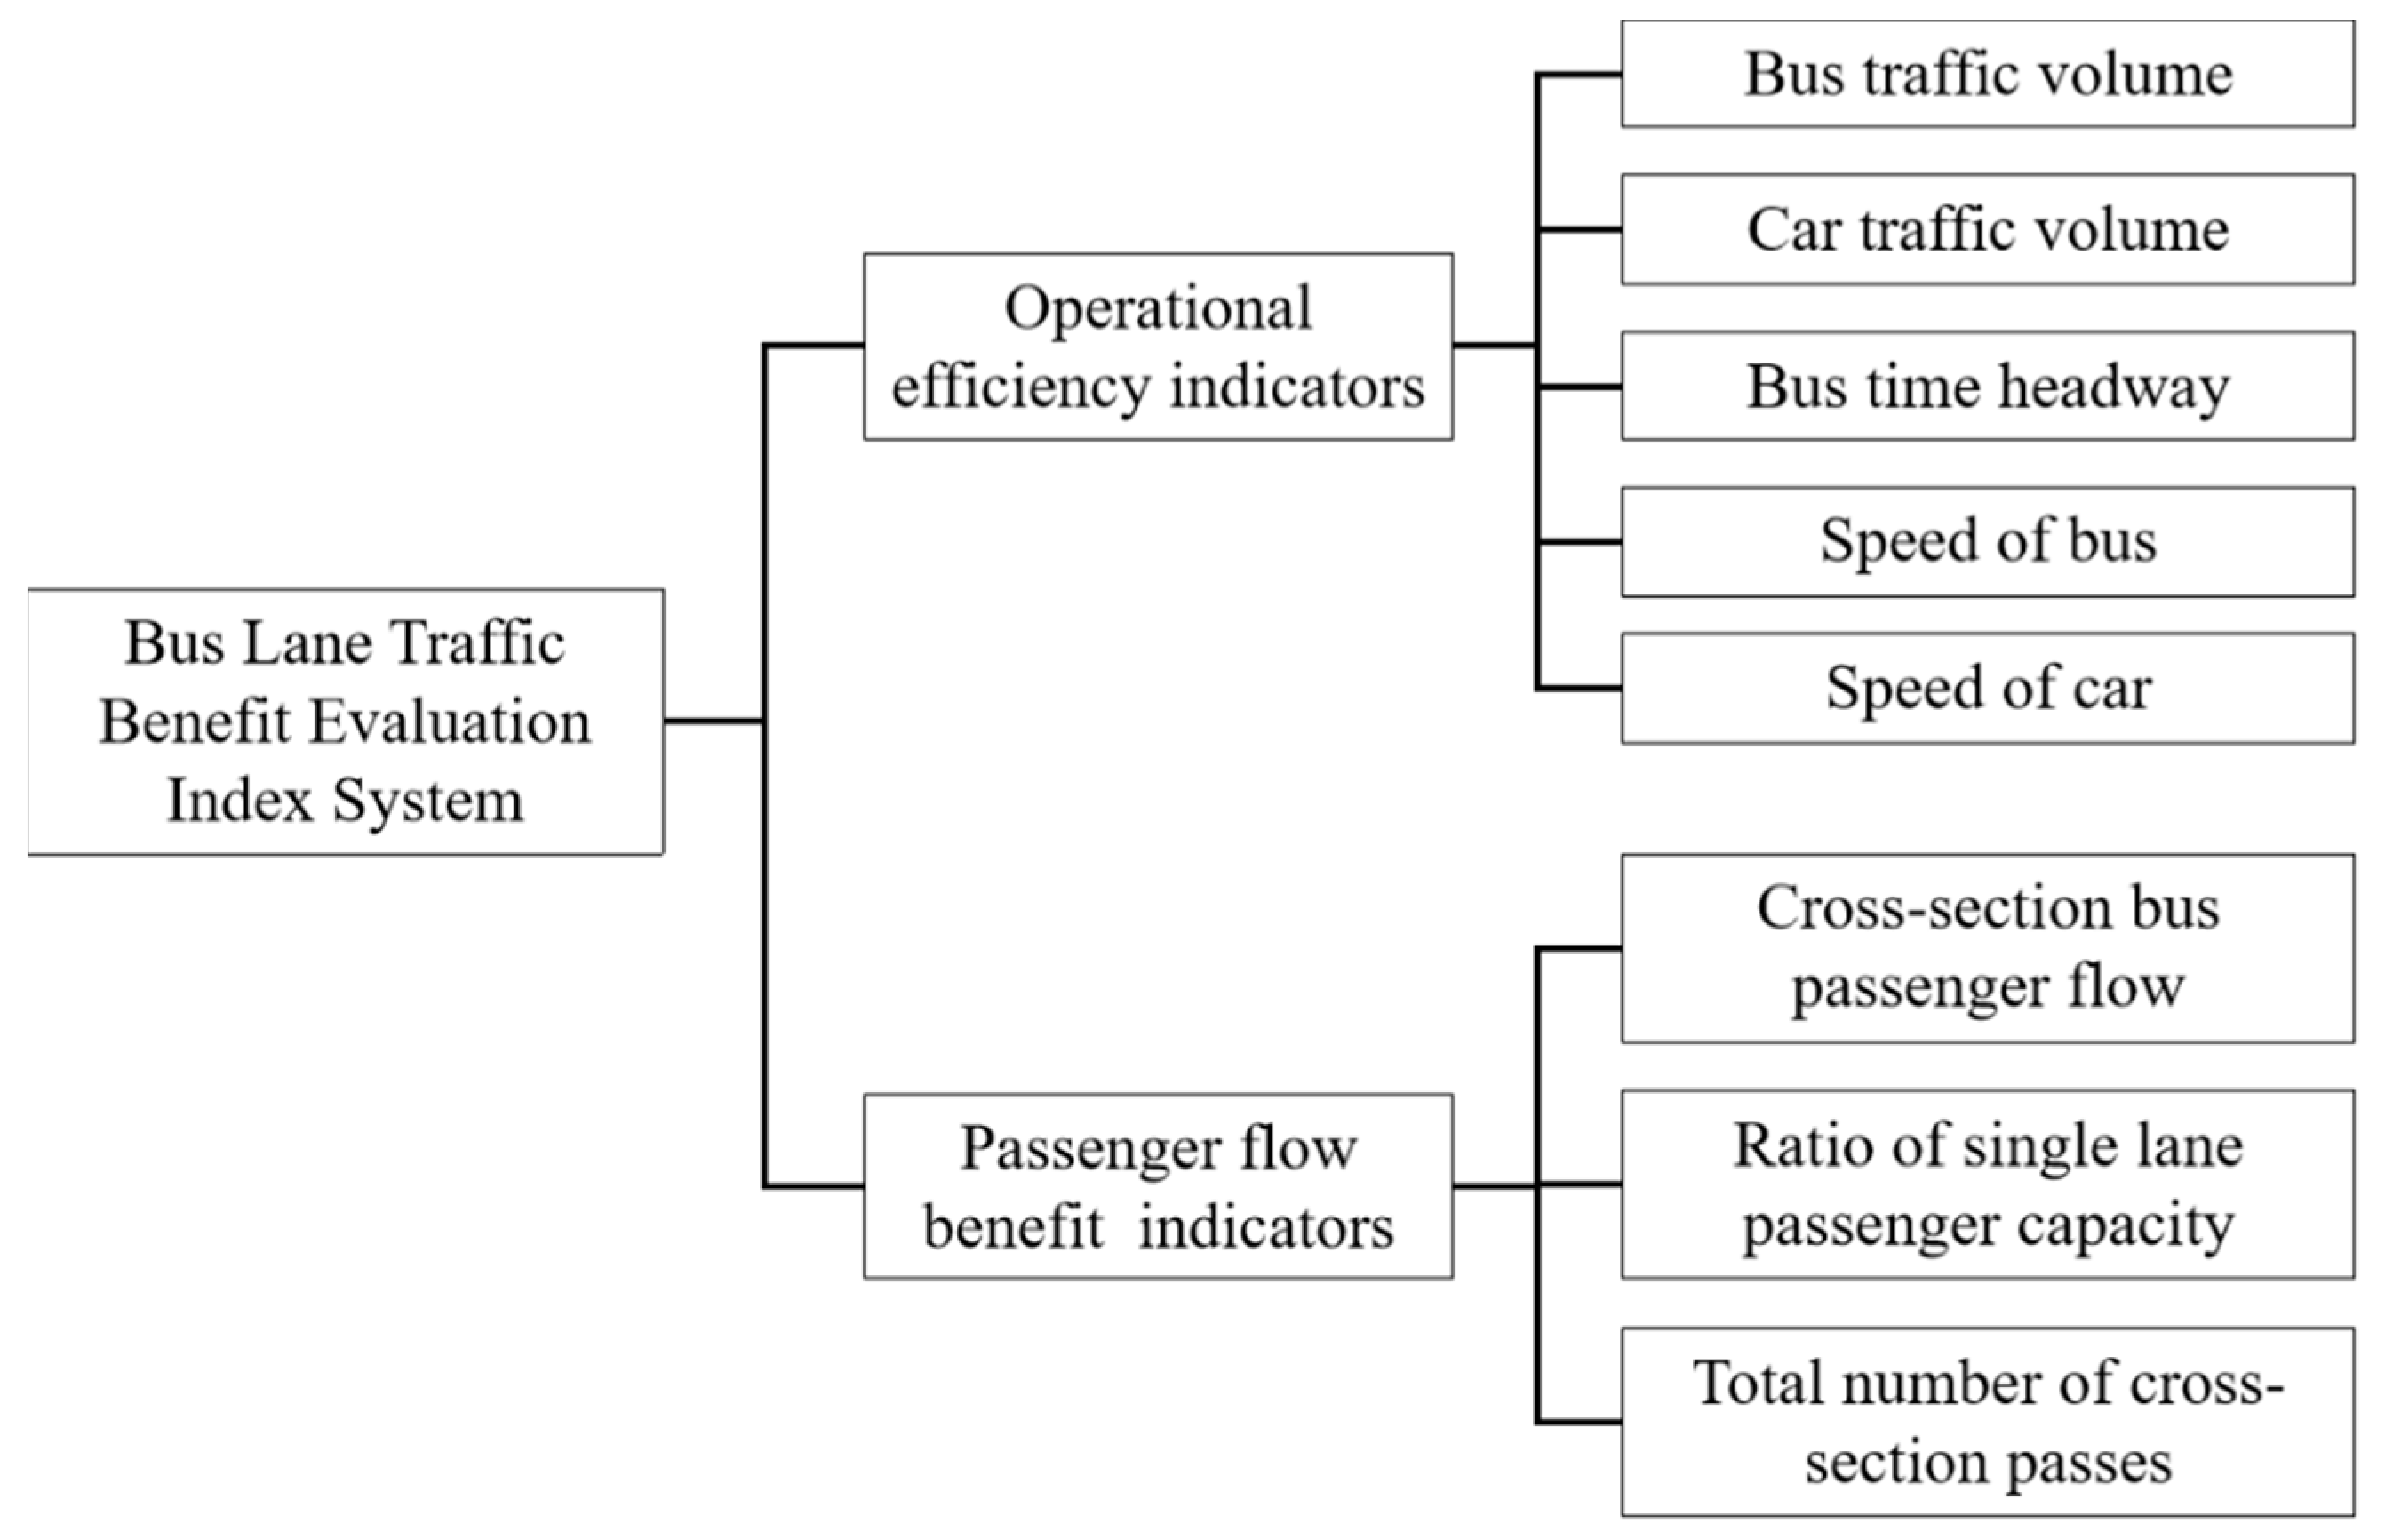
3.1. Indicator System for Evaluating the Traffic Benefits of Bus Lanes

An objective, comprehensive, scientific, and reasonable traffic benefit evaluation index system of bus lanes is helpful for understanding the operation status and traffic improvement effect of urban special road sections and for formulating and optimizing the development plan of urban bus lanes. Aiming at the operation benefit and passenger flow benefit of buses and cars, the influence of the implementation of bus lanes on the overall traffic benefit of the road is comprehensively considered from the perspective of buses and cars, and the comprehensive evaluation index of the traffic benefit of bus lanes is selected.
The passenger flow benefit index includes the passenger flow of the bus section, passenger capacity ratio of a single lane, and total number of passersby. The passenger flow attraction capacity of the dedicated lane was determined from the passenger flow benefit index, and the influence of implementing a dedicated bus lane on the travel mode structure was indirectly clarified.
The operational benefit index mainly considers the traffic, speed, headway, and travel time per unit length. Based on the basic operational parameters of buses and cars, the impact of implementing bus lanes on their traffic benefits can be intuitively understood. The definitions of the indicators are shown below.
(1)
Bus traffic volume: Bus traffic volume refers to the number of buses that pass in the peak hour of a bus priority lane section, which can be obtained by processing bus GPS data.
(2)
Car traffic volume: Car traffic volume represents the number of cars passing on a transit priority roadway segment during the peak hour and can be obtained by processing RFID data.
(3)
Bus time headway: Bus time headway indicates the time difference between the front and rear of two buses passing through the same section during the peak period, which is an important basis for reflecting the capacity and service level of bus lanes.
(4)
Speed of bus: Speed of bus is expressed as the average of bus vehicle trip speeds through the bus lane during the peak hour. Speed of bus can reflect bus lane peak hour operations and delays and can be a direct reflection of the traffic benefits of bus lanes.
(5)
Speed of car: Speed of car is expressed as the average of vehicle trip speeds through the bus lane during the peak hour.
While the operational efficiency index can be directly detected by physical methods such as GPS, RFID, video surveillance, etc., this study focuses more on the number of passengers as a reflection of direct benefits. Therefore, each passenger flow benefit index is defined as follows:
(1)
Cross-section bus passenger flow: The bus peak hour flow on the bus priority road is expressed as the second product of the average passenger number of the bus. The calculation formula is as follows. Due to the limited data source, this paper assumes that the average passenger number of the bus is consistent before and after the implementation of the bus priority road.
P b = Q b p ¯
where P b is cross-section bus passenger flow; Q b is bus traffic volume; and p ¯ is the bus passengers carried on average
(2)
Ratio of single lane passenger capacity: The ratio of bus passenger flow to the passenger capacity of adjacent single social lanes, which expresses the relative passenger capacity of priority lanes and social lanes, reflecting the ability of bus priority lanes to carry commuting passenger flow relative to social lanes, is an important indicator of the overall traffic efficiency of the road. The specific calculation formula is as follows:
K = P b Q c r p c ¯
where K is ratio of single lane passenger capacity; Q c is car traffic volume; r is the proportion of the car traffic volume of the adjacent lanes of the bus lane to the car traffic volume of the road section; and p c ¯ is car passengers carried on average.
(3)
Total number of cross-section passes: Through the section bus passenger flow and the sum of all lanes of car passenger capacity, reflecting the bus priority road passenger transport capacity.
The selected evaluation indicators are shown in Figure 2.

3.2. Calculation of Evaluation Indicator Weights

3.2.1. Calculation of Subjective Weights

Different evaluation indicators have different degrees of influence on the evaluation of the traffic benefits of bus-only lanes; therefore, different weights should be adopted for different evaluation indicators to express their relative importance. In this study, comprehensive weights of the indicators were obtained by combining subjective and objective weighting methods, and the importance of each indicator in the evaluation was clarified.
Using the Delphi method to collect expert opinions is a common method of determining the subjective weights of indicators. Experts sorted the importance of each index according to their professional knowledge: The higher the ranking, the greater the weight [31]. The Kendall coordination coefficient [32] was used to test the consistency of expert scores. The formula for the consistency test is given in Equation (1).
The calculation formula of test statistics W is
W = 12 i = 1 l q i 2 3 h 2 l ( l + 1 ) 2 h 2 l ( l 2 1 )
where q i is the sum of the scores of the i -th index; h is the number of experts; and l is the number of index.
When the scores of each index given by the experts are nearly the same, the value of W is larger and tends to 1. When the scores of each index are inconsistent, the value of W is small and tends to 0. When W value is sufficiently large, the result rejects the invalid hypothesis that the expert scores are not consistent. After passing the consistency test, the formula for calculating the Delphi weight of the index according to the index score matrix q = { q i j , i = 1 , 2 , m , j = 1 , 2 , h } is as follows [33]:
U i D = 2 j = 1 h q i j h l ( 1 + l )
where U i D is the Delphi weight of the i -th index; h is the number of experts; and l is the number of index;

3.2.2. Calculation of Objective Weights

The grey correlation method is an objective weighting method that determines the index weight by calculating the degree of correlation between the comparison sequence (measured value of the index) and reference sequence (optimal value of the index) [34]. Through the grey correlation matrix of the measured and optimal values of the index, the contribution of each index to the optimal effect of the traffic benefit of the bus priority road is calculated, and the weight of each index can be obtained by further normalization. The specific steps of the grey correlation method for solving the objective weight of the evaluation index are as follows [35]:
(1)
Determination of comparison and reference sequences:
The evaluation indexes described in this study are all “max-type” indexes; that is, the larger the index value, the better the evaluation results. The range change method was used to standardize the original index data. The processed index value is between 0 and 1, that is, x i j 0 , 1 . The reference sequence is recorded as X 0 = x 01 , x 02 , x 0 n = 1 , 1 , 1 . The formula for the range variation method for “max-type” indexes is as follows:
x i j = x i j min i x i j max i x i j min i x i j
Assuming n sample data for each indicator, the standardized data matrix for the indicator is
X = x 11 x 12 x 1 n x 21 x 22 x 2 n x m 1 x m 2 x m n
where x i j denotes the i th sample standard value of the j th indicator, i = 1 , 2 , , m , j = 1 , 2 , n .
(2)
Obtaining the difference sequence Δ i j :
Δ i j = x 0 j x i j , i = 1 , 2 , , m , j = 1 , 2 , , n
(3)
Determination of the maximum and minimum differences between the two levels:
M 0 = max i   max j Δ i j
M 0 = min i   min j Δ i j
where M 0 is the minimum difference between the two levels, and M 0 is the maximum difference between the two levels.
(4)
Calculation of the correlation coefficient γ i j :
γ i j = M 0 + σ M 0 Δ i j + σ M 0 , σ 0 , 1 , i = 1 , 2 , , m , j = 1 , 2 , n
where σ is the resolution-function ratio, usually σ = 0.5 .
(5)
Calculation of correlation γ i :
γ i = 1 n j = 1 n γ i j , i = 1 , 2 , , m
where γ i denotes the correlation between the i th indicator and the optimal value. The correlation between the measured and optimal values of each indicator can be calculated using the above steps.
(6)
Calculation of the grey correlation weights of the indicators:
U i G = γ i i = 1 m γ i
where U i G is the grey correlation weight of the i -th indicator.

3.2.3. Calculation of Combined Weights

After determining the subjective and objective weights of the indicators from the perspectives of subjective experience and objective laws of the data, it is necessary to consider the subjective and objective weights simultaneously and use a comprehensive and integrated weighting method to obtain the comprehensive weights of the indicators.
The index weight vector obtained by the subjective weighting method (Delphi method) is U D = ( U 1 D , U 2 D , , U l D ) and satisfies 0 U i D 1 , i = 1 m U i D = 1 ; the index weight vector obtained by the objective weighting method (grey correlation method) is U G = ( U 1 G , U 2 G , , U l G ) and satisfies 0 U i G 1 , i = 1 m U i G = 1 ; φ and ε are the importance degrees of U D and U G . Therefore, the comprehensive weight of the index is expressed as
U = φ U D + ε U G
After the combined weight expression is determined, unitary constraints are considered to determine the values of φ and ε . It is set such that φ and ε satisfy the unitary constraints, as expressed in Equation (12).
φ 2 + ε 2 = 1
The evaluation value of each evaluation object can be calculated according to the weighting principle of multi-attribute decision analysis as follows:
A j = i = 1 m x i j U i = i = 1 m x i j ( φ U D + ε U G ) , j = 1 , 2 , , n
where x i j is the sample value of each index. U i is the combined weights of index.
After determining the comprehensive weight of the traffic benefit evaluation index, the objective optimization method was used to further optimize the comprehensive weight to maximize the comprehensive evaluation value of each evaluation object. The calculation process is as follows. In general, the larger A j is, the better. A multi-objective programming model was constructed as follows:
max   A = ( A 1 , A 2 , , A n )     s . t .   φ 2 + ε 2 = 1 φ , ε 0
Because the evaluation objects compete fairly with each other, and there is no preference relationship, the above multi-objective decision programming model can be synthesized into the following equivalent single-objective optimization model using the equal-weight linear weight sum method:
max   Z = j = 1 n A j = j = 1 n i = 1 m x i j ( φ U D + ε U G )       s . t .   φ 2 + ε 2 = 1 φ , ε 0
where λ is the Lagrange multiplier, making L / φ = 0 and L / ε = 0 . φ is the Subjective weight importance and ε is the Objective weight importance.
j = 1 n i = 1 m x i j U D + λ φ = 0
j = 1 n i = 1 m x i j U G + λ ε = 0
By solving Equations (18) and (19) simultaneously, the optimal solutions φ * and ε * of the optimization model can be obtained as follows:
φ * = j = 1 n i = 1 m x i j U i D / ( j = 1 n i = 1 m x i j U i D ) 2 + ( j = 1 n i = 1 m x i j U i G ) 2
ε * = j = 1 n i = 1 m x i j U i G / ( j = 1 n i = 1 m x i j U i D ) 2 + ( j = 1 n i = 1 m x i j U i G ) 2
To ensure that the comprehensive weight U = ( U 1 , U 2 , U l ) of the index meets the conditions 0 U i 1 and i = 1 m U i = 1 , φ * and ε * must be normalized, that is,
φ ¯ * = φ * / ( φ * + ε * )
ε ¯ * = ε * / ( φ * + ε * )
where φ ¯ * and are the subjective and objective weight importance coefficients of the comprehensive weighting method. By substituting Equations (18) and (19) into Equations (22) and (23), we obtain
φ ¯ * = j = 1 n i = 1 m x i j U i D / j = 1 n i = 1 m x i j ( U i D + U i G )
ε ¯ * = j = 1 n i = 1 m x i j U i G / j = 1 n i = 1 m x i j ( U i D + U i G )

3.3. Improved Matter-Element Extension Model to Evaluate the Traffic Benefit Level of Bus Lanes

After calculating the weights of the different evaluation indexes of bus lanes, the degree of influence of each index on the evaluation was reflected by the weight. The next step is to evaluate the traffic benefits of bus lanes and divide these traffic benefits by synthesizing the information of each index. In this study, a matter-element extension model was used to evaluate and classify the traffic benefits of bus priority roads.
The principle of maximum membership degree adopted by the traditional matter-element extension model [36] cannot reflect the fuzziness of the boundary of the bus priority road in some cases, and it is easy to lose information, which leads to a deviation in the evaluation results [37]. Therefore, to obtain more accurate evaluation results, this study refers to the closeness criterion [38] to replace the maximum membership degree principle and improve the traditional matter-element extension model. The traffic benefit evaluation of bus priority roads can be expressed as matter-element = (traffic benefit grade, evaluation index, evaluation index value of bus priority road), recorded as J = ( B , C , D ) . The basic steps of the traffic benefit evaluation of a bus priority road based on the improved matter-element extension model are as follows.
(1)
Determination of the classical and nodal domains:
J j = ( B j , C j , D i j ) = B j c 1 d 1 j   c 2 d 2 j     c m d m j = B j c 1 a 1 j , b 1 j   c 2 a 2 j , b 2 j     c m a m j , b m j
where B j is the j - th evaluation grade; c 1 , c 2 , , c m is the m - th index of B j ; d 1 j , d 2 j , , d m j is the range of B j corresponding to c 1 , c 2 , , c m , that is, the classical domain; and a i j and b i j are the value boundaries of d i j .
J τ = ( B , C i , D τ i ) = B c 1 d τ 1   c 2 d τ 2     c l d τ l = B c 1 a τ 1 , b τ 1   c 2 a τ 2 , b τ 2     c l a τ l , b τ l
where B is the entire evaluation system level and d τ 1 , d τ 2 , d τ l is the node domain corresponding to each evaluation index.
(2)
Determination of the matter-element to be evaluated:
J 0 = B 0 , C i , D i = B 0 c 1 d 1   c 2 d 2     c m d m
where J 0 is the matter element to be evaluated, and d 1 , d 2 , , d m are the measured data of B 0 with respect to c 1 , c 2 , , c m , respectively.
(3)
Determination of the closeness value of each index in the system to be evaluated for each grade:
The degree of closeness is classified into two categories: symmetric and asymmetric [31]. In this study, an asymmetric degree of closeness is proposed.
O = 1 1 m ( m + 1 ) i = 1 m Θ U i
where O is the degree of closeness, Θ is the distance, and U i is the weight.
Furthermore, the degree of closeness of the system to be evaluated for each grade can be obtained using
O j ( B 0 ) = 1 1 m ( m + 1 ) i = 1 m Θ j ( d i ) U i
where Θ j ( d i ) = d i a i j b i j 2 1 2 ( b i j a i j ) is the distance between the matter-element B 0 to be evaluated and the classical domain.

3.4. Traffic Benefit Value Classification Model of Bus Lanes

The traffic benefit levels before and after the implementation of bus lanes can be obtained using the improved matter-element extension evaluation model. However, when the evaluation levels before and after the implementation of bus lanes, or between different bus lanes, are the same, it is difficult to compare the traffic benefit effects of bus lanes at the same level. Therefore, by considering the combination of the evaluation grade obtained by the matter-element extension model and the traffic benefit value, the traffic benefit value and evaluation grade of the bus lane can be obtained simultaneously, and the traffic benefit value can also be graded.
The traffic benefit value of the bus lane can be obtained based on the standardized value and weight of each evaluation index as follows:
A j = i = 1 m x i j U i = i = 1 m x i j φ ¯ * U i D + ε ¯ * U i G
where A j 0 , 1 is the traffic benefit evaluation value of the j - th bus lane.
According to the improved matter-element extension evaluation model, the corresponding evaluation grade of A j is j . Based on the traffic benefit value and evaluation grade of each bus lane, the range of traffic benefit value under each grade can be determined to classify the traffic benefit value. The evaluation grade obtained by the matter-element extension model is used to classify the evaluation value, which integrates the evaluation grade of each index of the special lane, avoids the strong subjectivity of directly classifying the evaluation value, and enhances the objectivity and scientificity of the classification of traffic benefit values. Therefore, for other bus lanes that need to be evaluated for traffic benefits, the evaluation level can be obtained by calculating the traffic benefit value; however, the evaluation level need not be obtained by improving the matter-element extension evaluation model, which greatly reduces the workload.

4. Results and Discussion

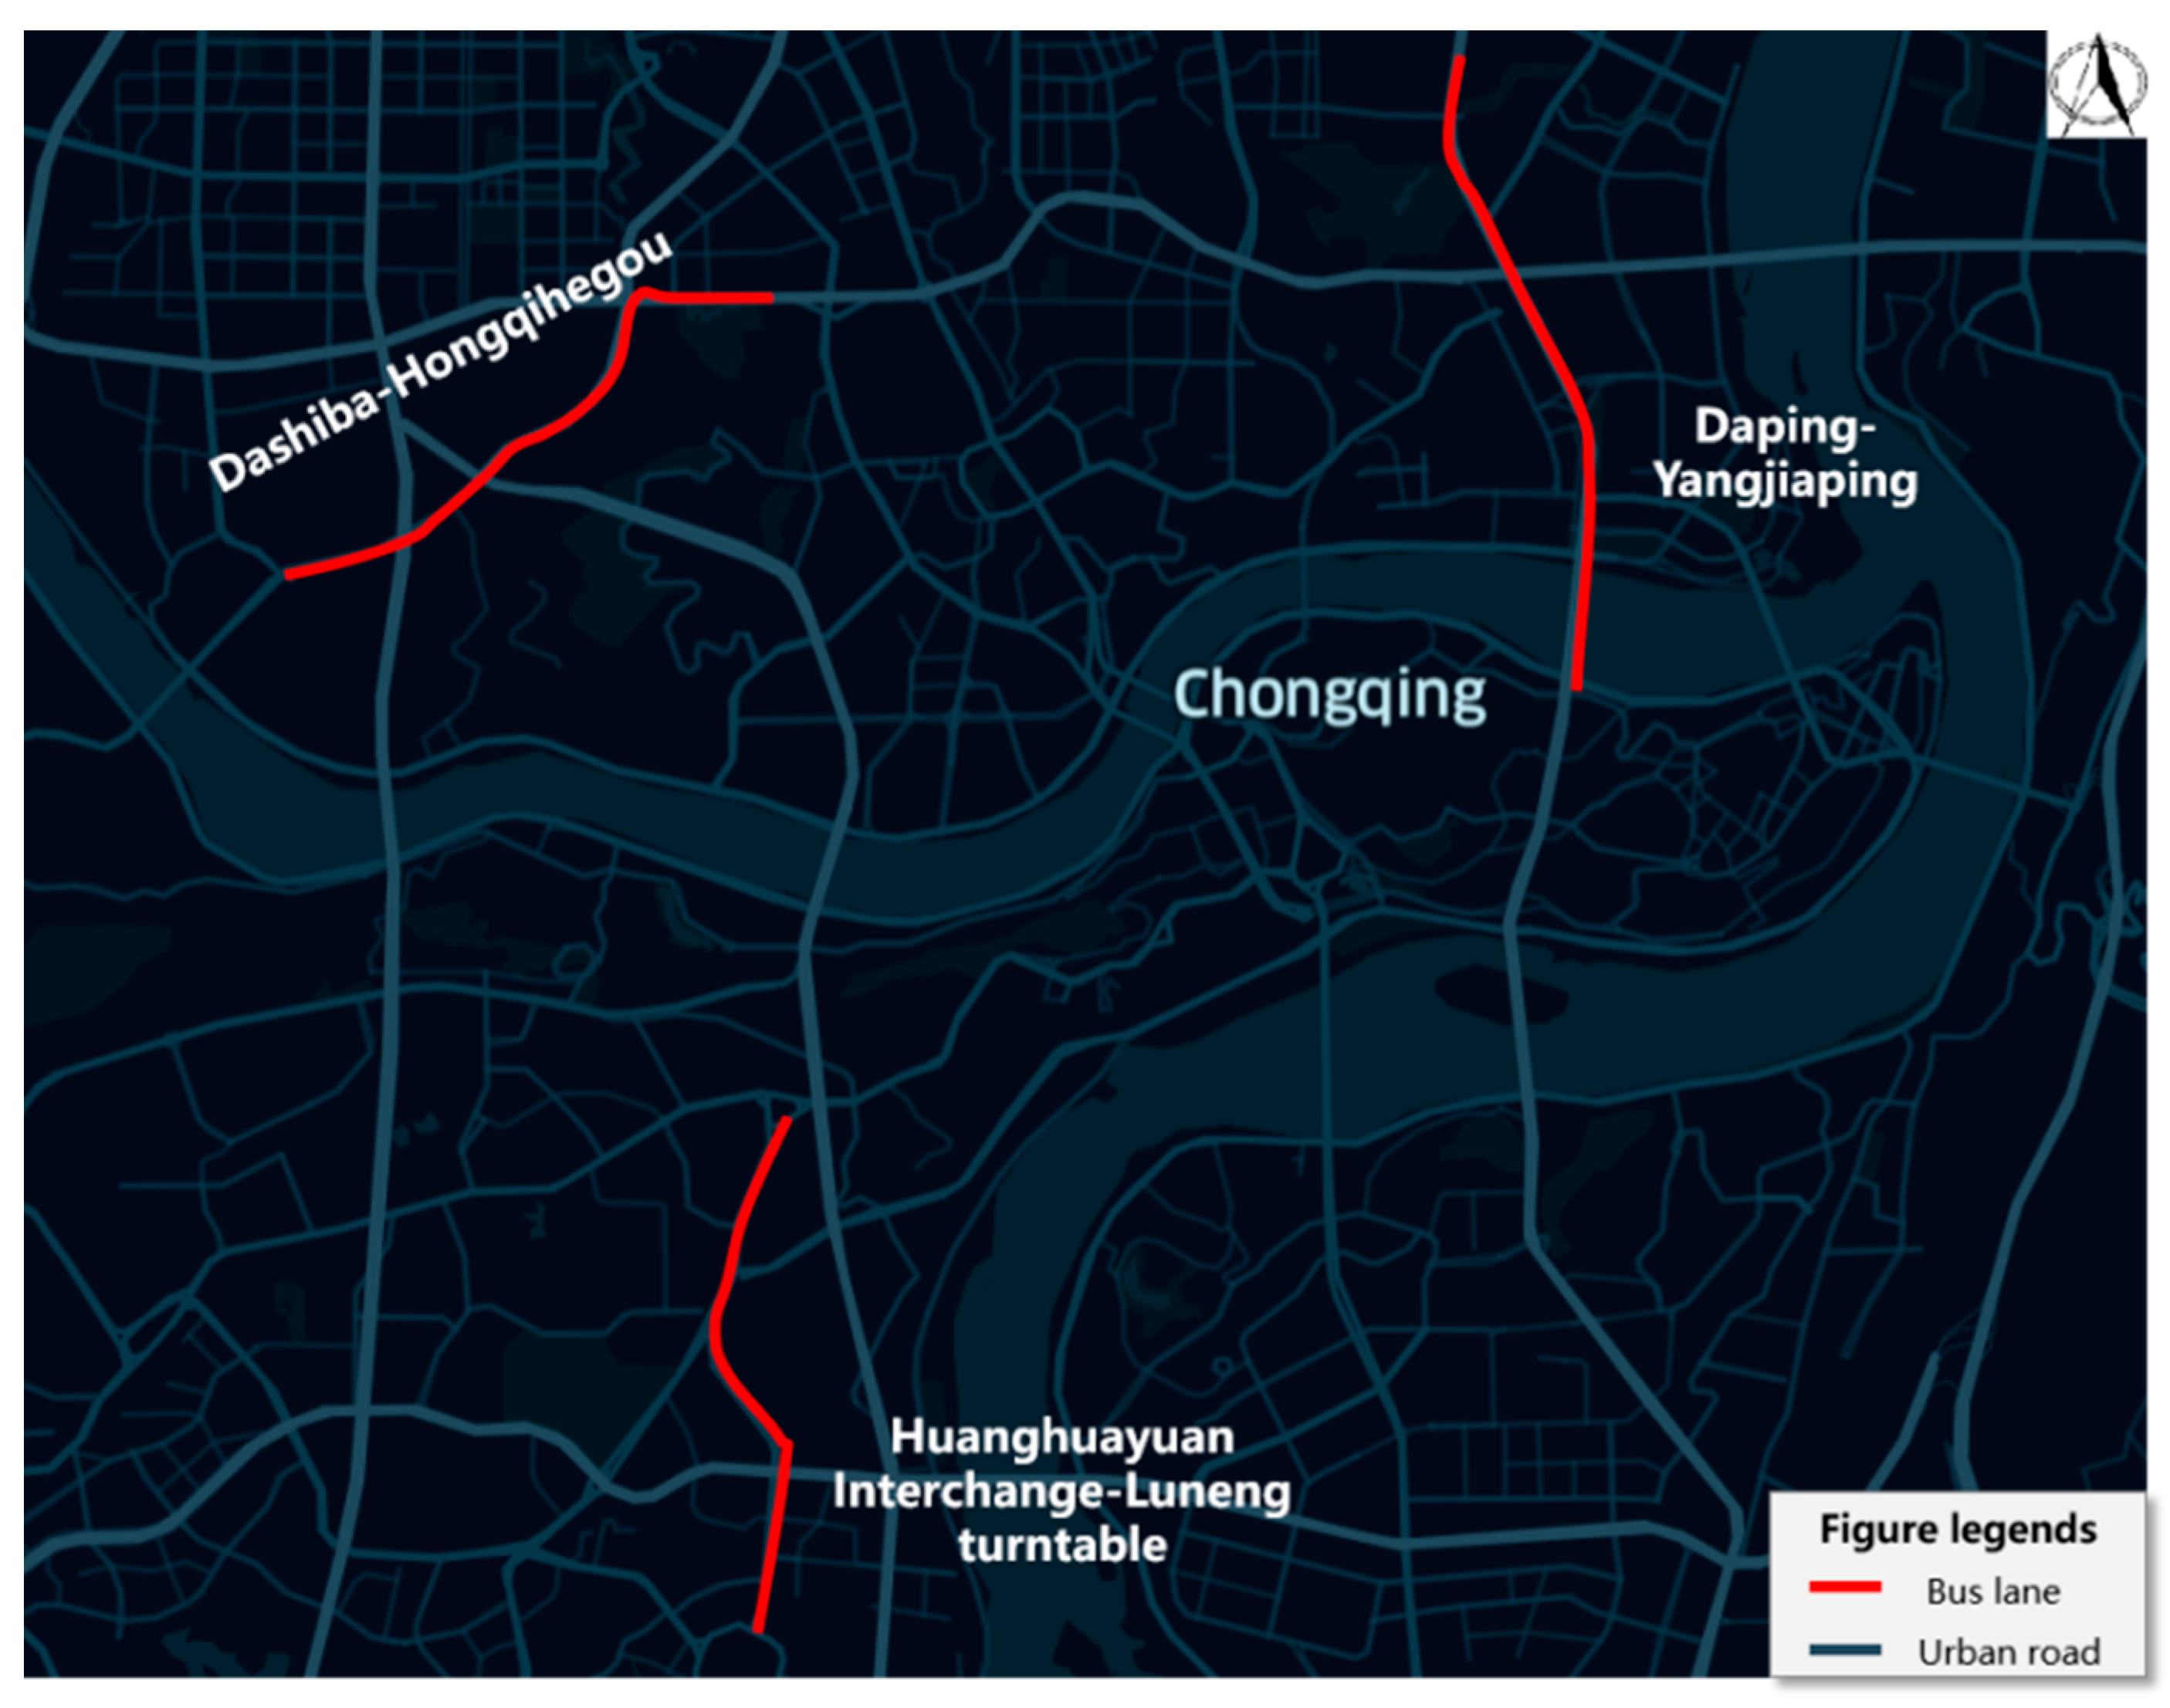
4.1. Research Objects and Data

The Daping-Yangjiaping, Huanghuayuan interchange-Luneng turntable, and Dashiba-Hongqihegou bus lanes in the main urban area of Chongqing (Figure 3) were selected as research objects, and relevant evaluation index data were collected. The basic descriptions of each bus lane are listed in Table 1.
The RFID, bus GPS, and rental car GPS data of the three selected road sections were collected three days before and five days after the implementation of the bus lanes. After preprocessing, including target data extraction, deletion of redundant fields, and deduplication, 48 sets of index sample data were obtained. Example data are shown in Table 2. The full set of data for the indicators is shown in Table A1.

4.2. Evaluation Index Weight Calculation

In order to ensure the objectivity and professionalism of the subjective weight calculation of the index, 32 experts from different fields were invited to participate in the evaluation and scoring. The experts cover many disciplines such as transportation engineering, transportation, urban planning, economics, management, and so on. They all have a doctoral degree or above and have rich scientific research experience and remarkable academic achievements in their respective fields. The experts come from universities and scientific research institutions and enterprises and serve as professors, associate professors, researchers, or senior engineers. They have profound professional knowledge and research ability, which provides authority and reliability guarantee for the evaluation of this study.
The typical ranking opinions of 32 relevant experts on eight evaluation indexes were obtained (Table 3). The full set of data for the indicators is shown in Table A2. The Kendall coordination coefficient was 0.23, and the chi-square value was 50.69. The chi-square critical value χ 0.05 ,   7 2 = 14.067 with a significance level of 0.05; and seven degrees of freedom was obtained by querying the chi-square boundary value table.
Therefore, it can be considered that at the level of α = 0.05 , the typical ranking of the eight indicators by experts is consistent. On this basis, the Delphi weights of the cross-section bus passenger flow, ratio of single-lane passenger capacity, total number of cross-section passes, bus traffic volume, car traffic volume, bus headway, speed of bus, and speed of car indicators were calculated as follows:
U D = ( 0.15 , 0.13 , 0.16 , 0.15 , 0.07 , 0.11 , 0.14 , 0.09 )
The range change method was used to standardize the index sample data. Some of the data are shown in Table 4.
According to the eight sets of standardized data for the eight different evaluation indicators obtained from Table 5, the standardized data matrix of the indicators was constructed as follows:
X = 0.215 0.344 0.129 0.125 0.487 0.581 0.531 0.674 0.129 0.297 0.791 0.025 0.504 0.492 0.603 0.648 0.194 0.305 0.949 0.075 0.558 0.475 0.642 0.51 0.864 0.253 0.928 0.225 0.73 0.603 0.771 0.548
The standardized data of the indicator samples were considered a comparison sequence, and the degree of association of the remaining reference sequence X 0 = 1 , 1 , 1 was calculated.
The cross-section bus passenger flow, ratio of single-lane passenger capacity, total number of cross-section passes, bus traffic volume, car traffic volume, bus time headway, speed of bus, and speed of car indicators were calculated, and the degree of correlation with the optimal value was 0.649, 0.451, 0.605, 0.582, 0.551, 0.417, 0.412, and 0.482, respectively. The grey association weight was calculated as follows:
U G = ( 0.16 , 0.11 , 0.14 , 0.14 , 0.13 , 0.10 , 0.10 , 0.12 )
Based on the comprehensive integration weighting method of objective optimization, the subjective and objective normalized weight coefficients obtained using the subjective and objective weights U D and U G were 0.496 and 0.504, respectively, and the subjective and objective comprehensive weights of the cross-section bus passenger flow, ratio of single-lane passenger capacity, total number of cross-section passes, bus traffic volume, car traffic volume, bus time headway, speed of bus, and speed of car indexes were obtained, respectively, as follows:
U = 0.16 , 0.12 , 0.15 , 0.14 , 0.10 , 0.11 , 0.12 , 0.10
Traffic benefit evaluation and classification of bus lanes
An improved matter-element extension evaluation model was used to comprehensively evaluate the traffic benefits of bus lanes. First, the numerical range of each evaluation index was determined by referring to the data sample, the research report “Research on Operation Evaluation and Optimization Method of Bus Lane in Chongqing Main Urban Area Based on Traffic Data”, and the relevant normative standards. The index value was then divided into five intervals (grades): {excellent, good, medium, neutral, and poor}, that is, the classical domain. The numerical range of the index and grade range are listed in Table 5.
By processing RFID, bus GPS, and rental GPS data, the statistical data of the evaluation index of the bus lane in the case study were obtained, as shown in Table 6, that is, the matter-element to be evaluated. The change of each index with the implementation of bus lanes is shown graphically in Figure 4.
Based on the comprehensive weight of the traffic benefit evaluation index of the bus lane, the degree of closeness between the traffic benefit of the bus lane and each evaluation level was calculated; results are shown in Table 7.
According to the principle of maximum closeness, the evaluation grade of the traffic benefit before and after the implementation of each bus lane was obtained, as shown in Table 8. It can be seen that there is no change in the traffic benefit grade before and after the implementation of each bus lane. The traffic benefit grades before and after the implementation of the Daping-Yangjiaping, Huanghuayuan interchange-Luneng turntable, and Dashiba-Hongqihegou bus lanes were medium, excellent, and good, respectively.
To compare the traffic benefit at the same level, based on the index weight and index standardization data, the traffic benefit value before and after the implementation of the bus lane was calculated, as shown in Table 8.
It can be seen that there is no change in the traffic benefit value and evaluation grade of the road section before and after the implementation of the Daping-Yangjiaping bus lane, so the implementation of the bus lane has no obvious effect on the traffic benefit of the road section. The grade of the road section before and after the implementation of the Huanghuayuan interchange-Luneng turntable bus lane was excellent, and the traffic benefit value increased from 0.63 to 0.66. The implementation of the bus lane improved the traffic benefit of the road section. The grade of the road section before and after the implementation of the Dashiba-Hongqihegou bus lane was good, and the traffic benefit increased from 0.55 to 0.56. It can be seen that the implementation of the bus lane improved the traffic benefit of the road section, but the effect was not significant.
By studying the traffic benefit value and grade of bus lanes using various examples, the traffic benefit value can be graded, as shown in Table 9. Therefore, for bus lanes that need to be evaluated for traffic benefit in the future, the traffic benefit level of the bus lanes can be directly determined according to the traffic benefit value, which avoids the complex process and large calculation amount of solving the traffic benefit level using the matter-element extension model.

5. Analysis

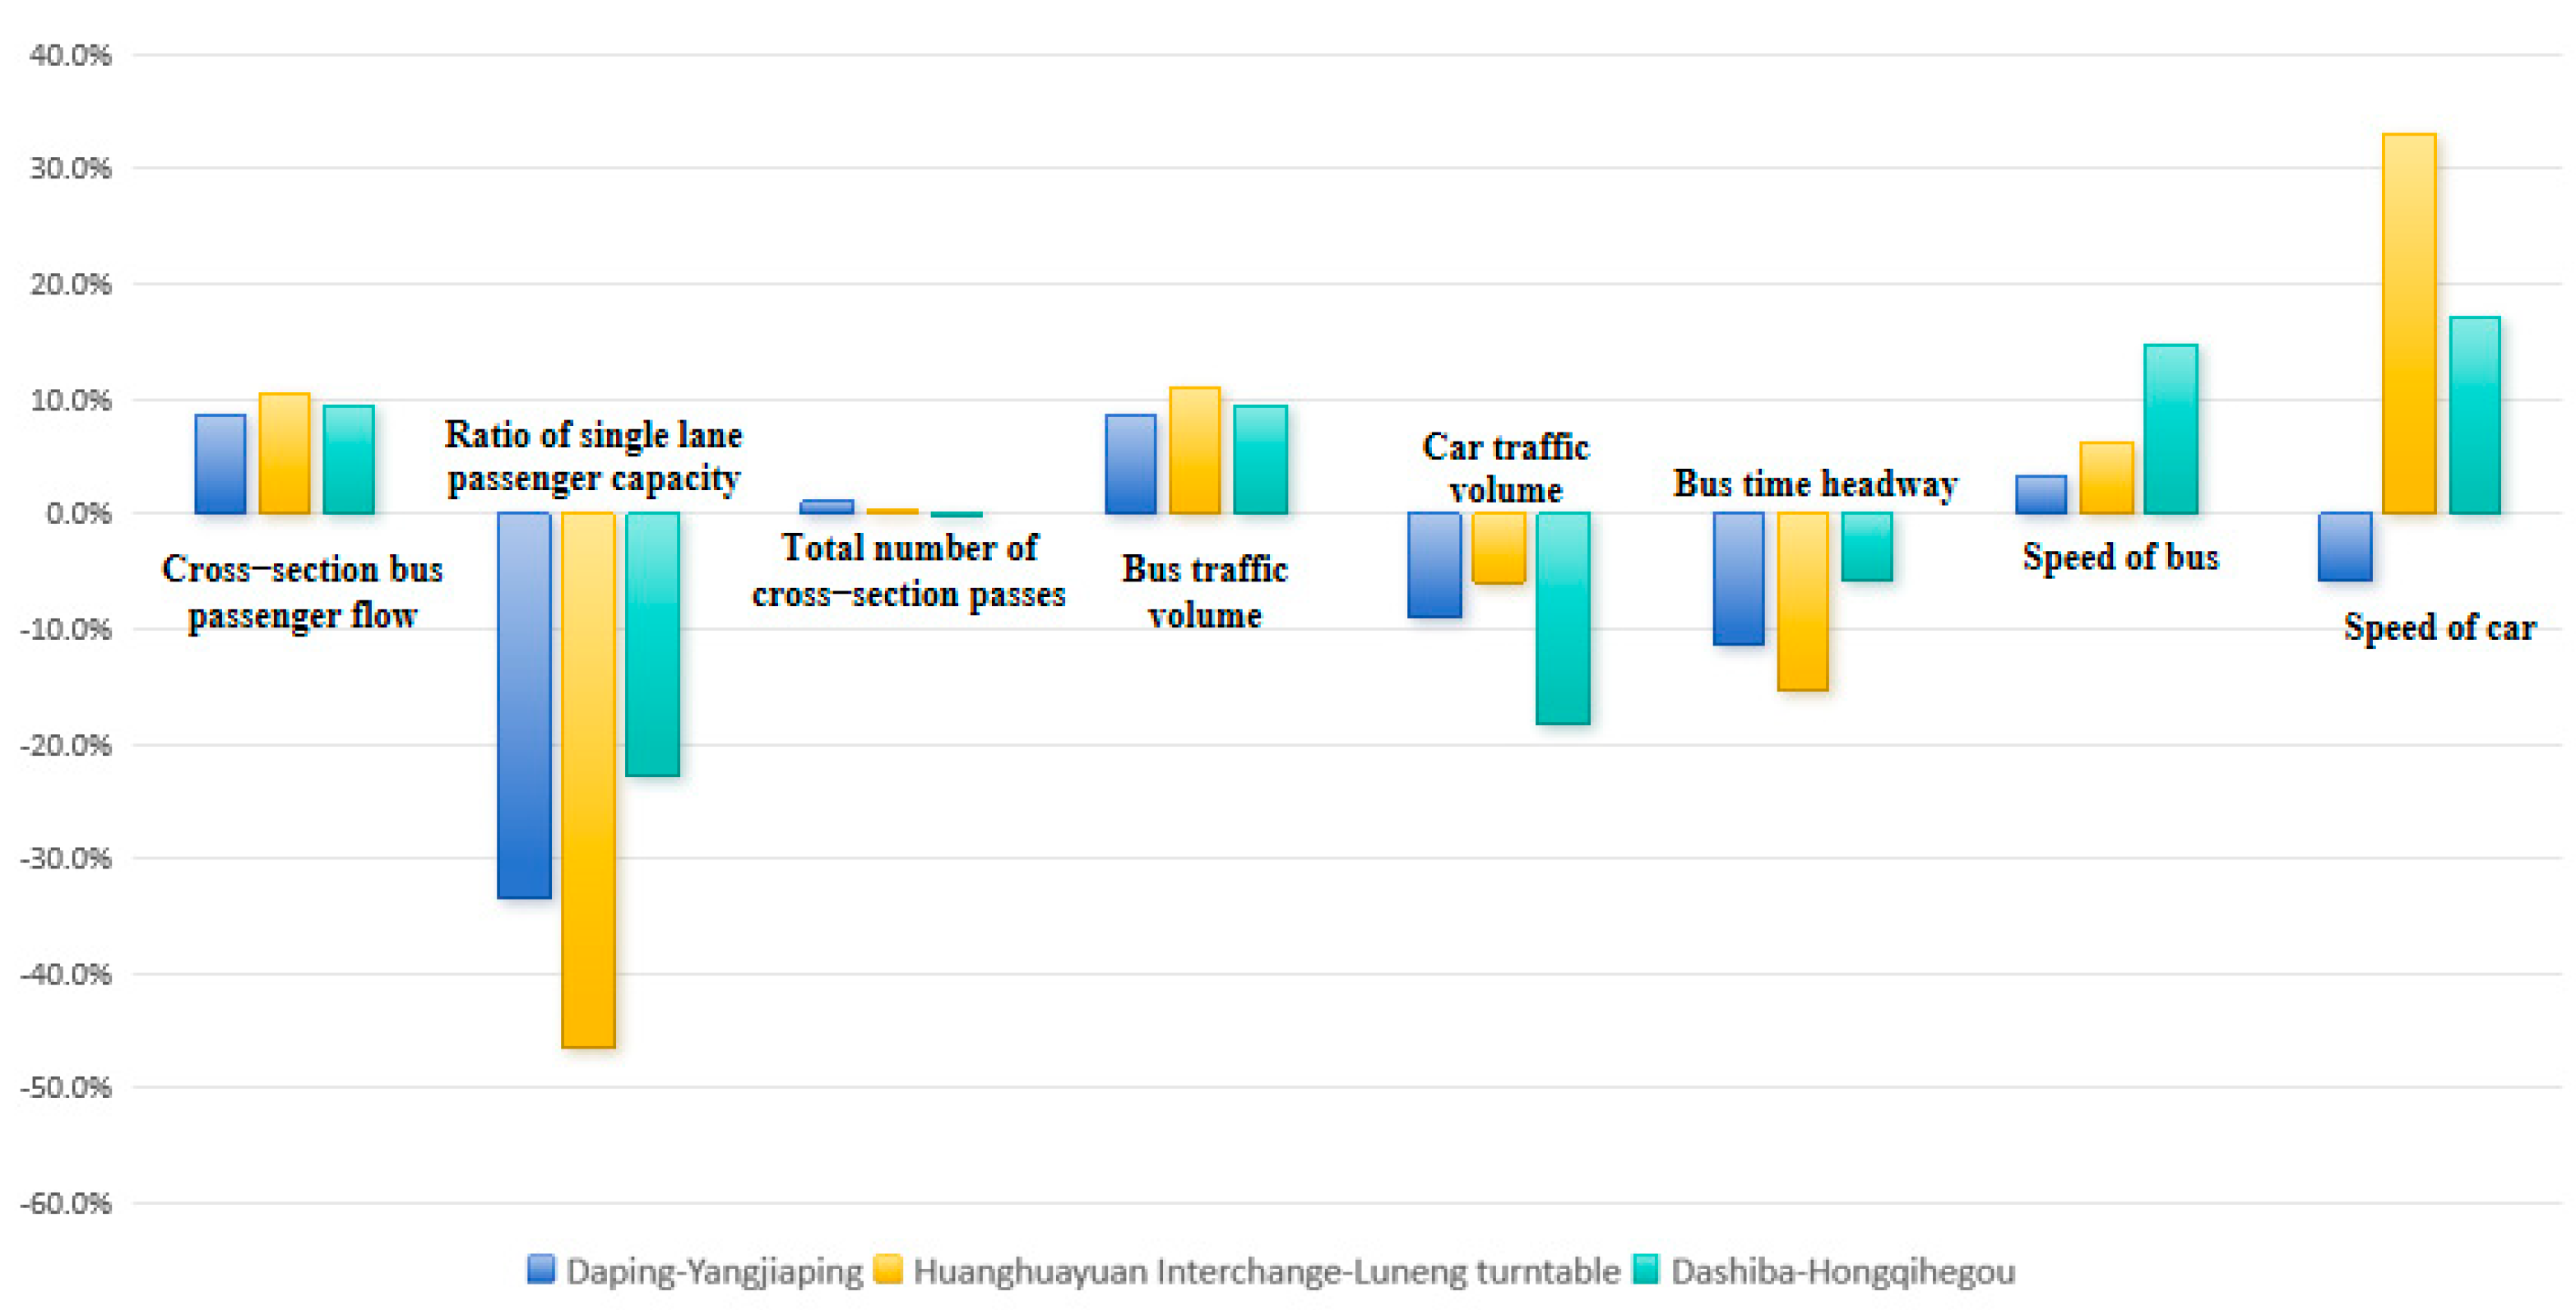
5.1. Analysis of the Change of Bus Lane Index

The grades for the ratio of single-lane passenger capacity and bus time headway changed, whereas the grades for the remaining indicators remained unchanged. This is because the range of values for the indicators of the single-lane capacity ratio and headway is small, and it is easy to differentiate between the levels of the indicators and to make breakthroughs, whereas the range of values for the rest of the indicators is large, and it is not easy to make breakthroughs.
The ratio of single-lane passenger capacity deteriorated by one grade in each case studied. The single-lane passenger capacity ratio of the Daping-Yangjiaping bus lane changed from 5.43 to 3.61, and the grade changed from medium to neutral. The bus lane of the Huanghuayuan interchange-Luneng turntable was reduced from 3.03 to 1.62, and the grade changed from neutral to poor. The Dashiba-Hongqihegou bus lane changed from 7.52 to 5.81, and the grade changed from good to medium. The reason for this phenomenon is that, because of the implementation of the bus lane, the cars in the right lane are forced to transfer to the left, and at the same time, part of the passenger capacity of the right lane is removed, which leads to a reduction in the passenger capacity ratio between the right lane and the middle lane and reduces the passenger capacity ratio of the single lane of the bus lane. Therefore, from the perspective of the entire traffic operation, the implementation of bus lanes has reduced the utilization rate of the right lane to a certain extent.
Regarding the change in bus headway grade, except for the bus time headway grade of the Dashiba-Hongqihegou bus lane, which did not change, that of the other two bus lanes increased by one grade. Among them, the Daping-Yangjiaping bus lane changed from poor to neutral, and the Huanghuayuan interchange-Luneng turntable bus lane changed from neutral to medium. This is because the implementation of bus lanes improves the operating efficiency of buses, reduces their headway, and improves the utilization rate of buses in the right lane.

5.2. Overall Operation Analysis of Bus Lanes

Different bus lanes will have different operational indicators and therefore need to be judged by a combination of multiple indicators. The implementation of bus lanes can have either a positive or negative impact on vehicle within the road section. The specific impact depends on the basic conditions and operation of the road section and needs to be analyzed accordingly.
After the implementation of the Daping-Yangjiaping bus lane, the increase in cross-section bus passenger flow and bus speed was the least among the three bus lanes, but this is not obvious. After the implementation of bus lanes, the speed of cars declined, which shows that the implementation of bus lanes squeezed the passage of general traffic, resulting in a decline in their efficiency. On the other hand, because of the large number of roadside openings and intersecting branches, the need for cars to enter and leave the main road is large, and the implementation of bus lane roads has a greater impact on it, so it is easy to reduce the speed of cars. While causing the greatest decline in general traffic, the efficiency of bus operation is not greatly improved, which leads to the lowest operating efficiency of the bus lane among the three cases, which is also consistent with the evaluated grade and traffic benefit value.
After the implementation of the Huanghuayuan interchange-Luneng turntable bus lane, the index grade was neutral or poor only in the ratio of single-lane passenger capacity and excellent for the total number of cross-section passes and car traffic volume, which indicates that the bus lane is in good condition. During the peak period, the total number of people passing through and the flow of cars passing through were excellent. The increase in car speed and decrease in bus time headway were the largest. The bus time headway, bus speed, and car speed after the bus lane introduction were the largest among the three cases. In addition, in this case, the increase in vehicle speed after setting up bus lanes is also the largest. This is because the road section is mainly composed of bridges and interchanges. There are few roadside openings and cross branches, and the number of vehicles driving into and out of the main road is small. Therefore, the setting of bus lanes has little interference with vehicles entering the main road. On the other hand, bus lanes can improve the traffic efficiency of buses and reduce the stagnation time of buses in mixed traffic flow. This indirectly reduces the impact of buses on the passage of other vehicles and increases the overall road speed. The driving order of the car is improved, thereby significantly increasing the speed of the car. A comprehensive analysis of these characteristics shows that the operational benefit of the bus lane is relatively good, the traffic benefit value based on the evaluation model is the largest among the three cases, and the grade is excellent.
After the implementation of the Dashiba-Hongqihegou bus lane, the neutral or poor evaluation indicators were bus speed, car flow, and car speed. These three indicators ranked last in the analyzed cases. The excellent indicator was the cross-section bus passenger flow, which is far greater than the other two cases, showing that the weak link of the bus lane operation is mainly the speed, and the key advantage is the cross-section bus passenger flow. Through a comprehensive analysis, it was found that the implementation of bus lanes has an impact on public transport and general traffic. The overall traffic efficiency was good and was at the middle level in all three cases.

5.3. Comparative Analysis of Traffic Benefits before and after the Setting of Bus Lanes

There is no change in the traffic benefit value and evaluation grade of the road section before and after the implementation of the Daping-Yangjiaping bus lane, indicating that the bus lane has had no obvious effect on the traffic benefit of this road section. This is because the road section is connected to many feeder roads, and the continuous entry and exit of the main line is significantly affected by the rightmost bus lane. Additionally, the Daping-Yangjiaping section connects two commercial areas, resulting in a large amount of car traffic volume during peak hours, making it difficult for the original road to meet the huge traffic demand. When the bus lane was set up, the operation of cars was further squeezed. Although the establishment of bus lanes in this area improved the traffic efficiency of buses, it had a greater adverse impact on the driving of other vehicles, so the overall traffic operation efficiency did not change. Follow-up control methods should focus on improving the weak link of the mainline car running speed to enhance traffic benefits.
The grade of the road section before and after the implementation of the Huanghuayuan Interchange-Yulu turntable bus lane is excellent, and the traffic benefit value increased from 0.63 to 0.66. It can be seen that the implementation of the bus lane improved the traffic benefit of the road section. The grade of the road section before and after the implementation of the bus lane of Dashiba-Hongqihegou is good, and the traffic benefit value increased from 0.55 to 0.56. It can be seen that the implementation of the bus priority road has improved the traffic benefit of the road section, but the effect is not obvious.
Therefore, the setting of bus lanes needs to be considered from the two competitive aspects of bus operation efficiency and vehicle operation efficiency. The bus lanes will reduce the driving space of cars while improving the efficiency of bus operation. When the number of cars on the road is large, and the road is easily affected by the vehicles entering and leaving the secondary branch, the setting of the bus lane may not bring about the improvement of traffic efficiency.

5.4. Comparing with Existing Studies

The classification of five transportation benefit evaluation levels proposed in this study is consistent with the results obtained by the existing public transportation evaluation studies using matter-element extension models [21,27,28], which are divided into five transportation benefit levels. In order to ensure that the calculation of each indicator can be scientific, objective, and applicable to a wider range, the comprehensive weight method combining subjective weight and objective weight is often adopted when evaluating the operation benefit of public transportation using the physical element extension model. Through the calculation of comprehensive weight assignment, it can be found that cross-section bus passenger flow occupies a larger weight, indicating that the passenger flow benefit index is an indicator with higher attention in the evaluation of bus lane benefits. This is also consistent with the research of Yang et al. [28]: passenger carrying capacity occupies a larger weight in the evaluation indicators of bus lanes. In terms of the weight of the bus speed indicator, this study calculated a larger weight than Yang’s study. This is because this study focuses more on the evaluation of the traffic operation efficiency of bus lanes, while Yang’s study comprehensively evaluates from multiple aspects such as comfort, environmental factors, and traffic factors. In addition, this paper divides speed into bus speed and car speed. The car speed indicator is relatively less important, while the bus speed can directly reflect the operation of the bus lane, so it is given a higher weight. Finally, the calculation of the comprehensive indicator weight is improved through the target optimization method to give full play to the greater benefits of each indicator.
Similarly, after our study, we found that it is not the case that the better the value of the indicator with a larger weight, the better the traffic efficiency. In the three study cases, although the cross-section bus passenger flow and ratio of single-lane passenger capacity indicators in the Dashi-ba-Hongqihegou area are higher than the Huanghuayuan inter-change-Luneng turntable, the weight is also higher. Because the speed of car indicator of the former is more than twice lower than that of the latter, this also causes the traffic efficiency indicator of the Dashi-ba-Hongqihegou area to be affected, and the final traffic efficiency level is higher than that of the Huanghuayuan interchange-Luneng turntable, which is one level lower. This also reflects the advantage of the matter-element extension model in evaluation, which can find weak indicators and reflect the impact of weaknesses on the overall situation [39].

6. Conclusions

Based on multisource traffic data, this study conducted a data-driven bus lane traffic benefit evaluation index analysis and proposed a comprehensive evaluation method. The main results are as follows.
(1)
Multisource data were used to select the evaluation index from the perspectives of buses and cars. The Delphi method was used to determine the subjective weight of the index, and the grey correlation method was used to determine the objective weight of the index. To make better use of each index to evaluate the traffic benefit of the bus lane, a comprehensive integration weighting method based on objective optimization was used to determine the importance coefficients of the subjective and objective weights. Then, the comprehensive weight of the optimized index was obtained.
(2)
Based on an improved matter-element extension model, the traffic benefit of bus lanes was comprehensively evaluated. The closeness degree is used instead of the affiliation degree as a way to better describe the fuzzy boundaries between the ranks of the indicators so that the improved matter-element extension model can be more applicable to the calculation of weights containing subjective fuzzy judgements. With reference to the data samples, relevant reports on the operation evaluation of bus lanes in Chongqing, and the relevant normative standards, eight indicators of the traffic benefit rating of bus lanes were divided into five grades (excellent, good, medium, neutral, and poor), and the corresponding value range of each evaluation index was determined.
(3)
Combined with the index weight and index standardization data, the matter-element extension model optimized by the degree of closeness of each evaluation grade was used to calculate the traffic benefit value of the bus lane. Finally, the classification table of traffic benefit value of bus lanes was constructed, and the corresponding traffic benefit value range under each grade was obtained: excellent (0.6–1), good (0.5–0.6), medium (0.4–0.5), neutral (0.3–0.4), and poor (0–0.3).
With the development of urban public transportation, the collection and application of traffic data are becoming increasingly extensive, and research on the traffic benefit evaluation of bus lanes will further deepen and mature in the future. Future research can further improve the index system, expand the sample coverage, and analyze the impact mechanism of bus lane traffic benefits.

Author Contributions

Data curation, Y.Z.; writing—original draft preparation, Z.Y.; writing—review and editing, W.Q. and B.P.; funding acquisition and methodology, X.C. All authors have read and agreed to the published version of the manuscript.

Funding

This work was supported by the Science and Technology Research Program of Chong- qing Municipal Education Commission (Grant No. KJZD-M202300702) and the Leading Project of Chongqing Jiaotong University in Natural Sciences (Grant No. XJ2023000801).

Data Availability Statement

The numerical data used to support the findings of this study are included within the article.

Conflicts of Interest

Author Wufeng Qiao was employed by the T. Y. Lin International Engineering Consulting (China) Co., Ltd. and China Construction Seventh Engineering Division Co., Ltd. The remaining authors declare that the research was conducted in the absence of any commercial or financial relationships that could be construed as a potential conflict of interest. The T. Y. Lin International Engineering Consulting (China) Co., Ltd. and China Construction Seventh Engineering Division Co., Ltd. had no role in the design of the study; in the collection, analyses, or interpretation of data; in the writing of the manuscript, or in the decision to publish the results.

Appendix A

Table A1. The evaluation index sample data.
Serial NumberCross-Section Bus
Passenger Flow
(People/h)
Ratio of Single-Lane
Passenger Capacity
Total Number
of Cross-Section Passes (People/h)
Bus Traffic Volume
(Vehicles/h)
Car Traffic Volume
(Vehicles/h)
Bus Time Headway (s)Speed of Bus (km/h)Speed of Car (km/h)Serial NumberCross-Section Bus
Passenger Flow
(People/h)
129605.20521680150445.919.035.8190101
231455.40543485152645.717.434.9207105
329975.25525681150643.719.433.2187111
430715.51525483145544.818.834.9191105
531085.68523784141941.020.634.5177106
629605.54504880139244.517.134.9211104
732563.90507188121038.219.734.4183106
832193.56518787131238.919.130.2188120
933303.62532890133236.019.734.0184108
1031823.01547986153140.918.630.7192119
1132933.42538989139738.819.834.9183104
1233303.16561890152541.118.832.1191113
1334413.97532793125739.220.134.2179106
1432193.59517187130140.419.431.1185118
1534044.16518592118738.719.434.3187106
1632933.68523789129639.618.131.2199117
1732642.69936696406836.822.831.3162119
1837063.368697109332727.823.232.6159113
1933662.82924299391750.425.234.9143106
2035703.288544105331634.726.233.8138109
2132642.78907596387437.324.233.0150111
2234343.258291101323844.322.431.5163118
2338421.579150113353929.825.942.314087
2439101.818617115313837.326.246.913877
2537401.509157110361132.325.641.314191
2638081.768508112313337.925.945.713979
2737061.489138109362133.624.742.914785
2838081.728611112320228.825.444.714381
2939441.559469116368335.526.542.613786
3037741.718568111319633.525.946.713978
3136721.449212108369330.323.440.715590
3237401.668639110326628.025.143.814483
3341346.536531106159831.811.218.00333201
3441348.595885106116731.18.612.8426282
3541736.426644107164741.112.319.4303193
3640568.555783104115135.88.712.9419281
3742126.526657108163039.713.421.0273178
3840568.525789104115532.510.915.1340239
3945635.396404117122731.912.120.4306186
4044856.426005115101332.511.717.8316202
4146025.556405118120233.113.421274178
4245246.57602111699834.113.218.1276199
4346805.366578120126528.914.021.6269172
4444076.115975113104534.512.118305200
4544855.246345115124035.912.420.8295181
4644466.295982114102431.912.017.9308201
4745635.136497117128934.412.819.8287189
4844076.045994113105830.811.017.1335211
Table A2. Delphi expert typical sorting table.
Serial NumberBus Traffic VolumeCar Traffic VolumeBus Time HeadwaySpeed of BusSpeed of CarCross-Section Bus
Passenger Flow
Ratio of Single-lane
Passenger Capacity
Total Number
of Cross-Section Passes
135428617
212578634
327318645
423145678
536154728
615834267
725137648
846321578
962137458
1062138547
1142863157
1227136548
1365128734
1436128547
1515627438
1687314526
1787435612
1878145632
1951726438
2047538612
2185214637
2221374568
2337845261
2428167453
2515428367
2632168475
2724738651
2825348617
2921438567
3051278436
3113258467
3235428617

References

  1. Li, S.G.; Yong, J.F. Evaluation of bus-exclusive lanes. IEEE Trans. Intell. Transp. Syst. 2009, 10, 236–245. [Google Scholar] [CrossRef]
  2. Fayed, L.; Nilsson, G.; Geroliminis, N. On the utilization of dedicated bus lanes for pooled ride-hailing services. Transp. Res. Part B Methodol. 2023, 169, 29–52. [Google Scholar] [CrossRef]
  3. Russo, A.; Adler, M.W.; van Ommeren, J.N. Dedicated bus lanes, bus speed and traffic congestion in Rome. Transp. Res. Part A Policy Pract. 2022, 160, 298–310. [Google Scholar] [CrossRef]
  4. Justin, B.; Farzin, Y.H.; Lawell, C.Y.C.L. Public transit investment and sustainable transportation: A review of studies of transit’s impact on traffic congestion and air quality. Res. Transp. Econ. 2015, 52, 15–22. [Google Scholar] [CrossRef]
  5. Lei, L.; Sun, Q. Traffic benefit evaluation method of bus lane planning and design. J. Transp. Syst. Eng. Inf. Technol. 2009, 5, 160–165. [Google Scholar] [CrossRef]
  6. Sekhar, C.R.; Velmurugan, S. Micro simulation based performance evaluation of Delhi bus rapid transit corridor. Procedia-Soc. Behav. Sci. 2013, 104, 825–834. [Google Scholar] [CrossRef]
  7. Kampouri, A.; Politis, I.; Georgiadis, G. A system-optimum approach for bus lanes dynamically activated by road traffic. Res. Transp. Econ. 2022, 92, 101075. [Google Scholar] [CrossRef]
  8. Chen, Y.; Chen, G.; Wu, K. Evaluation of performance of bus lanes on urban expressway using paramics micro-simulation model. Procedia Eng. 2016, 137, 523–530. [Google Scholar] [CrossRef]
  9. Huo, Y.Y.; Ling, W.Q. Level of service criteria of bus lane based on improved factor assessment method. J. Transp. Syst. Eng. Inf. Technol. 2018, 18, 152–157. Available online: http://www.tseit.org.cn/EN/Y2018/V18/I1/152 (accessed on 20 June 2024).
  10. Ullah, M.R.; Khattak, K.S.; Khan, Z.H.; Khan, M.A.; Minallah, N.; Khan, A.N. Vehicular traffic simulation software: A systematic comparative analysis. Pak. J. Eng. Technol. 2021, 4, 66–78. [Google Scholar]
  11. Lin, K.; Sun, X.; Bai, Z.X.; Jiao, P. Analysis and evaluation method of bus lane setting benefit. J. Shenzhen Univ. (Sci. Eng.) 2022, 39, 201–208. [Google Scholar] [CrossRef]
  12. Son, X.M.; Zhang, M.Y.; Li, Z.J.; Wang, X.; Zhang, Y.N. Dynamic bus lane setting and its simulation analysis and evaluation. J. Jilin Univ. (Eng. Technol. Ed.) 2020, 50, 1677–1686. [Google Scholar] [CrossRef]
  13. Xue, Y.; Cheng, L.; Zhong, M.; Sun, X. Evaluation of bus lane layouts based on a bi-level programming model—Using part of the Qingshan Lake District of Nanchang City, China, as an example. Sustainability 2023, 15, 8866. [Google Scholar] [CrossRef]
  14. Hadas, Y.; Nahum, O.E. Urban bus network of priority lanes: A combined multi-objective, multi-criteria and group decision-making approach. Transp. Policy 2016, 52, 186–196. [Google Scholar] [CrossRef]
  15. Sheth, C.; Triantis, K.; Teodorović, D. Performance evaluation of bus routes: A provider and passenger perspective. Transp. Res. Part E Logist. Transp. Rev. 2007, 43, 453–478. [Google Scholar] [CrossRef]
  16. Li, H.; Xu, H.; Wang, Y. Multisource data-driven evaluation framework to assess the performance of dedicated bus lanes: A case study in Chongqing Metropolitan, China. J. Urban Plan. Dev. 2023, 149, 04023040. [Google Scholar] [CrossRef]
  17. Solanki, V.S.; Agarwal, P.K. Identification of key performance indicators using hybrid COPRAS-TOPSIS for urban public transit systems by evaluating with AHP and FAHP. Multimed. Tools Appl. 2024, 1–31. [Google Scholar] [CrossRef]
  18. Mareschal, B. Weight stability intervals in multicriteria decision aid. Eur. J. Oper. Res. 1988, 33, 54–64. [Google Scholar] [CrossRef]
  19. Vaidya, O.S.; Kumar, S. Analytic hierarchy process: An overview of applications. Eur. J. Oper. Res. 2006, 169, 1–29. [Google Scholar] [CrossRef]
  20. Ali, S.; Zargari, M.E.; Esmaili, I.Y. Bus route evaluation using a two-stage hybrid model of Fuzzy AHP and TOPSIS. J. Transp. Lit. 2013, 7, 34–58. [Google Scholar] [CrossRef]
  21. Guo, X.Z.; Weng, X.X. Fuzzy comprehensive evaluation of the bus service level based on AHP. J. Transp. Inf. Saf. 2014, 32, 42–46. [Google Scholar] [CrossRef]
  22. Li, C.; Li, L. Fuzzy Comprehensive Evaluation for Development Status of Urban Bus Rapid Transit (BRT) in China. Appl. Mech. Mater. 2013, 253, 1930–1935. [Google Scholar] [CrossRef]
  23. Ebrahimi, S.; Raj, B. A fuzzy Delphi analytic hierarchy model to rank factors influencing public transit mode choice: A case study. Res. Transp. Bus. Manag. 2021, 39, 100496. [Google Scholar] [CrossRef]
  24. Hasheminezhad, A.; Farhad, H.; Hamid, S. Investigation and prioritization of risk factors in the collision of two passenger trains based on fuzzy COPRAS and fuzzy DEMATEL methods. Soft Comput. 2021, 25, 4677–4697. [Google Scholar] [CrossRef]
  25. Zhang, X.; Zhang, Q.; Sun, T.; Zou, Y.; Chen, H. Evaluation of urban public transport priority performance based on the improved TOPSIS method: A case study of Wuhan. Sustain. Cities Soc. 2018, 43, 357–365. [Google Scholar] [CrossRef]
  26. Alkharabsheh, A.; Moslem, S.; Oubahman, L.; Duleba, S. An integrated approach of multi-criteria decision-making and grey theory for evaluating urban public transportation systems. Sustainability 2021, 13, 2740. [Google Scholar] [CrossRef]
  27. Weng, J.C.; Sun, Y.X.; Kong, N.; Pan, X.; Qi, H. Effectiveness evaluation method and influence model of bus lane based on multi-source data. China J. Highw. Transp. 2022, 35, 267–276. [Google Scholar] [CrossRef]
  28. Yang, J.; Chen, H. Evaluation index and method of comprehensive operation benefit of bus lanes. J. Chang. Univ. (Nat. Sci. Ed.) 2015, 35, 230–234. [Google Scholar] [CrossRef]
  29. Liu, X.J.; Chen, J.; Ma, T.T. Comprehensive evaluation method of bus dedicated lane use effect based on multi-source data. In Proceedings of the International Conference on Electronic Information Engineering, Data, and Computer Technology, Sanya, China, 6 May 2022. [Google Scholar] [CrossRef]
  30. Si, B.F.; Zhong, M.; Yang, X.B.; Gao, Z.Y. Bi-level programming model for exclusive bus lanes configuration in multimodal traffic network. Transp. Res. Procedia 2017, 25, 652–663. [Google Scholar] [CrossRef]
  31. Liang, Y.Q.; Wang, S.H.; Zhang, M. Research on the evaluation index system of social and economic benefits of Beijing urban intelligent traffic management system. J. Transp. Syst. Eng. Inf. Technol. 2011, 11, 104–108. Available online: http://www.tseit.org.cn/CN/abstract/abstract18179.shtml (accessed on 20 June 2024).
  32. Kendall, M.G.; Smith, B.B. The Problem of m Rankings. Ann. Math. Stat. 1939, 10, 275–287. Available online: https://www.jstor.org/stable/2235668 (accessed on 20 June 2024). [CrossRef]
  33. Azadfallah, M. The extraction of expert weights from pair wise comparisons in Delphi method. J. Appl. Inf. Sci. 2015, 3, 151552854. [Google Scholar] [CrossRef]
  34. Esangbedo, M.O.; Wei, J. Grey hybrid normalization with period based entropy weighting and relational analysis for cities rankings. Sci. Rep. 2023, 13, 13797. [Google Scholar] [CrossRef]
  35. David, N.K.W. Grey system and grey relational model. ACM SIGICE Bull. 1994, 20, 2–9. [Google Scholar] [CrossRef]
  36. Wang, Y.; Li, F.; Yang, J.; Song, F.; Zhang, D.; Xue, L.; Zhu, J. Demand response evaluation of RIES based on improved matter-element extension model. Energy 2020, 212, 118121. [Google Scholar] [CrossRef]
  37. Chen, Y.H.; Sun, C.Y. Further study on the validity of the maximum membership principle. J. Chongqing Norm. Univ. (Nat. Sci.) 2002, 1, 47–49. [Google Scholar] [CrossRef]
  38. Zhang, X.P. The aggregation of fuzzy comprehensive evaluation results based on closeness degree. J. Shandong Univ. (Nat. Sci.) 2004, 2, 25–29. [Google Scholar] [CrossRef]
  39. Lu, F.; Wang, H. Road Traffic Safety Status Evaluation Model Based on Matter Element Extension Method. In Proceedings of the 18th COTA International Conference of Transportation Professionals, Beijing, China, 5–8 July 2018; American Society of Civil Engineers: Reston, VA, USA, 2018; pp. 1771–1781. [Google Scholar] [CrossRef]
Figure 1. Flow chart of the research methodology.
Mathematics 12 02664 g001
Figure 2. Indicator system for evaluating the traffic benefits of bus lanes.
Mathematics 12 02664 g002
Figure 3. Public road sections used in case study.
Mathematics 12 02664 g003
Figure 4. Change rate of each index in the implementation of bus lanes.
Mathematics 12 02664 g004
Table 1. Basic details of public road sections studied.
Bus LaneRoad CategoryRoad Length (km)Number of Lanes per DirectionNumber of Buses
in Fleet
Number of Bus LinesNumber of Roadside Openings
Daping-YangjiapingMain trunk highway3362214
Huanghuayuan interchange-Luneng turntableMain trunk highway3.633213
Dashiba-HongqihegouMain trunk highway3.2372411
Table 2. Part of the evaluation index sample data.
Serial
Number
Cross-Section Bus
Passenger Flow
(People/h)
Ratio of Single-Lane Passenger CapacityTotal Number of Cross-Section Passes
(People/h)
Bus Traffic Volume
(Vehicles/h)
Car Traffic Volume
(Vehicles/h)
Bus Time Headway (s)Speed of Bus (km/h)Speed of Car (km/h)
129605.2521680150445.91935.8
231455.4543485152645.717.434.9
329975.25525681150643.719.433.2
430715.51525483145544.818.834.9
531085.6852378414194120.634.5
633303.6253289013323619.734
731823.01547986153140.918.630.7
832933.42538989139738.819.834.9
Table 3. Delphi expert typical sorting table.
IndexSerial
Number
Bus Traffic VolumeCar Traffic
Volume
Bus Time
Headway
Speed
of Bus
Speed
of Car
Cross-Section
Bus Passenger Flow
Ratio of Single-Lane
Passenger Capacity
Total Number
of Cross-Section Passes
Qualitative ranking
of experts
135428617
212578634
327318645
423145678
536154728
615834267
3235428617
Table 4. Standardized data of evaluation index samples.
Serial NumberCross-Section Bus
Passenger Flow
Ratio of Single-Lane Passenger CapacityTotal Number
of Cross-Section Passes
Bus Traffic VolumeCar Traffic
Volume
Bus Time HeadwaySpeed
of Bus
Speed
of Car
10.1720.2410.0630.1750.0840.5880.6700.598
20.1510.3540.0280.3000.0990.5040.4750.648
30.2150.3010.0310.2250.0620.5580.6200.636
40.1290.3800.0430.4000.0970.4820.5870.648
50.1940.3130.9770.7251.0000.5220.6200.633
60.2150.1750.8250.4750.7590.3980.5590.510
70.2800.2690.9490.6250.9510.0000.6260.622
80.1510.1930.7910.4000.7551.0000.5700.525
Table 5. Evaluation index value range and classification interval.
IndexNumber RangeExcellentGoodMediumNeutralPoor
Cross-section bus passenger flow[0, 5000][4000, 5000][3000, 4000][2000, 3000][1000, 2000][0, 1000]
Ratio of single-lane passenger capacity[0, 10][8, 10][6, 8][4, 6][2, 4][0, 2]
Total number of cross-section passes[0, 10000][8000, 10000][6000, 8000][4000, 6000][2000, 4000][0, 2000]
Bus traffic volume[0, 150][120, 150][90, 120][60, 90][30, 60][0, 30]
Car traffic volume[0, 3700][3000, 3700][2300, 3000][1600, 2300][800, 1600][0, 800]
Bus time headway[0, 60][0, 12][12, 24][24, 36][36, 48][48, 60]
Speed of bus[0, 50][40, 50][30, 40][20, 30][10, 20][0, 10]
Speed of car[0, 60][48, 60][36, 48][24, 36][12, 24][0, 12]
Table 6. Statistical data of each evaluation index of bus lanes studied.
Bus LaneBefore or after
the Opening of Bus Lanes
Cross-Section Bus Passenger FlowRatio of Single-Lane Passenger CapacityTotal Number of Cross-Section PassesBus Traffic VolumeCar Traffic VolumeBus Time HeadwaySpeed
of Bus
Speed
of Car
Daping-YangjiapingBefore30405.4352418214674418.734.7
After32973.6152998913353919.332.7
Huanghuayuan
interchange-Luneng turntable
Before34343.03886910136233924.032.9
After37941.62890711234083325.543.8
Dashiba-HongqihegouBefore41287.52621510613913510.916.5
After45165.81622011611363312.519.3
Table 7. Closeness between the traffic benefits of bus lanes and each evaluation level.
Bus LaneBefore or after the Opening
of Bus Lanes
ExcellentGoodMediumNeutralPoorMaximum Value Evaluation Grade
Daping-YangjiapingBefore−9.19−1.722.31−3.76−11.372.31Medium
After−8.67−1.191.43−4.28−11.891.43Medium
Huanghuayuan
interchange-Luneng turntable
Before1.53−0.73−7.80−15.23−22.851.53Excellent
After2.75−1.00−8.40−15.86−23.472.75Excellent
Dashiba-HongqihegouBefore−4.83−0.15−2.30−8.14−15.74−0.15Good
After−4.35−1.36−3.54−8.86−16.28−1.36Good
Table 8. Case study of bus lane traffic benefit value and evaluation grade.
Bus LaneBefore or after
the Opening
of Bus Lanes
Traffic Benefit ValueTraffic Benefit Grade
Daping-YangjiapingBefore0.49Medium
After0.49Medium
Huanghuayuan
interchange-Luneng turntable
Before0.63Excellent
After0.66Excellent
Dashiba-HongqihegouBefore0.55Good
After0.56Good
Table 9. Traffic benefit value classification of bus lanes.
GradeExcellentGoodMediumNeutralPoor
Traffic benefit value0.6–10.5–0.60.4–0.50.3–0.40–0.3
Disclaimer/Publisher’s Note: The statements, opinions and data contained in all publications are solely those of the individual author(s) and contributor(s) and not of MDPI and/or the editor(s). MDPI and/or the editor(s) disclaim responsibility for any injury to people or property resulting from any ideas, methods, instructions or products referred to in the content.

