Abstract
Electrocardiography (ECG) plays a pivotal role in monitoring cardiac health, yet the manual analysis of ECG signals is challenging due to the complex task of identifying and categorizing various waveforms and morphologies within the data. Additionally, ECG datasets often suffer from a significant class imbalance issue, which can lead to inaccuracies in detecting minority class samples. To address these challenges and enhance the effectiveness and efficiency of cardiac arrhythmia detection from imbalanced ECG datasets, this study proposes a novel approach. This research leverages the MIT-BIH arrhythmia dataset, encompassing a total of 109,446 ECG beats distributed across five classes following the Association for the Advancement of Medical Instrumentation (AAMI) standard. Given the dataset’s inherent class imbalance, a 1D generative adversarial network (GAN) model is introduced, incorporating the Bi-LSTM model to synthetically generate the two minority signal classes, which represent a mere 0.73% fusion (F) and 2.54% supraventricular (S) of the data. The generated signals are rigorously evaluated for similarity to real ECG data using three key metrics: mean squared error (MSE), structural similarity index (SSIM), and Pearson correlation coefficient (r). In addition to addressing data imbalance, the work presents three deep learning models tailored for ECG classification: SkipCNN (a convolutional neural network with skip connections), SkipCNN+LSTM, and SkipCNN+LSTM+Attention mechanisms. To further enhance efficiency and accuracy, the test dataset is rigorously assessed using an ensemble model, which consistently outperforms the individual models. The performance evaluation employs standard metrics such as precision, recall, and F1-score, along with their average, macro average, and weighted average counterparts. Notably, the SkipCNN+LSTM model emerges as the most promising, achieving remarkable precision, recall, and F1-scores of 99.3%, which were further elevated to an impressive 99.60% through ensemble techniques. Consequently, with this innovative combination of data balancing techniques, the GAN-SkipNet model not only resolves the challenges posed by imbalanced data but also provides a robust and reliable solution for cardiac arrhythmia detection. This model stands poised for clinical applications, offering the potential to be deployed in hospitals for real-time cardiac arrhythmia detection, thereby benefiting patients and healthcare practitioners alike.
Keywords:
GAN-SkipNet; artificial intelligence; biomedical signal processing; cardiac arrhythmias detection; SkipCNN; ECG; CNN+LSTM; GAN MSC:
92C55
1. Introduction
Cardiac arrhythmias are irregular heart rhythms that can be caused by various factors. For instance, coronary artery disease (CAD) occurs when blood vessels supplying the heart become narrowed or blocked, disrupting the heart’s electrical signaling system [1,2]. Heart failure, resulting from a weakened heart muscle, can also lead to arrhythmias due to changes in the heart’s structure and electrical properties [3,4]. Valvular heart disease disrupts the heart’s electrical signals by causing turbulence in blood flow [5]. Additionally, arrhythmias can occur independently, with genetic factors making some individuals more susceptible to irregular heart rhythms. Imbalances in essential electrolytes, lifestyle choices like excessive caffeine or alcohol consumption, smoking, and certain medications can all contribute to arrhythmias [6,7]. A wide array of arrhythmias can affect the human heart, often tied to various underlying conditions. These arrhythmias encompass fast and slow heart rhythms and regular and irregular heartbeat patterns and can be either persistent or paroxysmal, as well as classified as malignant or non-malignant. Moreover, diverse therapeutic options are available to manage these conditions effectively. When categorizing arrhythmias based on heart rate, they can be divided into two primary types: fast arrhythmias, known as tachyarrhythmias, and slow arrhythmias, or bradyarrhythmias. Tachyarrhythmias, like atrial fibrillation, atrial flutter, and ventricular tachycardia, lead to a rapid and often irregular heartbeat. Conversely, bradyarrhythmias, including sinus bradycardia and heart blocks, result in a heart rate that is slower than the normal pace [8]. Arrhythmias can also be classified based on the regularity of the heartbeat. Those with a consistent and predictable heartbeat pattern, such as atrial flutter and supraventricular tachycardia (SVT), are termed regular arrhythmias. In contrast, irregular arrhythmias, like atrial fibrillation (AFib) [8,9,10], ventricular fibrillation (VFib), and premature contractions, exhibit erratic and unpredictable heartbeat patterns. Moreover, the persistence of arrhythmias plays a vital role in classification. Persistent arrhythmias, like persistent atrial fibrillation (AFib) or atrial flutter, endure for an extended period without self-termination, necessitating active management and treatment. On the other hand, paroxysmal arrhythmias, such as paroxysmal supraventricular tachycardia (PSVT), paroxysmal AFib, and paroxysmal ventricular tachycardia (VT), involve sudden and intermittent episodes of irregular heart rhythms that spontaneously start and stop [11,12]. Lastly, the severity of arrhythmias distinguishes them as malignant or non-malignant. Malignant arrhythmias, including ventricular tachycardia (VT) and ventricular fibrillation (VFib), exhibit fast and chaotic rhythms originating in the ventricles and can potentially lead to sudden cardiac arrest. Conversely, non-malignant arrhythmias, such as atrial fibrillation (AFib), bradycardia (slow heart rate), and premature contractions (PACs and PVCs), are generally less immediately life-threatening, although they can still pose health risks and complications [13,14].
The diagnosis of arrhythmias, which are irregular heart rhythms, is primarily accomplished through the use of an electrocardiogram (ECG). This diagnostic tool is indispensable for understanding and characterizing the heart’s electrical activity [15,16]. During an ECG, electrodes are placed on specific locations of the chest, arms, and legs to record the heart’s electrical signals. The resulting ECG waveform illustrates various phases of the cardiac cycle, encompassing atrial and ventricular depolarization and repolarization. These waveforms serve as vital indicators for diagnosing arrhythmias, as deviations in their shape and timing can precisely identify the specific type of arrhythmia and any associated underlying conditions. Morphology in an ECG refers to the shape, duration, and characteristics of the recorded waveforms [17,18]. In a normal ECG, waveforms follow a specific and well-defined pattern, including the P wave representing atrial depolarization, the QRS complex indicating ventricular depolarization, the T wave signifying ventricular repolarization, and sometimes the U wave [19,20]. Abnormal morphology may present as alterations in the shape, duration, or regularity of these waveforms, which can reveal the presence of arrhythmias or underlying heart conditions [21,22]. Arrhythmias are diagnosed through various ECG monitoring methods, each serving a specific purpose. A standard ECG, typically conducted in clinical settings, briefly records the heart’s electrical activity. Short-term monitoring utilizes portable devices like Holter monitors and event recorders, which are crucial for capturing intermittent arrhythmias that may not appear during standard ECGs. Long-term monitoring, on the other hand, involves the use of wearable or implantable devices, ensuring the detection of sporadic arrhythmias over extended periods, often spanning weeks or months. These diverse monitoring methods are essential for diagnosing a wide range of arrhythmias, enabling accurate assessments and effective treatment [23,24,25]. ECG monitoring devices come in various forms, with standard ECGs and short-term monitoring taking place in clinical offices. Wearable ECG monitors, including options like chest straps and wristwatches, provide real-time monitoring in daily life, enhancing the detection of arrhythmias that may not manifest during clinical visits. Implantable ECG monitors, surgically positioned beneath the skin, offer continuous recording over several years.
The ECG signal remains the primary diagnostic modality for arrhythmia diagnosis. However, interpreting ECGs, especially for extended monitoring, demands considerable experience and time. It can be a complex task, as arrhythmias come in various forms and may not always present clear patterns to the naked eye. Consequently, the development of computer-aided diagnostic systems that can enhance the accuracy and efficiency of ECG interpretation is an active and critical area of research. One significant limitation in training diagnostic systems for arrhythmia detection is the issue of imbalanced data. Imbalanced datasets occur when one class of arrhythmia is significantly more prevalent than others, leading to an inherent bias in the model’s learning [26,27]. In real-world ECG datasets, certain types of arrhythmias are rare, while others are common. The limitations of training datasets with imbalanced data can result in machine learning models that are biased toward the majority class, leading to reduced sensitivity, overfitting, and misleading evaluation metrics. These models may perform poorly in detecting rare arrhythmias, making them less applicable in real-world clinical settings. To address these limitations, various techniques used by the researchers, such as oversampling, undersampling, and the use of specialized evaluation metrics, are employed to improve the accuracy and reliability of arrhythmia detection systems [28,29,30].
Indeed, the challenges posed by imbalanced data have spurred a significant push toward the development of systems designed to overcome this issue. These systems are driven by the goal of ensuring the accurate and comprehensive detection of arrhythmias, irrespective of the rarity of certain types in the training data. To tackle data imbalance, an innovative solution has been introduced in the form of a generative adversarial network (GAN). This GAN is capable of generating a synthetic dataset for the minority class, resolving the imbalance problem. The GAN-generated data, which include sufficient ECG beats, mitigate the imbalance issue, enabling deep learning models to be trained effectively on a balanced dataset. The result is improved efficiency in arrhythmia detection, addressing a significant challenge in this critical area of healthcare.
1.1. Literature Review
We performed a nonsystematic literature review of machine learning methods for arrhythmia detection, focusing on strategies to mitigate data imbalance induced by minority classes of uncommon ECG beats in extant training ECG databases, the established and popular being the Massachusetts Institute of Technology–Beth Israel Hospital (MIT-BIH) arrhythmia database [31,32,33]. Our findings are summarized in Table 1. Most models in this review involved a multi-class classification of different morphologies of ECG beats, except for two studies. Using the PhysioNet paroxysmal AF prediction challenge dataset, Asadi et al. (2023) [11] developed a generative adversarial network (GAN) that synthesized ECGs of the paroxysmal AF minority class and designed a neural architecture search that customized the convolutional neural network (CNN) for the binary classification of paroxysmal AF versus no AF. Qin et al. (2023) [34] proposed a model that detected ECG anomalies using a one-class classification GAN with bidirectional long short-term memory (LSTM) and mini-batch discrimination, attaining high accuracy and discrimination for the binary classification of normal versus abnormal ECGs in the MIT-BIH arrhythmia database. Overall, the reviewed studies support the utility of machine learning for arrhythmia detection. Challenges in terms of variations in performance and model robustness, generalizability and real-world applicability beyond the study databases, and computational demands with practical feasibility in clinical settings were emphasized. Importantly, specific approaches to mitigating data imbalance were highlighted.

Table 1.
Comparative review of data imbalance techniques utilizing ML/DL models for arrhythmia detection.
Apart from arrhythmia detection, researchers have explored the application of data imbalance techniques in the ECG-based detection of myocardial infarction (MI). Sharma and Sunkaria (2020) [44] addressed data imbalance in the Physikalisch-Technische Bundesanstalt (PTB) database using adaptive synthetic sampling. Their proposed model based on stationary wavelet transform and k-nearest neighbors attained consistent accuracy using top-ranked features from multiple ECG leads. Li et al. (2022) [45] used a single-lead convolutional GAN to synthesize minority-class myocardial infarct ECGs on the PTB dataset. Their model attained 99.06% accuracy. Working with both the MIT-BIH and PTB databases, Rai and Chatterjee (2021) [46] used the synthetic minority oversampling technique (SMOTE)-Tomek Link to balance the combined study dataset, while acknowledging that data combination might introduce signal morphology variations. Using CNN, hybrid CNN-LSTM, and ensemble techniques, they attained 99.89% accuracy for myocardial infarction detection.
1.2. Novelties and Contributions
In this work, we present three DL models, SkipCNN, SkipCNN+LSTM, and SkipCNN+LSTM+Attention, for the accurate and automatic detection of cardiac arrhythmias. The design structure of these models is unique and different from that of the other models in the literature as it includes a reduced number (optimized) of layers, resulting in enhanced computational efficiency and improved generalization performance. The integration of skip connections with a CNN facilitates the simplified flow of the data through the layers, providing deeper learning without the risk of a vanishing gradient. The addition of LSTM units enables the model to capture the temporal dependencies very effectively, as the LSTM is well suited for handling time series data such as ECG or EEG signals. The utilization of an attention mechanism in our proposed model permits us to emphasize the most significant segments of the input sequence, boosting the capability to extract the complex and discriminative features.
In addition, the proposed structures make use of the Swish activation function rather than the conventional ReLU. Swish was selected because it can provide more balanced gradients and enhance training dynamics, which will enhance the performance of the model. Furthermore, the employed GAN structure provides a lower computational cost than others described in the literature. Both the generator and discriminator sections of our GAN model utilize Bi-LSTM to increase the quality of synthetic data and boost the model’s overall performance. The detailed description of the layer-wise structure of the proposed DL models and GAN architecture is presented in Section 3. The contributions and novelties of this research are as follows:
- Innovative GAN model with bidirectional LSTM (Bi-LSTM) to generate two minority class signals to address data imbalance.
- A large ECG dataset comprising 109,446 ECG beats divided into five arrhythmia classes to promote model robustness and real-world applicability.
- Similarity matching assessment using key metrics to quantify similarities between real and synthetic ECG signals, providing insights into the quality of synthetic data.
- Innovative convolutional neural network with skip connections (SkipCNN) model to enrich model diversity.
- Diverse model architectures encompassing three distinct models—SkipCNN, SkipCNN+LSTM, and SkipCNN+LSTM+Attention—which enhance versatility in studying different arrhythmia scenarios.
- Ensemble model integration to combine the strengths of individual models and enhance system accuracy.
- Utilization of multiple evaluation metrics for a comprehensive evaluation of model performance.
- Data imbalance solution based on synthetic ECG signal generation using GAN.
- Adequate ECG beat generation by proposed GAN model of 2400 premature atrial contraction (PAC) ECG signals from a training dataset comprising 2085 samples.
- Combined dataset utilization MIT-BIH and GAN-generated synthetic ECG data to enrich the training data.
The rest of the manuscript is organized in the subsequent manner. Section 2 covers the materials and techniques employed in the research. Section 3 introduces the proposed methodology for detecting arrhythmias in five categories. Section 4 provides a comprehensive account of the experiments, including the experimental setup and results. Section 5 engages in a detailed discussion, drawing comparisons with state-of-the-art techniques. Finally, Section 6 offers closing remarks and outlines future research directions.
2. Materials and Methods
2.1. ECG Dataset
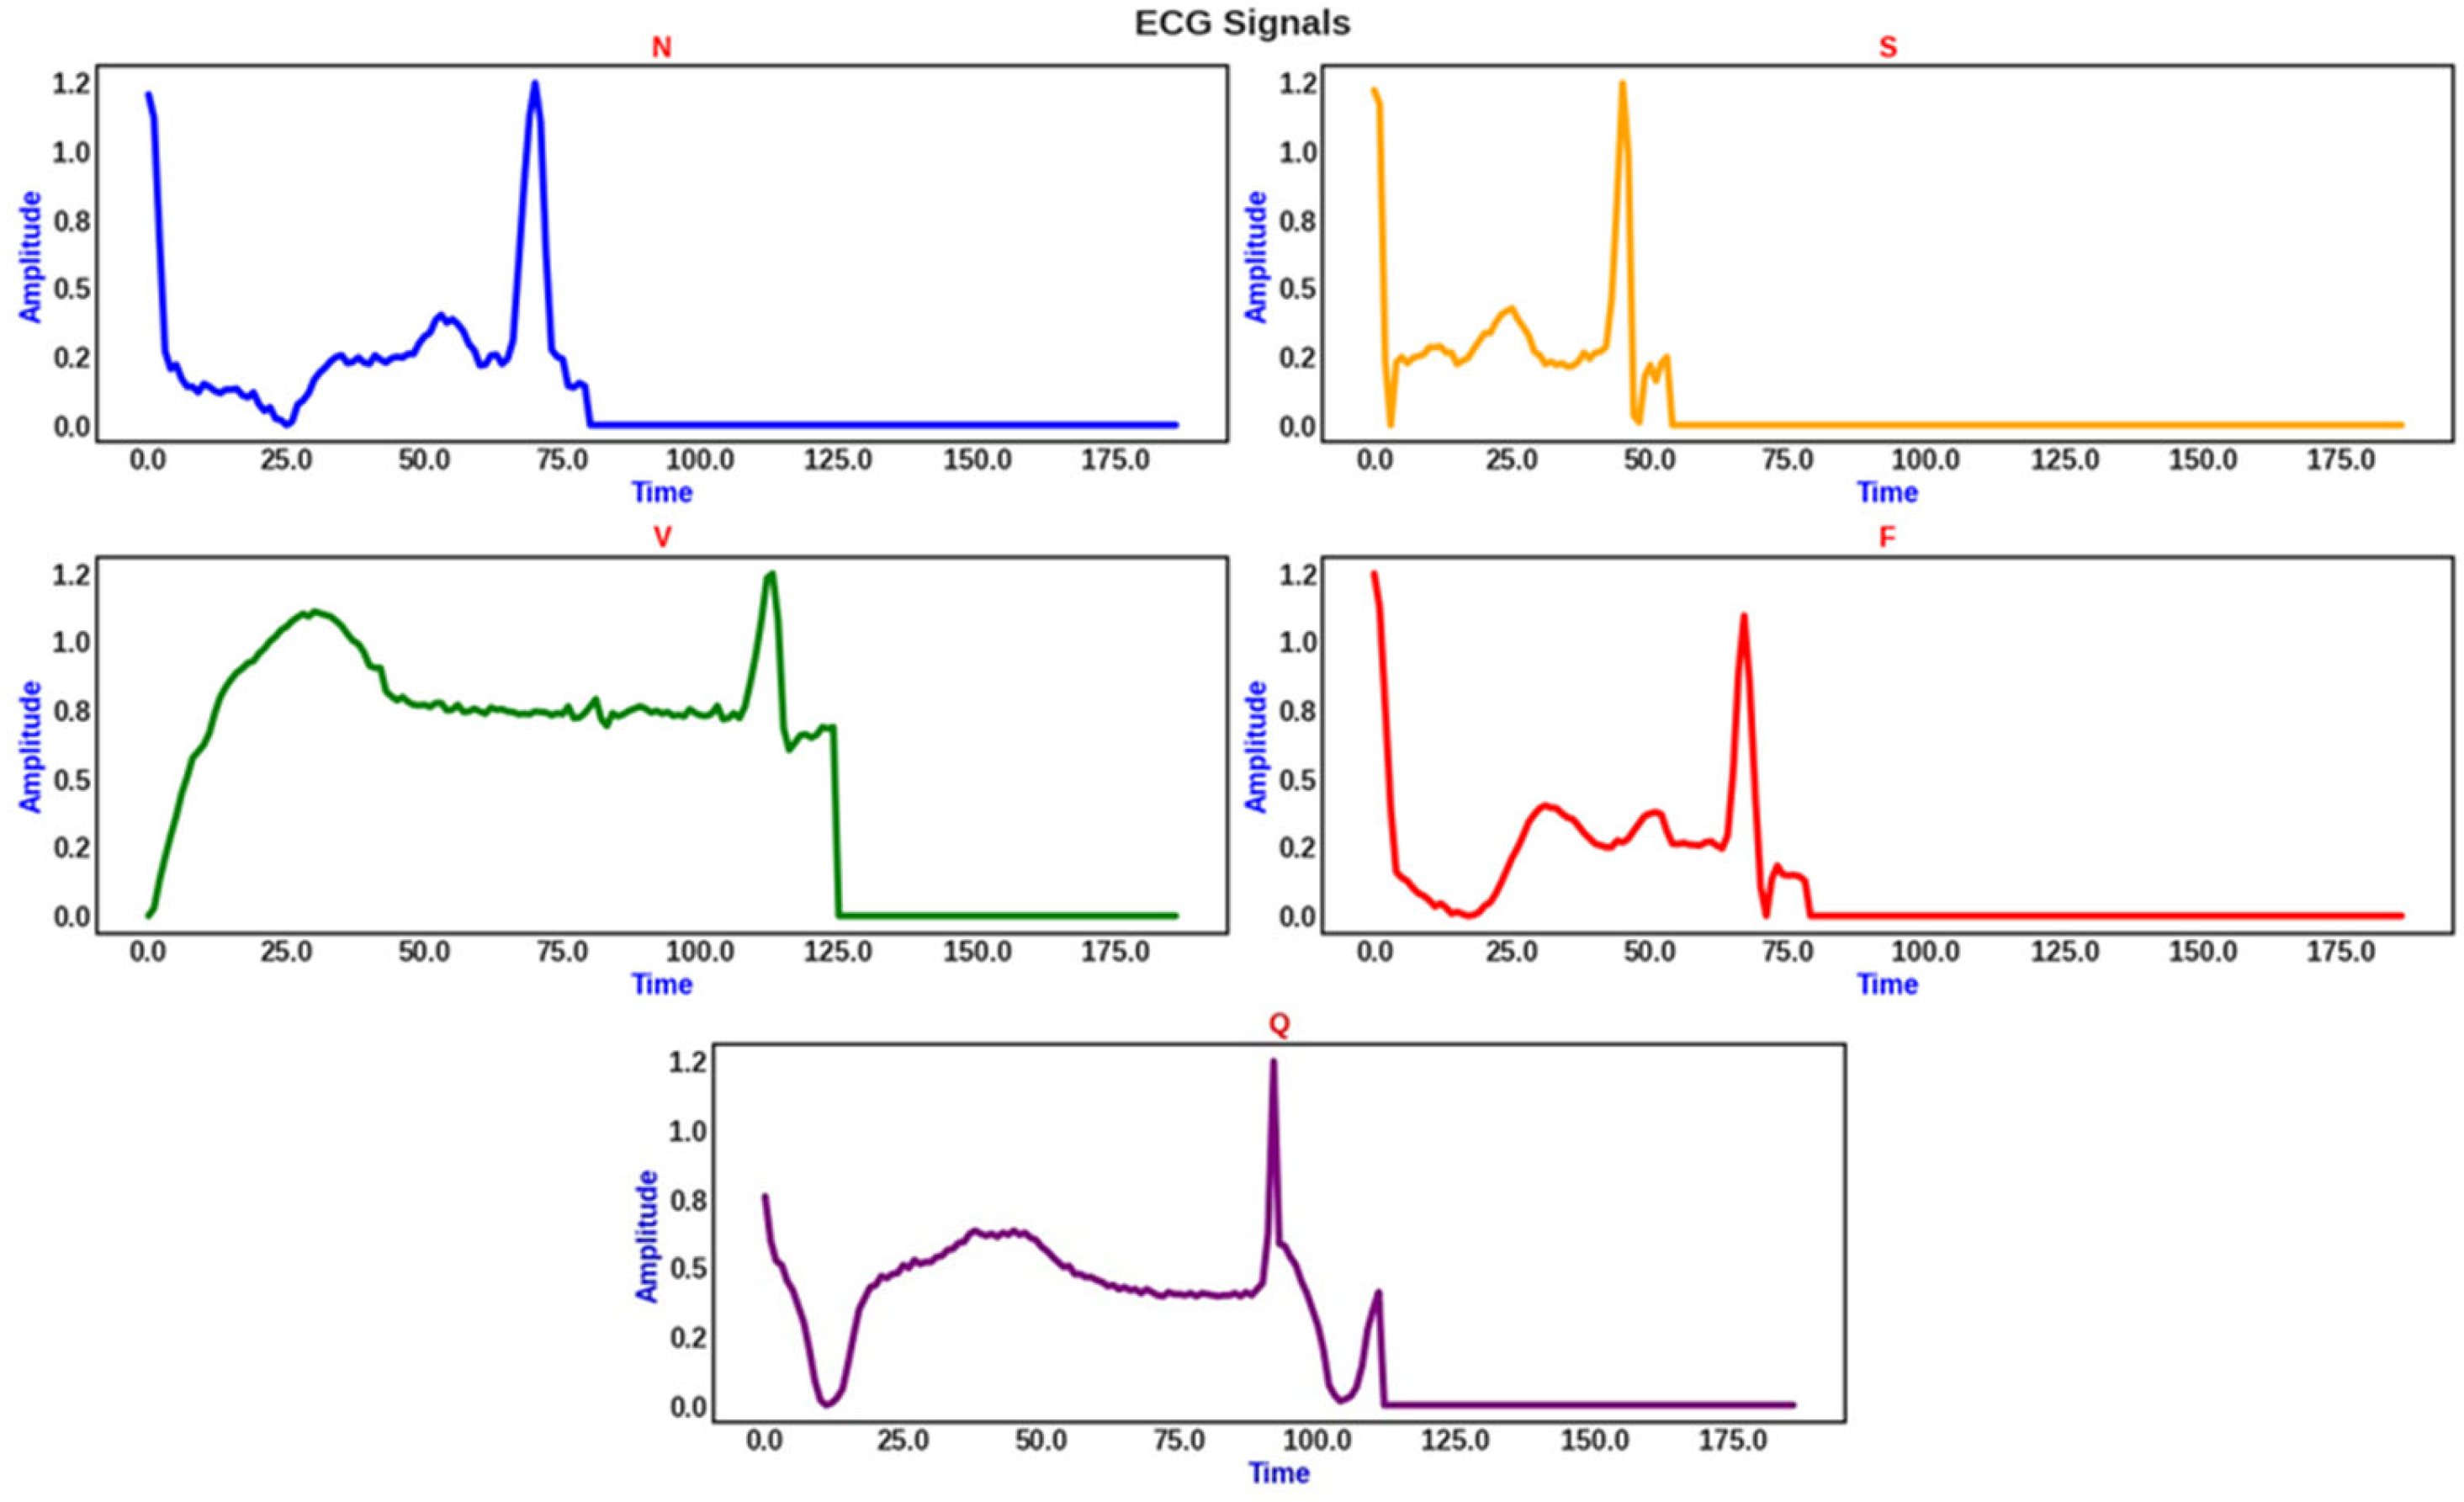
Our study dataset is primarily centered on the open-access MIT-BIH arrhythmia dataset, which comprises 48 30-minute ECG recordings of 47 individuals [31]. The 109,446 ECG beats in the recordings have been manually annotated beat-by-beat by experts into multiple distinct arrhythmia classes [47]. We downloaded the ECG beats from Kaggle [48], which have been segmented and individually mapped to the five classes of the Association for the Advancement of Medical Instrumentation (AAMI) standard classification framework—normal (N), supraventricular (S), ventricular (V), fusion (F), and beats of unknown etiology (Q)—(Table 2) [47,49]. Due to variations in the lengths of the extracted ECG beats, we employed zero padding to ensure a uniform fixed length of 187 for the analyzed ECG segments (Figure 1), as previously described [40,46]. These pre-processed ECG segments constituted our study dataset.
Table 2.
Distribution of ECG beats in MIT-BIH database mapped to AAMI standard.
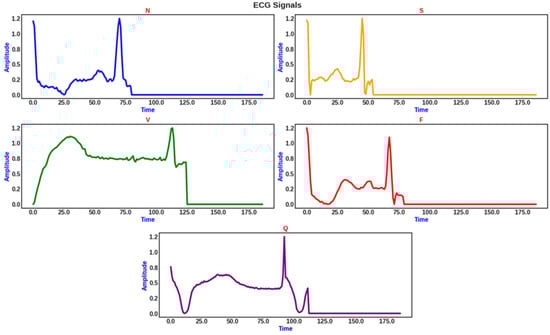
Figure 1.
Sample ECG beats in the AAMI classes. Zero padding was applied to standardize all segment lengths to 187.
The MIT-BIH ECG database and the derived AAMI five-class dataset are imbalanced datasets, in which the collected data are distributed unevenly among different classes [15]. In the context of multi-class classification, data imbalance refers to the unequal distribution of samples among multiple classes in the training dataset [50]. From Table 2, the majority, second lowest minority, and lowest minority AAMI classes comprise N, S, and F ECG beats, which constitute 82.77%, 2.54%, and 0.73% of the dataset, respectively, indicating severe data imbalance. Under such conditions, machine learning models struggle to learn from and accurately predict minority class samples, often resulting in poor minority class accuracy. The challenges imposed by data imbalance in multi-class classification closely resemble those encountered in binary classification tasks—encompassing issues like model bias, suboptimal generalization, and the potential for misleading model evaluation—but are exacerbated due to the presence of multiple imbalanced classes. Techniques commonly applied in binary classification problems—including oversampling, undersampling, and cost-sensitive learning—can be extended and adapted to balance sample distributions across all classes to address data imbalance in multi-class settings and enhance the overall classification performance and fairness of the machine learning models.
2.2. CNN Model
CNNs are versatile and effective deep learning models for automatic feature extraction from intricate data [51,52,53,54]. CNNs comprise several standard layers: convolutional layers for feature extraction, batch normalization for data standardization, rectified linear unit (ReLU) activation for introducing non-linearity, and pooling layers to reduce dimensionality, while fully connected layers, also known as a feed-forward network, are utilized for detection and classification tasks [55,56]. Convolutional layers employ filters for extracting pertinent information called features from the input information; their size and stride can be tailored to the specific task, defined by mathematical Equation (1) (in all equations, all vectors, matrices, and tensors are annotated in bold).
where represents the convolution operation, are spatial indices, is the feature map index, and is the bias term. Batch normalization layers standardize input characteristics, speeding up the learning process and improving the neural network’s stability. For a mini-batch the normalized output is provided by Equation (2):
The mini-batch mean and variance are represented by and respectively, with being an insignificant constant for numerical stability. The mathematical model’s ability to acquire complex patterns is supported through the introduction of non-linearity via the ReLU activation function. Pooling layers, such as average pooling and maximum pooling, lower the dimensionality of feature maps, thus accelerating processing as well as facilitating feature selection [57]. The max-pooling and average pooling layers are mathematically defined by Equations (3) and (4), respectively.
where is the pooling region. A fully connected layer at the end of the network categorizes input data into distinct output classes, leveraging on high-level features extracted by the previous layers [58], defined by Equation (5).
where is the weight matrix, x is the input vector, and is the bias vector.
2.3. LSTM Model
LSTM is adept at processing time series and sequential data like ECG signals. LSTM effectively addresses short-term memory problems in deep learning models, which occur when earlier layers in the network struggle to learn and retain information from extended data sequences due to vanishing gradients [36,59,60,61]. The key components of an LSTM cell are defined mathematically in Equations (6)–(11) as follows:
where is the sigmoid activation function; and are weight matrices; is the hidden state from the previous time step; is the input at the current time step; are the bias; represents the inner product (dot product or matrix multiplication); and represents the Hadamard product (element-wise multiplication).
2.4. Bidirectional LSTM
The Bi-LSTM network is an expansion of the LSTM architecture that integrates intelligence derived from time steps both in antecedent and subsequent temporal domains, which enhances its ability to capture temporal dependencies in sequential data [62,63]. The basic structure of the Bi-LSTM used in this work is illustrated in Figure 2a. For a sequence of inputs , the forward LSTM processes the sequence from as given by Equation (12) [64,65].
The backward LSTM processes the sequence from , as given by Equation (13).
The final output at each time step is given by Equation (14).
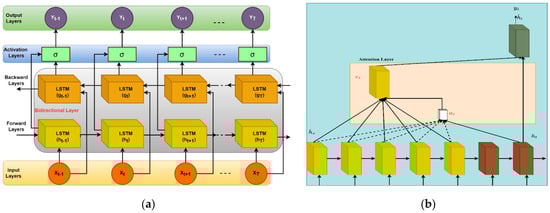
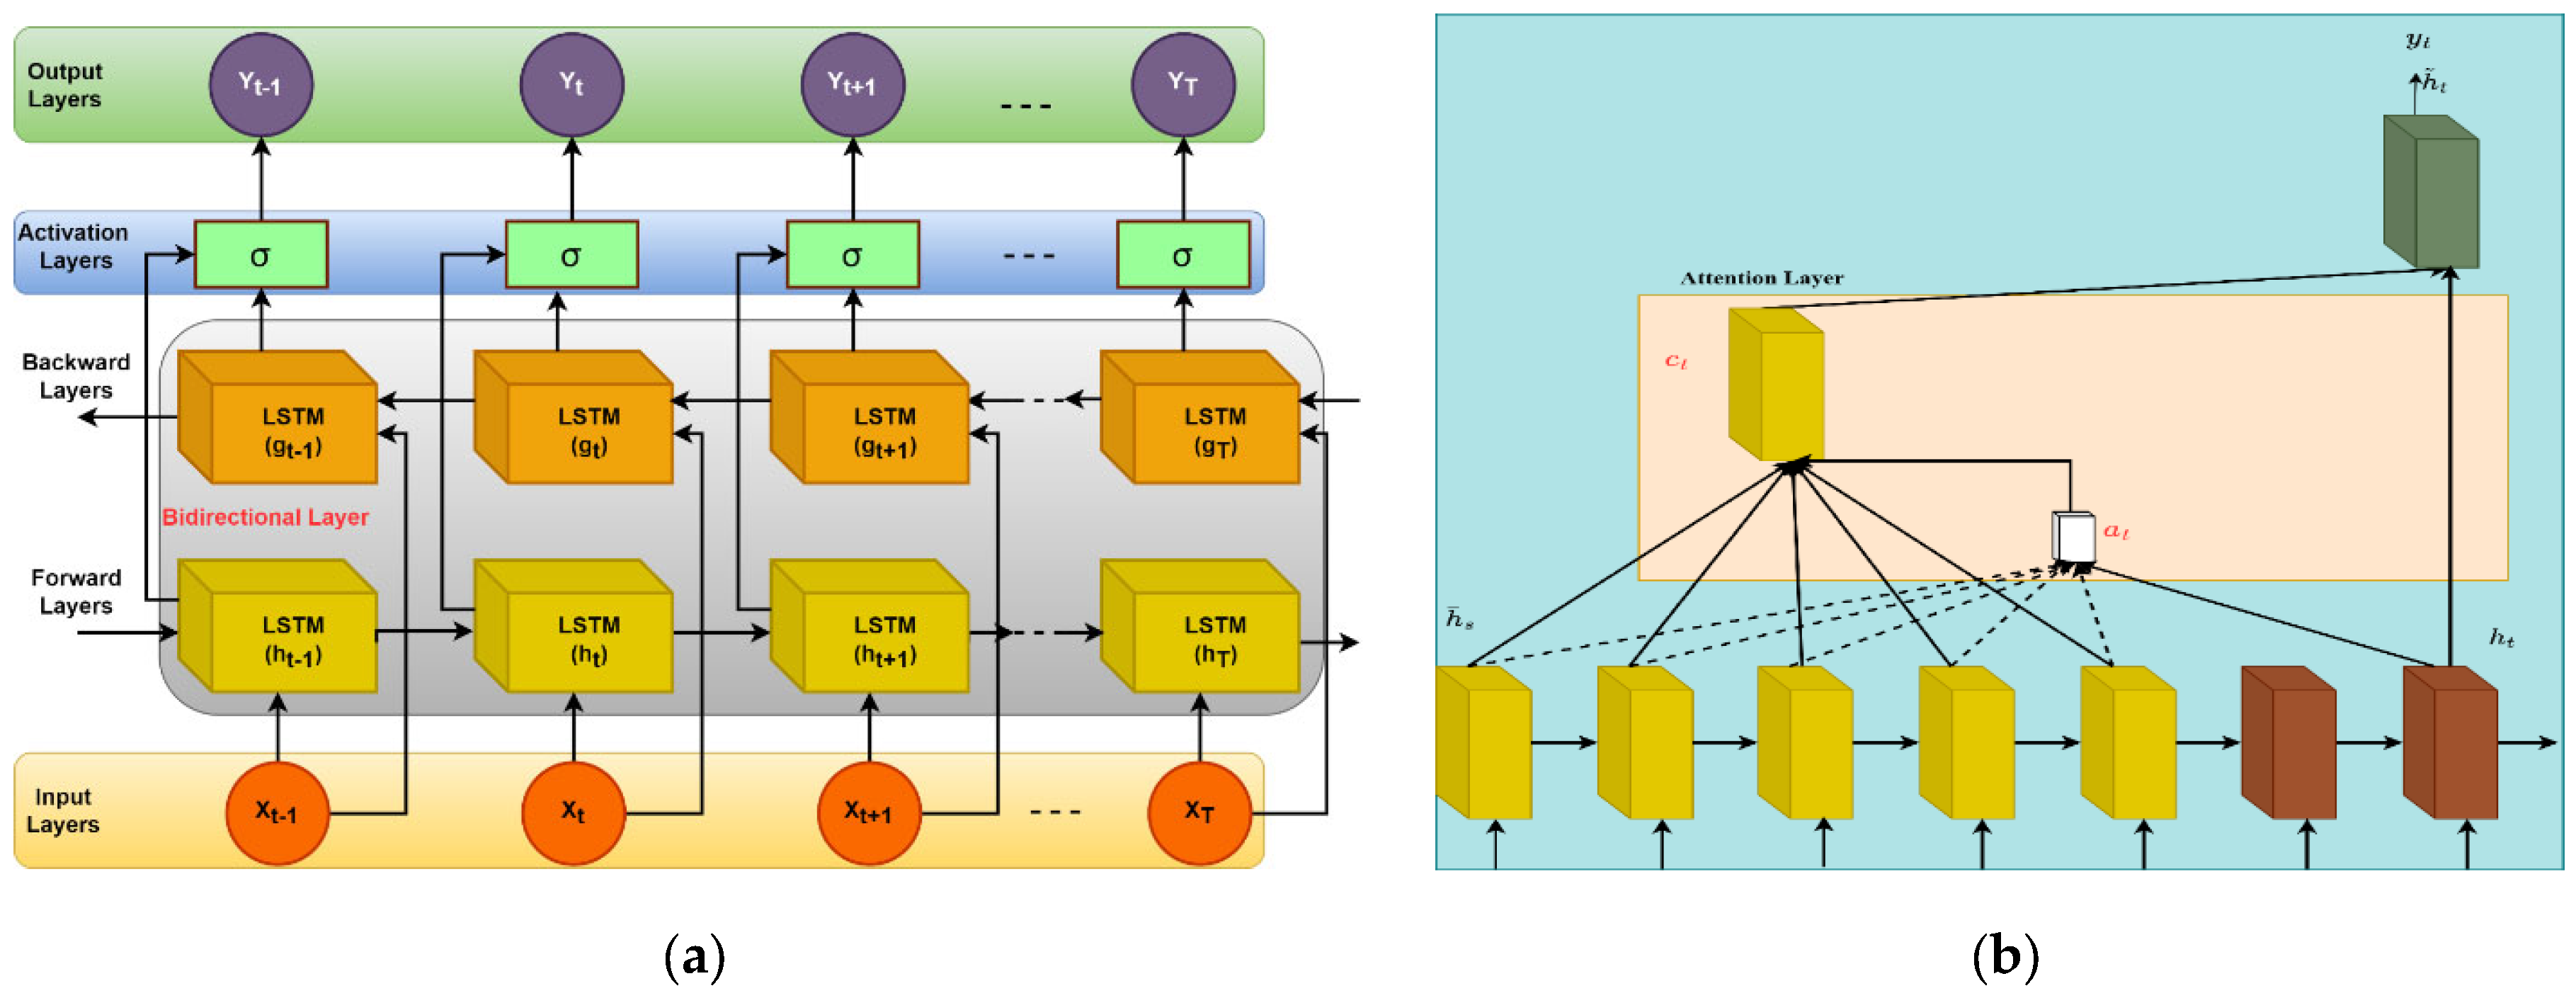
Figure 2.
(a) Schema of Bi-LSTM architecture (left) and (b) schema of attention model architecture (right).
Figure 2.
(a) Schema of Bi-LSTM architecture (left) and (b) schema of attention model architecture (right).
2.5. Attention Model
The attention model is a crucial component in sequence-related tasks, enabling the model to concentrate on specific segments of an input sequence during each iteration, making it highly effective for understanding context in long sequences; for example, text summarization and machine translation provide pertinent instances [66,67,68,69]. In the context of sequence generation tasks, an attention mechanism is employed for various calculations. The compatibility score quantifies the alignment between source hidden states and the target hidden state . Alignment scores are derived from these compatibility scores using a softmax function, making them interpretable as probabilities [70]. These scores determine the attention weights assigned to source hidden states. The context vector is computed as a weighted sum of source hidden states based on alignment scores , representing the relevant part of the source sequence for generating the target sequence at time step (Figure 2b). Finally, the decoder output is predicted based on the context vector, the previous hidden state , and the previously generated token , if available, using the decoder’s LSTM cell [71] (see Algorithm 1). The equations for the compatibility scores, source hidden states, alignment score, target hidden state, context vector, and decoder output are provided in Equations (15)–(20), respectively [72].
where is the input at source time step is the previous hidden state of the LSTM at source time step is the previous cell state of the LSTM at source time step .
| Algorithm 1: Attention mechanism for sequence generation. |
|
2.6. Performance Evaluation Metrics
In our analysis, we utilized standard evaluation metrics, as described in Equations (21)–(30).
Here, TP, FP, TN, and FN signify the quantities of true positives, false positives, true negatives, and false negatives, respectively, and n is the number of samples [73]. and represent means of G and R, respectively; and are standard deviations of G and R, respectively; is the covariance of G and R; and C1 and C2 are small constants to stabilize the division [74]. and represent corresponding data points in G and R, respectively, and N is the total data samples [75].
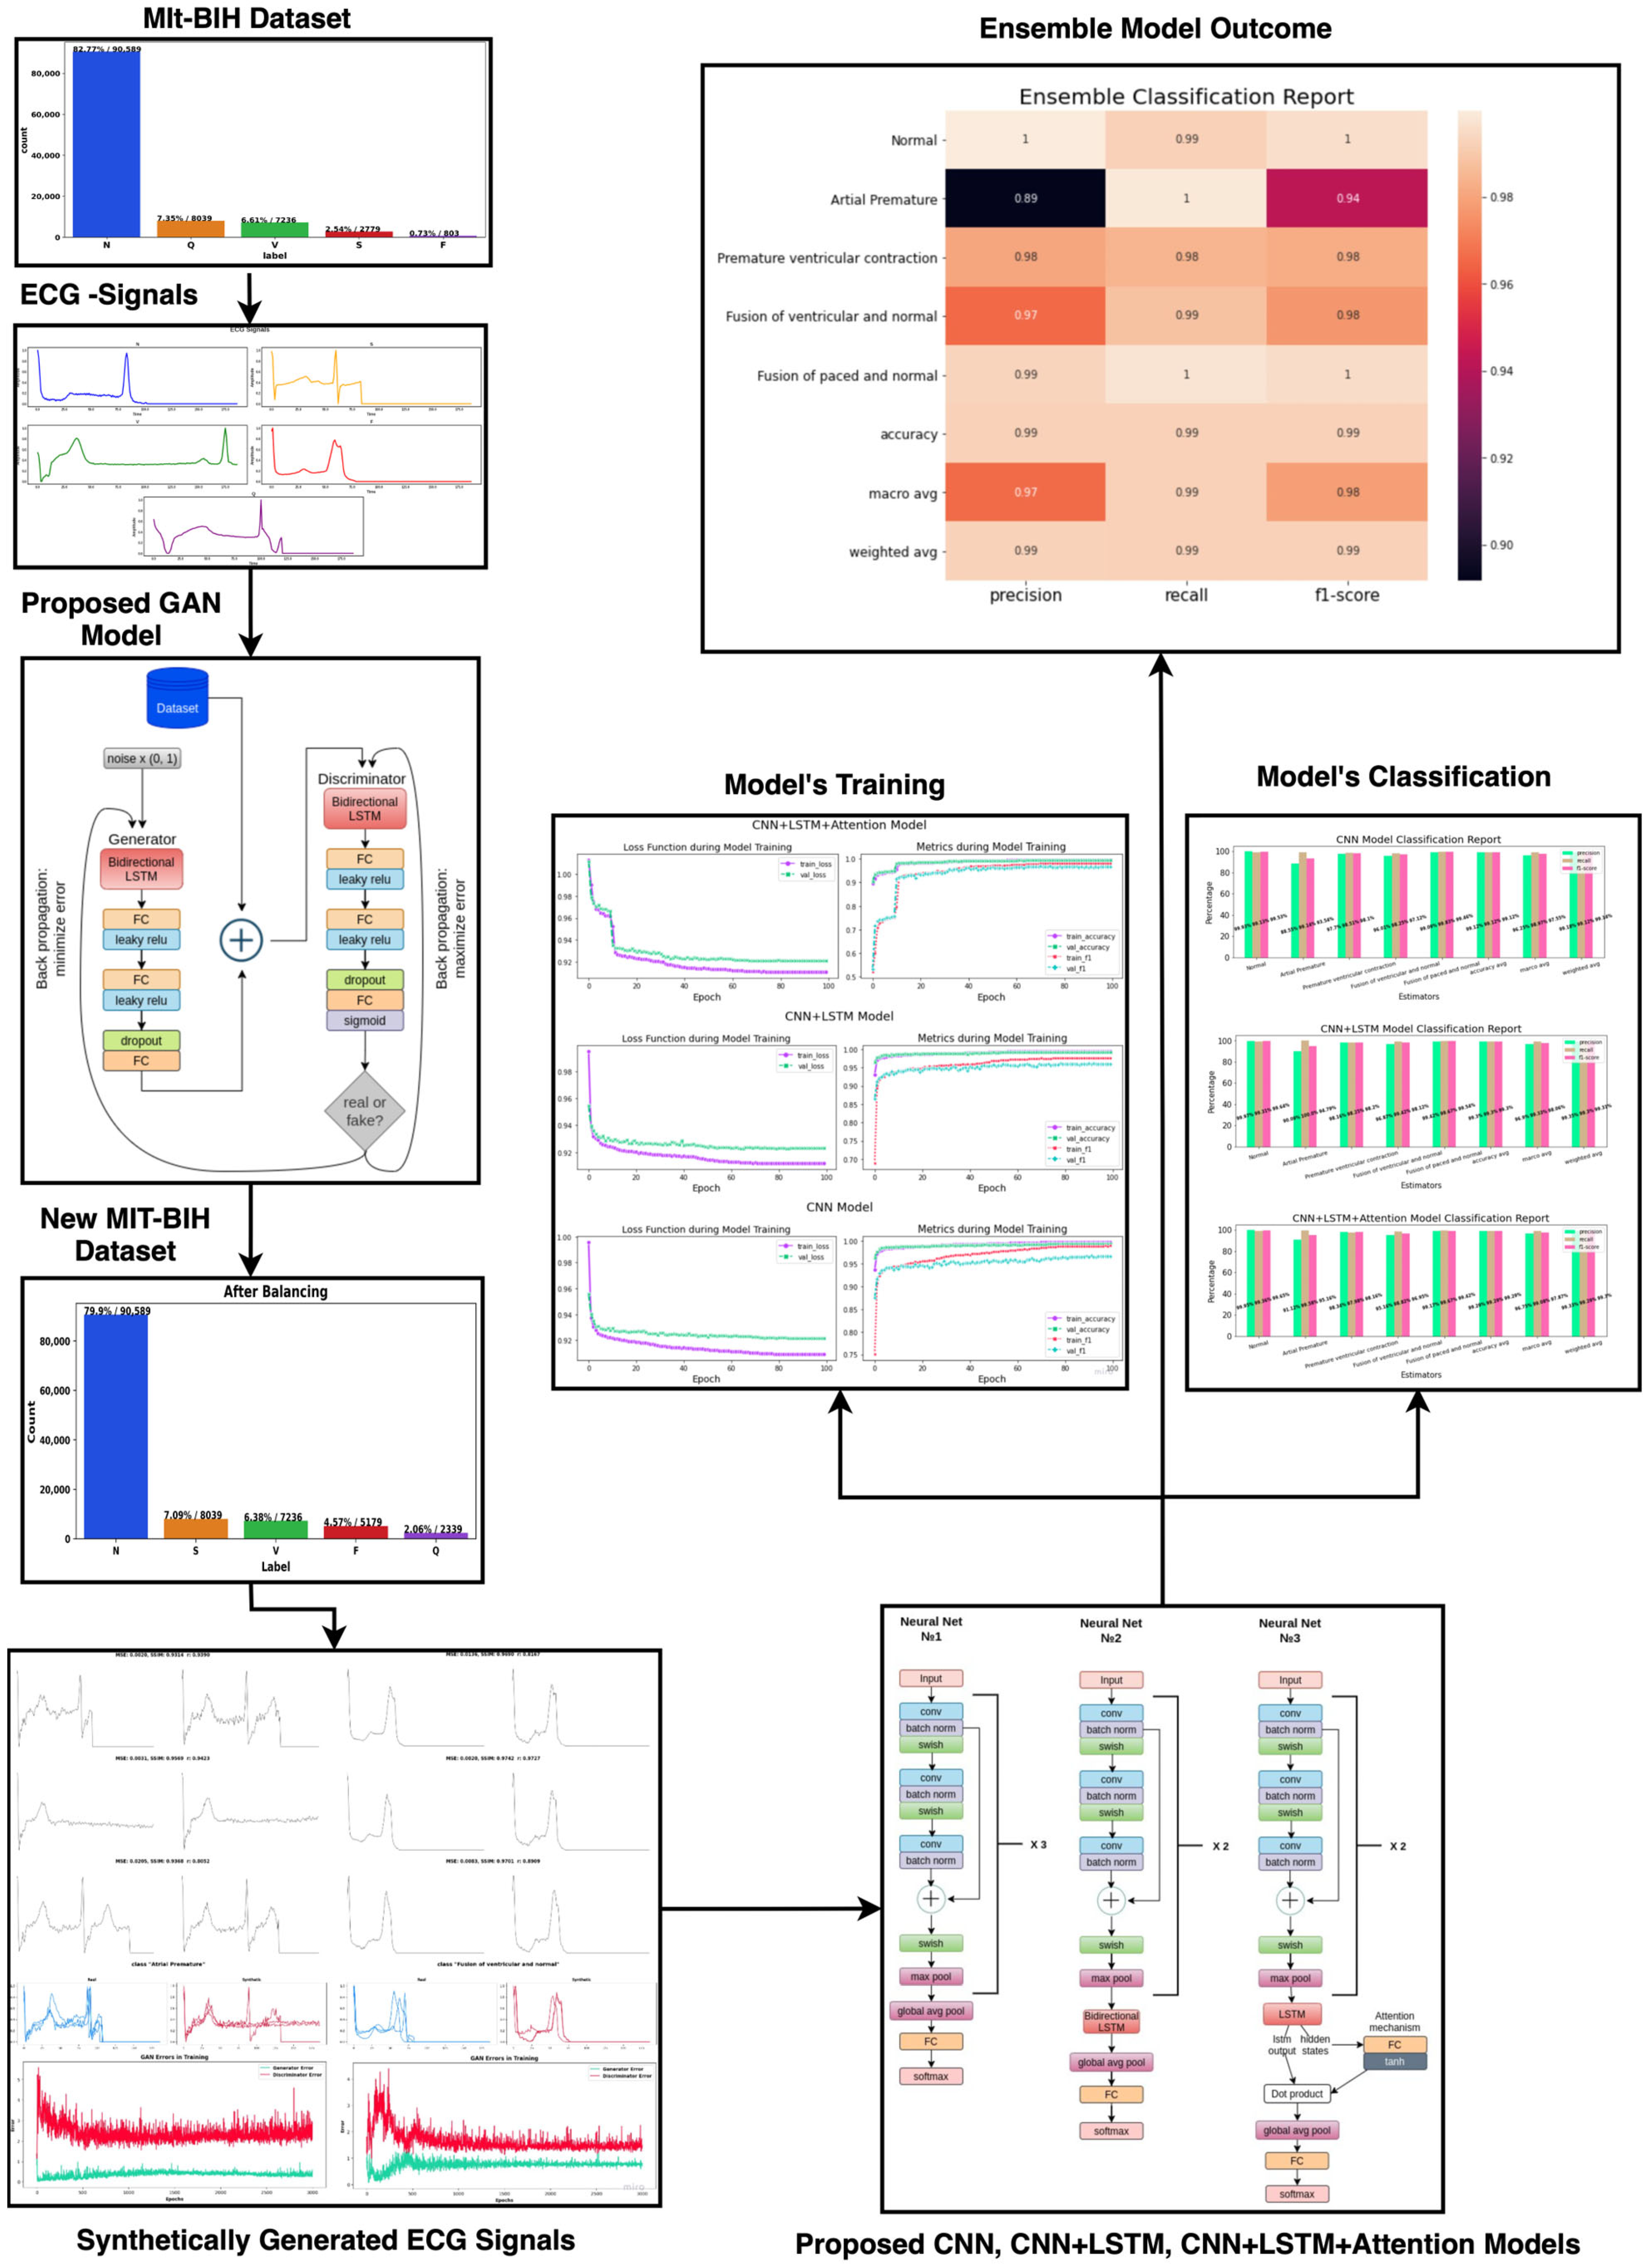
3. Proposed Methodology
Our model is illustrated in Figure 3. To address data imbalance, we proposed to use GAN to generate synthesized ECGs and extend the representation of minority arrhythmia categories in the MIT-BIH-derived study dataset. The generated synthetic data were then partitioned into training and testing sets, ensuring that the model would be tested on unseen data separate from the training set, thus preempting bias. For end-to-end model training and classification, we employed three deep learning architectures: (1) a convolutional neural network with skip connections (SkipCNN), the foundational unit of our proposed model, which, by incorporating skip connections, enables the network to skip one or more layers to facilitate the more efficient capture of both local and global features; (2) SkipCNN+LSTM, a hybrid model that combines the capabilities SkipCNN and LSTM to process spatial and temporal information, respectively; (3) SkipCNN+LSTM+Attention, which integrates an attention mechanism to the hybrid model to boost model performance through selective emphasis on and capture of pertinent information in the input data; and (4) an ensemble model, which leverages the complementary strengths of different model architectures to improve model accuracy for arrhythmia detection. The proposed models, SkipCNN, SkipCNN+LSTM, SkipCNN+LSTM+Attention, and Ensemble, are mathematically defined by Equations (31), (32), (33), and (34), respectively.
where is element-wise addition, is element-wise multiplication, is a convolution operation, and is the dot product or matrix multiplication. The weights denoted as and are determined via a training process. In order to reduce the ensemble model’s total loss function, these weights are often tuned using backpropagation. Through the use of each component model’s strengths, the optimization process modifies these weights in accordance with how well it performs on the validation set, enabling the ensemble to provide predictions that are more accurate overall.
Figure 3.
Block diagram of the proposed methodology for the classification of cardiac arrhythmia.
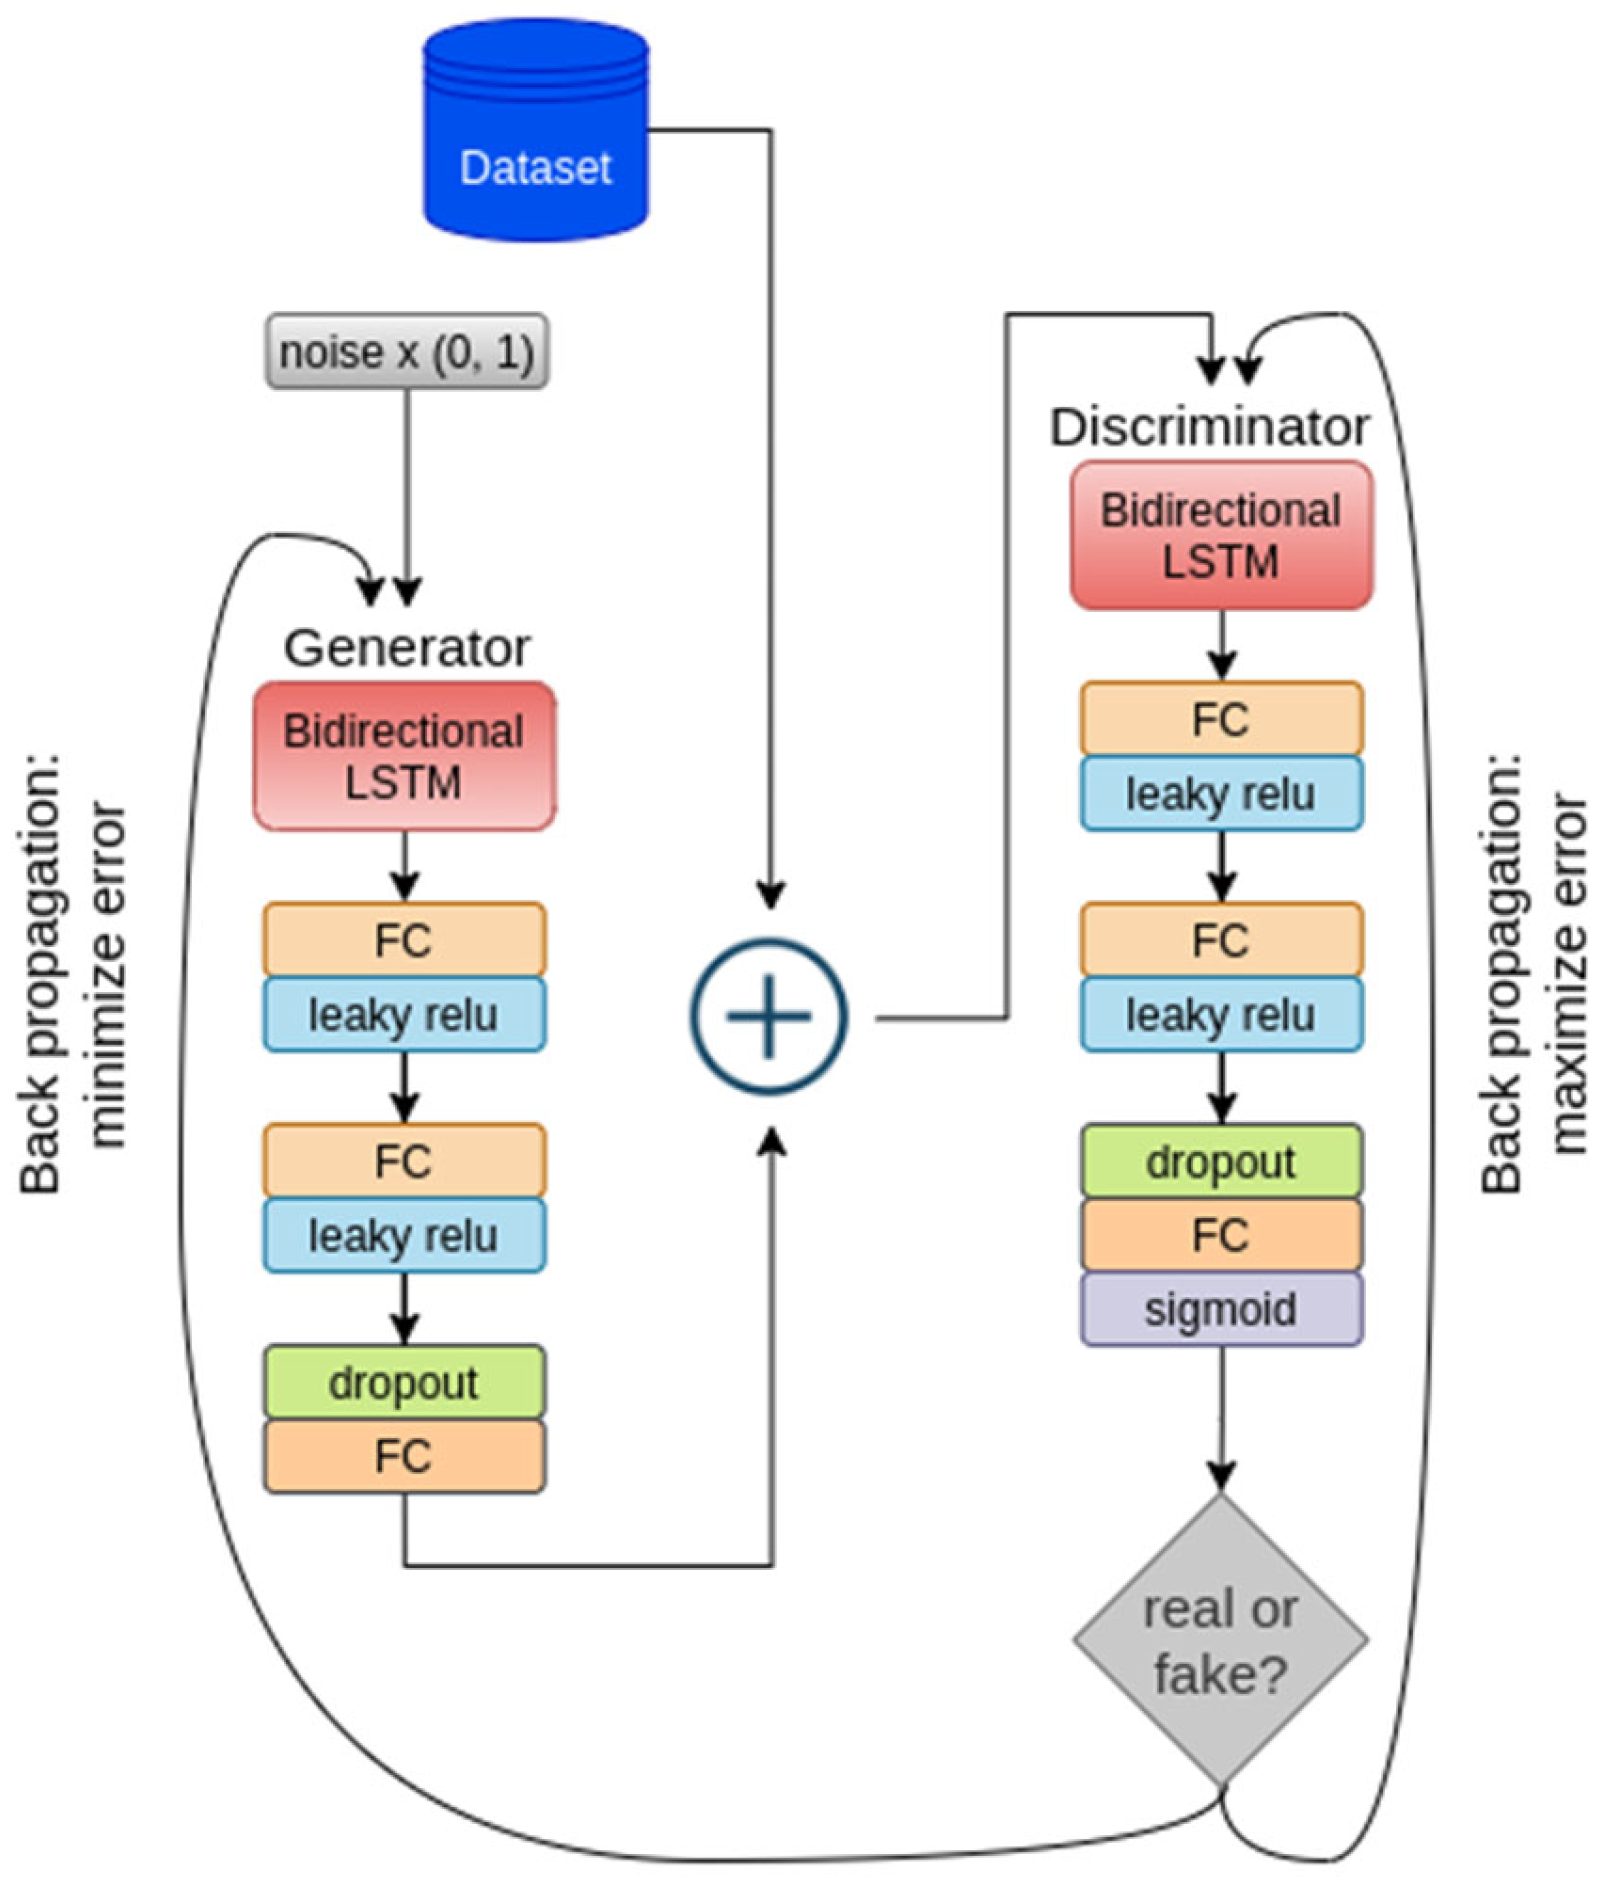
3.1. Proposed GAN Architecture
We designed a novel GAN architecture based on Bi-LSTM for generating minority ECG samples, which comprised two primary components: a generator and a discriminator, both utilizing Bi-LSTM networks (Figure 4).

Figure 4.
Proposed GAN architecture for minority ECG data augmentation.
3.1.1. Generator
This employs a combination of layers, including the core Bi-LSTM layer, to transform an input ECG sequence into a desired ECG output format. A vector of random noise of size is given to the generator. A sequence of fully connected (FC) layers is succeeded by the Bi-LSTM layer [76]. The first FC layer applies a linear transformation to the input noise, which increases the representational capacity of the data, as shown in Equation (35).
A second fully connected layer performs a similar operation, further enhancing the capacity, as shown in Equation (36).
To capture temporal dependencies, the modified input is processed by the core Bi-LSTM layer (shown in Equation (37)).
With the aim of averting overfitting and upholding the model’s propensity for generalization, dropout regularization is next applied: 20% of input units are randomly set to zero during training, as shown in Equation (38).
where the binary mask represented by keeps elements with probability and is the input tensor. The final fully connected layer generates the output sequence, which corresponds to ECG data of a specific uniform length (187), shown in Equation (39).
The linear transformation carried out by this layer maps the model’s internal representation to the desired output format. To ensure that the output adheres to the desired shape, a reshaping operation is applied. This ensures that the output sequence retains its batch size while taking the desired shape of (−1, 1, 187), where “−1” denotes that the batch size is preserved.
3.1.2. Discriminator
The architecture incorporates Bi-LSTM and is designed to differentiate between real ECG beats sourced from the MIT-BIH arrhythmia dataset and synthetic ECG beats generated by the generator. To capture the temporal features from the input data sequence (ECG), the Bi-LSTM layers are used as defined in Equation (40).
The first fully connected layer applies a linear transformation to the Bi-LSTM output, which increases the representational capacity, as shown in Equation (41).
The second FC layer is applied to further process the data, priming it for the discrimination task, as given in Equation (42).
To prevent overfitting, dropout regularization is next applied: random deactivation is applied to around 20% of the neurons at each forward pass during training. This regularization technique boosts the model’s effectiveness in generalizing efficiently to unseen data. The final fully connected layer serves as a binary classifier using a sigmoid activation function, and the layer output falls within the range of [0, 1], as given in Equation (43).
This output embodies the discriminator’s assessment of the input data: values approaching 1 indicate that the input ECG data closely resemble real data from the MIT-BIH arrhythmia database, whereas values approaching 0 suggest that the input data are more likely synthetic, i.e., generated by the generator. The synthetic ECG signal generated using the proposed GAN is presented by Algorithm 2.
To address the data imbalance issue, we proposed a unique GAN model that generates a synthetic ECG dataset. There are many reasons why it is vital to distinguish between ECGs obtained from the original dataset and those generated by the generator. First, this distinction enables us to evaluate the model’s endurance and its ability to generalize well. By assessing how well the model distinguishes between actual and synthetic ECGs, we can ensure that it performs consistently across both types of data. Second, it is required to validate the quality of the synthetic data generated. The synthetic ECGs should closely resemble the properties of real ECGs, and differentiating between the two aids in ensuring that the created data appropriately reflect the variability and patterns observed in the actual dataset. In addition, this differential is critical for the discriminator in our GAN model, since it must properly differentiate between real and synthetic ECGs in order to train both itself and the generator. Finally, examining how the model differentiates between actual and synthetic ECGs over time offers useful insights into its performance and serves as a roadmap for future improvements.
| Algorithm 2: ECG synthetic data generation using GAN with Bi-LSTM. |
|
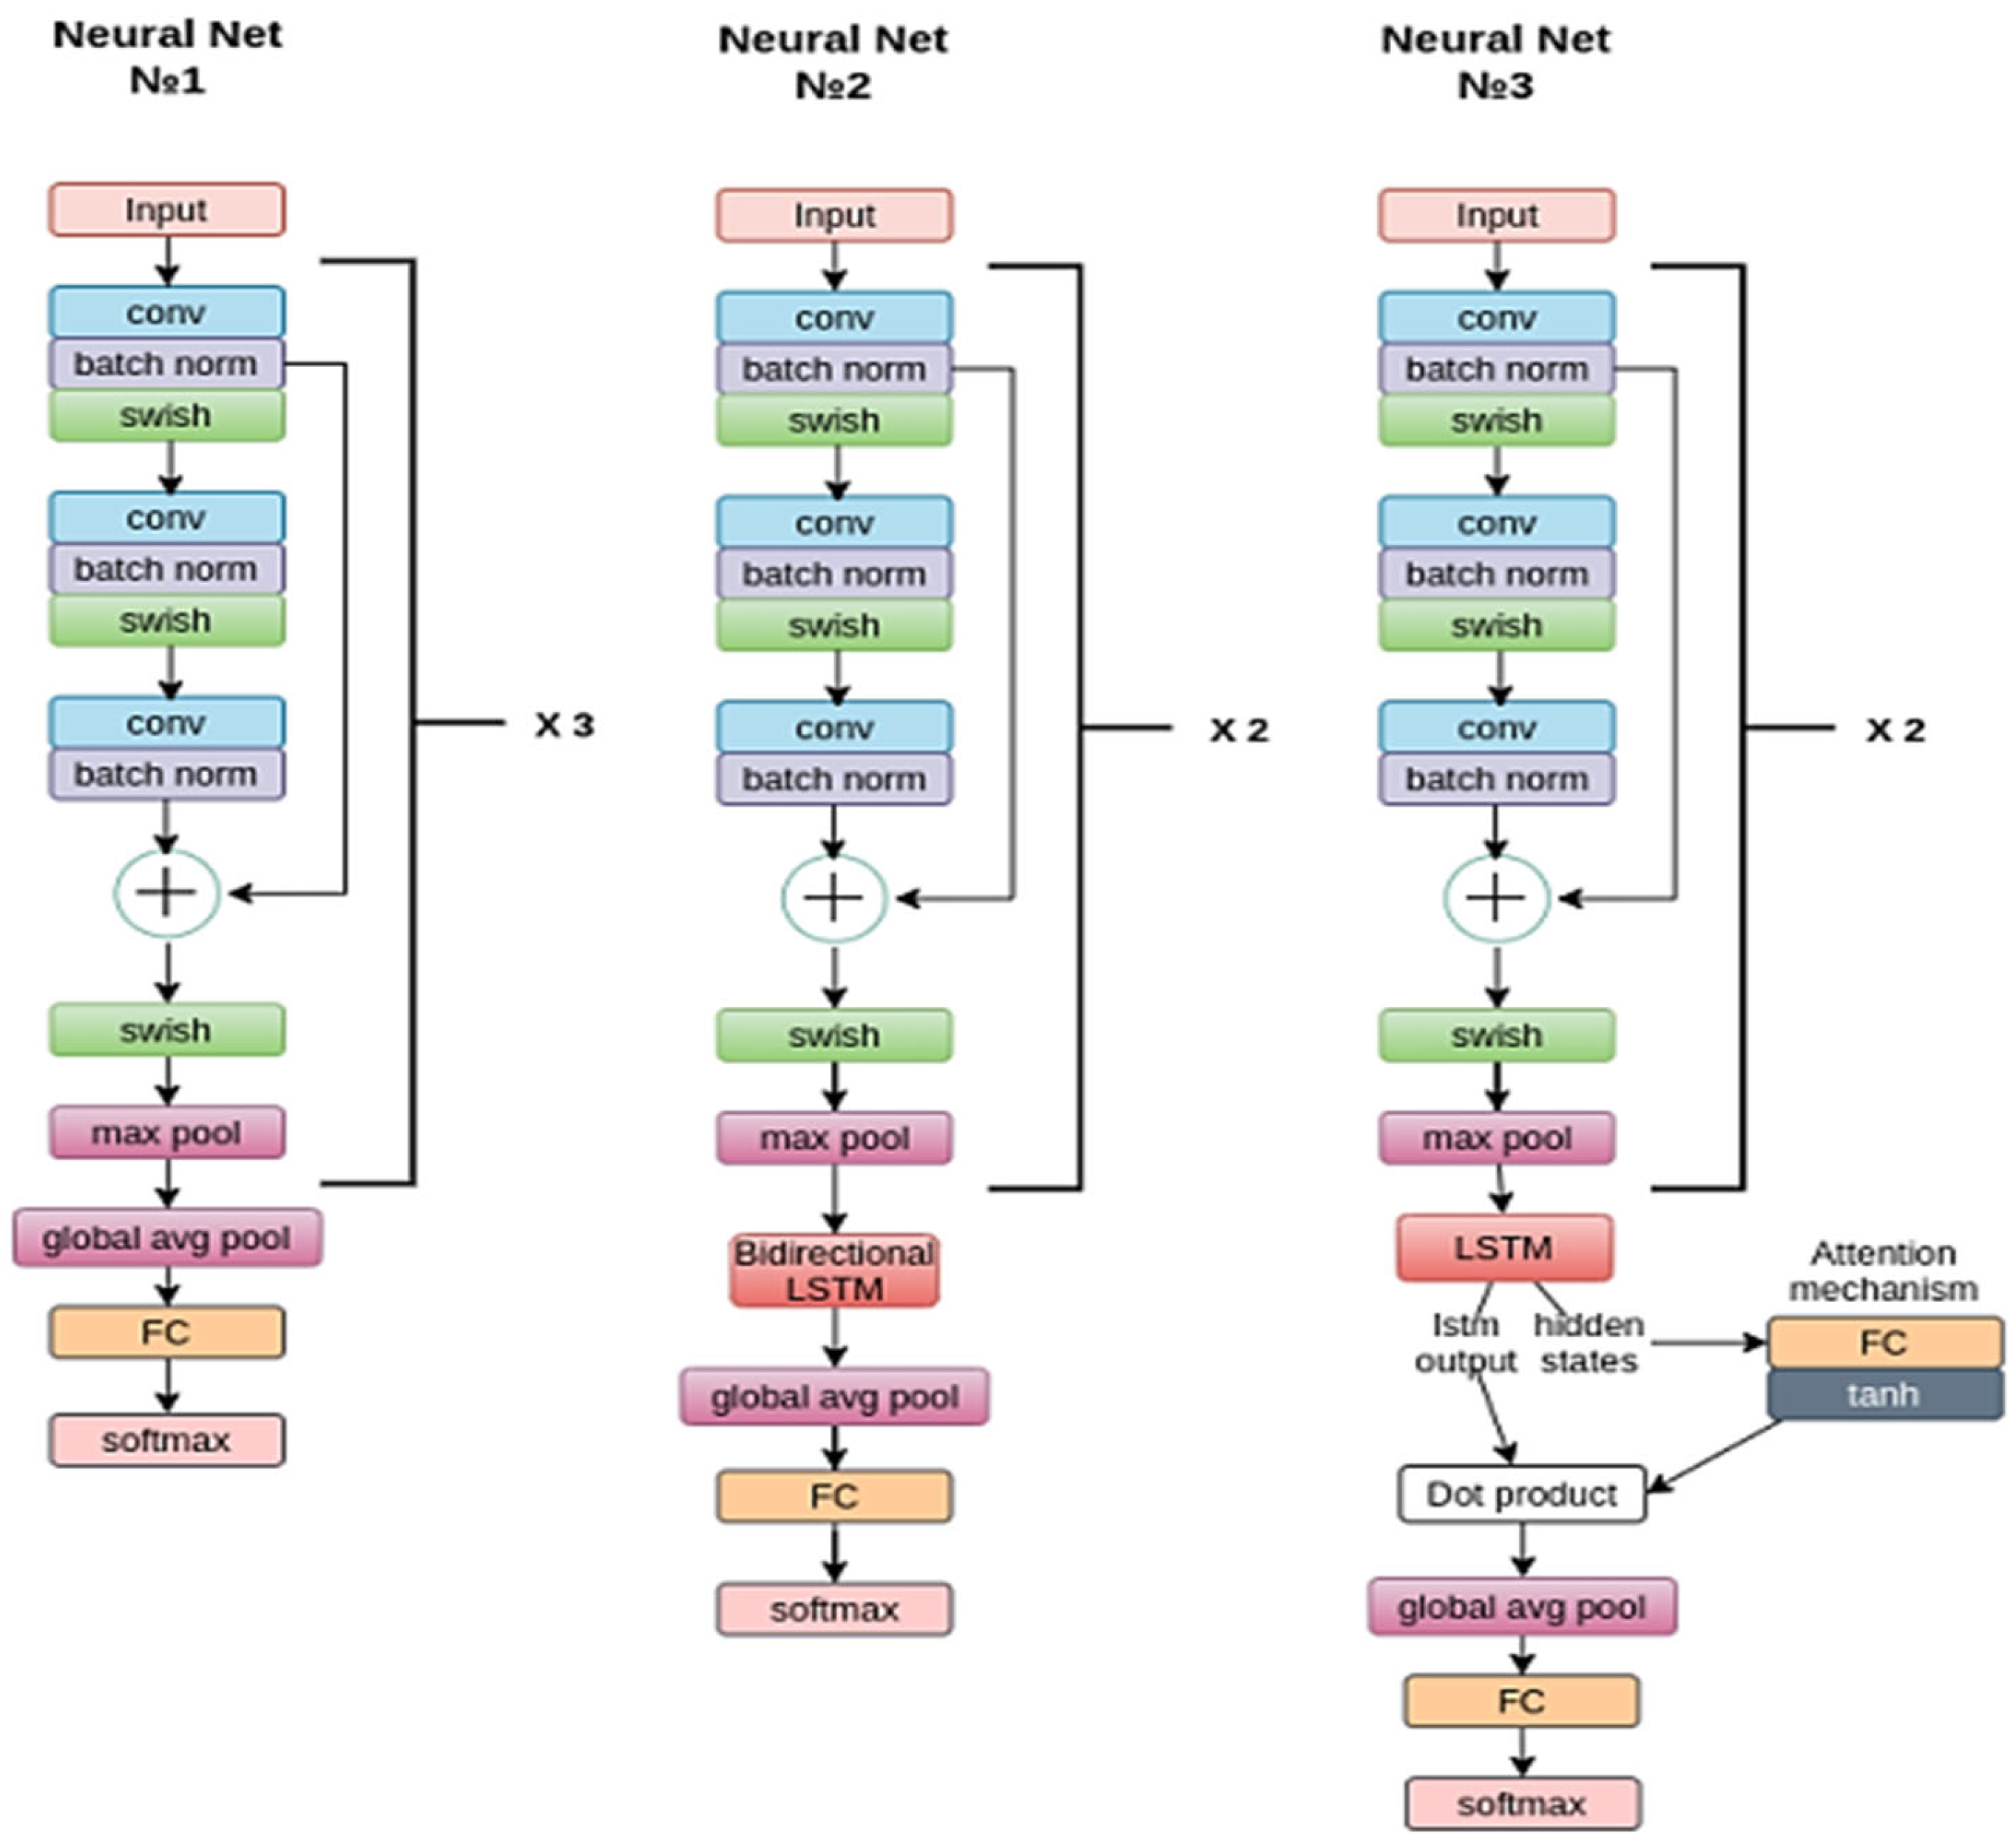
3.2. Proposed Model Architectures
This work centers around the detection of arrhythmias in the MIT-BIH ECG dataset as well as GAN-generated synthetic ECG signals. To classify the ECG rhythms into distinct AAMI categories, we introduced three deep learning neural networks: SkipCNN, SkipCNN+LSTM, and SkipCNN+LSTM+Attention (Figure 5).

Figure 5.
Layer-wise architectures of the proposed ECG classification deep models.
The SkipCNN model (Neural Net No.1) comprises three ConvNormPool blocks, which perform ECG feature extraction and pattern recognition processes. Every ConvNormPool block comprises three 1D convolutional layers (Conv1d), each with a kernel size of 5, that capture local patterns and features, followed by batch normalization layers (BatchNorm1d) to standardize the inputs, ensuring stable and efficient training. Non-linear characteristics are introduced by integrating Swish activation functions, thus providing the model with the capability to acquire intricate data relationships. Furthermore, each ConvNormPool block contains a max-pooling layer, and the spatial dimensions of feature maps are reduced, while the most crucial information is retained in the process, rendering the data more manageable for subsequent layers. Of note, the inclusion of skip connections facilitates the flow of gradients during training, thereby mitigating vanishing gradients, which helps the model learn more effectively. A final FC layer with a kernel size of 5 and 128 hidden neurons aggregates features from preceding layers to make final predictions using its softmax function. Similar to the convolutional layers, the fully connected layer benefits from a skip connection. This connection ensures that the model maintains access to critical information from earlier stages, even as it nears the final classification decision.
The SkipCNN+LSTM model (Neural Net No.2) combines SkipCNN and LSTM. The SkipCNN component comprises two ConvNormPool blocks. Each ConvNormPool block contains three 1D convolutional layers (Conv1d)—each of kernel size 5—that are augmented with batch normalization layers (BatchNorm1d) and Swish activation functions to facilitate feature extraction and maintain training stability. Max-pooling layers, each of kernel size 2, are added. Notably, a skip connection is incorporated between the first and second convolutional layer blocks to ensure smooth gradient flow and preserve crucial information. The LSTM component comprises a Bi-LSTM of hidden size 64, which allows the model to consider both past and future contexts during learning, enhancing the ability to recognize intricate temporal patterns and relationships within the ECG signals. The overall model architecture is completed with a fully connected layer (fc)—with kernel size 5 and hidden size 64—which aggregates features to make final predictions. It benefits from both bidirectional processing and skip connection; the former allows the model to capture temporal information from both directions in the sequential data, and the latter facilitates the retention of essential information from earlier stages of feature extraction. The SkipCNN+LSTM+Attention model (Neural Net No.3) adds an attention mechanism to the above. Similar to the aforementioned models, the SkipCNN component comprises two ConvNormPool blocks, within each are three 1D convolutional layers (Conv1d) with kernel size 5, batch normalization layers (BatchNorm1d), and Swish activation functions. Max-pooling layers, each with kernel size 2, are included to downsample the feature maps. A skip connection between the first and third convolutional layers enhances the model’s gradient flow while preserving vital information. After the third block’s max-pooling layer, an attention layer (attn) is integrated. Attention mechanisms have proven effective in focusing on specific portions of the input sequence that are most relevant for making predictions. In this case, a linear layer is used to implement the attention mechanism, enabling the model to dynamically weigh the importance of different elements within the ECG signal. An LSTM layer (which is not bidirectional), configured with a hidden size of 64, is incorporated, allowing the model to capture temporal patterns in a unidirectional manner. The architecture is completed with a fully connected layer (fc), with kernel size 5 and hidden size 64.
4. Experimental Results
The study dataset comprised 109,446 ECG beats from the MIT-BIH arrhythmia dataset, which had been mapped into five significantly imbalanced classes (Table 2). To address this imbalance, we first focused on generating a synthetic ECG dataset for the two minority classes, S and F (Table 2), using a novel GAN that incorporated a Bi-LSTM architecture in both its generator and discriminator functions (Section 3.1). By generating synthetic ECG beats that closely resembled real ECG beats from the minority classes, we aimed to balance the dataset and ensure that the arrhythmia detection model had sufficient representation of the underrepresented classes, thereby optimizing model training to detect arrhythmias across all classes. Both the real and synthesized ECGs were then input to deep learning networks (Section 3.1), as well as an ensemble of these networks, for downstream classification.
We ran our experiments on a laptop computer with the following hardware specifications: Intel Xeon CPU comprising two virtual CPUs; 12GB of DDR4 RAM; and NVIDIA Tesla K80 GPU with 12GB dedicated graphics memory, which was necessary to speed up deep learning tasks and complex data processing. The model was implemented using Python programming within the PyTorch environment, a popular open-source deep learning framework, which allowed for flexible and efficient experimentation. We experimented and obtained the following optimized hyperparameters for training the GAN model: learning rate (lr), 0.0002; batch size, 96; number of epochs, 3000 iterations; optimizer (for both the generator and discriminator); and Adam optimizer with a learning rate of 0.0002 (Table 3).
Table 3.
Hyperparameters for the proposed deep learning models.
4.1. GAN for ECG Beat Generation
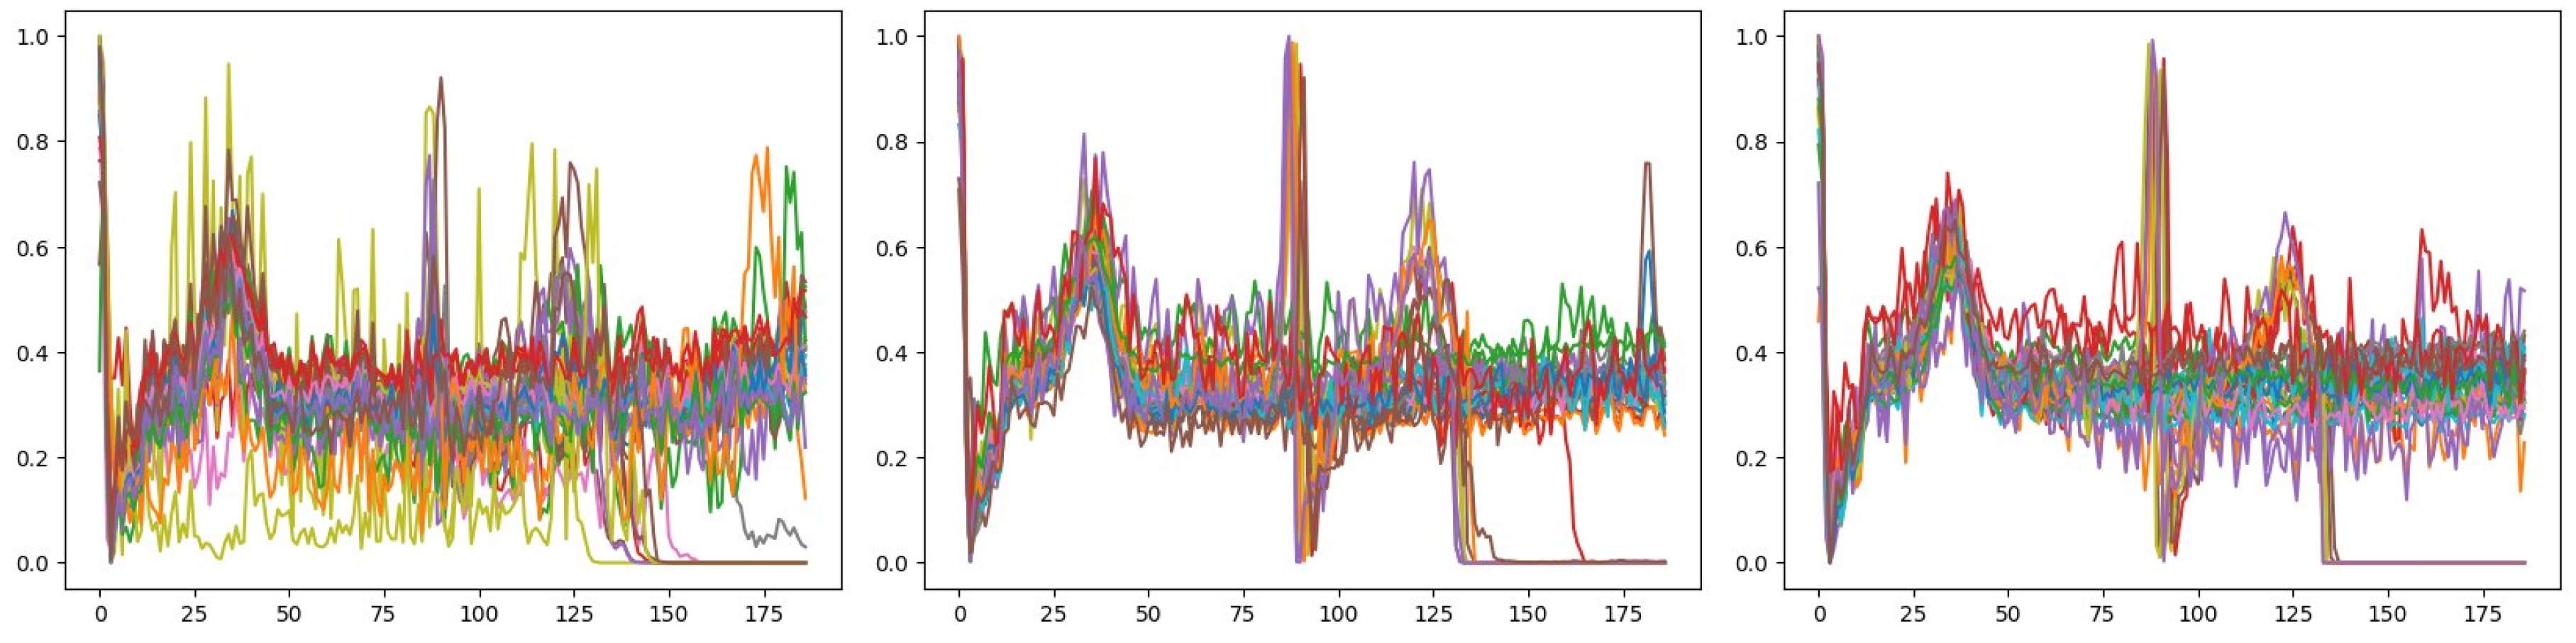
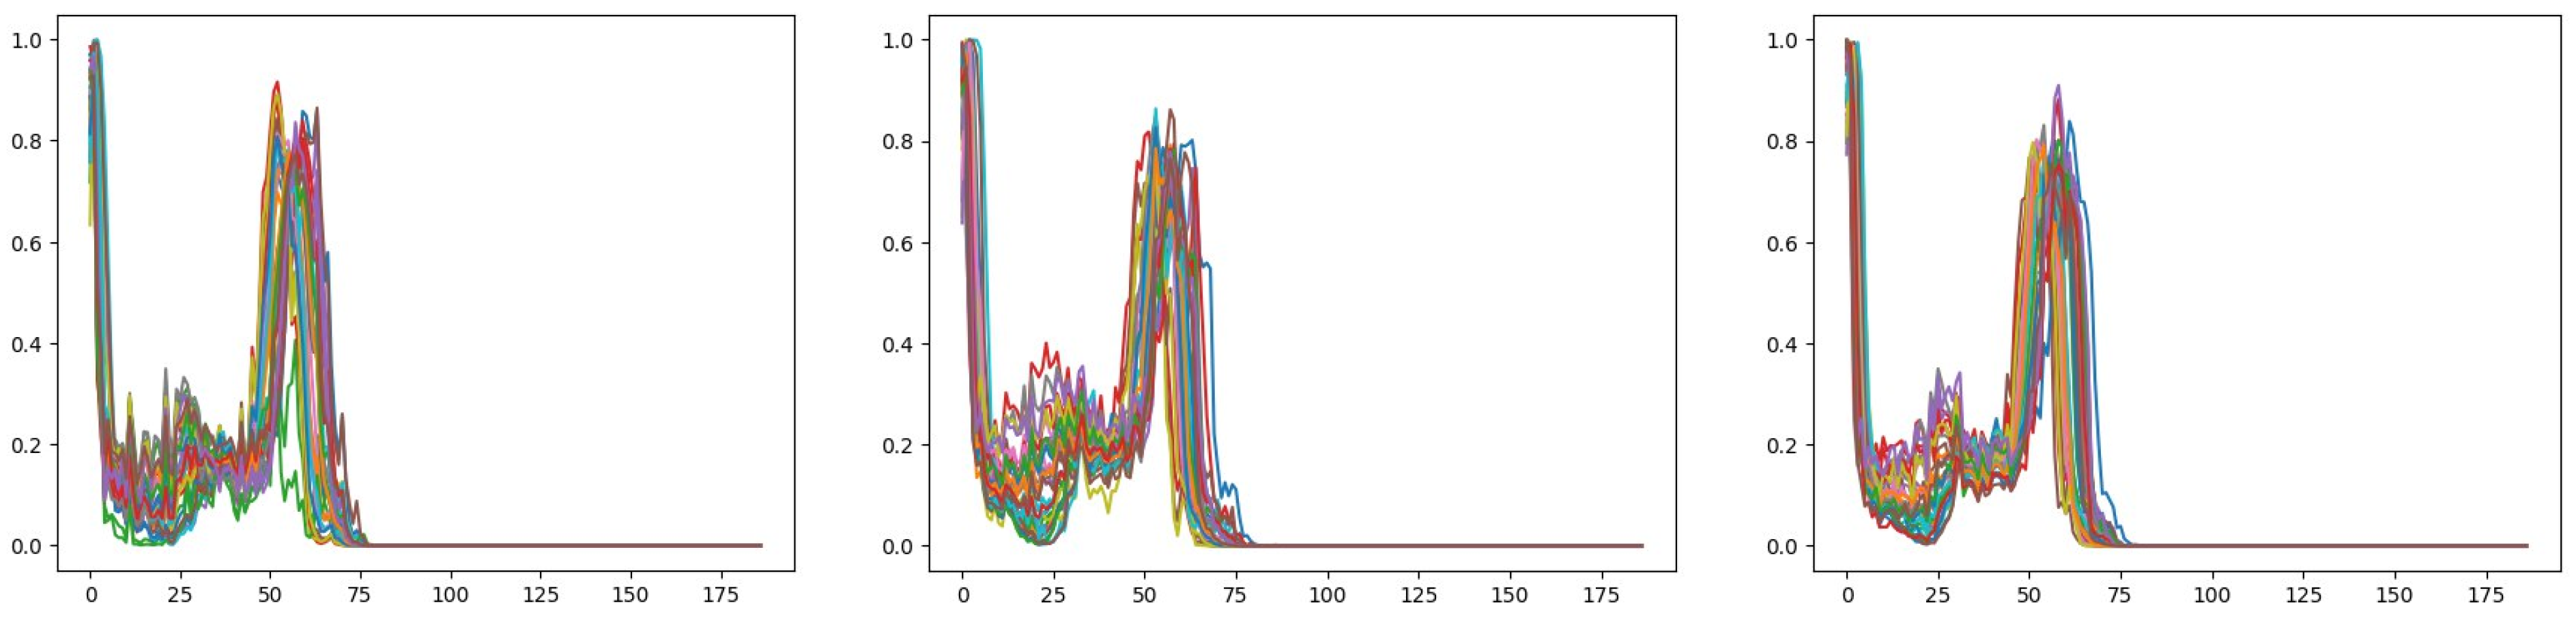
We input 2085 and 460 ECG signals of the S and F AAMI classes, respectively, to the GAN model to generate synthetic ECG signals of these two minority classes. The training was conducted over a total of 3000 epochs to refine the GAN model. For the synthesis of ECG beats of the S class, with an increasing number of training epochs, the generated ECG signals converged (Figure 6) and became more similar to the original ECG signals (Figure 7) with demonstrable progressive decremental discriminator training error (Table 4 and Figure 8). This signifies the GAN model’s ability to capture the underlying patterns and characteristics of the target S ECG class. Of note, the training time expended for each set of 300 epochs remained relatively constant throughout the training process (Table 4), suggesting that the training and signal generation processes were able to maintain a consistent uniform pace throughout, underscoring the model’s reliability.

Figure 6.
Generation of ECG beats of the S class by the GAN model. Each graph depicts overlayed synthetic ECG signals with uniform fixed length (size 187) in common with the pre-processed input ECG signals; the graphs are shown from left to right and top to bottom in the temporal sequence of the generated signals at intervals of 900 training epochs. Compared with the beginning of training (top left graph), the synthetic signals demonstrate more convergence toward the end of training (bottom right graph).

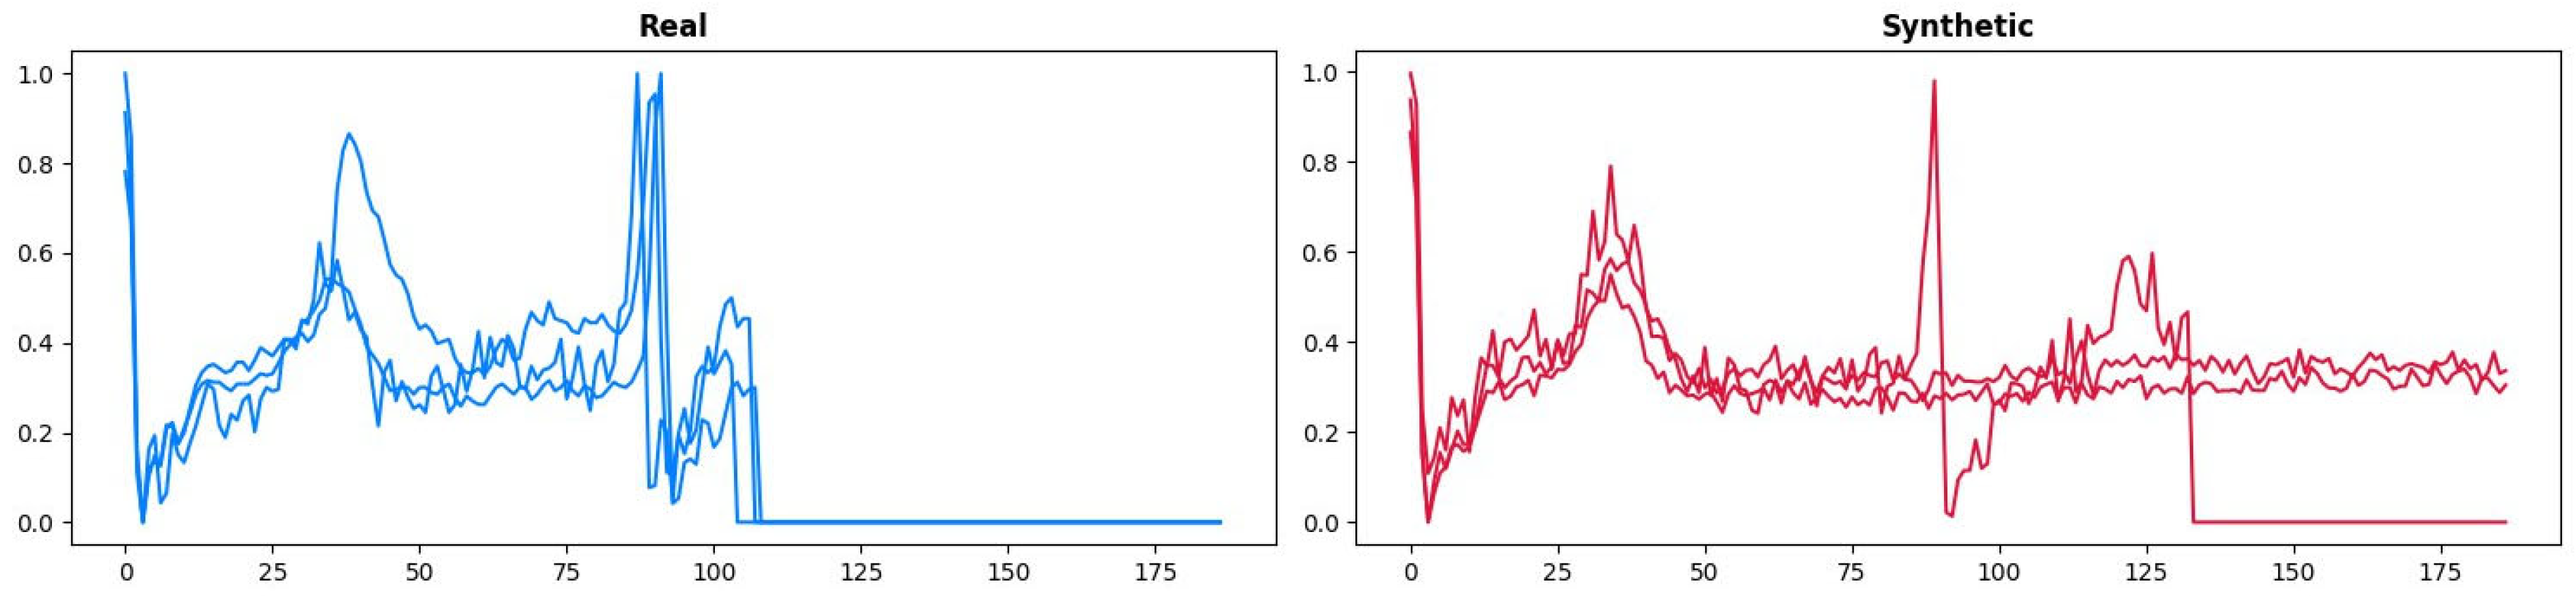
Figure 7.
Real (left) and GAN-generated synthetic (right) ECG beats of the S class. The synthetic ECG beat appears visually realistic.
Table 4.
Log of the training process for ECG beat generation of the S class using the GAN model. Cumulative training times at fixed intervals of 600 epochs and training errors, expressed as discriminator loss (Loss_D) and generator loss (Loss_G), are shown.
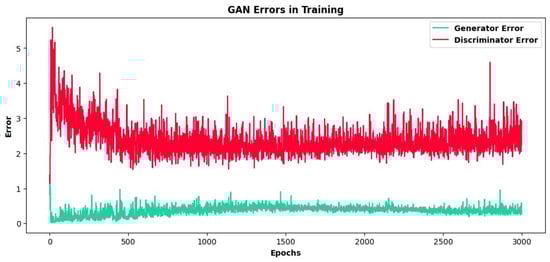
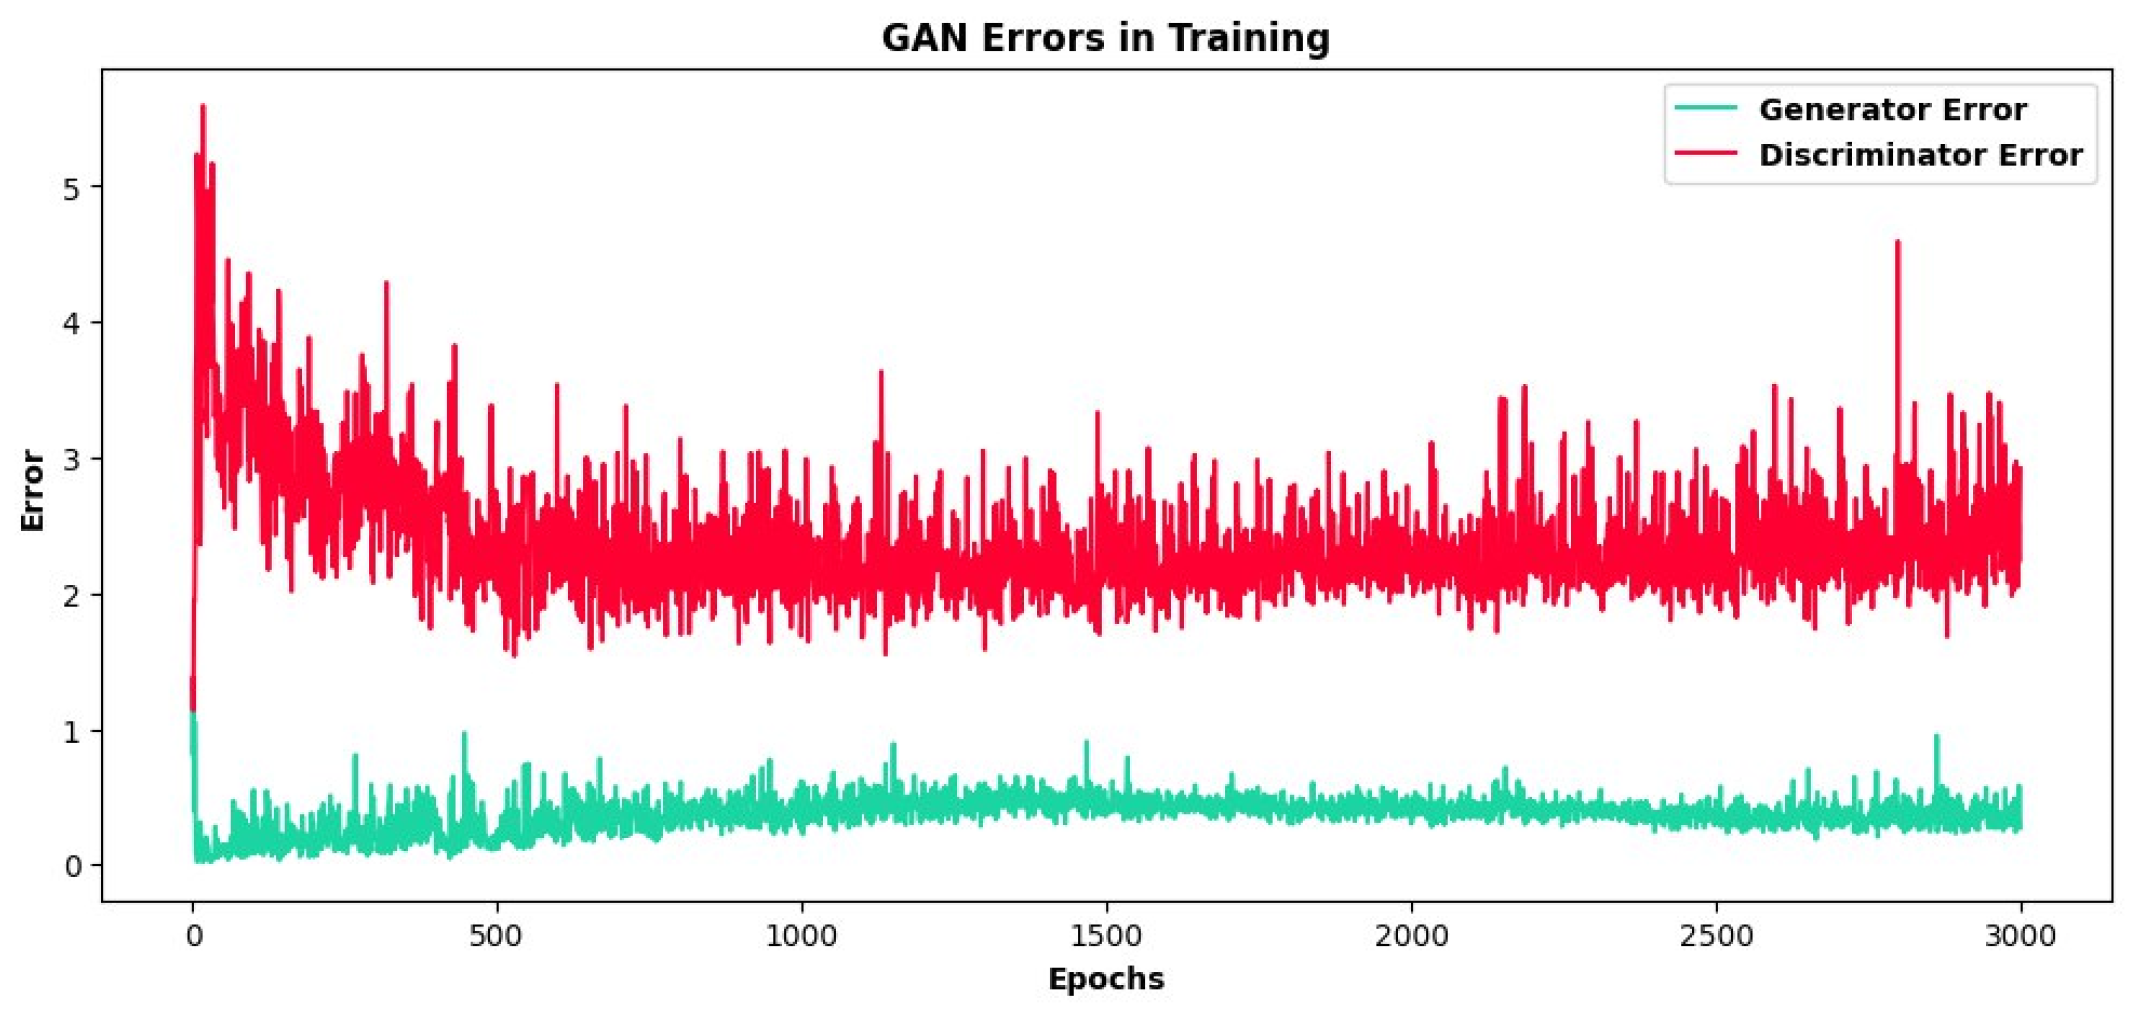
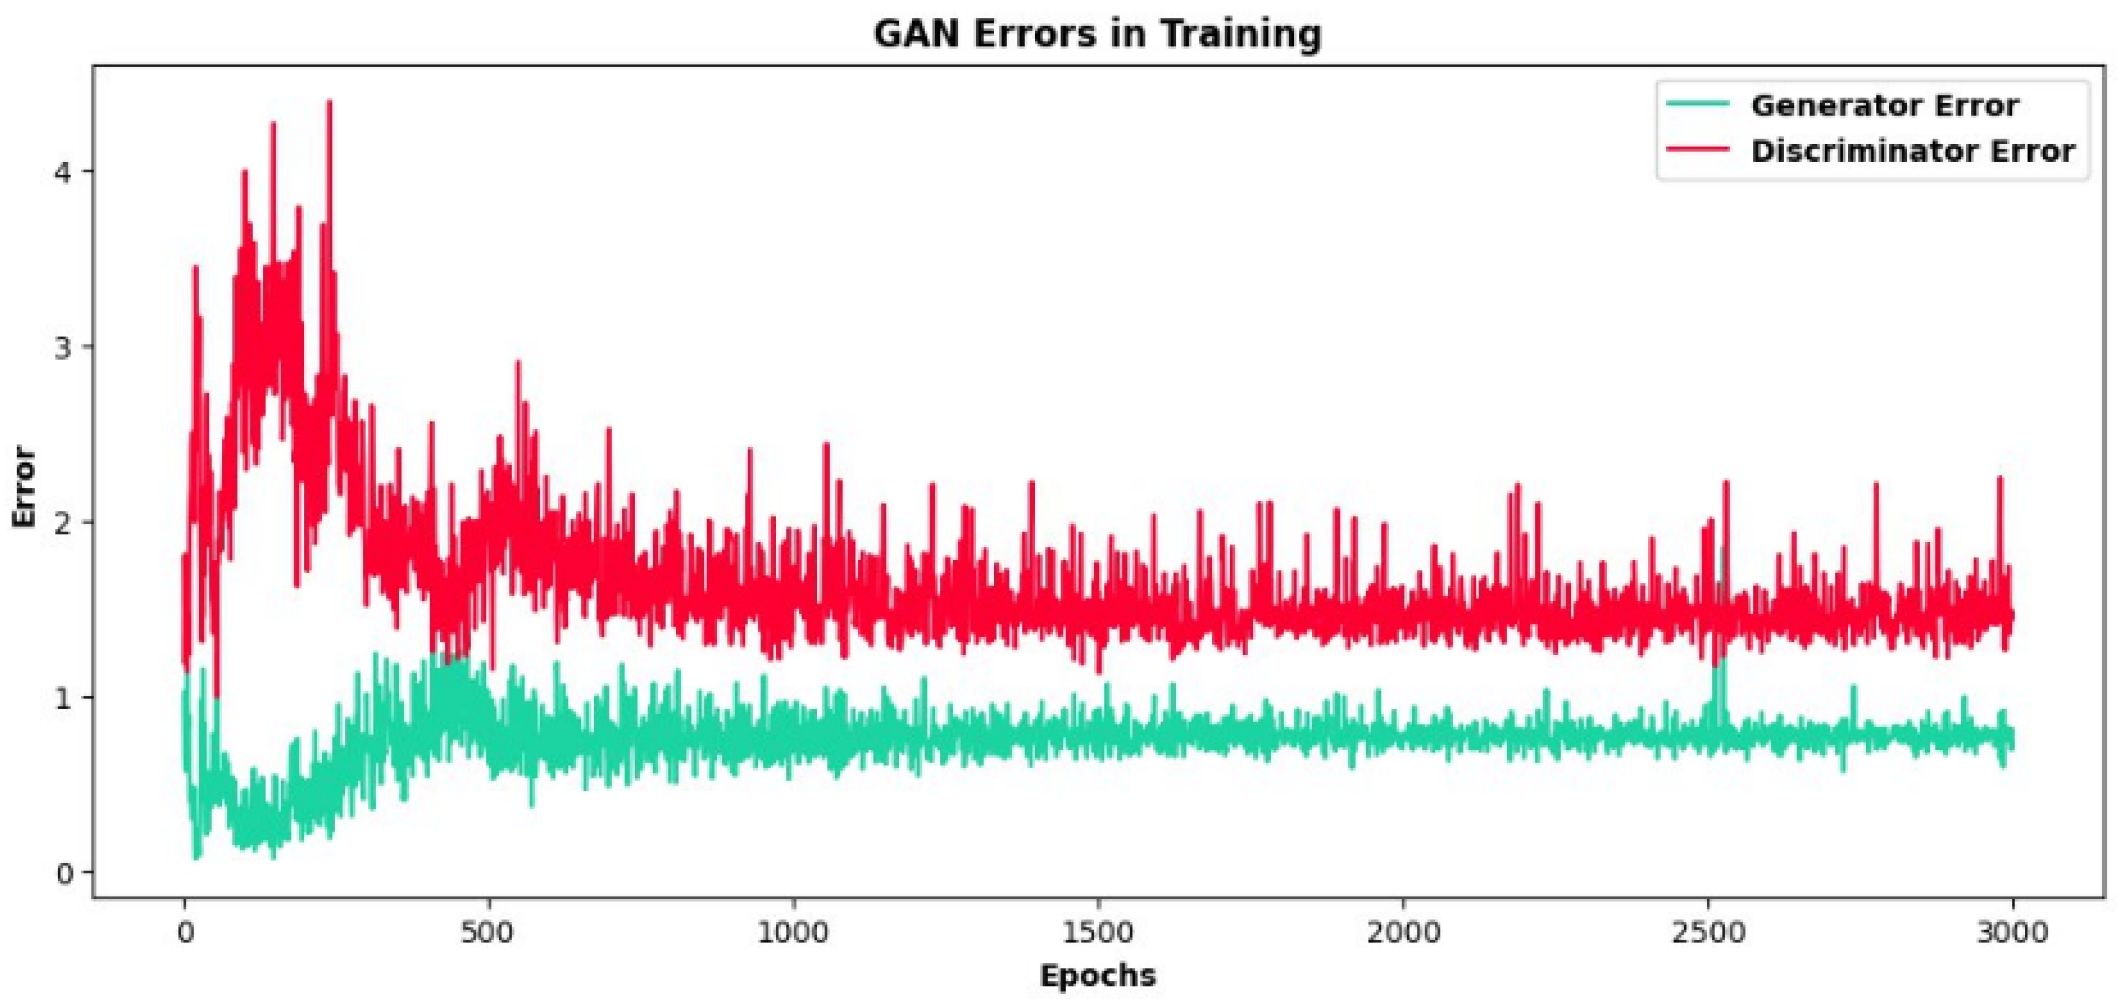
Figure 8.
Visual depiction of progressive discriminator training error (which quantifies differences between the real and synthetic ECG signals) and generator training error measured over 3000 epochs during ECG beat generation of the S class using the GAN model. The discriminator training error is reduced substantially with training, whereas the generator training error remains largely flat.
In a like manner, for the synthesis of ECG beats of the F class, with an increasing number of training epochs, the generated ECG signals converged (Figure 9) and became more similar to the original ECG signals (Figure 10), with demonstrable progressive decremental discriminator training error (Table 5 and Figure 11). This signifies the GAN model’s ability to capture the underlying patterns and characteristics of the target F ECG class. As noted for the S class, the training time expended for each set of 300 epochs remained relatively constant throughout the training process (Table 5), suggesting that the training and signal generation processes were able to maintain a consistent uniform pace throughout, underscoring the model’s reliability for data augmentation across different minority ECG classes.
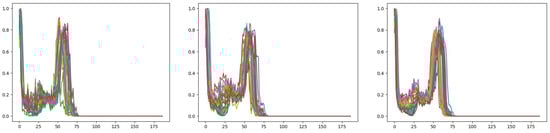
Figure 9.
Generation of ECG beats of the F class by the GAN model. Each graph depicts overlayed synthetic ECG signals with uniform fixed length (size 187) in common with the pre-processed input ECG signals; the graphs are shown from left to right and top to bottom in the temporal sequence of the generated signals at intervals of 900 training epochs. Compared with the beginning of training (top left graph), the synthetic signals demonstrate more convergence toward the end of training (bottom right graph).
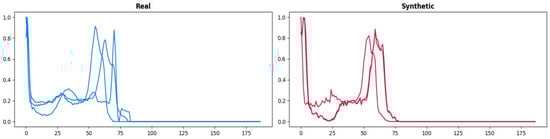
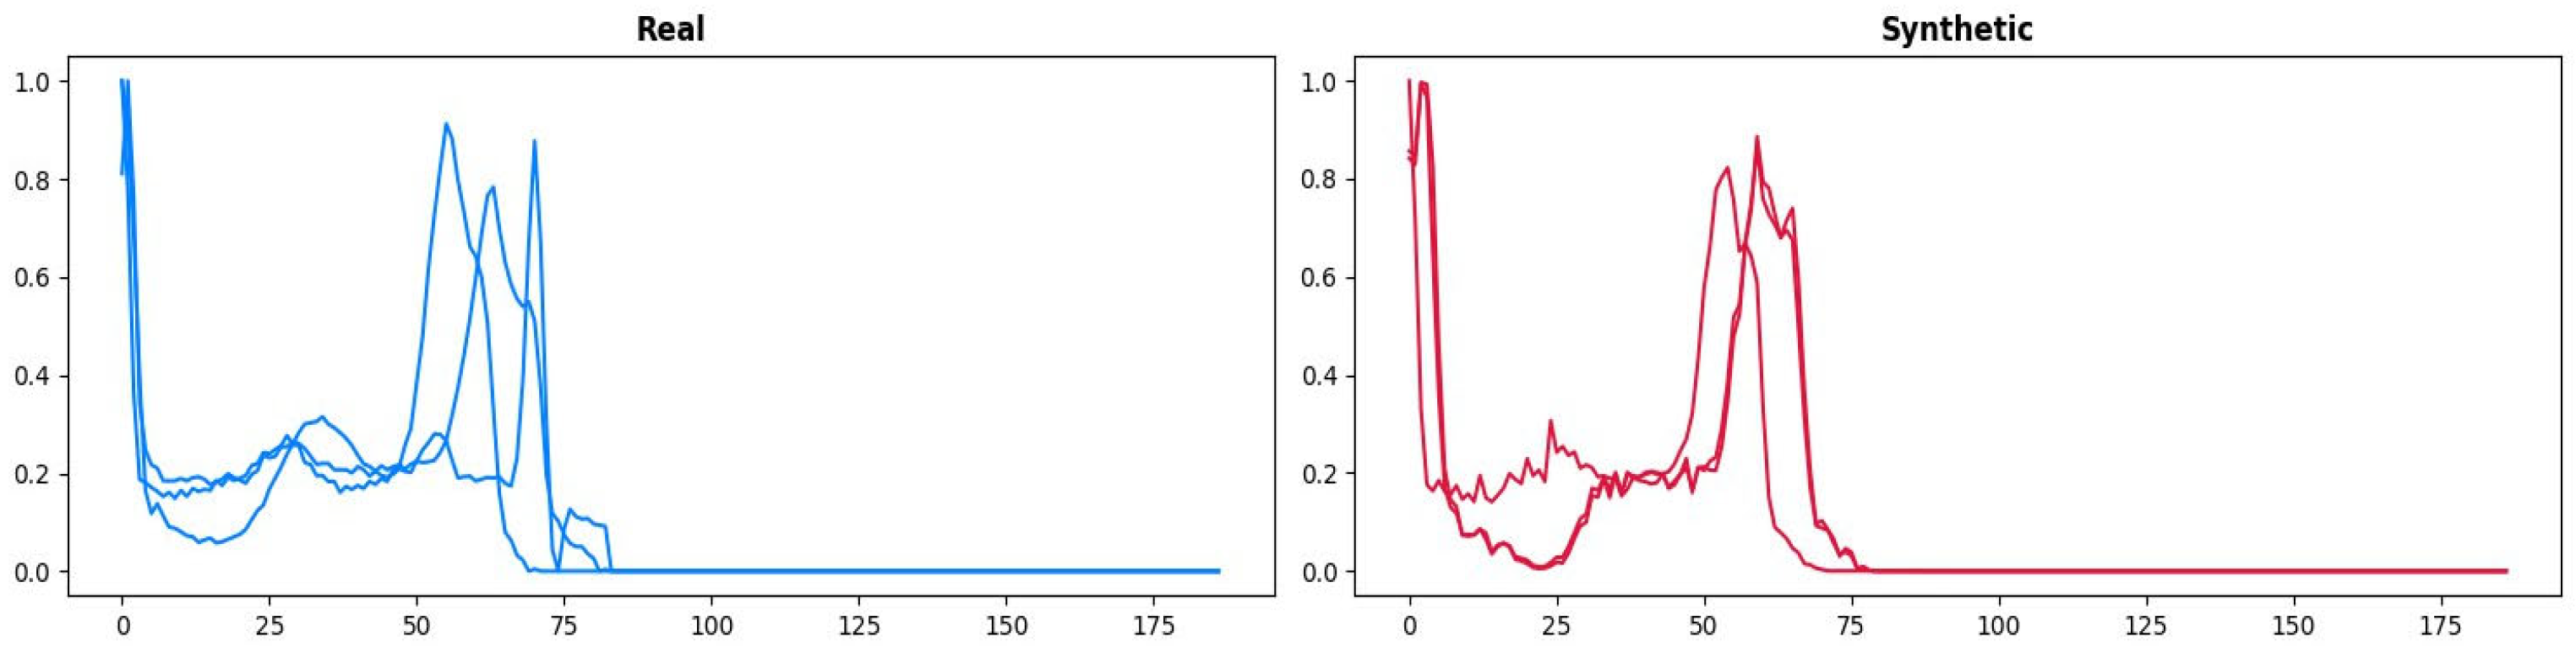
Figure 10.
Real (left) and GAN-generated synthetic (right) ECG beats of the F class. The synthetic ECG beat appears visually realistic.
Table 5.
Log of the training process for ECG beat generation of the F class using the GAN model. Cumulative training times at fixed intervals of 600 epochs and training errors, expressed as discriminator loss (Loss_D) and generator loss (Loss_G), are shown.

Figure 11.
Visual depiction of progressive discriminator training error (which quantifies differences between the real and synthetic ECG signals) and generator training error measured over 3000 epochs during ECG beat generation of the F class using the GAN model. The discriminator training error is reduced substantially with training, whereas the generator training error increases initially but then decreases and remains flat.
In the context of generative adversarial networks (GANs), the generator loss and discriminator loss are critical components for training the GAN model. These losses are used to optimize the generator (G) and discriminator (D) networks in a two-player minimax game. Equations (44) and (45) are mathematical representations of these losses:
where D(x) signifies the likelihood that x originated from the actual data. G is a differentiable function, depicted as a multilayer perceptron. D and G engage in the ensuing two-player minimax game, involving the value function.
4.2. Similarity Matching of Synthetic ECG Signals
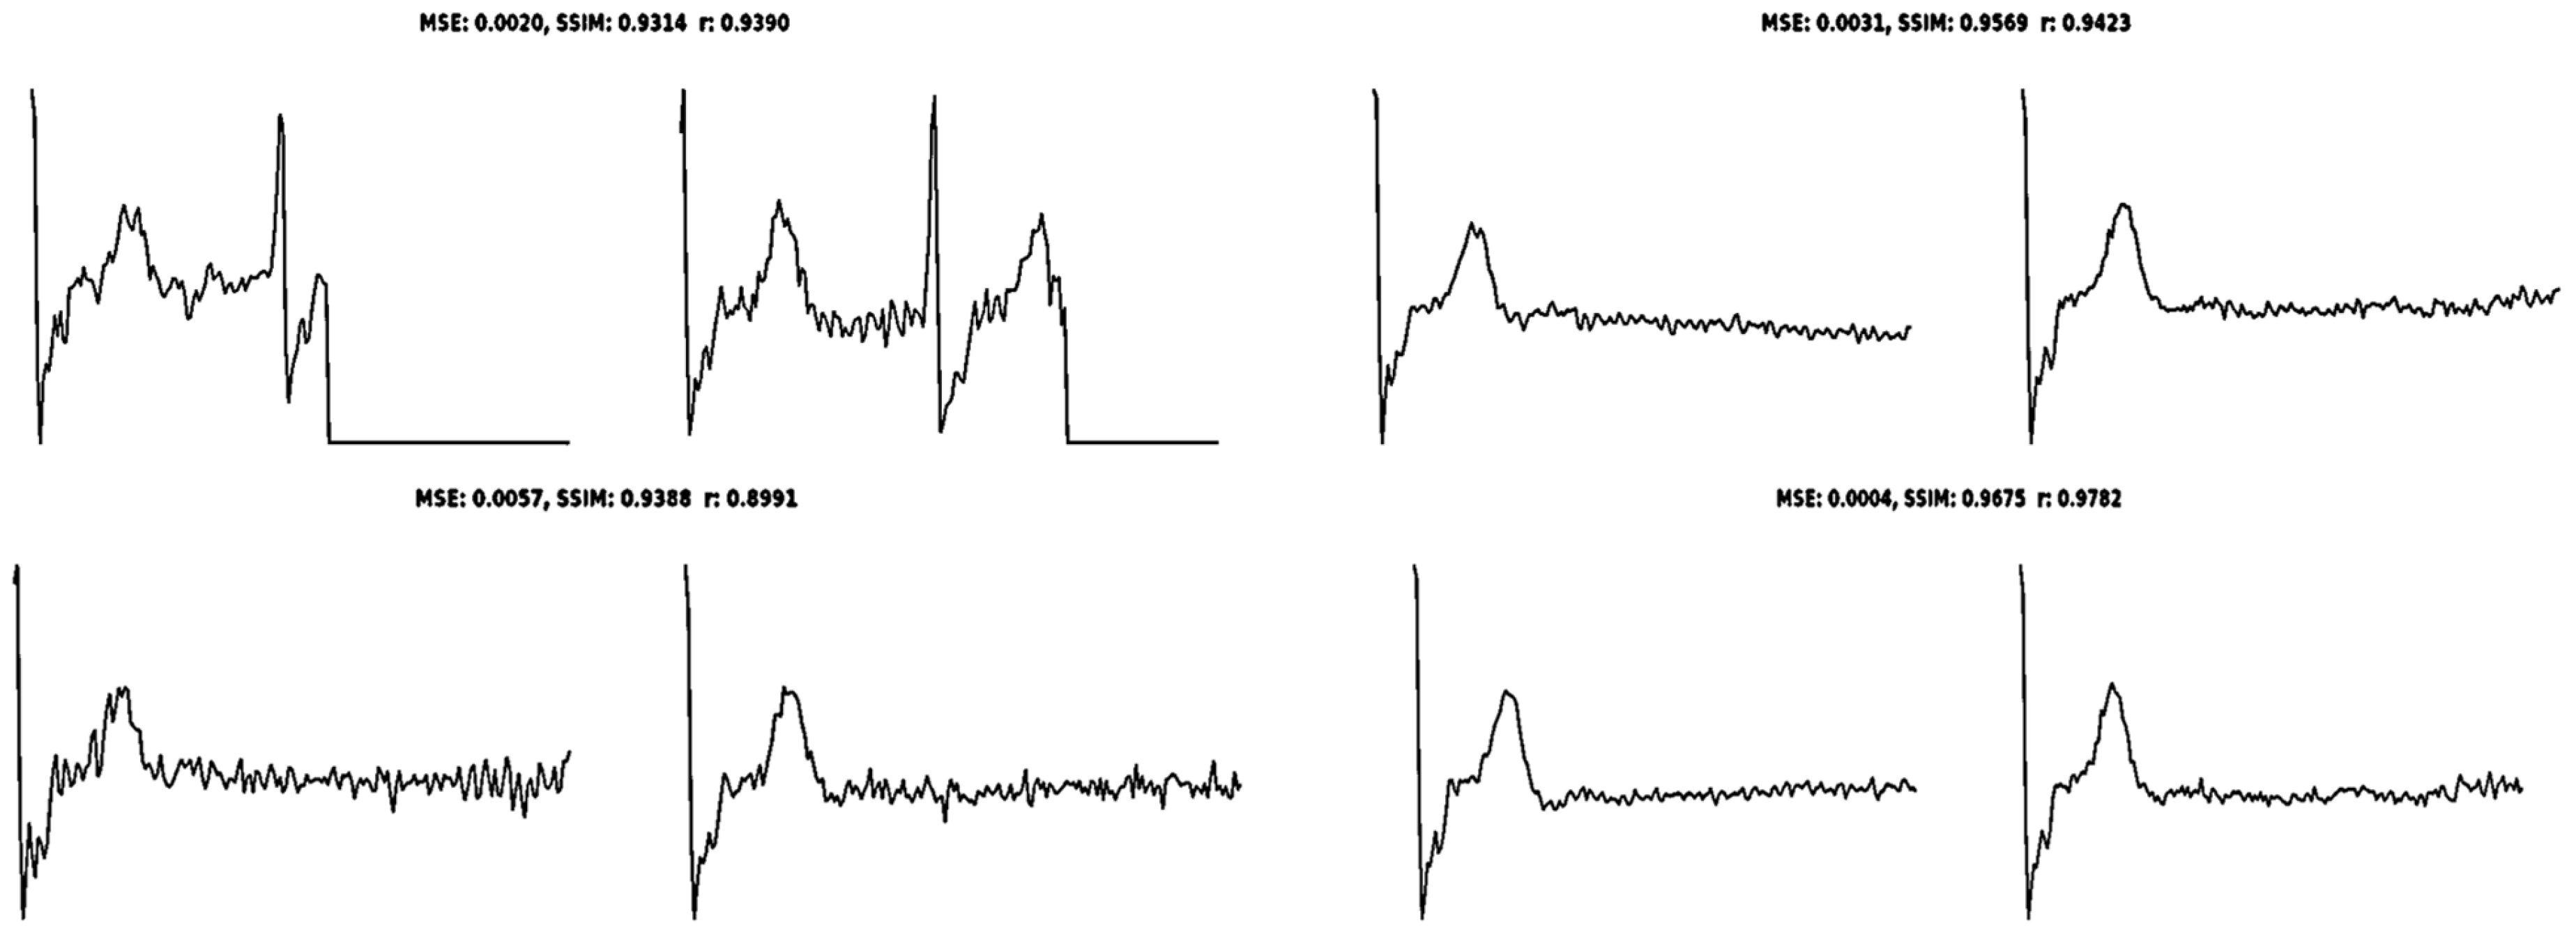
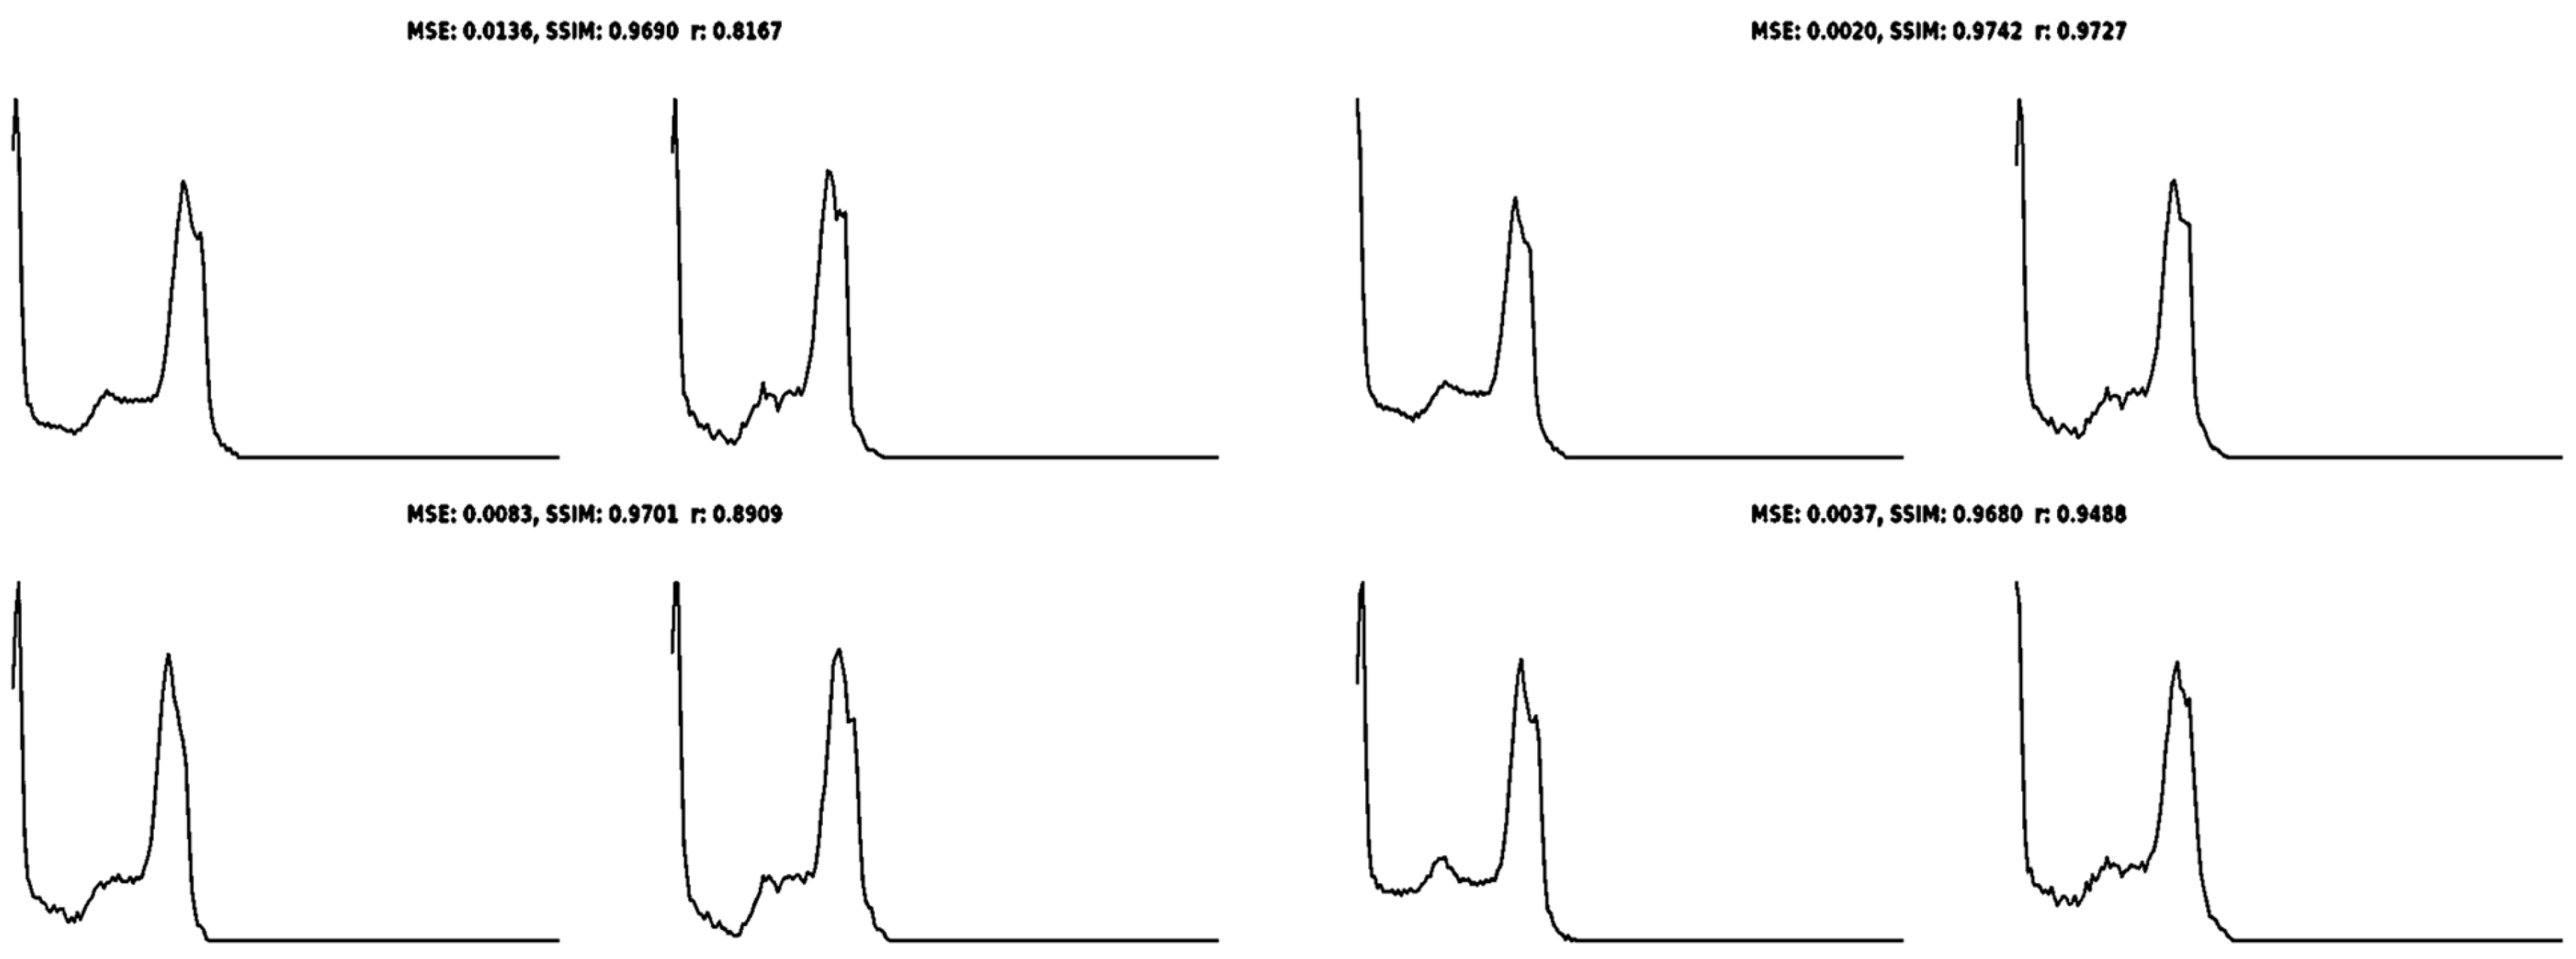
We analyzed the similarity between the synthesized and real ECGs using the MSE, SSIM, and Pearson correlation coefficient, r. For S-class ECG beats, (1) the MSE ranged from 0.0004 to 0.0057, indicating relatively low levels of error in the synthetic signals; (2) the SSIM ranged from 0.9314 to 0.9675, indicating high similarity; and (3) r ranged from 0.8991 to 0.9782, indicating high linear correlation (Figure 12). Similarly, for F-class ECG beats, (1) the MSE ranged from 0.0020 to 0.0136, indicating relatively low levels of error in the synthetic signals; (2) the SSIM ranged from 0.9680 to 0.9742, indicating high similarity; and (3) r ranged from 0.8167 to 0.9727, indicating high linear correlation (Figure 13). These results confirm the proposed GAN model’s ability to generate synthetic signals in minority ECG classes versus real ECGs.
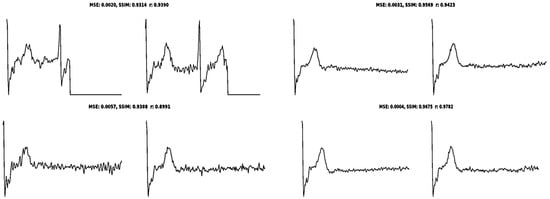
Figure 12.
Randomly selected real (left) and synthetic (right) ECG signals of the S class, with corresponding calculated similarity matching scores MSE, SSIM, and r.
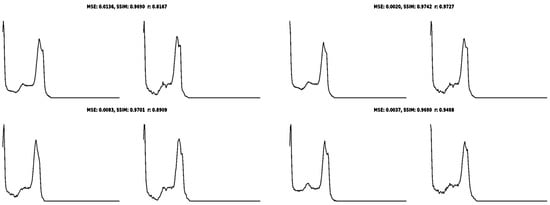
Figure 13.
Randomly selected real (left) and synthetic (right) ECG signals of the F class, with corresponding calculated similarity matching scores MSE, SSIM, and r.
4.3. Dataset Distribution
The GAN was able to synthesize 2400 and 1536 realistic ECGs with high quantifiable similarity matching from 2085 S-class and 460 F-class training ECGs, respectively, yielding an augmented dataset with substantially improved representation of the minority ECG classes for more effective training and an equitable train–test split across all classes (Table 6). Of note, the number of ECG beats of all classes in the test set (approximately 16% of the total ECG beats in the MIT-BIH database) remained unchanged, which ensured unbiased model testing using only original and unseen ECG data.
Table 6.
Dataset ECG class distribution before and after GAN augmentation with the train–test split.
4.4. Arrhythmia Detection Using Proposed Models
The expanded 113,382-sample combined original and synthetic dataset was divided into training and test sets comprising 96,374 (85%) and 17,008 (15%) ECG bests, respectively. We conducted prior experiments to optimize the train–test split ratio and found an 85:15 train–test split to yield the most favorable outcomes for arrhythmia detection. To validate our model, we subdivided the 85% training set into a training subset of 90,705 (80%) ECG beats and a validation subset of 5669 ECG beats (5%).
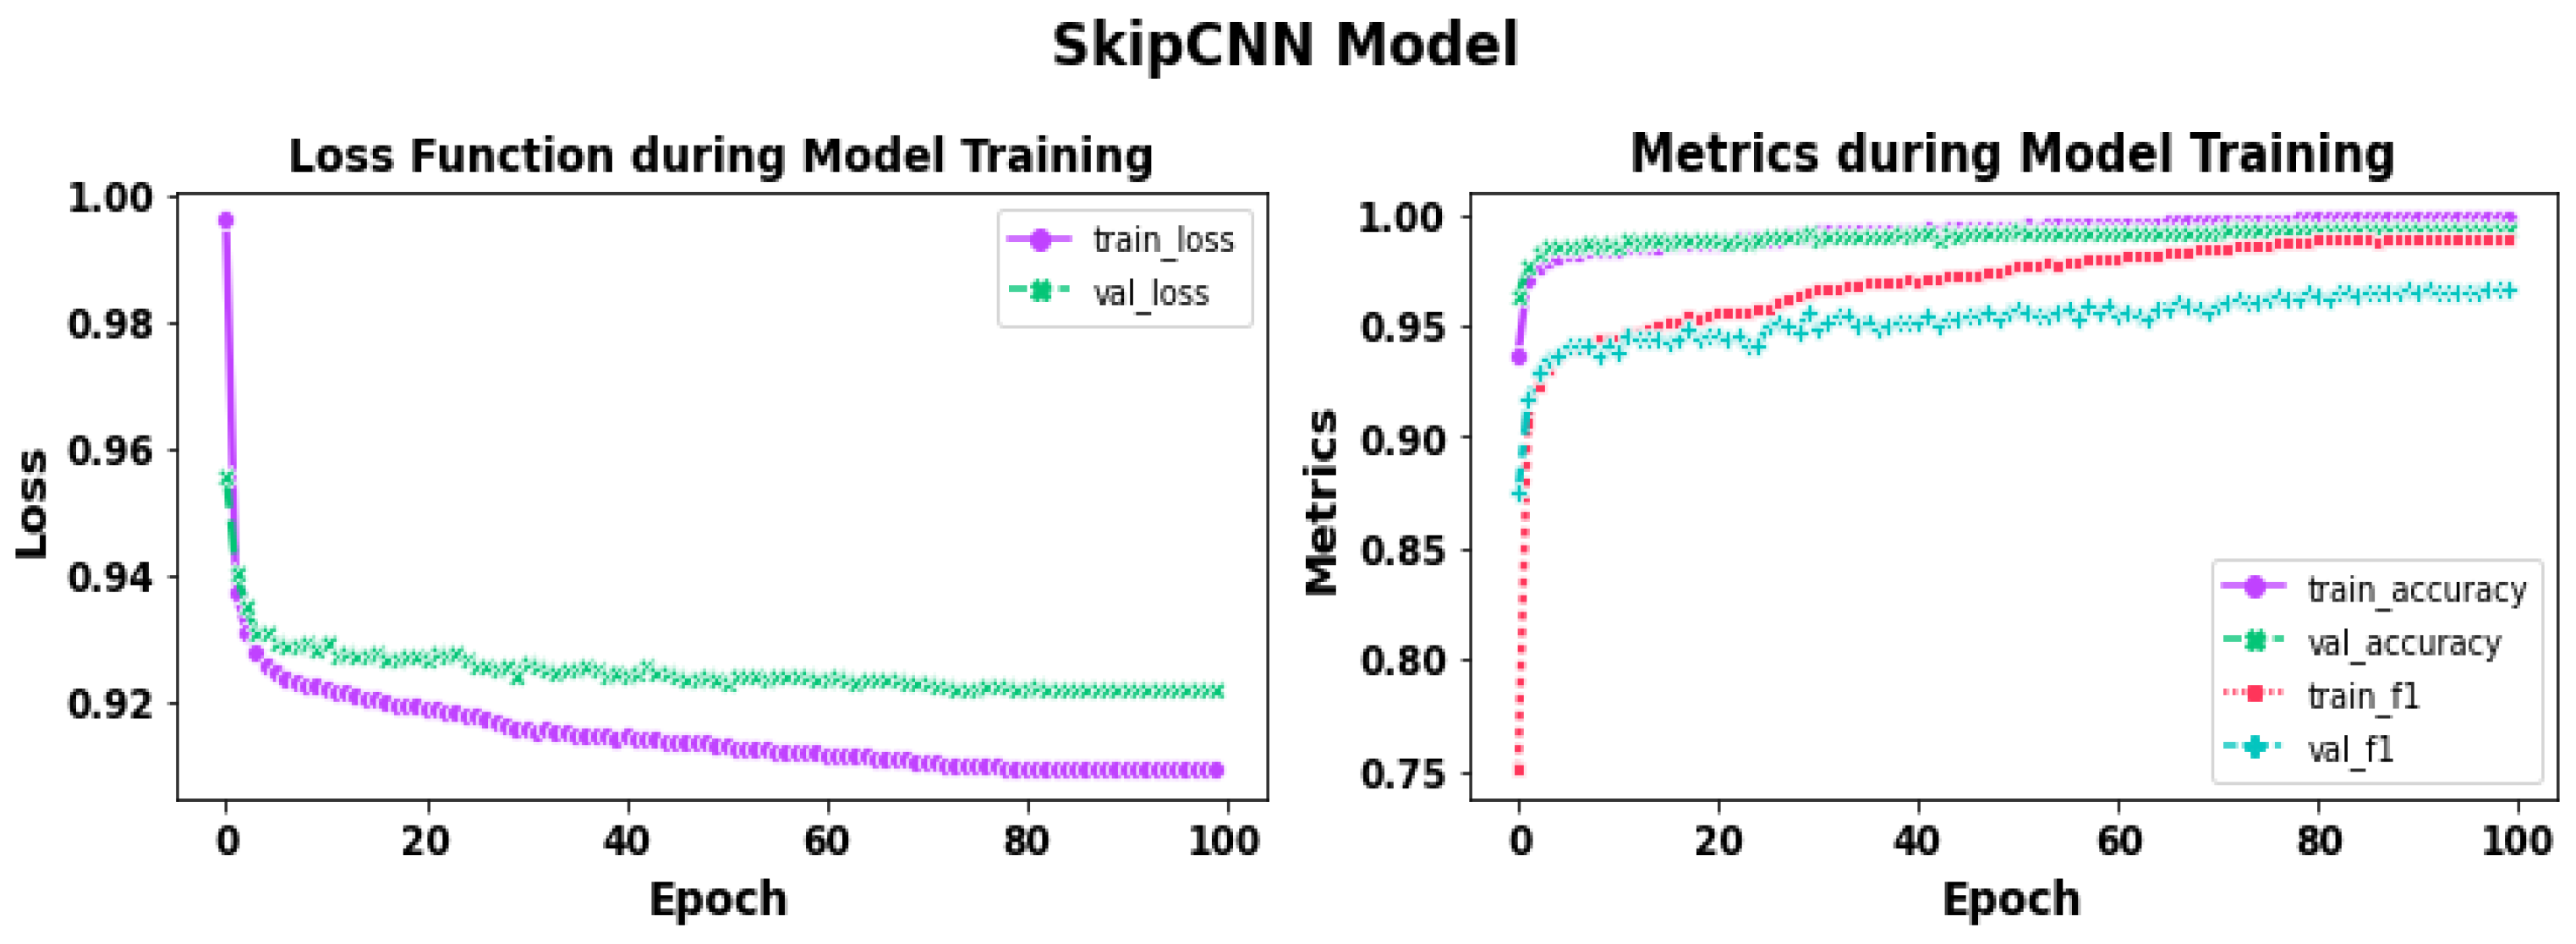
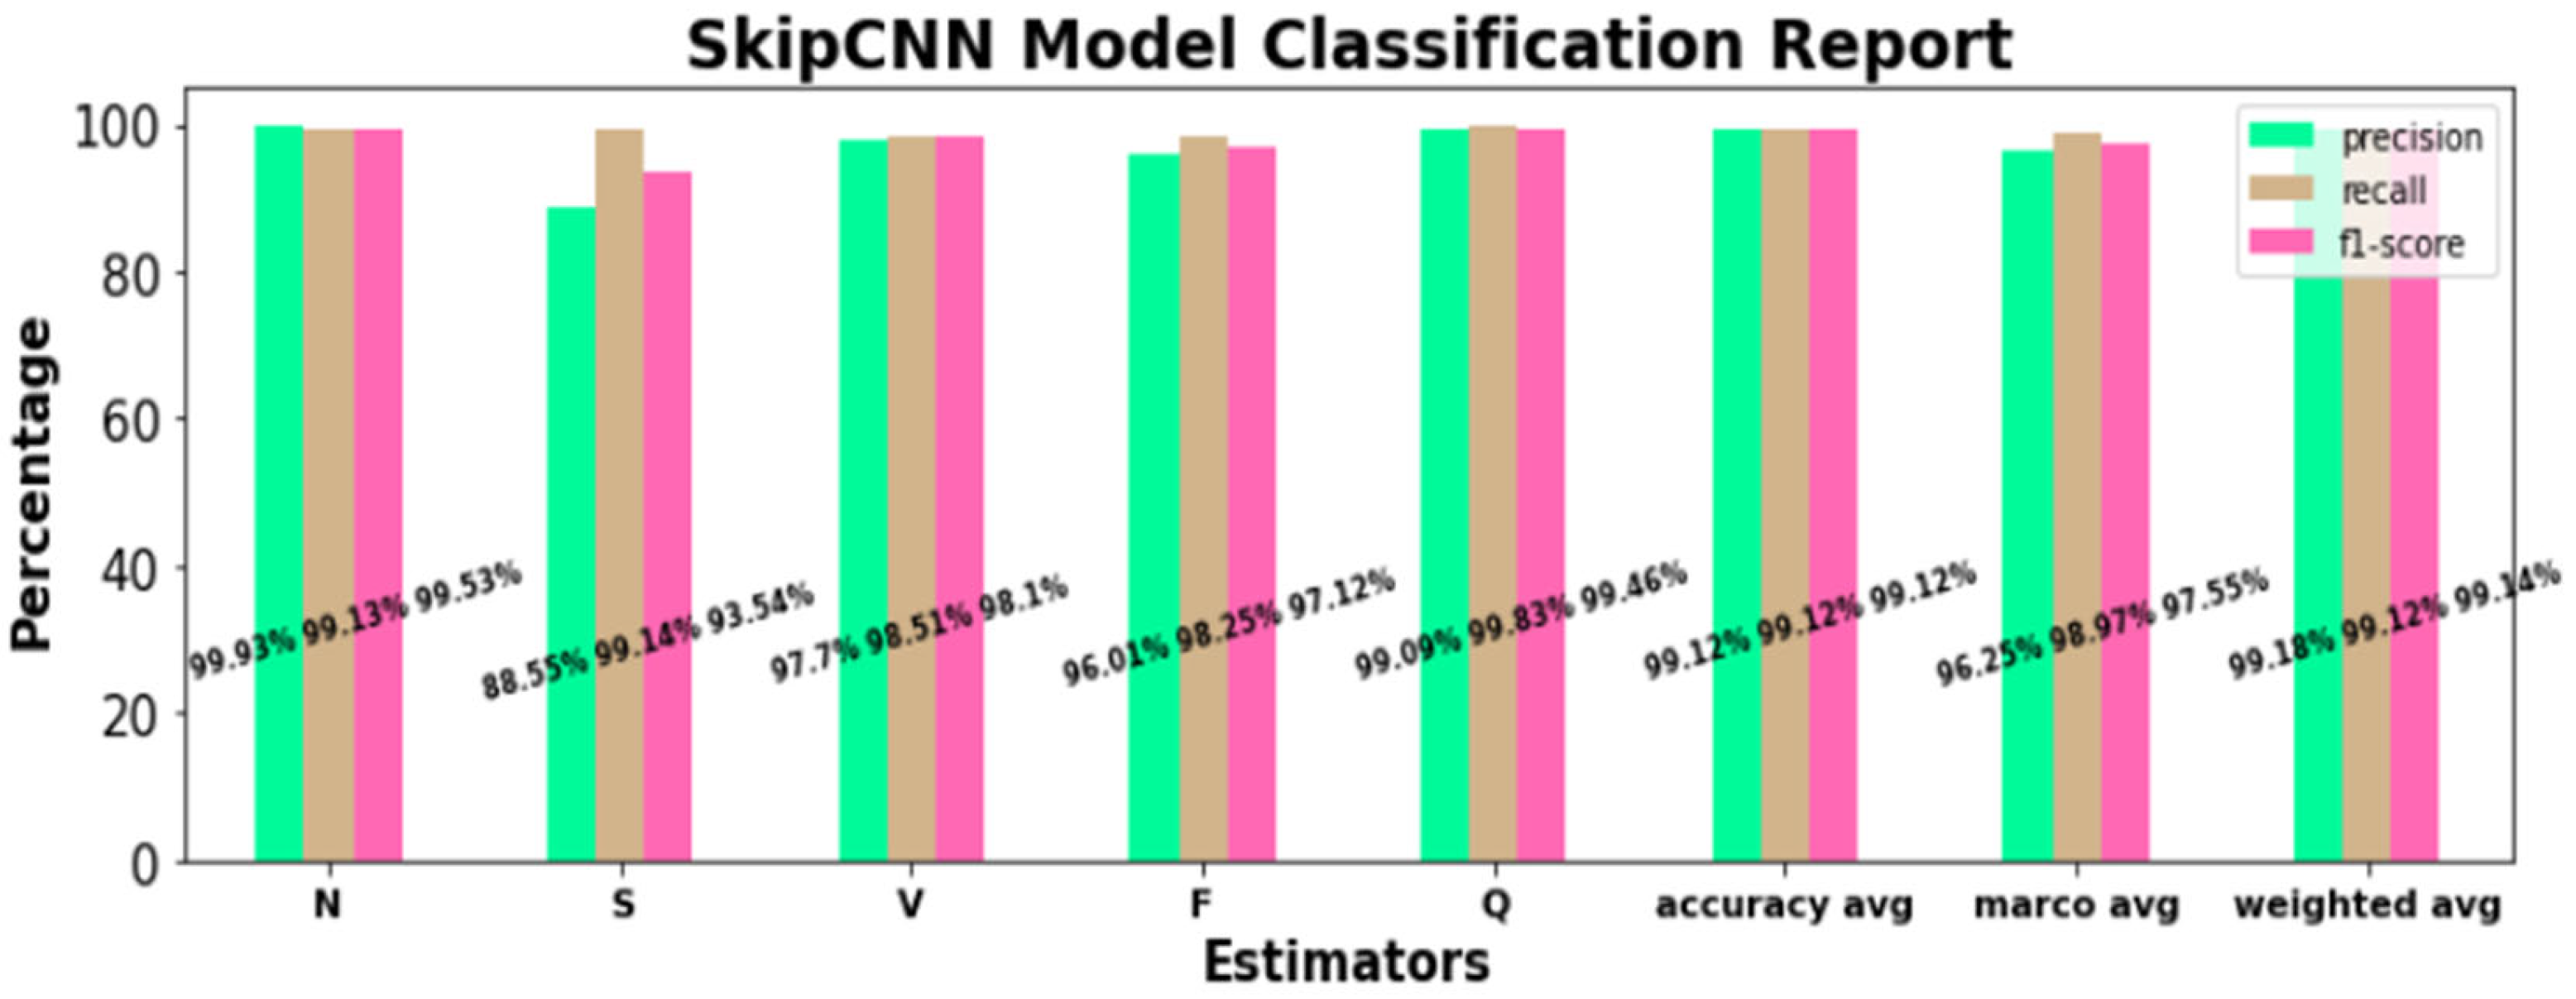
During training spanning 100 epochs with the SkipCNN model, there was a progressive diminution of training and validation losses, which quantify how well the model fits the training data and how well the model generalizes to unseen data, respectively, and a progressive increase in training and validation accuracies and F1 scores (F1 score is the geometric mean of precision and recall) that approximated 100% (Figure 14). Next, the SkipCNN model was tested on the unseen test set, which demonstrated excellent performance for intra-class ECG classification, as well as across all five AAMI ECG classes (Figure 15).
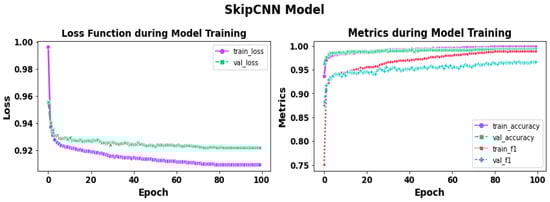
Figure 14.
Loss function curves (left) and performance metrics curves (right) during 100 epochs of training with the SkipCNN model.
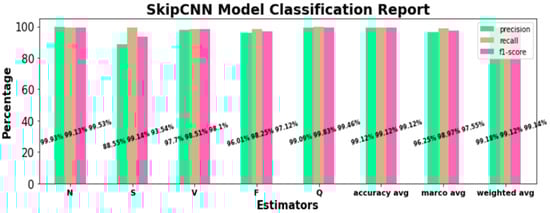
Figure 15.
SkipCNN classification performance for individual ECG beat classes and across all arrhythmia classes in the test dataset.
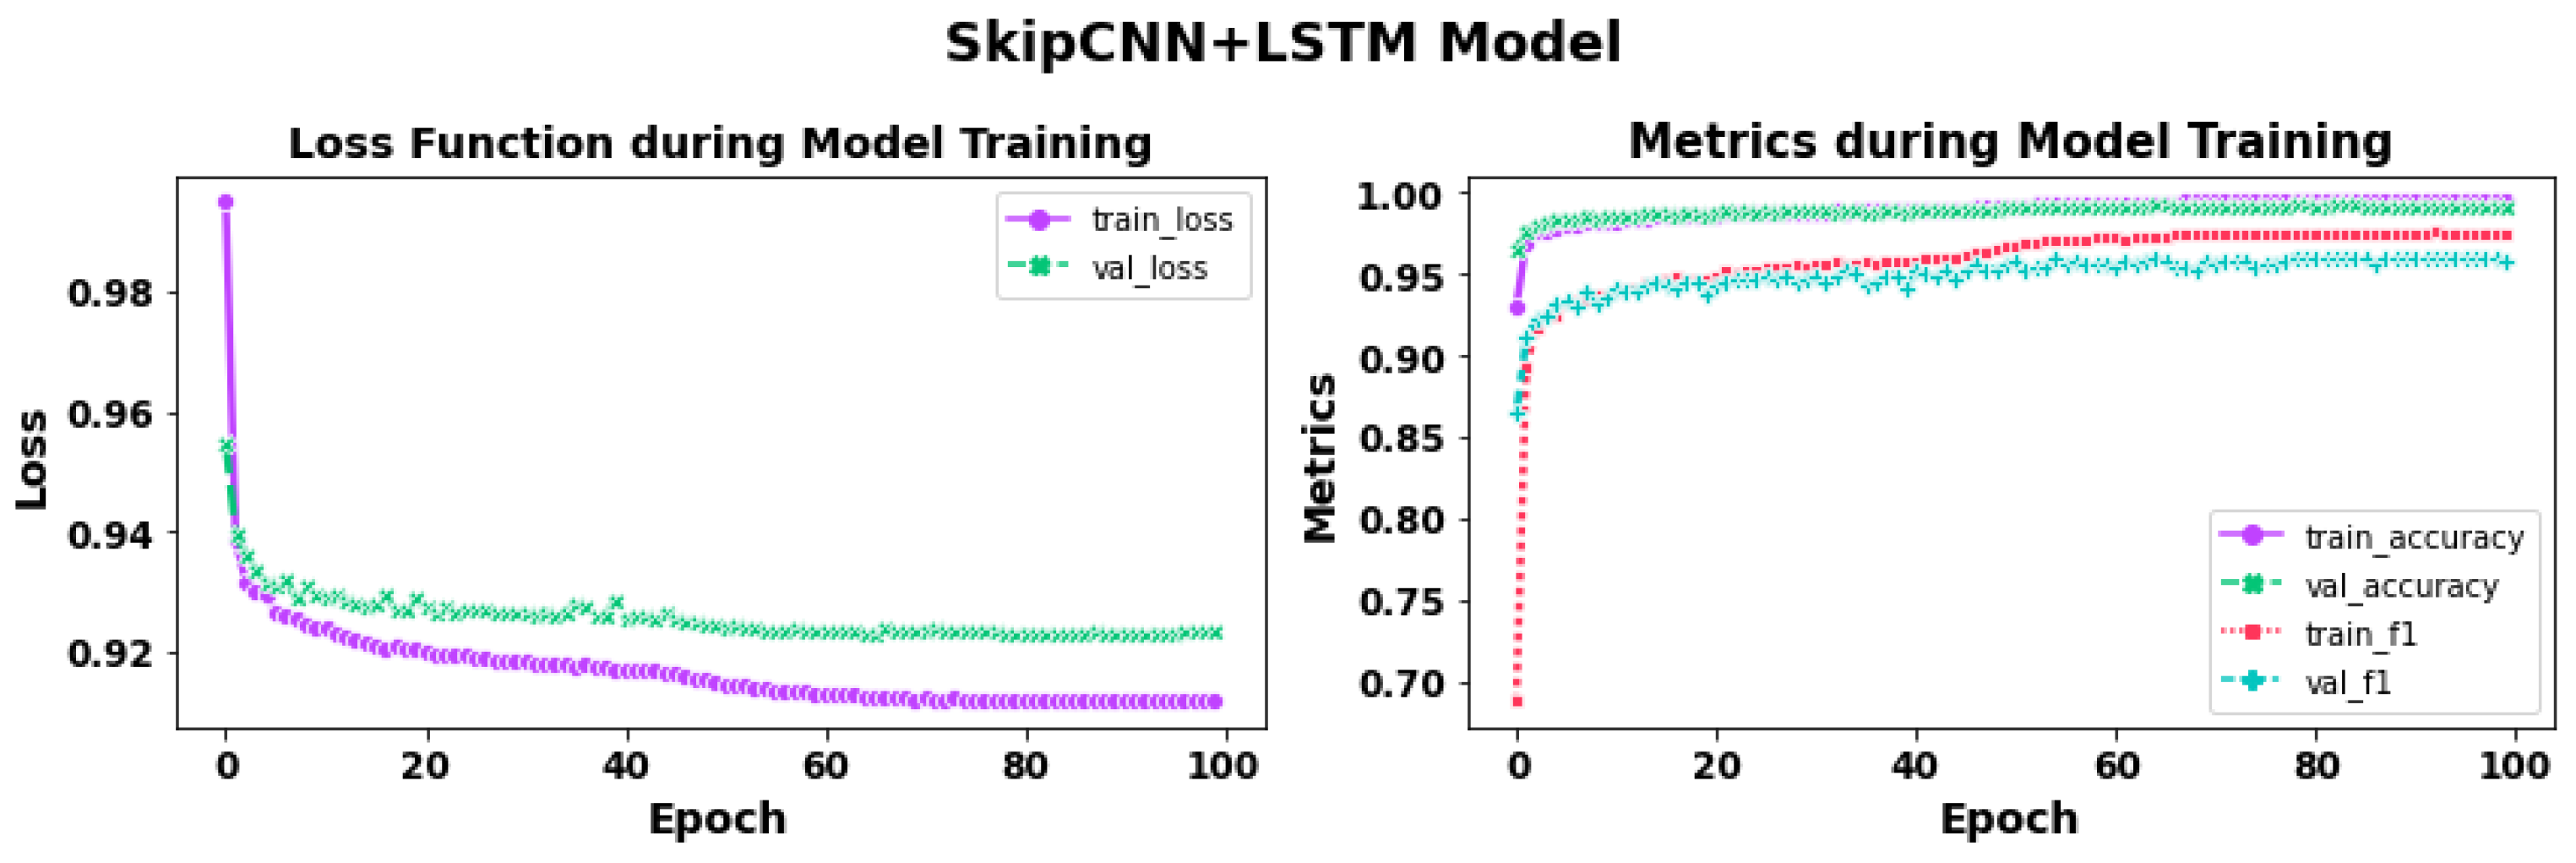
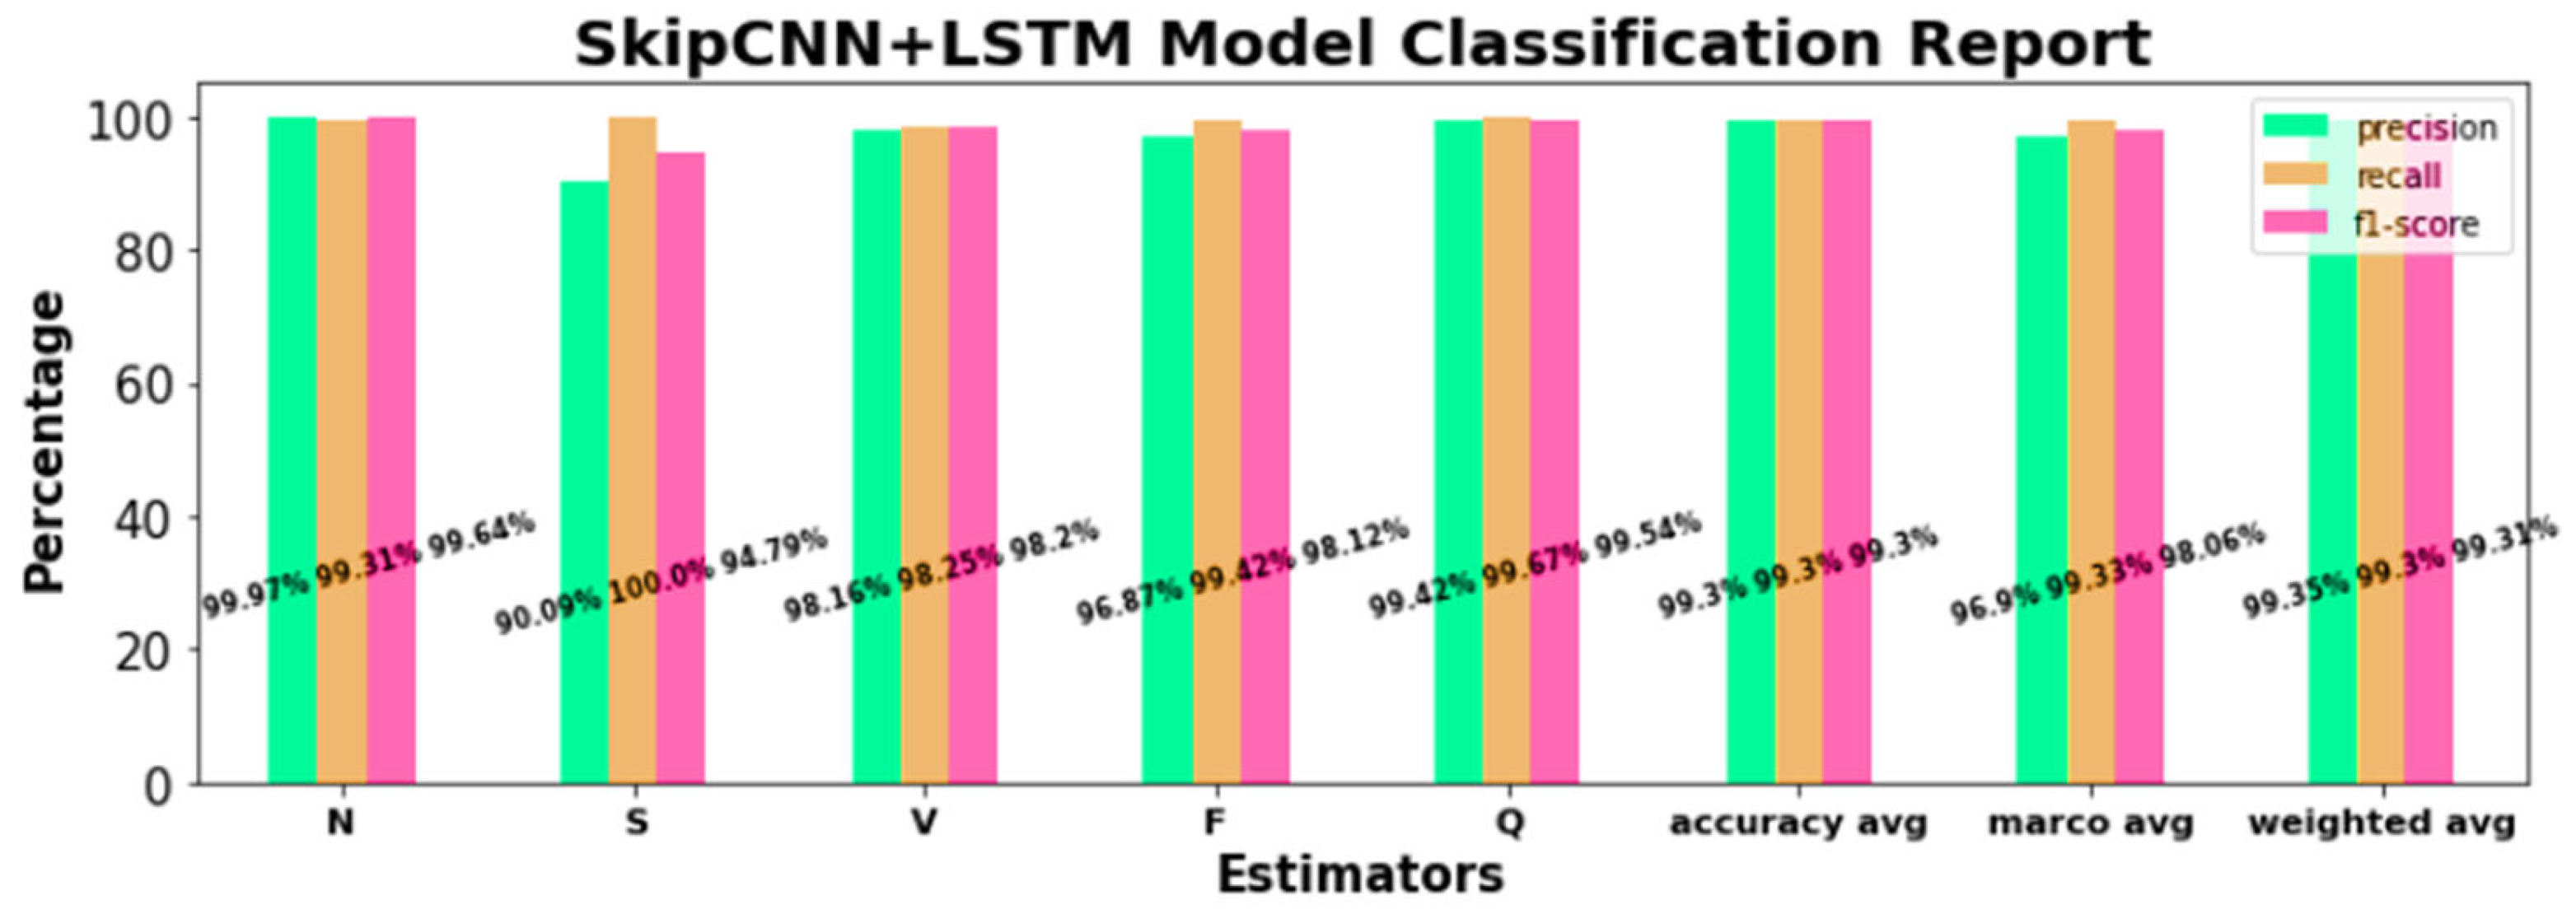
Similarly, during training spanning 100 epochs with the SkipCNN+LSTM model, there was also a progressive diminution of training and validation losses and a progressive increase in training and validation accuracies and F1 scores that approximated 100% (Figure 16). Next, the SkipCNN-LSTM model was tested on the unseen test set, which also demonstrated excellent performance for intra-class ECG classification, as well as across all five AAMI ECG classes (Figure 17). Overall, the performance of SkipCNN-LSTM was similar to that of SkipCNN.
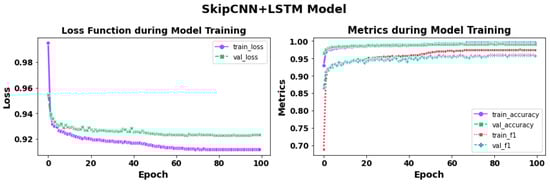
Figure 16.
Loss function curves (left) and performance metrics curves (right) during 100 epochs of training with the SkipCNN+LSTM model.
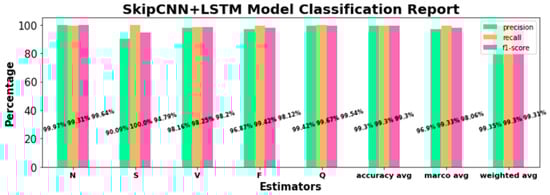
Figure 17.
SkipCNN-LSTM classification performance for individual ECG beat classes and across all arrhythmia classes in the test dataset.
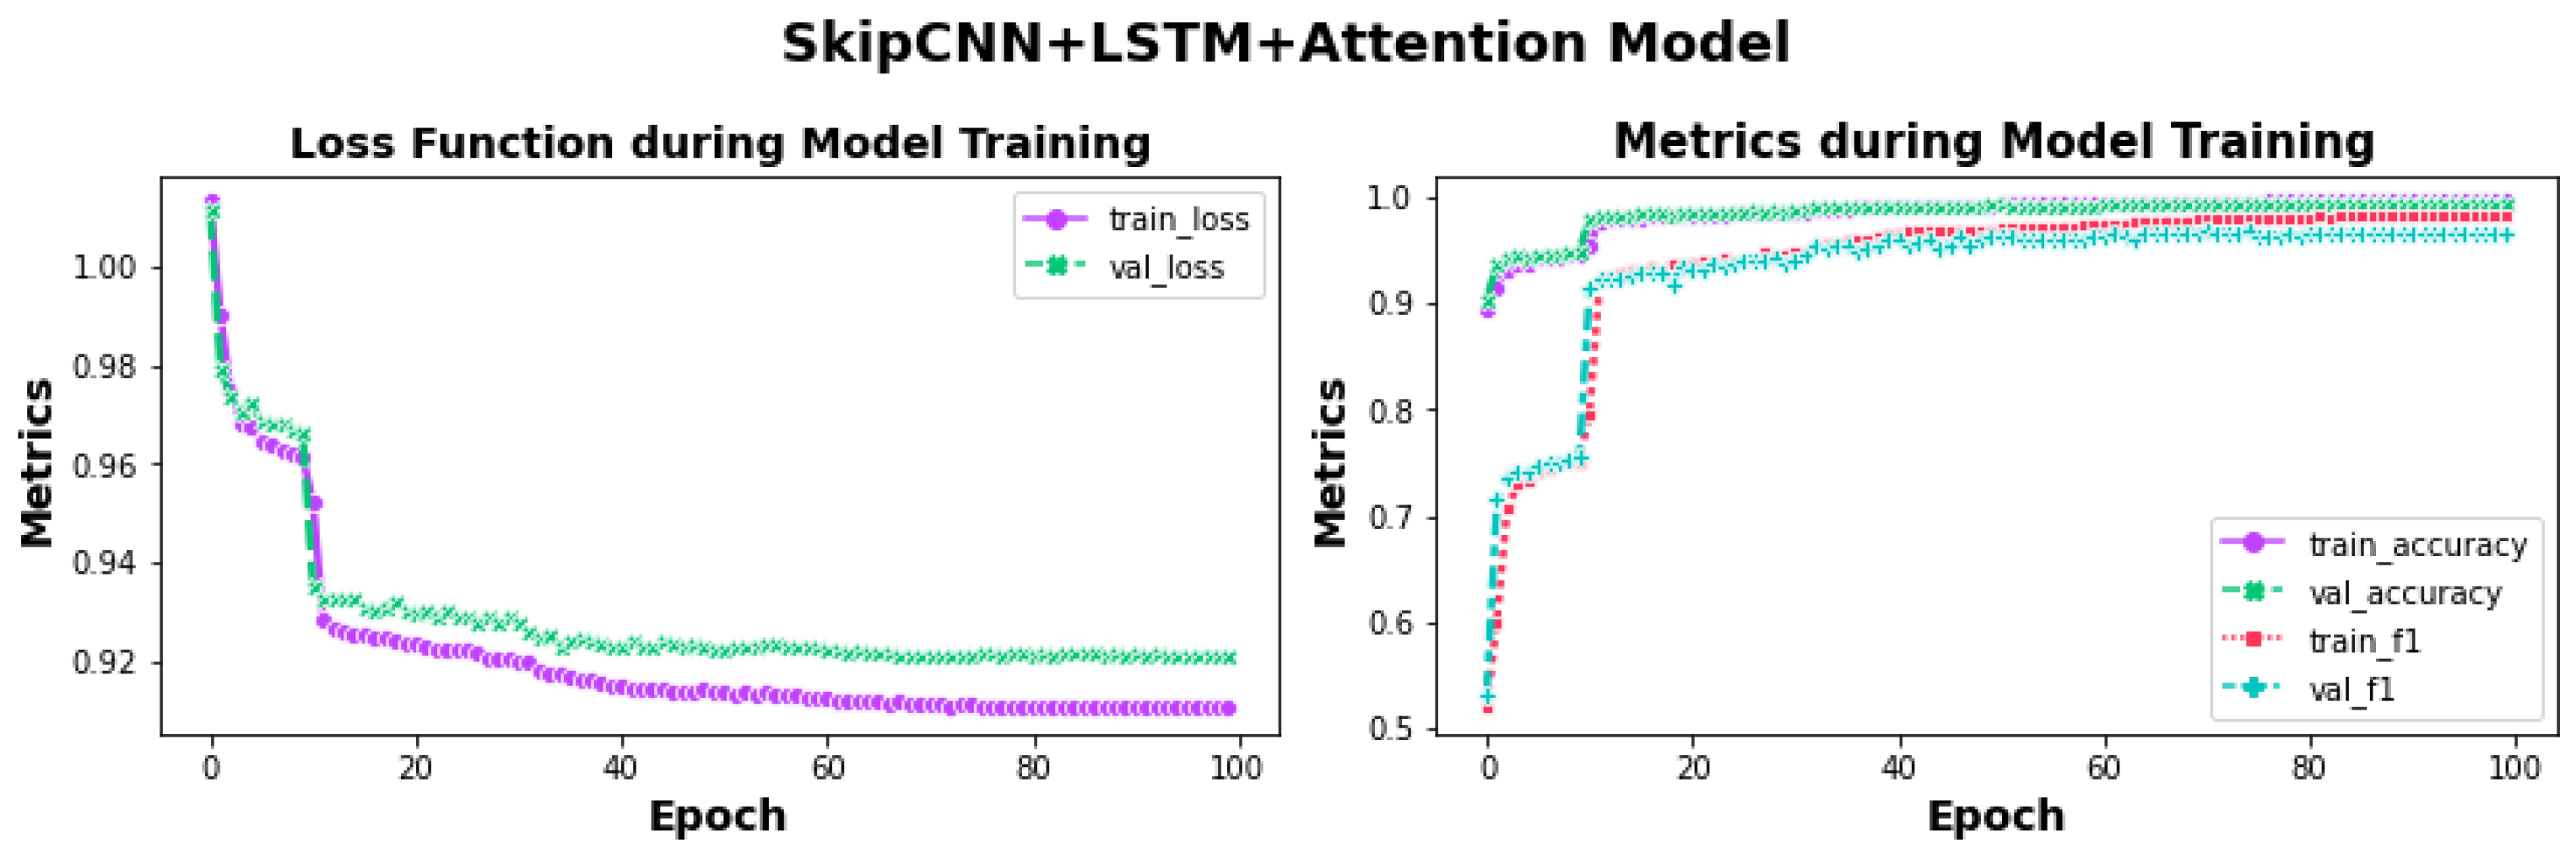
Finally, during training spanning 100 epochs with the SkipCNN+LSTM-Attention model, there was also a progressive diminution of training and validation losses and a progressive increase in training and validation accuracies and F1 scores that approximated 100% (Figure 18).
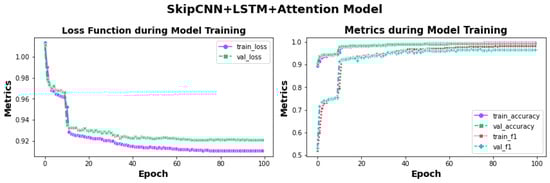
Figure 18.
Loss function curves (left) and performance metric curves (right) during 100 epochs of training with the SkipCNN+LSTM+Attention model.
Compared with the SkipCNN and CkipCNN+LSTM models, loss function curves demonstrated greater convergence, while the training and validation F1 scores were marginally better, suggesting a positive impact of the attention mechanism on training performance. Next, the SkipCNN-LSTM+Attention model was tested on the unseen test set, which also demonstrated excellent performance for intra-class ECG classification, as well as across all five AAMI ECG classes (Figure 19). Overall, the performance of SkipCNN-LSTM+Attention was similar to that of the other models.
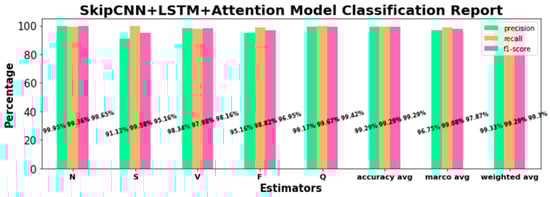
Figure 19.
Arrhythmia detection outcomes in terms of performance metrics using the proposed SkipCNN+LSTM+Attention model.
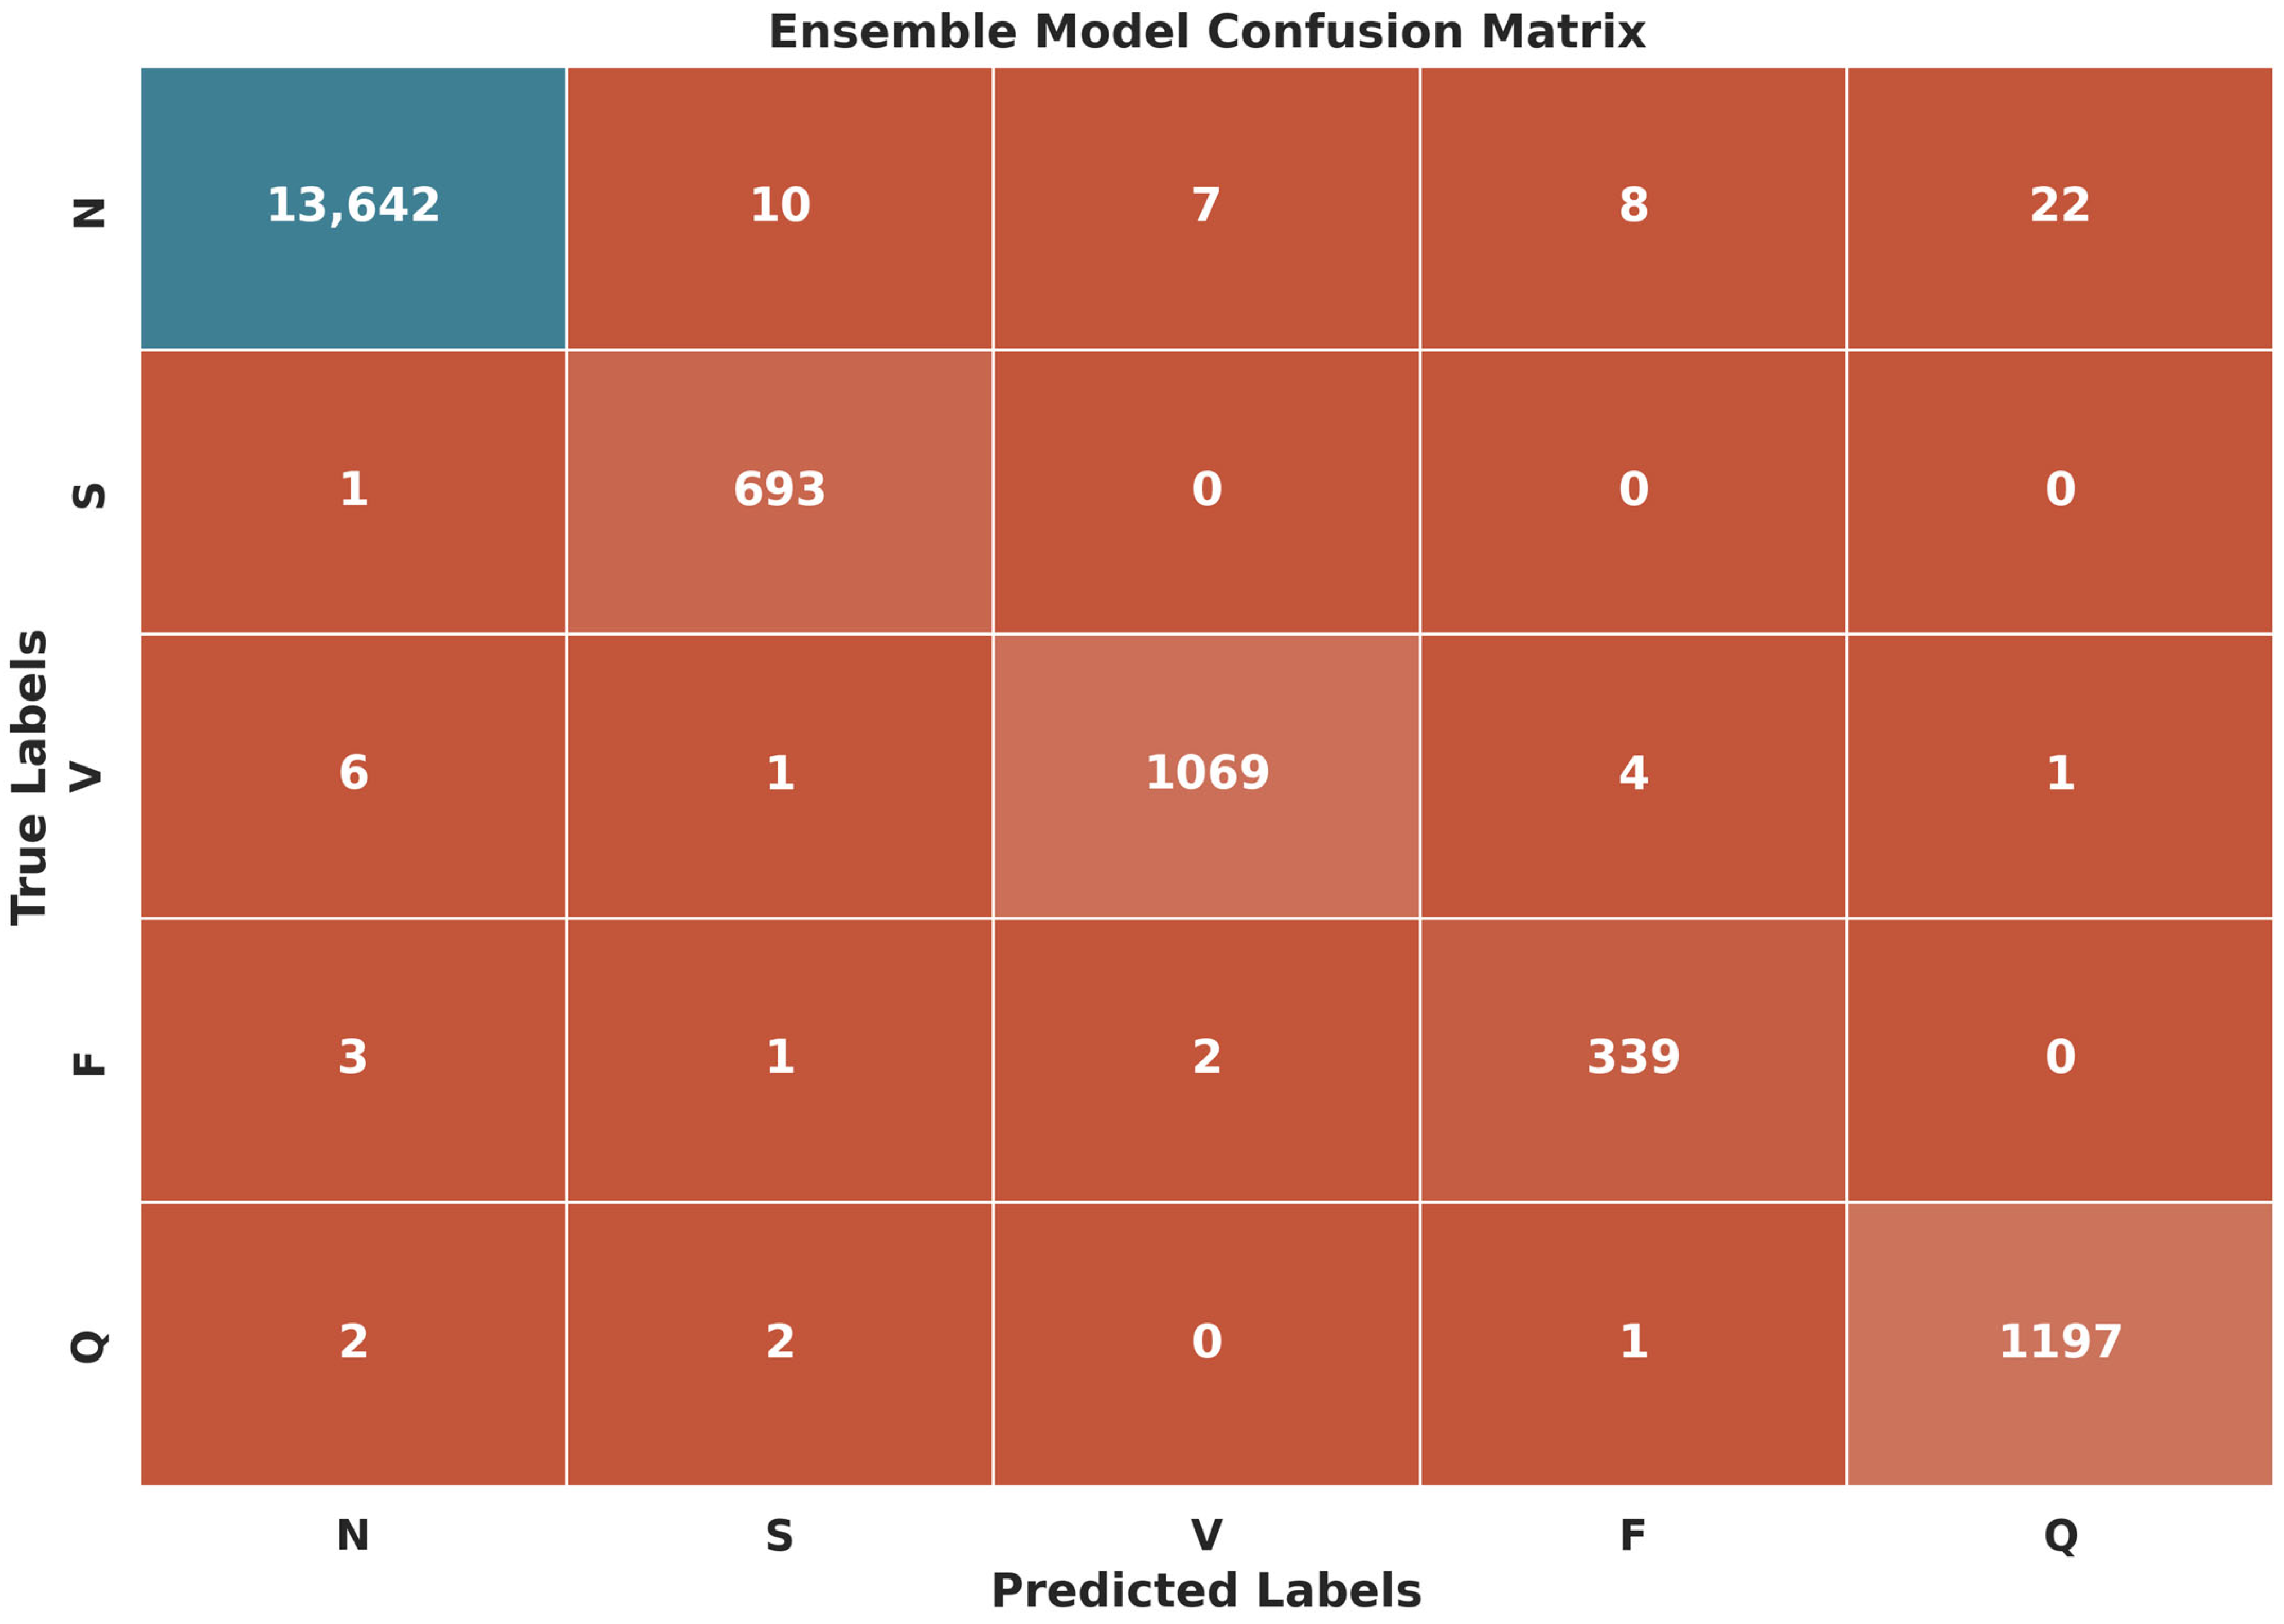
Upon the completion of all three experiments, we proceeded to validate the test dataset using an ensemble model. Constructed as a weighted average of the optimized outcomes of all three individual models, the ensemble model yielded excellent classification performance for individual ECG classes as well as across all classes, with average precision, recall, and F1 scores of 99.60% (Table 7 and Figure 20).
Table 7.
Confusion matrix with calculated performance metrics of arrhythmia detection using the ensemble model.

Figure 20.
Confusion matrix of arrhythmia detection using the ensemble model.
5. Discussion
The performance of our proposed models was compared against that of recently published models for arrhythmia detection (Table 8). We considered articles that utilized the MIT-BIH database for arrhythmia detection from ECG signals, published between 2018 and 2024. Our models outperformed most of the comparator models, with two notable exceptions. In Ullah et al. [77], the DenseNet-based model attained 99.80% four-class arrhythmia classification accuracy, separately assessed on the MIT-BIH and St. Petersburg Institute of Cardiological Technics ECG datasets. However, the authors did not address data imbalance in their work. In Han et al. [78], a hybrid CNN+LSTM technique was utilized for the detection of cardiac arrhythmias, achieving 99.60% accuracy in classification and a 99.81% F1 score, without using any data balancing techniques.
Table 8.
Performance analysis of the proposed methodology with state-of-art models for arrhythmia detection, with and without mitigation strategies for data imbalance.
GAN has been used to augment minority-class ECG data for both binary [34] and multi-class [37,39] arrhythmia detection, as well as in other disease classification models. In addition to GAN for balancing data, other methods have also been utilized, including RO, SMOTE, DBB [35], Focal Loss [36], SMOTE [30], and MBLS [41]. Some studies such as refs. [43,59,78,79], did not utilize any data balancing techniques and still achieved over 95% accuracy. The number of classes for arrhythmia classifications varies across studies, ranging from a maximum of 15 classes [37] to a minimum of 2 classes, with our study utilizing 5 classes according to the AAMI classification.
The ability to synthesize realistic ECGs is a distinct advantage of our ECG generation model that combined GAN with Bi-LSTM. The latter confers the model with the ability to process preceding and subsequent data points efficiently, which enables the GAN to synthesize ECGs with a high degree of matched similarity to real ECGs of the minority classes. By integrating the synthetic ECGs with the ECG training, the data imbalance was ameliorated, and a consistent train–test split was obtained across all ECG classes, which enhanced the model training. As a result, our model yielded superlative classification performance for the individual arrhythmia classes, as well as across all classes, which outperformed many extant models. Among our proposed models, the ensemble model, with 99.60% accuracy, emerged as the top performer; more noteworthy is the fact that all our models consistently attained precision, recall, and F1-score values exceeding 99%, underscoring the accuracy and robustness of our GAN plus SkipCNN-based classification approach to arrhythmia detection.
While our proposed hybrid DL models show promising results for detecting cardiac arrhythmias, it is important to acknowledge some limitations. First, the models were trained and tested on a single dataset, restricting their applicability to additional datasets. Second, more testing with various DL architectures and hyperparameters may be required to determine the best configuration for this task. Third, the suggested models’ complexity, particularly the SkipCNN+LSTM+Attention design, may provide computational and interpretability issues. Fourth, the diversity in ECG recordings from different datasets, as well as the presence of noise or artifacts, may have an impact on these models’ generalization capabilities.
6. Conclusions
In this manuscript, we present the GAN+SkipNet model, which addresses the challenge of detecting cardiac arrhythmias by mitigating data imbalances. To achieve this, we leveraged the MIT-BIH arrhythmia ECG dataset, comprising 109,446 ECG beats categorized into five classes according to the AAMI standard. Our approach involved several key steps. First, we proposed a Bi-LSTM-based GAN model to generate signals for minority classes. Specifically, we focused on generating two types of ECG signals: FVN and PAC signals, which represent just 0.73% and 2.54% of the total dataset, respectively. To assess the quality and similarity of the synthetic signals, we calculated the mean squared error (MSE), structural similarity index (SSIM), and Pearson correlation coefficient (r) scores for both signal types. Subsequently, we combined the synthetically generated dataset with the original dataset, resulting in a total of 113,382 ECG beats. We introduced three innovative models, namely SkipCNN, SkipCNN+LSTM, and SkipCNN+LSTM+Attention, for arrhythmia detection using the combined dataset. Additionally, we enhanced detection accuracy by introducing an ensemble model. Model performance was evaluated using various metrics, including precision, recall, and F1-score, as well as their average, macro average, and weighted average values. The best results for arrhythmia detection were achieved with the SkipCNN+LSTM model (although all other proposed models also provided similar outcomes), which achieved 99.3% precision, recall, and F1-score. Further improvements were made using the ensemble model, pushing the metrics to 99.6%. We validated our proposed model against state-of-the-art techniques from recently published peer-reviewed articles.
There are a few limitations to our work. We performed training and validation with an 80:20 data split instead of standard k-fold cross-validation. The latter represents a potential enhancement that might add rigor and generalizability to our model results. Overall, our work demonstrates a significant step forward in the realm of arrhythmia detection, providing valuable insights into addressing data imbalance and achieving exceptional accuracy.
In the future, we aim to enhance our research by incorporating cross-validation techniques for rigorous model validation and real-time data integration to enable real-time clinical trials. Additionally, we plan to leverage generative AI to provide valuable feedback based on error-prone data, improving the accuracy and reliability of our arrhythmia detection system.
Author Contributions
Methodology, H.M.R.; Conceptualization, S.D. and H.M.R.; Original draft preparation: H.M.R.; Review and editing: H.M.R., S.D. and J.Y.; Visualization: S.D.; Validation, S.D. and J.Y.; Supervision: J.Y. All authors have read and agreed to the published version of the manuscript.
Funding
This research received no external funding.
Data Availability Statement
The dataset used in this study is publicly available and can be freely downloaded from the following link: https://physionet.org/content/mitdb/1.0.0/ (accessed on 7 September 2023).
Conflicts of Interest
The authors declare no conflicts of interest.
References
- Lehtinen, R.; Holst, H.; Turjanmaa, V.; Edenbrandt, L.; Pahlm, O.; Malmivuo, J. Artificial Neural Network for the Exercise Electrocardiographic Detection of Coronary Artery Disease. In Proceedings of the 2nd International Conference on Bioelectromagnetism, Melbourne, VIC, Australia, 15–18 February 1998; pp. 57–58. [Google Scholar] [CrossRef]
- Acharya, U.R.; Fujita, H.; Lih, O.S.; Adam, M.; Tan, J.H.; Chua, C.K. Automated detection of coronary artery disease using different durations of ECG segments with convolutional neural network. Knowl. Based Syst. 2017, 132, 62–71. [Google Scholar] [CrossRef]
- Masarone, D.; Limongelli, G.; Ammendola, E.; Verrengia, M.; Gravino, R.; Pacileo, G. Risk Stratification of Sudden Cardiac Death in Patients with Heart Failure: An update. J. Clin. Med. 2018, 7, 436. [Google Scholar] [CrossRef] [PubMed]
- Tripathy, R.K.; Paternina, M.R.A.; Arrieta, J.G.; Zamora-Méndez, A.; Naik, G.R. Automated detection of congestive heart failure from electrocardiogram signal using Stockwell transform and hybrid classification scheme. Comput. Methods Programs Biomed. 2019, 173, 53–65. [Google Scholar] [CrossRef]
- Maganti, K.; Rigolin, V.H.; Sarano, M.E.; Bonow, R.O. Valvular heart disease: Diagnosis and management. Symp. Cardiovasc. Dis. 2010, 85, 483–500. [Google Scholar] [CrossRef] [PubMed]
- Manolis, T.A.; Apostolopoulos, E.J.; Manolis, A.A.; Melita, H.; Manolis, A.S. The proarrhythmic conundrum of alcohol intake. Trends Cardiovasc. Med. 2022, 32, 237–245. [Google Scholar] [CrossRef] [PubMed]
- Voskoboinik, A.; Kalman, J.M.; Kistler, P.M. Caffeine and Arrhythmias: Time to Grind the Data. JACC Clin. Electrophysiol. 2018, 4, 425–432. [Google Scholar] [CrossRef]
- Kotadia, I.D.; Steven, A.; Williams, E.; O’Neill, M. Supraventricular tachycardia: An overview of diagnosis and management. Clin. Med. 2020, 20, 43–47. [Google Scholar] [CrossRef]
- Faust, O.; Shenfield, A.; Kareem, M.; San, T.R.; Fujita, H.; Acharya, U.R. Automated detection of atrial fibrillation using long short-term memory network with RR interval signals. Comput. Biol. Med. 2018, 102, 327–335. [Google Scholar] [CrossRef]
- Martínez, A.; Alcaraz, R.; Rieta, J.J. Ventricular activity morphological characterization: Ectopic beats removal in long term atrial fibrillation recordings. Comput. Methods Programs Biomed. 2013, 109, 283–292. [Google Scholar] [CrossRef]
- Asadi, M.; Poursalim, F.; Loni, M.; Daneshtalab, M.; Sjödin, M.; Gharehbaghi, A. Accurate detection of paroxysmal atrial fibrillation with certified-GAN and neural architecture search. Sci. Rep. 2023, 13, 11378. [Google Scholar] [CrossRef]
- Pourbabaee, B.; Roshtkhari, M.J.; Khorasani, K. Deep Convolutional Neural Networks and Learning ECG Features for Screening Paroxysmal Atrial Fibrillation Patients. IEEE Trans. Syst. Man. Cybern. Syst. 2018, 48, 2095–2104. [Google Scholar] [CrossRef]
- Inan, O.T.; Giovangrandi, L.; Kovacs, G.T.A. Robust neural-network-based classification of premature ventricular contractions using wavelet transform and timing interval features. IEEE Trans. Biomed. Eng. 2006, 53, 2507–2515. [Google Scholar] [CrossRef] [PubMed]
- Al-Jibreen, A.; Al-Ahmadi, S.; Islam, S.; Artoli, A.M. Person identification with arrhythmic ECG signals using deep convolution neural network. Sci. Rep. 2024, 14, 4431. [Google Scholar] [CrossRef] [PubMed]
- Jahmunah, V.; Ng, E.Y.K.; Tan, R.S.; Oh, S.L.; Acharya, U.R. Uncertainty quantification in DenseNet model using myocardial infarction ECG signals. Comput. Methods Programs Biomed. 2023, 229, 107308. [Google Scholar] [CrossRef] [PubMed]
- Kim, H.J.; Lim, J.S. Study on a Biometric Authentication Model based on ECG using a Fuzzy Neural Network. IOP Conf. Ser. Mater. Sci. Eng. 2018, 317, 012030. [Google Scholar] [CrossRef]
- Laosai, J.; Chamnongthai, K. Classification of acute leukemia using medical-knowledge-based morphology and CD marker. Biomed. Signal Process Control. 2018, 44, 127–137. [Google Scholar] [CrossRef]
- Kim, Y.; Choi, G.; Choi, C. One-Dimensional Shallow Neural Network Using Non-Fiducial Based Segmented Electrocardiogram for User Identification System. IEEE Access 2023, 11, 102483–102491. [Google Scholar] [CrossRef]
- Prasad, B.V.P.; Parthasarathy, V. Detection and classification of cardiovascular abnormalities using FFT based multi-objective genetic algorithm. Biotechnol. Biotechnologic. Equip. 2018, 32, 183–193. [Google Scholar] [CrossRef]
- Papageorgiou, V.E.; Zegkos, T.; Efthimiadis, G.; Tsaklidis, G. Analysis of digitalized ECG signals based on artificial intelligence and spectral analysis methods specialized in ARVC. Int. J. Numer. Method. Biomed. Eng. 2022, 38, e3644. [Google Scholar] [CrossRef]
- Lee, J.S.; Lee, S.J.; Choi, M.; Seo, M.; Kim, S.W. QRS detection method based on fully convolutional networks for capacitive electrocardiogram. Expert. Syst. Appl. 2019, 134, 66–78. [Google Scholar] [CrossRef]
- Asif, R.N.; Abbas, S.; Khan, M.A.; Atta-ur-Rahman; Sultan, K.; Mahmud, M.; Mosavi, A. Development and Validation of Embedded Device for Electrocardiogram Arrhythmia Empowered with Transfer Learning. Comput. Intell. Neurosci. 2022, 2022, 5054641. [Google Scholar] [CrossRef] [PubMed]
- Lui, H.W.; Chow, K.L. Multiclass classification of myocardial infarction with convolutional and recurrent neural networks for portable ECG devices. Inform. Med. Unlocked 2018, 13, 26–33. [Google Scholar] [CrossRef]
- Zeng, Y.; Zhan, G. Extracting cervical spine popping sound during neck movement and analyzing its frequency using wavelet transform. Comput. Biol. Med. 2022, 141, 105126. [Google Scholar] [CrossRef]
- Choi, G.; Ziyang, G.; Wu, J.; Esposito, C.; Choi, C. Multi-modal Biometrics Based Implicit Driver Identification System Using Multi-TF Images of ECG and EMG. Comput. Biol. Med. 2023, 159, 106851. [Google Scholar] [CrossRef] [PubMed]
- Rahman, A.-U.; Asif, R.N.; Sultan, K.; Alsaif, S.A.; Abbas, S.; Khan, M.A.; Mosavi, A. ECG Classification for Detecting ECG Arrhythmia Empowered with Deep Learning Approaches. Comput. Intell. Neurosci. 2022, 2022, 6852845. [Google Scholar] [CrossRef]
- Gong, Z.; Tang, Z.; Qin, Z.; Su, X.; Choi, C. Electrocardiogram identification based on data generative network and non-fiducial data processing. Comput. Biol. Med. 2024, 173, 108333. [Google Scholar] [CrossRef] [PubMed]
- Jiang, J.; Zhang, H.; Pi, D.; Dai, C. A novel multi-module neural network system for imbalanced heartbeats classification. Expert. Syst. Appl. X 2019, 1, 100003. [Google Scholar] [CrossRef]
- Rath, A.; Mishra, D.; Panda, G. Imbalanced ECG signal-based heart disease classification using ensemble machine learning technique. Front. Big Data 2022, 5, 1021518. [Google Scholar] [CrossRef]
- Pandey, S.K.; Janghel, R.R. Automatic detection of arrhythmia from imbalanced ECG database using CNN model with SMOTE. Australas. Phys. Eng. Sci. Med. 2019, 42, 1129–1139. [Google Scholar] [CrossRef]
- PhysioNet. MIT-BIH Arrhythmia Database-v1. 2005. Available online: https://physionet.org/content/mitdb/1.0.0/ (accessed on 7 September 2023).
- Moody, G.B.; Mark, R.G. The MIT-BIH Arrhythmia Database on CD-ROM and software for use with it. In Proceedings of the [1990] Proceedings Computers in Cardiology, Chicago, IL, USA, 23–26 September 1990; pp. 185–188. [Google Scholar] [CrossRef]
- Moody, G.B.; Mark, R.G. The impact of the MIT-BIH arrhythmia database. IEEE Eng. Med. Biol. Mag. 2001, 20, 45–50. [Google Scholar] [CrossRef]
- Qin, J.; Gao, F.; Wang, Z.; Wong, D.C.; Zhao, Z.; Relton, S.D.; Fang, H. A novel temporal generative adversarial network for electrocardiography anomaly detection. Artif. Intell. Med. 2023, 136, 102489. [Google Scholar] [CrossRef] [PubMed]
- Rajesh, K.N.V.P.S.; Dhuli, R. Classification of imbalanced ECG beats using re-sampling techniques and AdaBoost ensemble classifier. Biomed. Signal Process. Control 2018, 41, 242–254. [Google Scholar] [CrossRef]
- Gao, J.; Zhang, H.; Lu, P.; Wang, Z. An Effective LSTM Recurrent Network to Detect Arrhythmia on Imbalanced ECG Dataset. J. Healthc. Eng. 2019, 2019, 6320651. [Google Scholar] [CrossRef] [PubMed]
- Shaker, A.M.; Tantawi, M.; Shedeed, H.A.; Tolba, M.F. Generalization of Convolutional Neural Networks for ECG Classification Using Generative Adversarial Networks. IEEE Access 2020, 8, 35592–35605. [Google Scholar] [CrossRef]
- Petmezas, G.; Haris, K.; Stefanopoulos, L.; Kilintzis, V.; Tzavelis, A.; Rogers, J.A.; Katsaggelos, A.K.; Maglaveras, N. Automated Atrial Fibrillation Detection using a Hybrid CNN-LSTM Network on Imbalanced ECG Datasets. Biomed. Signal Process. Control 2020, 63, 102194. [Google Scholar] [CrossRef]
- Zhou, Z.; Zhai, X.; Tin, C. Fully automatic electrocardiogram classification system based on generative adversarial network with auxiliary classifier. Expert. Syst. Appl. 2021, 174, 114809. [Google Scholar] [CrossRef]
- Rai, H.M.; Chatterjee, K.; Dashkevych, S. The prediction of cardiac abnormality and enhancement in minority class accuracy from imbalanced ECG signals using modified deep neural network models. Comput. Biol. Med. 2022, 150, 106142. [Google Scholar] [CrossRef] [PubMed]
- Fan, W.; Si, Y.; Yang, W.; Sun, M. Imbalanced ECG data classification using a novel model based on active training subset selection and modified broad learning system. Measurement 2022, 198, 111412. [Google Scholar] [CrossRef]
- Ma, K.; Zhan, C.A.; Yang, F. Multi-classification of arrhythmias using ResNet with CBAM on CWGAN-GP augmented ECG Gramian Angular Summation Field. Biomed. Signal Process. Control 2022, 77, 103684. [Google Scholar] [CrossRef]
- Qin, J.; Gao, F.; Wang, Z.; Liu, L.; Ji, C. Arrhythmia Detection Based on WGAN-GP and SE-ResNet1D. Electronics 2022, 11, 3427. [Google Scholar] [CrossRef]
- Sharma, L.D.; Sunkaria, R.K. Myocardial Infarction Detection and Localization Using Optimal Features Based Lead Specific Approach. IRBM 2020, 41, 58–70. [Google Scholar] [CrossRef]
- Li, W.; Tang, Y.M.; Yu, K.M.; To, S. SLC-GAN: An automated myocardial infarction detection model based on generative adversarial networks and convolutional neural networks with single-lead electrocardiogram synthesis. Inf. Sci. 2022, 589, 738–750. [Google Scholar] [CrossRef]
- Rai, H.M.; Chatterjee, K. Hybrid CNN-LSTM deep learning model and ensemble technique for automatic detection of myocardial infarction using big ECG data. Appl. Intell. 2021, 52, 5366–5384. [Google Scholar] [CrossRef]
- Goldberger, A.L.; Amaral, L.A.N.; Glass, L.; Hausdorff, J.M.; Ivanov, P.C.; Mark, R.G.; Mietus, J.E.; Moody, G.B.; Peng, C.-K.; Stanley, H.E. PhysioBank, PhysioToolkit, and PhysioNet: Components of a new research resource for complex physiologic signals. Circulation 2000, 101, e215–e220. [Google Scholar] [CrossRef] [PubMed]
- Fazeli, S. ECG Heartbeat Categorization Dataset. Kaggle. Available online: https://www.kaggle.com/shayanfazeli/heartbeat (accessed on 21 August 2020).
- Kachuee, M.; Fazeli, S.; Sarrafzadeh, M. ECG Heartbeat Classification: A Deep Transferable Representation. In Proceedings of the 2018 IEEE International Conference on Healthcare Informatics (ICHI), New York, NY, USA, 4–7 June 2018; pp. 443–444. [Google Scholar] [CrossRef]
- Johnson, J.M.; Khoshgoftaar, T.M. Survey on deep learning with class imbalance. J. Big Data 2019, 6, 27. [Google Scholar] [CrossRef]
- Papageorgiou, V.E.; Dogoulis, P.; Papageorgiou, D.-P. A Convolutional Neural Network of Low Complexity for Tumor Anomaly Detection. In Proceedings of the Eighth International Congress on Information and Communication Technology, ICICT 2023, London, UK, 20–23 February 2023; pp. 973–983. [Google Scholar] [CrossRef]
- Polat, H.; Mehr, H.D. Classification of Pulmonary CT Images by Using Hybrid 3D-Deep Convolutional Neural Network Architecture. Appl. Sci. 2019, 9, 940. [Google Scholar] [CrossRef]
- Pessoa, D.; Petmezas, G.; Papageorgiou, V.E.; Rocha, B.M.; Stefanopoulos, L.; Kilintzis, V.; Maglaveras, N.; Frerichs, I.; de Carvalho, P.; Paiva, R.P. Pediatric Respiratory Sound Classification Using a Dual Input Deep Learning Architecture. In Proceedings of the 2023 IEEE Biomedical Circuits and Systems Conference (BioCAS), Toronto, ON, Canada, 19–21 October 2023; pp. 1–5. [Google Scholar] [CrossRef]
- Papageorgiou, V. Brain Tumor Detection Based on Features Extracted and Classified Using a Low-Complexity Neural Network. Trait. Du Signal 2021, 38, 547–554. [Google Scholar] [CrossRef]
- Kim, M.-G.; Choi, C.; Pan, S.B. Ensemble Networks for User Recognition in Various Situations Based on Electrocardiogram. IEEE Access 2020, 8, 36527–36535. [Google Scholar] [CrossRef]
- Moqurrab, S.A.; Rai, H.M.; Yoo, J. HRIDM: Hybrid Residual/Inception-Based Deeper Model for Arrhythmia Detection from Large Sets of 12-Lead ECG Recordings. Algorithms 2024, 17, 364. [Google Scholar] [CrossRef]
- Baloglu, U.B.; Talo, M.; Yildirim, O.; Tan, R.S.; Acharya, U.R. Classification of myocardial infarction with multi-lead ECG signals and deep CNN. Pattern Recognit. Lett. 2019, 122, 23–30. [Google Scholar] [CrossRef]
- Zhou, S.; Tan, B. Electrocardiogram soft computing using hybrid deep learning CNN-ELM. Appl. Soft Comput. J. 2020, 86, 105778. [Google Scholar] [CrossRef]
- Oh, S.L.; Ng, E.Y.K.; Tan, R.S.; Acharya, U.R. Automated diagnosis of arrhythmia using combination of CNN and LSTM techniques with variable length heart beats. Comput. Biol. Med. 2018, 102, 278–287. [Google Scholar] [CrossRef] [PubMed]
- Zhu, F.; Ye, F.; Fu, Y.; Liu, Q.; Shen, B. Electrocardiogram generation with a bidirectional LSTM-CNN generative adversarial network. Sci. Rep. 2019, 9, 6734. [Google Scholar] [CrossRef]
- Saadatnejad, S.; Oveisi, M.; Hashemi, M. LSTM-Based ECG Classification for Continuous Monitoring on Personal Wearable Devices. IEEE J. Biomed. Health Inform. 2020, 24, 515–523. [Google Scholar] [CrossRef] [PubMed]
- Islam, M.S.; Hasan, K.F.; Sultana, S.; Uddin, S.; Lio’, P.; Quinn, J.M.W.; Moni, M.A. HARDC: A novel ECG-based heartbeat classification method to detect arrhythmia using hierarchical attention based dual structured RNN with dilated CNN. Neural Netw. 2023, 162, 271–287. [Google Scholar] [CrossRef] [PubMed]
- Cheng, J.; Zou, Q.; Zhao, Y. ECG signal classification based on deep CNN and BiLSTM. BMC Med. Inform. Decis. Mak. 2021, 21, 365. [Google Scholar] [CrossRef]
- Dey, M.; Omar, N.; Ullah, M.A. Temporal Feature-Based Classification into Myocardial Infarction and Other CVDs Merging CNN and Bi-LSTM from ECG Signal. IEEE Sens. J. 2021, 21, 21688–21695. [Google Scholar] [CrossRef]
- Li, H.; Lin, Z.; An, Z.; Zuo, S.; Zhu, W.; Zhang, Z.; Mu, Y.; Cao, L.; García, J.D.P. Automatic electrocardiogram detection and classification using bidirectional long short-term memory network improved by Bayesian optimization. Biomed. Signal Process. Control 2022, 73, 103424. [Google Scholar] [CrossRef]
- Zhang, J.; Liu, A.; Gao, M.; Chen, X.; Zhang, X.; Chen, X. ECG-based multi-class arrhythmia detection using spatio-temporal attention-based convolutional recurrent neural network. Artif. Intell. Med. 2020, 106, 101856. [Google Scholar] [CrossRef]
- Wang, G.; Song, T.; Dong, Q.; Cui, M.; Huang, N.; Zhang, S. Automatic ischemic stroke lesion segmentation from computed tomography perfusion images by image synthesis and attention-based deep neural networks. Med. Image Anal. 2020, 65, 101787. [Google Scholar] [CrossRef]
- Yao, Q.; Wang, R.; Fan, X.; Liu, J.; Li, Y. Multi-class Arrhythmia detection from 12-lead varied-length ECG using Attention-based Time-Incremental Convolutional Neural Network. Inf. Fusion 2020, 53, 174–182. [Google Scholar] [CrossRef]
- Koh, J.E.W.; Ooi, C.P.; Lim-Ashworth, N.S.J.; Vicnesh, J.; Tor, H.T.; Lih, O.S.; Tan, R.-S.; Acharya, U.R.; Fung, D.S.S. Automated classification of attention deficit hyperactivity disorder and conduct disorder using entropy features with ECG signals. Comput. Biol. Med. 2022, 140, 105120. [Google Scholar] [CrossRef] [PubMed]
- Hernández, A.; Amigó, J.M. Attention mechanisms and their applications to complex systems. Entropy 2021, 23, 283. [Google Scholar] [CrossRef]
- Dong, Y.; Zhang, M.; Qiu, L.; Wang, L.; Yu, Y. An Arrhythmia Classification Model Based on Vision Transformer with Deformable Attention. Micromachines 2023, 14, 1155. [Google Scholar] [CrossRef] [PubMed]
- Hochreiter, S.; Schmidhuber, J. Long Short-Term Memory. Neural Comput. 1997, 9, 1735–1780. [Google Scholar] [CrossRef]
- Baumgartner, M.; Veeranki, S.P.K.; Hayn, D.; Schreier, G. Introduction and Comparison of Novel Decentral Learning Schemes with Multiple Data Pools for Privacy-Preserving ECG Classification. J. Healthc. Inform. Res. 2023, 7, 291–312. [Google Scholar] [CrossRef]
- Bakurov, I.; Buzzelli, M.; Schettini, R.; Castelli, M.; Vanneschi, L. Structural similarity index (SSIM) revisited: A data-driven approach. Expert Syst. Appl. 2022, 189, 116087. [Google Scholar] [CrossRef]
- Němcová, A.; Smíšek, R.; Maršánová, L.; Smital, L.; Vítek, M. A comparative analysis of methods for evaluation of ECG signal quality after compression. BioMed Res. Int. 2018, 2018, 1868519. [Google Scholar] [CrossRef]
- Kim, S.Y.; Lee, J.-P.; Shin, W.-R.; Oh, I.-H.; Ahn, J.-Y.; Kim, Y.-H. Cardiac biomarkers and detection methods for myocardial infarction. Mol. Cell. Toxicol. 2022, 18, 443–455. [Google Scholar] [CrossRef]
- Ullah, H.; Heyat, M.B.B.; Akhtar, F.; Sumbul; Muaad, A.Y.; Islam, M.S.; Abbas, Z.; Pan, T.; Gao, M.; Lin, Y.; et al. An End-to-End Cardiac Arrhythmia Recognition Method with an Effective DenseNet Model on Imbalanced Datasets Using ECG Signal. Comput. Intell. Neurosci. 2022, 2022, 9475162. [Google Scholar] [CrossRef]
- Han, Y.; Han, P.; Yuan, B.; Zhang, Z.; Liu, L.; Panneerselvam, J. Novel Transformation Deep Learning Model for Electrocardiogram Classification and Arrhythmia Detection using Edge Computing. J. Grid Comput. 2024, 22, 7. [Google Scholar] [CrossRef]
- Din, S.; Qaraqe, M.; Mourad, O.; Qaraqe, K.; Serpedin, E. ECG-based cardiac arrhythmias detection through ensemble learning and fusion of deep spatial–temporal and long-range dependency features. Artif. Intell. Med. 2024, 150, 102818. [Google Scholar] [CrossRef] [PubMed]

Disclaimer/Publisher’s Note: The statements, opinions and data contained in all publications are solely those of the individual author(s) and contributor(s) and not of MDPI and/or the editor(s). MDPI and/or the editor(s) disclaim responsibility for any injury to people or property resulting from any ideas, methods, instructions or products referred to in the content. |
© 2024 by the authors. Licensee MDPI, Basel, Switzerland. This article is an open access article distributed under the terms and conditions of the Creative Commons Attribution (CC BY) license (https://creativecommons.org/licenses/by/4.0/).