Abstract
The epigenetic clock evaluates human biological age based on DNA methylation patterns. It takes the form of a regression model where the methylation ratio at CpG sites serves as the predictor and age as the response variable. Due to the large number of CpG sites and their correlation, Elastic Net is commonly used to train the models. However, existing standard epigenetic clocks, trained on multiracial data, may exhibit biases due to genetic and environmental differences among specific racial groups. Developing epigenetic clocks suitable for a specific single-race population requires collecting and analyzing hundreds or thousands of samples, which costs a lot of time and money. Therefore, an efficient method to construct accurate epigenetic clocks with smaller sample sizes is needed. We propose Transfer Elastic Net, a transfer learning approach that trains a model in the target population using the information of parameters estimated by the Elastic Net in a source population. Using this method, we constructed Horvath’s, Hannum’s, and Levine’s types of epigenetic clocks from blood samples of 143 Japanese subjects. The DNA methylation data were transformed through principal component analysis to obtain more reliable clocks. The developed clocks demonstrated the smallest prediction errors compared to both the original clocks and those trained with the Elastic Net on the same Japanese data. Transfer Elastic Net can also be applied to develop epigenetic clocks for other specific populations, and is expected to be applied in various fields.
MSC:
92B15; 62J07; 62P10
1. Introduction
The epigenetic clock is a regression model that calculates the biological age of an individual based on DNA methylation patterns [1]. DNA methylation, an epigenetic modification, involves the binding of a methyl group to the cytosine base of a DNA molecule. The epigenetic clock specifically focuses on methylation at the guanine–cytosine base pairs (CpG sites; CpGs), which are inherited during cell division. Although DNA methylation does not alter the DNA sequence itself, it regulates gene expression and is influenced by a variety of genetic factors, environmental factors, and aging [2,3,4,5]. In particular, DNA methylation patterns have been shown to change with age. An analysis of 476,366 CpGs revealed that the methylation level at about 29% of CpGs correlated with age, where approximately 40% of these CpGs become hypermethylated with aging and the remainder become hypomethylated [6]. This relationship allows us to evaluate age from DNA methylation information. The biological age predicted by the epigenetic clock has gained more and more attention in clinical medicine as an important aging indicator. For instance, it can assess the risk of age-related diseases and serve as an endpoint in clinical trials for anti-aging interventions. Various epigenetic clocks have been developed, differing in the tissue source of the biopsy and the statistical methods used to construct the model, such as Hannum’s clock, Zhang’s clock, and Alfonso’s clock [7,8,9]. While these clocks are trained to predict chronological age (first-generation clocks), others, like Levine’s PhenoAge and Lu’s GrimAge, incorporate adjusted age considering age-related risk factors for death (second-generation clocks) [10,11,12].
The epigenetic clock is typically developed as a linear regression model with the measured DNA methylation ratio of CpGs as the explanatory variable and chronological age as the target variable. Given a large number of measured CpGs relative to the sample size, typically ranging from tens to hundreds of thousands, estimating regression coefficient parameters using ordinary least squares or maximum likelihood estimation becomes challenging. Consequently, regularization methods are often used to construct epigenetic clocks. Assuming that only a fraction of the CpGs contribute to age prediction, the Elastic Net, a sparse estimation approach, has become the standard method for developing epigenetic clocks [13]. Similar to the least absolute shrinkage and selection operator (Lasso), the Elastic Net promotes parameter sparsity by adding a penalty term based on the norm of the parameters to the log-likelihood function [14]. This feature allows CpGs that strongly predict age to be automatically selected and included in the model. The Elastic Net applies an additional -norm penalty, which induces several advantageous properties to the estimator. While Lasso is limited in the number of variables it can select, which is bound by the smaller of the sample size or parameter dimensions, the Elastic Net faces no such limitation. Moreover, the Elastic Net can manage highly correlated explanatory variables through its grouping effect, which states that regression coefficients of strongly correlated variables have small differences [15]. Given that the number of CpGs that significantly contribute to age prediction is typically unknown and may be strongly correlated, while the upper limit on the number of candidate CpGs depends on the measurement array, it is preferable to use a method that imposes no limits on the number of CpGs included in the model and effectively handles correlated variables. Therefore, the Elastic Net approach is a reasonable choice for the development of epigenetic clocks.
Instead of using DNA methylation ratios of CpGs as explanatory variables, recent proposals have suggested using variables transformed through principal component analysis (PCA) to estimate more reliable clocks [16]. PCA is a method that identifies orthogonal basis vectors, called principal components, from a data matrix, capturing more information with fewer dimensions. The transformation helps reduce technical noise introduced to explanatory variables during sample preparation and measurement. Ref. [16] re-estimated several epigenetic clocks: Horvath, Hannum, Levine (PhenoAge), Telomere length (DNAmTL), and GrimAge, based on PCA-transformed DNA methylation ratios, and reported that the prediction performances were comparable to or better than those of the original clocks [1,7,10,11,16,17,18]. These epigenetic clocks developed using PCA-transformed explanatory variables are referred to as PC clocks in this study.
Although many distinct epigenetic clocks have been developed, most have not been tailored to specific racial populations. Epigenetic status can be influenced by genetic or environmental factors in a particular population, potentially introducing biases in existing clocks when applied to them. To develop a biological age model that performs better for a specific population, it is necessary to collect DNA methylation data from that population [19]. Large sample sizes are required due to the high dimensionality of the data; for example, the PC clocks in [16] were trained using data from thousands of individuals. However, collecting such large sample sizes is challenging due to the high costs and time requirements. To address this issue, we considered using a transfer learning approach [20]. Transfer learning enables the development of models from the data with a relatively small sample size by using information from related data or models from other populations. Therefore, in this study, we proposed a new transfer learning method that uses the parameter information of a model trained with the Elastic Net.
This study also focused on developing epigenetic clocks for the Japanese population, particularly PC clocks, to obtain more reliable models. Previously, some epigenetic clocks were developed with Japanese data consisting of 421 registrants, which are designed to predict the chronological age [21]. Our study expands beyond the first-generation clock to include the development of a second-generation clock, Levine’s PhenoAge, for the Japanese population [10]. PhenoAge is a prominent second-generation clock designed to predict the adjusted age for biomarkers related to age-associated mortality.
The remainder of this paper is organized as follows: Section 2 describes the proposed transfer learning method. Section 3 explains the development processes of epigenetic clocks for the Japanese population. Section 4 presents a comparison of the performance of the original clocks, clocks trained using conventional methods, and those trained using our proposed transfer learning approach. Section 5 discusses the methodology and results. Finally, Section 6 concludes the study.
2. Transfer Learning via Regularization
Suppose we have a dataset consisting of n observations, where is the response variable and is the matrix of explanatory variables. is the vector of explanatory variables for observation i. Let represent the regression coefficient vector.
Regularization in the estimation of statistical models refers to imposing constraints on the parameters so that the estimator has certain desired properties by allowing the introduction of bias. Regularization is formulated by adding a penalty term to the objective function, such as the log-likelihood function. For example, regularization based on the norm of the parameters is known as the least absolute shrinkage and selection operator (Lasso) [14]. The Lasso estimator is defined as:
where is a tuning parameter that controls the strength of the regularization. The Lasso allows some parameters to be estimated as exactly zero. This property is called sparsity, which results in an automatic variable selection in the estimated model and prevents overfitting to high-dimensional data. When the data contain highly correlated explanatory variables, an Elastic Net, which has an additional -norm regularization term, can be used [13]. The Elastic Net estimator is defined as:
where is an additional tuning parameter that controls the ratio of -norm component in the regularization term. The Elastic Net estimator has not only sparsity but also the grouping effect, which states that the estimates of the coefficients for the highly correlated explanatory variables have small differences, which allows us to effectively deal with variable correlations [13,15]. Furthermore, while the maximum number of the variables selected through the Lasso is limited to the sample size n, the Elastic Net has no such limit. Because of these properties, most of the existing epigenetic clocks have been developed using the Elastic Net.
Transfer learning involves a suite of techniques that utilize knowledge gained from addressing one or more problems to solve another related problem. Various approaches exist based on what information is transferred and how it is conducted under the assumptions. In this study, we assumed that while we can use the parameters of the regression model, we cannot use the actual data from the source domain, and we aimed to develop a regression model in the target domain using data that share the same features as the source domain. We specifically focused on parameter transfer via regularization. We explored the use of parameter information from models estimated through sparse regularization methods in the source domain to estimate models for the related problem in the target domain. In the context of the epigenetic clock, the source domain involved a multiracial population, and the target domain was the Japanese population. Data from the source domain may not be readily available due to the need to protect subjects’ privacy. It is expected that parameter transfer from existing multiracial epigenetic clocks will enable us to develop more accurate clocks for the Japanese population.
2.1. Transfer Lasso
The Transfer Lasso was recently proposed by [22] to facilitate the transfer of parameter information from a model trained using the Lasso [14]. The estimator of the Transfer Lasso is defined as:
where represents the initial estimate obtained from the source domain. The tuning parameters and control the intensity of the regularization and the balance between the two -norm components, respectively. While the first component of the regularization term is the same as that in the traditional Lasso, the second component represents the difference between the parameters of the source and target, promoting sparsity in the changes in the target estimates from the source estimates, as well as the estimates themselves. Given that the Elastic Net, rather than the Lasso, is typically used for estimating epigenetic clocks, it is necessary to adapt the Transfer Lasso to the Elastic Net for our purposes [13].
2.2. Transfer Elastic Net
We propose a Transfer Elastic Net, which straightforwardly extends the regularization terms of the Transfer Lasso to the transfer learning of Elastic Net. The proposed estimator is defined as:
where is the initial estimate, and , , and are the tuning parameters. The additional tuning parameter, , controls the balance between the and norm components. This method effectively uses the parameter information of a model trained using the Elastic Net in the source domain to inform the learning process in the target domain.
We developed an estimation algorithm for the Transfer Elastic Net based on the coordinate descent. By partially differentiating with respect to , we obtain:
where the explanatory variable matrix without the jth vector is denoted by and the parameter vector without the jth component is denoted by . Solving the equation for yields the following updating rule:
where is the soft-threshold function:
This soft-threshold function is identical to that used in Transfer Lasso. The update rule (1) for is applied iteratively until convergence is achieved, as detailed in Algorithm 1.
| Algorithm 1 Estimation algorithm for Transfer Elastic Net |
|
3. Development of PC Clocks for the Japanese Population
We developed Horvath’s, Hannum’s, and Levine’s (PhenoAge) clock types for the Japanese population using principal component-transformed DNA methylation data: PC-Horvath, PC-Hannum, and PC-PhenoAge, respectively [1,7,10]. This section outlines the data collection and processing, as well as the model training and evaluation procedures.
3.1. Data Collection
Our target population was the healthy Japanese population in their 20s to 80s. In this study, DNA methylation and blood biomarkers were measured from the blood samples of the 194 subjects. The study population comprised 76 males and 118 females, aged 23–84 years, who were healthy Japanese and did not require regular medication or treatment at the time of sample collection.
Genomic DNA was extracted from the blood samples using the Promega Maxwell® RSC Genomic DNA Kit. The obtained genomic DNA was treated with bisulphite using the Zymo Research EZ DNA Methylation Kit, following the standard protocol provided by Illumina, Inc., San Diego, California 92122 USA (hereafter referred to as “Illumina”). The treated DNA was amplified, fragmented, and hybridized to the Illumina Infinium Methylation EPIC BeadChip, adhering to Illumina’s specified procedures (https://support.illumina.com/array/array_kits/infinium-methylationepic-beadchip-kit/documentation.html, accessed on 17 July 2024). The arrays were imaged using the Illumina iScan System set to the Illumina’s recommended scanning parameters.
Then, the nine blood biomarkers were quantified: albumin (g/L), creatinine (umol/L), serum glucose (mmol/L), C-reactive protein (mg/dL), lymphocyte percent (%), mean cell volume (fL), red cell distribution width (%), alkaline phosphatase (U/L), and white blood cell count (1000 cells/uL). One female subject with insufficiently qualified results was excluded from the study. For each of the nine biomarkers, the first quartile , third quartile , and the interquartile range were calculated. When the range of outliers was defined as less than or greater than , there were no samples with outlier biomarkers. Therefore, there were not any notable internal differences. Summary statistics of the measured characteristics of the participants are presented in Section 4.
3.2. Data Processing
Raw IDAT data from the DNA methylation array were converted to DNA methylation ratios (beta values) for each probe using the ChAMP R package (version 2.24.0). Probe selection was based on stringent criteria: high quantitative validity (p-value < 0.01 and bead counts > 5%), association with CpG sites distal to SNPs (single nucleotide polymorphisms), unique mapping (not mapped to multiple locations), and exclusion from the X and Y chromosomes. The beta values for the selected probes were normalized using the BMIQ method [23], implemented in the ChAMP R package. Additionally, batch effects due to variations in processing times were corrected using the ComBat function [24], also implemented in the ChAMP R package.
The normalized and corrected beta values were transformed through principal components according to the workflow implemented in the PC-Clocks software (https://github.com/MorganLevineLab/PC-Clocks, accessed on 17 July 2024). Due to the absence of 6024 necessary CpGs in our data for principal component transformation using the PC-Clocks software, we imputed these column-wise missing values using the mean values of the corresponding CpGs from the GSE40279 human blood dataset [7]. This imputation process was performed as the default procedure of the PC-Clocks software. Since the imputed columns have constant values, the effect of this imputation disappears in the subsequent processes. We then centered and transformed the values using the trained parameters specific to each clock prepared in the software. The transformed values were used as explanatory variables to develop more reliable models [16]. We used the first 4282 principal components for PC-Horvath, 657 for PC-Hannum, and 4505 for PC-PhenoAge, as specified in the software and documented in the previous study [16].
While the response variable for PC-Horvath and PC-Hannum was chronological age, for PC-PhenoAge, it was phenotypic age, which accounts for the variability in risk and physiological conditions among people of the same chronological age [10]. Phenotypic age was calculated for each subject using the same method as [10], incorporating chronological age and nine blood biomarkers. For the jth individual, represented by the subscript, phenotypic age (PhenotypicAge) was computed as follows:
where:
This calculation adjusts age for factors associated with aging-related mortality in NHANES III data, which are determined by the Cox proportional hazards model with regularization. Details are provided in the supplementary materials of [10,25].
3.3. Training Methods and Processes
We used the conventional Elastic Net (ENet) and the proposed Transfer Elastic Net (TENet) approaches to train the clocks. The values of the tuning parameters were determined by grid search and 5-fold cross-validation. The candidate values for the tuning parameters of TENet were , , and . For ENet, the candidate values for and were the same as for TENet. The coefficients from the original clocks (Orig) were used as the initial estimates: for TENet.
Of the 193 samples, 50 were randomly selected for the evaluation set, while the remaining 143 were used for the training set. We used the training set to determine the values of the tuning parameters and estimate the coefficients. Subsequently, we evaluated the performances of the trained models using the evaluation set.
We used Python 3.8.3 to perform the estimation process. The estimation algorithms for ENet and TENet were implemented using Numpy 1.23.3. The cross-validation procedure was conducted using scikit-learn 1.3.1 [26].
3.4. Evaluation and Comparison
We compared the performances of the three models in Table 1 for PC-Horvath, PC-Hannum, and PC-PhenoAge. The Orig models were the original clocks trained by [16] using the Elastic Net upon multiracial data. ENet and TENet models were the clocks developed in this study through the Elastic Net and Transfer Elastic Net, respectively, on Japanese data. The evaluation metrics included root mean squared error (RMSE), mean absolute error (MAE), and Pearson correlation coefficient (PCC). Each model was applied to the evaluation set, and the metrics were calculated. The relationships between predicted chronological or phenotypic age and the corresponding true values were presented through scatter plots. The number of nonzero coefficients for each combination of models was counted, and the cosine similarity between each pair of model coefficients was calculated.

Table 1.
The compared models. The Orig, ENet, and TENet models were compared for each of three types of clocks: PC-Horvath, PC-Hannum, and PC-PhenoAge.
The evaluation metrics were calculated using scikit-learn 1.3.1, and plots were created using matplotlib 3.2.2.
4. Results
4.1. Characteristics of the Subjects
Summary statistics for the characteristics of the collected samples are presented in Table 2 separately for the training and evaluation sets. The training set comprised subjects aged 25–84 years in chronological age, whereas the evaluation set included subjects aged 23–82 years. Although the proportion of females was slightly higher in the evaluation set, few statistical differences were observed between the two datasets.
Table 2.
Characteristics of the training and evaluation sets, which are randomly split for model development and evaluation, include summary statistics for each item: Mean, SD (standard deviation), Min (minimum), and Max (maximum).
4.2. Comparison Results
The evaluation results for the clocks are presented in Table 3. All clocks developed using our proposed TENet exhibited the smallest prediction errors in terms of RMSE and MAE and achieved the highest PCC values (PC-Horvath: RMSE of 3.91, MAE of 2.93, and PCC of 0.968; PC-Hannum: RMSE of 3.56, MAE of 2.86, and PCC of 0.971; PC-PhenoAge: RMSE of 7.58, MAE of 5.55, and PCC of 0.933). ENet’s performance ranked second except for the PCC in PC-PhenoAge (PC-Horvath: RMSE of 5.32, MAE of 4.16, and PCC of 0.954; PC-Hannum: RMSE of 3.96, MAE of 3.13, and PCC of 0.963; PC-PhenoAge: RMSE of 9.07, MAE of 6.82, and PCC of 0.888), while the Orig clocks typically performed the worst (PC-Horvath: RMSE of 6.60, MAE of 5.19, and PCC of 0.942; PC-Hannum: RMSE of 10.43, MAE of 9.21, and PCC of 0.957; PC-PhenoAge: RMSE of 9.19, MAE of 7.26, and PCC of 0.921).
Table 3.
Prediction performance of the original and developed models for each PC clock, evaluated using the following metrics: RMSE (root mean squared error), MAE (mean absolute error), and PCC (Pearson correlation coefficient).
The predicted chronological or phenotypic ages versus the true values in the evaluation set are plotted in Figure 1. For all PC clocks, Orig tended to overestimate the age of relatively young subjects. From the results of ENet, we observed that this bias was reduced when training with Japanese data. TENet further reduced both the bias and the variance around the true values.
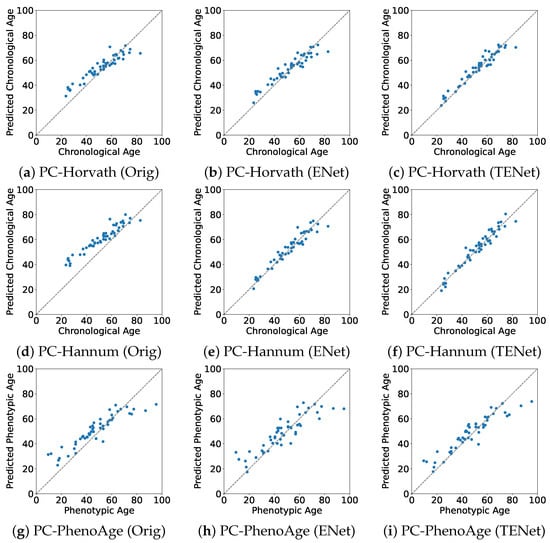
Figure 1.
True vs. predicted values of age in the evaluation set. Orig: the original PC clocks developed by the Elastic Net on multiracial data; ENet: the PC clocks developed by the Elastic Net on Japanese data; TENet: the PC clocks developed by the Transfer Elastic Net on Japanese data. (a) Orig of PC-Horvath; (b) ENet of PC-Horvath; (c) TENet of PC-Horvath; (d) Orig of PC-Hannum; (e) ENet of PC-Hannum; (f) TENet of PC-Hannum; (g) Orig of PC-PhenoAge; (h) ENetof PC-PhenoAge; (i) TENet of PC-PhenoAge.
The number of nonzero elements, the number of common nonzero elements for combinations, and the cosine similarity of the estimated coefficients (excluding the intercept) were calculated and are shown in Table 4. For PC-Horvath, the counts of nonzero elements for the Orig and TENet were both 120. For ENet, it was 4282, indicating that all the variables were selected in the estimated model. The combination of the Orig and TENet showed 120 overlapping nonzero elements and a higher cosine similarity than the combinations of the Orig and ENet, and TENet and ENet (0.828 for Orig and TENet, 0.589 for Orig and ENet, and 0.500 for TENet and ENet). For PC-Hannum and PC-PhenoAge, similar values were observed concerning the number of nonzero elements for the original and TENet (PC-Hannum: 389 for Orig, 390 for TENet, with 389 in common; PC-PhenoAge: 651 for Orig, 652 for TENet, with 651 in common), and the similarity of the coefficients (PC-Hannum: 0.795 for Orig and TENet, 0.683 for Orig and ENet, and 0.403 for TENet and ENet; PC-PhenoAge: 0.960 for Orig and TENet, 0.464 for Orig and ENet, and 0.366 for TENet and ENet). However, the number of nonzero elements for ENet’s coefficients was relatively small (PC-Hannum: 44; PC-PhenoAge: 20).
Table 4.
Number of non-zero coefficients and similarity of coefficients from the trained models. ‘Non-Zeros’ refers to the number of non-zero coefficients of each single model. ‘Common Non-Zeros’ is the number of non-zero coefficients shared in each pair or triplet. ‘Cosine Similarity’ measures the similarity of each pair.
5. Discussion
From the results, PC clocks for the Japanese population developed via the proposed transfer learning approach consistently performed better than the original clocks and the clocks developed using the conventional approach. For all the clocks we developed, the parameters estimated via the Transfer Elastic Net were sparse and more similar to the parameters in the original models than those estimated with the standard Elastic Net. These results are consistent with the expected behavior of the Transfer Elastic Net, thereby supporting the efficacy of the proposed method.
Our results also showed that the prediction bias in younger Japanese groups observed in the original clocks was corrected when models were trained using Japanese data. However, due to the small sample size of the training dataset, the prediction variance of the standard Elastic Net approach was higher than that of the transfer learning approach. Furthermore, in the estimation using the conventional Elastic Net method, while all candidate variables were selected for PC-Horvath, only a very small number of variables were selected for PC-Hannum and PC-PhenoAge, indicating instability in the estimation processes. Our proposed approach, the Transfer Elastic Net, addresses these issues by estimating parameters to be close to zero or to the parameters of the source models using the Japanese population dataset.
Table 4 shows the high similarity of the TENet and Orig for each type of clock. This means that the TENet borrows information from the original clock, which has good generalizability in the multiracial population. The advantage of borrowing information from the original clocks through the Transfer Elastic Net may be more significant in data with smaller sample sizes in terms of preventing overfitting. Furthermore, the TENet achieved higher accuracy by taking into account the characteristics of DNA methylation specific to the Japanese population via the principal components. If the sample size is larger, TENet is expected to exhibit higher accuracy since there is more information about the Japanese population. These properties of the proposed method are expected to be useful when developing epigenetic clocks for other specific populations.
Past studies have reported racial differences in DNA methylation patterns [27,28,29]. The difference in prediction performance between the epigenetic clocks developed in this study and the original clocks may be due to such differences. However, further research is needed to reveal the specific epigenetic characteristics of the Japanese population that cause the difference in age-prediction performance.
Due to the differences in DNA methylation measurement methods, the existing epigenetic clocks for the Japanese population in [21] cannot be directly applied to our data. The targeted bisulfite sequencing they used to measure DNA methylation and our microarray measurements may produce different distributions and noise levels [30]. Similarly, our clocks cannot be directly validated with their data. Thus, we cannot directly compare our clocks with theirs. However, through the proposed transfer learning approach, we successfully developed epigenetic clocks that achieved comparable Pearson’s correlation coefficients in the evaluation set (about 0.94 to 0.97 in their results), using about half the sample size as in [21]. Moreover, PC-PhenoAge for the Japanese population is the first second-generation clock for the population to our knowledge. Therefore, our results remain significant.
Although our focus was on PC clocks in this study, it is also feasible to perform transfer learning using DNA methylation data without transformation. One potential advantage of using the raw methylation ratio of CpGs is the inclusion of the DNA methylation ratio of CpGs not measured in the source domain as additional candidate explanatory variables. Then, it may be possible to explore genetic factors associated with aging based on information about the selected CpGs, which is difficult in the case of PC clocks. However, the estimation may not be stable, due to the high dimensionality of the explanatory variables.
Epigenetic clocks have been used in aging research to assess the rate of biological aging, estimate the association between exposure and aging, and evaluate the anti-aging effects of treatments [31,32,33]. It has also been suggested that the epigenetic clock is a remarkable biomarker associated with the risk of various diseases [34,35,36]. The Japanese epigenetic clocks developed in this study are expected to contribute to the refinement of such aging studies within the Japanese population.
There are many other areas of bioinformatics research, where collecting a large sample size is challenging due to the high costs or rarity of the samples. When using sparse regularization approaches for the development of prediction or discrimination models, such as models predicting phenotypes from gene expression and models discriminating outcomes from metabolome, even if the sample size available in the target domain is small, our proposed transfer learning approach may allow us to develop better-performing models if a related model in the source domain is available. As the Transfer Elastic Net is a general method for parameter transfer of Elastic Net, its application is not limited to bioinformatics and has potential applications in various fields.
In this study, we assumed that data in the source domain were not available; however, the coefficients of the regression models were available. Therefore, we considered a parameter-transfer approach. Other transfer learning approaches for Elastic Net may be applicable if data in the source domain are available [37,38].
The Elastic Net has some advantages over the Lasso, including the grouping effect [13,15]. The grouping effect states that the coefficients of highly correlated explanatory variables have small differences, resulting in these variables being included or excluded from the estimated model simultaneously. Further investigation is required to determine whether Transfer Elastic Net exhibits similar properties. In addition, there are many variations in sparse regularization methods. For example, some approaches use non-convex regularization terms to reduce the shrinkage toward zero of coefficients remaining in the estimated model, such as bridge penalty, smoothly clipped absolute deviation (SCAD), and minimax concave penalty (MCP) [39,40,41]. Developing parameter transfer methods for these non-convex regularization methods will be completed as future work.
6. Conclusions
In conclusion, we proposed Transfer Elastic Net as a parameter transfer approach for Elastic Net, and we developed principal component-based epigenetic clocks for the Japanese population using the proposed method. Our results demonstrate that these epigenetic clocks perform better than the original clocks or those trained using conventional Elastic Net. Our proposed transfer learning approach can be used to develop epigenetic clocks for other specific populations and may be further applied to other bioinformatics and various fields to develop prediction models with relatively small sample sizes for the dimensions of the variables.
Author Contributions
Conceptualization: Y.T. and R.N.; data collection: R.N.; statistical methodology: Y.T.; data processing and analysis: Y.T. and R.N.; discussion about the results: Y.T. and R.N.; writing—original draft: Y.T.; writing—review and editing: Y.T. and R.N. All authors have read and agreed to the published version of the manuscript.
Funding
This research was funded by Rhelixa, Inc.
Data Availability Statement
The sets of estimated coefficients of the PC clocks developed in this study will be accessible in the same public repository on GitHub (https://github.com/t-yui/TransferENet-EpigeneticClock accessed on 17 July 2024) upon acceptance of this manuscript. Individual-level data will be made available upon reasonable request to the authors.
Acknowledgments
We extend our deepest gratitude to Tomoyuki Matsuno and Asuka Kubo of Rhelixa Inc., who facilitated the acquisition of the critical dataset for this study through diligent coordination with Y’s Science Clinic. We are profoundly thankful to Sawako Hibino, whose efforts in collecting Japanese blood samples formed the foundation of our data. Additionally, we wish to express our appreciation to Genki Yoshikawa, who processed the raw data from the DNA methylation array to generate the methylation rate data essential for conducting the development of our clocks. The contributions of these individuals were indispensable to the achievements of this study.
Conflicts of Interest
This work was funded by Rhelixa, Inc. Y.T. served as a technical advisor in statistical science from April 2021 to March 2024. R.N. is the founder and the chief executive officer.
References
- Horvath, S. DNA Methylation Age of Human Tissues and Cell Types. Genome Biol. 2013, 14, 3156. [Google Scholar] [CrossRef] [PubMed]
- Moore, L.D.; Le, T.; Fan, G. DNA methylation and its basic function. Neuropsychopharmacology 2013, 38, 23–38. [Google Scholar] [CrossRef] [PubMed]
- Bell, J.T.; Pai, A.A.; Pickrell, J.K.; Gaffney, D.J.; Pique-Regi, R.; Degner, J.F.; Gilad, Y.; Pritchard, J.K. DNA methylation patterns associate with genetic and gene expression variation in HapMap cell lines. Genome Biol. 2011, 12, R10. [Google Scholar] [CrossRef]
- Martin, E.M.; Fry, R.C. Environmental influences on the epigenome: Exposure-associated DNA methylation in human populations. Annu. Rev. Public Health 2018, 39, 309–333. [Google Scholar] [CrossRef] [PubMed]
- Jones, M.J.; Goodman, S.J.; Kobor, M.S. DNA methylation and healthy human aging. Aging Cell 2015, 14, 924–932. [Google Scholar] [CrossRef]
- Johansson, Å.; Enroth, S.; Gyllensten, U. Continuous aging of the human DNA methylome throughout the human lifespan. PLoS ONE 2013, 8, e67378. [Google Scholar] [CrossRef]
- Hannum, G.; Guinney, J.; Zhao, L.; Zhang, L.; Hughes, G.; Sadda, S.; Klotzle, B.; Bibikova, M.; Fan, J.B.; Gao, Y.; et al. Genome-wide methylation profiles reveal quantitative views of human aging rates. Mol. Cell 2013, 49, 359–367. [Google Scholar] [CrossRef]
- Zhang, Q.; Vallerga, C.L.; Walker, R.M.; Lin, T.; Henders, A.K.; Montgomery, G.W.; He, J.; Fan, D.; Fowdar, J.; Kennedy, M.; et al. Improved precision of epigenetic clock estimates across tissues and its implication for biological ageing. Genome Med. 2019, 11, 54. [Google Scholar] [CrossRef]
- Alfonso, G.; Gonzalez, J.R. Bayesian neural networks for the optimisation of biological clocks in humans. bioRxiv 2020. [Google Scholar] [CrossRef]
- Levine, M.E.; Lu, A.T.; Quach, A.; Chen, B.H.; Assimes, T.L.; Bandinelli, S.; Hou, L.; Baccarelli, A.A.; Stewart, J.D.; Li, Y.; et al. An epigenetic biomarker of aging for lifespan and healthspan. Aging 2018, 10, 573. [Google Scholar] [CrossRef]
- Lu, A.T.; Quach, A.; Wilson, J.G.; Reiner, A.P.; Aviv, A.; Raj, K.; Hou, L.; Baccarelli, A.A.; Li, Y.; Stewart, J.D.; et al. DNA methylation GrimAge strongly predicts lifespan and healthspan. Aging 2019, 11, 303. [Google Scholar] [CrossRef] [PubMed]
- Lu, A.T.; Binder, A.M.; Zhang, J.; Yan, Q.; Reiner, A.P.; Cox, S.R.; Corley, J.; Harris, S.E.; Kuo, P.L.; Moore, A.Z.; et al. DNA methylation GrimAge version 2. Aging 2022, 14, 9484. [Google Scholar] [CrossRef] [PubMed]
- Zou, H.; Hastie, T. Regularization and variable selection via the elastic net. J. R. Stat. Soc. Ser. B Stat. Methodol. 2005, 67, 301–320. [Google Scholar] [CrossRef]
- Tibshirani, R. Regression shrinkage and selection via the lasso. J. R. Stat. Soc. Ser. B Stat. Methodol. 1996, 58, 267–288. [Google Scholar] [CrossRef]
- Zhou, D.X. On grouping effect of elastic net. Stat. Probab. Lett. 2013, 83, 2108–2112. [Google Scholar] [CrossRef]
- Higgins-Chen, A.T.; Thrush, K.L.; Wang, Y.; Minteer, C.J.; Kuo, P.L.; Wang, M.; Niimi, P.; Sturm, G.; Lin, J.; Moore, A.Z.; et al. A computational solution for bolstering reliability of epigenetic clocks: Implications for clinical trials and longitudinal tracking. Nat. Aging 2022, 2, 644–661. [Google Scholar] [CrossRef]
- Horvath, S.; Raj, K. DNA methylation-based biomarkers and the epigenetic clock theory of ageing. Nat. Rev. Genet. 2018, 19, 371–384. [Google Scholar] [CrossRef]
- Lu, A.T.; Seeboth, A.; Tsai, P.C.; Sun, D.; Quach, A.; Reiner, A.P.; Kooperberg, C.; Ferrucci, L.; Hou, L.; Baccarelli, A.A.; et al. DNA methylation-based estimator of telomere length. Aging 2019, 11, 5895. [Google Scholar] [CrossRef]
- Hicken, M.T.; Dou, J.; Kershaw, K.N.; Liu, Y.; Hajat, A.; Bakulski, K.M. Racial and Ethnic Residential Segregation and Monocyte DNA Methylation Age Acceleration. JAMA Netw. Open 2023, 6, e2344722. [Google Scholar] [CrossRef]
- Yang, Q.; Zhang, Y.; Dai, W.; Pan, S.J. Transfer Learning; Cambridge University Press: Cambridge, UK, 2020. [Google Scholar]
- Komaki, S.; Nagata, M.; Arai, E.; Otomo, R.; Ono, K.; Abe, Y.; Ohmomo, H.; Umekage, S.; Shinozaki, N.O.; Hachiya, T.; et al. Epigenetic profile of Japanese supercentenarians: A cross-sectional study. Lancet Healthy Longev. 2023, 4, e83–e90. [Google Scholar] [CrossRef]
- Takada, M.; Fujisawa, H. Transfer Learning via ℓ1 Regularization. Adv. Neural Inf. Process. Syst. 2020, 33, 14266–14277. [Google Scholar]
- Teschendorff, A.E.; Marabita, F.; Lechner, M.; Bartlett, T.; Tegner, J.; Gomez-Cabrero, D.; Beck, S. A beta-mixture quantile normalization method for correcting probe design bias in Illumina Infinium 450 k DNA methylation data. Bioinformatics 2013, 29, 189–196. [Google Scholar] [CrossRef]
- Johnson, W.E.; Li, C.; Rabinovic, A. Adjusting batch effects in microarray expression data using empirical Bayes methods. Biostatistics 2007, 8, 118–127. [Google Scholar] [CrossRef] [PubMed]
- Lee, E.T.; Wang, J. Statistical Methods for Survival Data Analysis; John Wiley & Sons: Hoboken, NJ, USA, 2003; Volume 476. [Google Scholar]
- Pedregosa, F.; Varoquaux, G.; Gramfort, A.; Michel, V.; Thirion, B.; Grisel, O.; Blondel, M.; Prettenhofer, P.; Weiss, R.; Dubourg, V.; et al. Scikit-learn: Machine Learning in Python. J. Mach. Learn. Res. 2011, 12, 2825–2830. [Google Scholar]
- Adkins, R.M.; Krushkal, J.; Tylavsky, F.A.; Thomas, F. Racial differences in gene-specific DNA methylation levels are present at birth. Birth Defects Res. Part A Clin. Mol. Teratol. 2011, 91, 728–736. [Google Scholar] [CrossRef]
- Xia, Y.Y.; Ding, Y.B.; Liu, X.Q.; Chen, X.M.; Cheng, S.Q.; Li, L.B.; Ma, M.F.; He, J.L.; Wang, Y.X. Racial/ethnic disparities in human DNA methylation. Biochim. Biophys. Acta (BBA)-Rev. Cancer 2014, 1846, 258–262. [Google Scholar] [CrossRef] [PubMed]
- Kader, F.; Ghai, M. DNA methylation-based variation between human populations. Mol. Genet. Genom. 2017, 292, 5–35. [Google Scholar] [CrossRef] [PubMed]
- Heiss, J.A.; Brennan, K.J.; Baccarelli, A.A.; Téllez-Rojo, M.M.; Estrada-Gutiérrez, G.; Wright, R.O.; Just, A.C. Battle of epigenetic proportions: Comparing Illumina’s EPIC methylation microarrays and TruSeq targeted bisulfite sequencing. Epigenetics 2020, 15, 174–182. [Google Scholar] [CrossRef]
- Fiorito, G.; Caini, S.; Palli, D.; Bendinelli, B.; Saieva, C.; Ermini, I.; Valentini, V.; Assedi, M.; Rizzolo, P.; Ambrogetti, D.; et al. DNA methylation-based biomarkers of aging were slowed down in a two-year diet and physical activity intervention trial: The DAMA study. Aging Cell 2021, 20, e13439. [Google Scholar] [CrossRef]
- Tang, X.; Gonzalez-Latapi, P.; Marras, C.; Visanji, N.P.; Yang, W.; Sato, C.; Lang, A.E.; Rogaeva, E.; Zhang, M. Epigenetic clock acceleration is linked to age at onset of parkinson’s disease. Mov. Disord. 2022, 37, 1831–1840. [Google Scholar] [CrossRef]
- Esteban-Cantos, A.; Rodríguez-Centeno, J.; Barruz, P.; Alejos, B.; Saiz-Medrano, G.; Nevado, J.; Martin, A.; Gayá, F.; De Miguel, R.; Bernardino, J.I.; et al. Epigenetic age acceleration changes 2 years after antiretroviral therapy initiation in adults with HIV: A substudy of the NEAT001/ANRS143 randomised trial. Lancet HIV 2021, 8, e197–e205. [Google Scholar] [CrossRef] [PubMed]
- Roberts, J.D.; Vittinghoff, E.; Lu, A.T.; Alonso, A.; Wang, B.; Sitlani, C.M.; Mohammadi-Shemirani, P.; Fornage, M.; Kornej, J.; Brody, J.A.; et al. Epigenetic age and the risk of incident atrial fibrillation. Circulation 2021, 144, 1899–1911. [Google Scholar] [CrossRef]
- Kresovich, J.K.; Xu, Z.; O’Brien, K.M.; Weinberg, C.R.; Sandler, D.P.; Taylor, J.A. Methylation-based biological age and breast cancer risk. JNCI J. Natl. Cancer Inst. 2019, 111, 1051–1058. [Google Scholar] [CrossRef]
- Zhang, M.; McKeever, P.M.; Xi, Z.; Moreno, D.; Sato, C.; Bergsma, T.; McGoldrick, P.; Keith, J.; Robertson, J.; Zinman, L.; et al. DNA methylation age acceleration is associated with ALS age of onset and survival. Acta Neuropathol. 2020, 139, 943–946. [Google Scholar] [CrossRef] [PubMed]
- Li, Y.; Vinzamuri, B.; Reddy, C.K. Constrained elastic net based knowledge transfer for healthcare information exchange. Data Min. Knowl. Discov. 2015, 29, 1094–1112. [Google Scholar] [CrossRef]
- Handl, L.; Jalali, A.; Scherer, M.; Eggeling, R.; Pfeifer, N. Weighted elastic net for unsupervised domain adaptation with application to age prediction from DNA methylation data. Bioinformatics 2019, 35, i154–i163. [Google Scholar] [CrossRef] [PubMed]
- Frank, L.E.; Friedman, J.H. A statistical view of some chemometrics regression tools. Technometrics 1993, 35, 109–135. [Google Scholar] [CrossRef]
- Fan, J.; Li, R. Variable selection via nonconcave penalized likelihood and its oracle properties. J. Am. Stat. Assoc. 2001, 96, 1348–1360. [Google Scholar] [CrossRef]
- Zhang, C.H. Nearly unbiased variable selection under minimax concave penalty. Ann. Stat. 2010, 38, 894–942. [Google Scholar] [CrossRef]
Disclaimer/Publisher’s Note: The statements, opinions and data contained in all publications are solely those of the individual author(s) and contributor(s) and not of MDPI and/or the editor(s). MDPI and/or the editor(s) disclaim responsibility for any injury to people or property resulting from any ideas, methods, instructions or products referred to in the content. |
© 2024 by the authors. Licensee MDPI, Basel, Switzerland. This article is an open access article distributed under the terms and conditions of the Creative Commons Attribution (CC BY) license (https://creativecommons.org/licenses/by/4.0/).